A Comprehensive Guide to the Gold Price
←
→
Page content transcription
If your browser does not render page correctly, please read the page content below
A Comprehensive Guide to the Gold Price
A Comprehensive Guide to the Gold Price

Table of Contents ______________________

Introduction ..................................................................................................................... 2
The Global Gold Market ............................................................................................... 3
   The Over-the-Counter Spot Market ............................................................................ 4
   The London Gold Fix ................................................................................................... 5
   Futures Market Gold Prices.......................................................................................... 7
Where is the Gold Price Established? ....................................................................... 8
   Gold Price Ratios ......................................................................................................... 10
   Determinants of the Gold Price................................................................................. 14
   The Components of Demand and Supply ................................................................ 14
   The Factors Behind Demand and Supply................................................................. 15
   The Gold Price and Inflation ..................................................................................... 16
The History of the US Dollar Gold Price ............................................................... 18
   The 1934 Repricing to $35 Per Ounce ...................................................................... 20
   Defending $35 Per Ounce .......................................................................................... 20
   The Two-Tier Market .................................................................................................. 21
   The Floating Exchange Era ........................................................................................ 22
Conclusion ...................................................................................................................... 25

© 2013 GoldCore                                                                                                                        1
A Comprehensive Guide to the Gold Price

Introduction____________________________

T     he gold price is one of the world’s most closely watched financial indicators. It
      is widely quoted in financial media alongside major currency exchange rates,
major stock market indices, sovereign bond yields and the oil price.

Although gold's daily price is familiar to precious metal owners and many market
participants, it is not well known by the general public internationally as it is not
reported widely in the non-specialist financial media.

Gold is used as a hedge against fluctuations in and the devaluation of currencies,
particularly the U.S. dollar. There is a mistaken belief that gold is "quoted in dollars."
This is not the case as gold is quoted in local currency terms throughout the world.
The London AM and PM Fix prices are in U.S. dollars, British pounds and euros.

Given the importance of US markets and the dollar as the           The gold price is
world’s current sole reserve currency, traders most                one of the world’s
frequently quote the US dollar price and for simplicity and        most closely
ease financial media tend to quote the dollar price of gold.
                                                                   watched financial
While the daily price of gold is known by market                indicators.
participants and observers, what is less widely understood
is how the gold price is determined and derived, where the price is sourced from,
and how the contemporary nominal gold price compares to historical prices and
importantly, to the price of gold adjusted for inflation.

© 2013 GoldCore                                                                         2
A Comprehensive Guide to the Gold Price

The Global Gold Market _______________

G      old is traded globally on a 24 hour basis. Since trading hours of gold
       markets around the world overlap, live gold prices are readily available at all
times during the business week from late Sunday night to Friday evening GMT.

The current price is known as the spot price and is a price at which gold could be
bought or sold in large volume for immediate delivery. The futures price is the
price at which delivery could take place at a specific date in the future. Spot and
futures prices are related with futures prices normally greater than spot prices. If a
spot price is not available at a particular time it can be derived by discounting an
actively traded near term futures price.

The larger the market, the more liquid it will be in facilitating trading and the more
important it will be in terms of influencing the gold price. Some markets therefore
are dominant in price discovery, in other words, setting the price. Other markets
will use the current world price and are known as price takers.

The global over-the-counter (OTC) market is the largest gold market in terms of
trading volume and is important in terms of setting prices. Trading on the OTC
market is global and is undertaken directly between
participants via phone and electronic trading platforms
and not on an organised exchange.

Gold is also traded on organised exchanges, including futures
exchanges such as the CME Comex in New York, and physical
gold exchanges such as the Istanbul Gold Exchange. Some of the
futures exchanges, notably the Comex, generate high trading
volumes and contribute significantly to price discovery.

© 2013 GoldCore                                                                          3
A Comprehensive Guide to the Gold Price

The Over-the-Counter Spot Market1
Although the OTC gold market is global, most of the trading takes place in the
main financial centres of London, Zurich and New York with nearly all trades
clearing through London. Additional OTC trading takes place in Sydney and Hong
Kong. During trading hours market makers in the major centres quote continuous
two way bid-offer quotations for spot gold as well as forward (future dated)
transactions.

If, for example, the spot price is quoted as $1509.50-$1510.00,
major customers of market makers would be able to buy at
$1,510.00 and sell at $1,509.50. Spreads between bid and offer
are very narrow in the OTC market due to high liquidity and
high trading volumes. In practice, only large entities trade on the
OTC market, such as mining companies, central banks, large
jewellery manufacturers, institutional investors and ultra-high
net worth individuals.

The pricing unit quoted by OTC market makers is the price for 1 troy fine ounce
of gold, and is quoted in US dollars due to market convention. All references to
ounces in the bullion market refer to troy ounces and never the common or
avoirdupois ounce.2 The OTC spot market price quote is for a standard dealing
amount of between 5,000 and 10,000 ounces of gold, deliverable in London in
Good Delivery bars.

1   http://www.lppm.com/otcguide.pdf

2. A troy ounce is defined as 31.1034768 grams that is why, with 1000 grams in one kilogram, a kilogram of gold contains approximately
32.15 troy ounces.

© 2013 GoldCore                                                                                                                          4
A Comprehensive Guide to the Gold Price

This delivery unit is a bar specification that is defined and regulated by the
industry’s trade association, the LBMA. A Good Delivery Bar has a minimum fine
gold content of 995 parts per thousand, usually referred to as a fineness of 995.0,
and must contain between 350 and 430 ounces of pure gold.

The concept of delivery in London is known as loco London, loco signifying
location. All gold trades conducted in the LBMA system are cleared through the
clearing members of the London Gold Market through a book entry clearing
system known as AURUM. The vast majority of gold trades cleared in London are
not based on delivery of physical gold but represent unallocated account balance
transfers between participants.

The London Gold Fix
The London Gold Fix is a gold pricing and trading exercise
conducted twice a day by five of the market making members
of the LBMA to determine a single trading price for all orders
of the five participants and their clients.

The current members of the fixing process, HSBC, Barclays Capital, ScotiaBank,
Deutsche Bank and Société Générale, conduct the fix through a company called
The London Gold Market Fixing Ltd.

                  The gold fixing began in 1919 after the Bank of England
                  negotiated a deal to market South Africa’s gold output and sell it
                  through NM Rothschild in London at a price agreed by the main
                  London market brokers. Rothschild was the permanent chair of
                  the Fix until it exited the gold trading business in 2004. Now the
                  chairmanship of the fix rotates through the five member firms
                  annually. There are two daily gold fixings, one at 10.30am and the

© 2013 GoldCore                                                                        5
A Comprehensive Guide to the Gold Price

second at 3pm. The afternoon fix was originally added when the London Gold
Market reopened in March 1968.

The Chairman of the fix selects an opening price based on the prevailing market
price and this price is communicated to all potential customers via the five member
firms. All customer orders of a member are netted off and each member
announces themselves as either a buyer or a seller and state the volume of gold
they wish to buy or sell. Customers can remain in contact with the member trading
desk during the fixing and can amend or cancel orders in real time.

There can be a large pyramid of orders at different prices in each member’s trading
book, but this can net out to a relatively small volume. The price is moved until the
buyers and sellers match within a total of 50 bars (or 20,000 ozs.) All trades are
then executed at the common fixing price. The fixing facilitates huge volumes of
anonymous trading and the spreads are very low due to high liquidity. The fixing
price is then distributed out to the market and is quoted in US Dollars, British
Pounds and Euros.

As well as facilitating trading, the gold fixing process          There are two daily
discovers a benchmark price which is used daily as a              gold fixings, one at
reference price for pricing a large number of commercial          10.30am and the
gold products, such as gold derivatives, ETFs and
                                                                  second at 3pm.
structured products, and as a valuation point for central
bank reserve portfolios and institutional investor portfolios. As a reference price, the
afternoon gold fixing price is thought to be the more widely used of the two fixes.

© 2013 GoldCore                                                                         6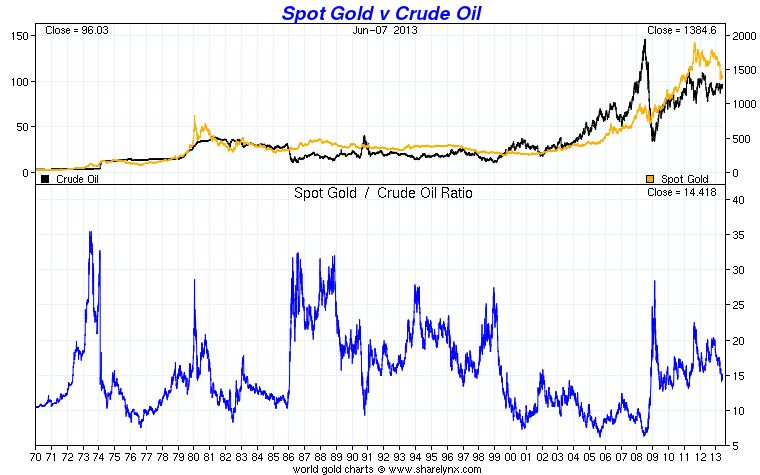
A Comprehensive Guide to the Gold Price

Futures Market Gold Prices ____________

T      he most important venue for trading gold futures is the CME Group’s
       Comex futures exchange in New York. Gold futures trading started in 1974
after the US government lifted the ban on citizen gold ownership. Comex trading
is done in a trading pit via open outcry followed by after-hours via an electronic
platform called CME Globex. On Comex, the active contract months for gold
futures are February, April, June, August and September.

Futures trading rarely results in physical delivery of metal, because the majority of
trades are undertaken for hedging and speculation. However, physical delivery is
possible, and the exchange maintains a number of depositories to store physical
metal for delivery.

The Comex also publishes a daily spot settlement
price for gold based on an end of session average
price of the most active month’s futures contract3.
Some other futures exchanges around the world which trade gold futures include
the TOCOM in Tokyo, the MCX in India, the Shanghai Futures Exchange and the
NYSE Liffe exchange in New York.

3
    http://www.cmegroup.com/market-data/files/cme-group-settlement-procedures.pdf

© 2013 GoldCore                                                                         7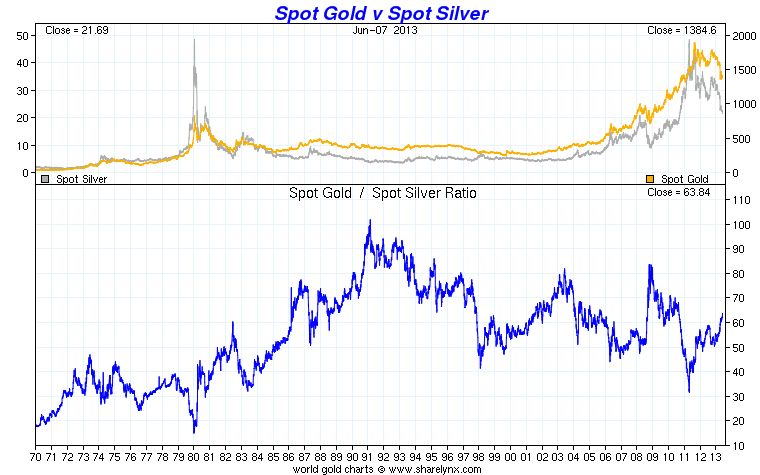
A Comprehensive Guide to the Gold Price

Where is the
Gold Price Established? ________________

I    n total there are over 40 gold markets globally in such diverse locations as
     Sydney, Tokyo, Mumbai, Istanbul, and Sao Paulo but the three main pricing
sources for the gold price are the global OTC spot price, the London Fixing price
(also part of the OTC market) and the Comex futures price. Market data shows
that the London OTC market represents nearly 87% of global gold trading
volume4, and the US futures exchanges an additional 10%.

A recent study of London fixing prices and Comex futures
prices investigated which market contributes the most to
establishing the gold price, and found that over a recent 25
year period, both markets, at different times, were
responsible for price setting, with the dominant market
switching back and forth regularly. 5 Another study looking
solely at futures markets found that Comex gold futures
dominated price discovery when compared to other futures
exchanges in Tokyo (TOCOM) and India (MCX). 6

Ninety five per cent of all trades in the OTC gold market are for gold held in
unallocated accounts at LBMA member banks.7 Unallocated accounts do not
represent ownership of gold by the account holders but merely represent a claim

4
  “Loco London Liquidity Survey”, Stewart Murray, Chief Executive, LBMA, Alchemist, Issue 63, LBMA
5
  “London or New York: Where does the gold price come from?”, Lucey, Larkin and O’Connor, Alchemist Issue 68, LBMA
6
  “Information Transmission among world Major Gold Futures Markets: Evidence from high frequency Synchronous Trading Data”,
  Fuangkasem, Chunhacchinda, and Nathaphan, August 2012
7
  http://www.lppm.com/lppm_memorandum-of-understanding.pdf

© 2013 GoldCore                                                                                                               8
A Comprehensive Guide to the Gold Price

on the bank to provide that amount of gold if the account holder so wishes. The
LBMA trading statistics therefore do not necessarily represent physical vaulted
metal being traded. Likewise, the majority of trading in gold futures on the Comex
never leads to physical delivery and trading volume is large multiples of physically
vaulted stocks.

This has led to a debate about paper gold versus physical gold, with one school of
opinion labelling the majority of OTC and Comex gold trading as paper gold. The
debate appears valid because although the LBMA backed OTC market and the
Comex are the two dominant markets for establishing gold prices, they do not
necessarily represent the supply and demand patterns of the physical markets.

This was illustrated quite forcefully in mid April 2013 when
                                                                               The majority of
very large volumes of gold futures contracts were sold into
                                                                               trading in gold
the market over a short space of time causing the largest
                                                                               futures on the
two day price drop in over 30 years. One trade alone was
valued at over $20 billion and gold futures with a value of                    Comex never leads
over 400 tonnes were sold in hours and this is equal to 15%                    to physical delivery
of annual gold mine production.                                                and trading volume
                                                                   is large multiples of
Since the Comex is one of the two dominant price setters,
                                                                   physically vaulted
the world gold price was impacted heavily. However, the
                                                                   stocks.
physical gold markets around the world responded
positively to the gold lower price via unprecedented demand, which caused huge
physical gold shortages at refineries and bullion dealers, and large price premiums
over the world spot price in retail bullion markets. 8

8   http://www.gold.org/download/pr_archive/pdf/AES_media_alert_on_demand_pr.pdf

© 2013 GoldCore                                                                              9
A Comprehensive Guide to the Gold Price
Gold Price Ratios ______________________
T echnical analysts and market strategists use the gold price in a number of well-
known ratios as an aid to determining relative valuations for real assets
independent of paper currencies and also for attempting to analyse market direction.
Chart 1
For example, in chart 1 above, comparing the gold/oil ratio to its long run average
may help signal that the oil price is over or under priced relative to gold. As we can
see in the chart above, oil and gold have followed similar trajectories since our
modern fiat monetary system began in 1971.
Today the gold/oil ratio at close to 15 is right in the middle of its long run ratio.
This has ranged from a high of over 35 during the first oil crisis in 1973 to a low of
7 in 2008 prior to the outbreak of the global financial crisis. Concerns of a global
recession and potentially a depression led to oil prices falling precipitously and gold
prices rising in value.
© 2013 GoldCore 10A Comprehensive Guide to the Gold Price
Chart 2
The gold/silver ratio, in chart 2 above, is another interesting ratio which helps
investors determine which precious metal is cheaper than the other. Gold and
silver are two very rare and finite metals and are the two precious metals that have
traditionally been used as money.
It is estimated that geologically there are less than 15 parts of silver to every one
part of gold.
This is one of the reasons that historically, monetary authorities and central banks
throughout the world, set the gold silver ratio at close to 15 to 1. This meant that
one ounce of gold could be exchanged for fifteen ounces of silver.
Today the ratio is over 60 to 1. This suggests that silver is cheap relative to gold.
This is believed to be the case given the fact that a huge amount of silver has been
consumed. Silver has been and is used in industrial production, whereas very little
gold has been consumed as most of the world’s gold is continuously recycled given
its much higher value and its continuing use as a monetary reserve.
© 2013 GoldCore 11A Comprehensive Guide to the Gold Price
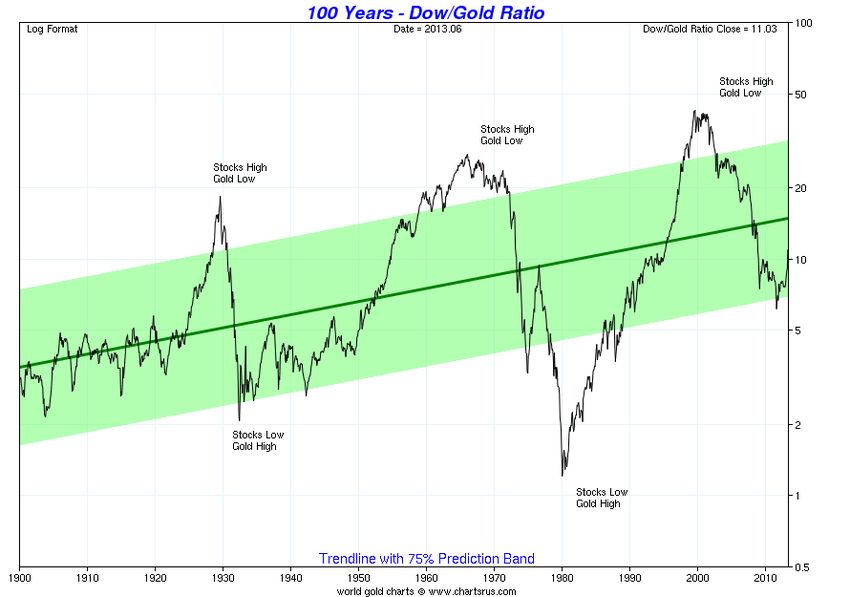
Finally, stock market indices can also be expressed in terms of gold and illustrate
relative performance, for example, the Dow/Gold ratio in chart 3 below.
Chart 3
The Dow/Gold ratio is a good indication of how stock markets are performing in
real terms and an indication of confidence and trust in financial assets.
The Dow Jones Industrial Average (DJIA) and stocks in the U.S. are seen as good
value relative to gold at levels below 5 to 1 and bottoms in the stock market and
highs in the gold price have often been seen with the Dow to Gold ratio between 1
and 2 as was seen in February 1933 (Dow/Gold Ratio of 1.94) and January 1980
(Dow/Gold Ratio 1.03).
© 2013 GoldCore 12A Comprehensive Guide to the Gold Price Bullish gold analysts believe that gold’s bull market will end with the Dow Gold Ratio below 2 to 1 again. This would see the gold price rising to roughly half the price of the Dow Jones – meaning that the DJIA could trade at 8,000 to 10,000 and gold at $4,000/oz to $5,000/oz or some other version thereof. These ratios are not guides and are merely useful indicators to be considered in conjunction with the real world fundamentals of supply and demand and other macroeconomic, systemic, geopolitical and monetary factors. © 2013 GoldCore 13
A Comprehensive Guide to the Gold Price
Determinants of the Gold Price ________
W hile the economic fundamentals of gold supply and demand have an
impact on determining the gold price, this has been shown to be only true
in the short run. In the long run the price of gold is thought to be related to
inflation expectations.
Some discussions of supply and demand concentrate heavily on quantifying the
various demand and supply components and their price elasticity, and whether
flow (annual gold supply) or stock (total gold supply) is more critical in influencing
price. Other approaches seek to explain the factors that are thought to drive
demand and supply. Both approaches are complementary.
The Components of Demand and Supply
Gold is viewed both as a monetary asset and as a
commodity. As a monetary asset it is held by the
official sector, such as in central bank reserve
portfolios, and by the private sector either
through hoarding or in investment portfolios.
Official and investment demand is driven by the
properties of gold as a store of value, as a safe
haven asset, as a currency hedge, and as a
portfolio diversifier.
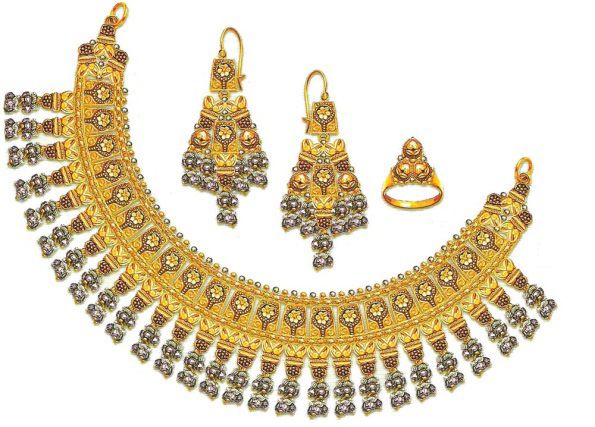
As a commodity gold is used as a raw material input by the jewellery sector and
other industries. This constitutes fabrication demand. Jewellery and other
fabrication demand is seen to be more price inelastic than investment demand
since jewellery demand is geographically diverse, and in other fabrication demand
© 2013 GoldCore 14A Comprehensive Guide to the Gold Price
such as dentistry or electronics, the cost of the gold
component relative to other inputs is relatively low.
The majority of gold ever produced is still held either in
investment form or jewellery form. This means that above
ground stocks of gold are huge compared to annual supply,
making the stock-to-flow ratio very large. Gold supply is sometimes rather
narrowly defined as annual mine supply, official sector sales and the recycling of
above ground stocks, but on a broader definition it includes any mobilisation of
existing above ground stocks such as dishoarding by investors, hedging or forward
sales by mining companies, and gold leasing by central banks.
Mine supply is relatively inelastic due to long lead times for exploration and
production, and the high capital intensity of the mining industry. But other supply
can enter the market quickly since gold is easy to trade and the global gold market
is highly liquid.
So it is possible to formulate a demand-supply equation for Gold is viewed both
gold as a way of predicting gold price changes, the only as a monetary
challenge being in quantifying the various components and asset and as a
deciding how to treat the stock and flow aspects of supply.
commodity.
An alternative perspective is to examine the underlying
drivers of the sources of demand and supply.
The Factors Behind Demand and Supply
A recent World Gold Council study investigated the factors that
determine the price of gold9. The study examined potential
long-run and short-run determinants and found that over the
9
“Short-run and Long-run Determinants of the Price of Gold” Eric Levin, Robert Wright, Research Study No 32, June 2006, WGC
© 2013 GoldCore 15A Comprehensive Guide to the Gold Price
long term, that price is influenced mainly by inflation, but that in the short term,
price fluctuations were influenced by supply and demand, which in themselves
were driven by factors such as the US dollar exchange rate, the gold lease rate,
credit risk, inflation volatility, and financial and political turmoil.
Another recent study similarly proposed that over the long run the price of gold
moves in line with inflation.10 But over the short run a number of other factors
influence the price since they either increase or reduce demand. These factors
included global income levels with the gold price rising as income levels rise, and
financial system stress which causes a flight to gold as a safe haven asset, due to its
low to negative correlation with other financial assets. Additional factors include real
interest rates which increase or lower the opportunity cost of holding gold versus
other assets, and central bank gold transactions and interactions with the market.
The Gold Price and Inflation
Since gold is rare and costly to produce, it cannot be Since gold is rare
debased and has no counterparty or default risk. Apart from
and costly to
fabrication usage, gold is produced mainly to be
produce, it cannot be
accumulated in large above ground stocks and acts as a
debased and has no
liquid store of wealth. It is therefore viewed as a trusted and
counterparty or
stable store of value.
default risk.
Since the gold stock increases very slowly it is highly stable
and the value of gold is highly stable in terms of goods. As inflation rise, gold
retains its purchasing power. This means that the purchasing power of gold is
nearly constant over long periods of time. As goods prices change, this is signalled
through currency price changes, and since gold has an exchange rate with all other
currencies, gold therefore acts as a barometer of inflation expectations.
10 “The impact of Inflation and Deflation on the Case for Gold”, Oxford Economics, July 2011
© 2013 GoldCore 16A Comprehensive Guide to the Gold Price
The ability of gold to retain its purchasing power and increase in
price in line with inflation is directly observable. A researcher
named Roy Jastram famously termed this the Golden Constant in
his well-known book of the same title 11. Taking very long periods
of gold price data and general price level data for England (1560-
1976) and the US (1800-1976), Jastram calculated an index of
gold’s purchasing power and found that it was constant over long
periods of time.
11
“The Golden Constant: The English and American Experience 1560-2007 “, by Roy W Jastram, updated by Jill Leyland. Elgar, 2009
© 2013 GoldCore 17A Comprehensive Guide to the Gold Price
The History of the
US Dollar Gold Price __________________
G old has always been highly valued and used throughout history as both a
circulating currency in the form of bullion coins, and as backing for other
currencies which were convertible into gold. The history of the gold price is a
history of the interplay between government decreed official gold prices based on
the weight of gold within a given monetary unit, and the corresponding price that
the market was willing to pay for that monetary unit. Historical gold prices are
best viewed in the context of the prevailing economic and monetary systems of
their times.
The Kingdom of Great Britain established a gold standard in
1717 on the recommendation of Sir Issac Newton, who as
Master of the Mint, specified that a pound weight of gold, 11
parts fine gold and 1 part alloy be equal to 44½ guineas. This was
equivalent to 8411/12 shillings per troy ounce, or £4 4s 11d, which
was about £4.25 per troy ounce. This official price was to remain in force for
nearly 200 years. Newton also fixed a silver to gold ratio of 16 to 1 for circulating
coins, based on accepted ratios prevalent at the time in Spain and Portugal. 12
Soon after independence, the US Congress passed the Coinage Act of 1792
creating a bimetallic gold and silver standard wherein the value of the monetary
unit, the dollar, was explicitly calculable in terms of fixed quantities of both gold
and silver. A dollar was specified as 371.25 grains of pure silver. A fixed ratio of 15
12 http://www.pierre-marteau.com/editions/1701-25-mint-reports/report-1717-09-25.html
© 2013 GoldCore 18A Comprehensive Guide to the Gold Price
to 1 was specified for converting silver to gold. 13 This gave
The 1717 official
the dollar a value of 24.75 grains of pure gold. And with 480
gold price was to
grains of gold per troy ounce, an ounce of gold was valued at
remain in force for
$19.39.
nearly 200 years.
This fixed price remained in place until 1834 when a
subsequent Coinage Act, implemented to more accurately reflect the relative
market prices between gold and silver, re-specified the value of a dollar at 23.2
grains of pure gold, thereby altering the silver-gold ratio to approximately 16 to 1
and revaluing an ounce of gold to $20.67.
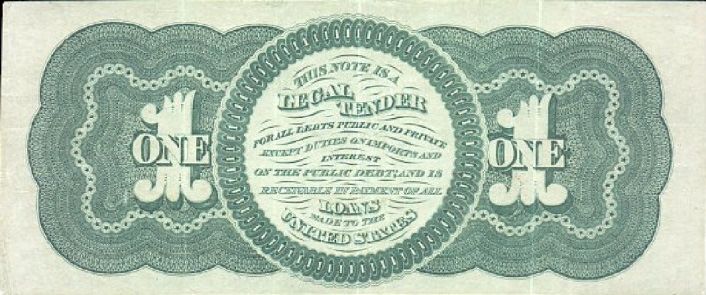
In the 1860s during the American Civil War, the
US Government pursued deficit financing and a
form of legal tender notes known as greenbacks
were issued. These notes undermined the
monetary system and were not redeemable into gold, so their value quickly
deteriorated as more were issued. This caused general price inflation and eroded
confidence in the notes, also causing corresponding spikes in the market price of
gold in terms of greenbacks to over $30 per ounce over a number of years. In 1879
the US Government reverted to a gold standard, allowing convertibility into gold
again at $20.67 per ounce, and the market price fell towards the official price.
During World War I and the interwar years when many other countries went on
and off various gold backed standards, the US maintained its gold standard and the
$20.67 official price remained unchanged. However, the advent of the Great
Depression in the early 1930s led to a significant gold price increase in US dollars
as the dollar was devalued from $20.67/oz to $35/oz.
This ended the golden era of gold price stability from 1792 through to 1933.
13 http://memory.loc.gov/cgi-bin/ampage?collId=llsl&fileName=001/llsl001.db&recNum=371
© 2013 GoldCore 19A Comprehensive Guide to the Gold Price
The 1934 Repricing to $35 Per Ounce
Following Executive Order 6102 in 1933 which outlawed
the private ownership of gold by US citizens, and the Gold
Reserve Act of 1934 which vested ownership of all Federal
Reserve Bank gold certificates with the US Treasury, US
President Roosevelt issued a proclamation in January 1934
redefining the dollar as 15 5/21 grains of gold, nine-tenths
fine (0.90 fineness), in other words 13.7 grains of pure
gold per dollar, or $35 dollars per ounce. This represented
a 69% dollar devaluation relative to gold. The US population could no longer own
gold nor convert paper currency into gold.
The $35 official US gold price subsequently became the lynchpin for international
currency stabilisation after World War II when the International Monetary Fund
was established. In this gold exchange standard, each member country defined a
fixed par value for its currency against gold or against the reserve currency of the
system, the US dollar, which itself was defined as being convertible into gold at $35
per ounce. Foreign central banks and governments had to buy and sell gold at the
$35 price, and could also convert their surplus US dollars into gold at $35 per
ounce at the New York Federal Reserve Bank.
Defending $35 Per Ounce
The London Gold Market reopened in 1954 having been closed since the
beginning of World War II. Although the official price of gold was $35 per ounce,
the international free market price, as traded from London, often spiked traded
above the official price in response to international crises and also on pure
speculation about the ability of the US to maintain the $35 fixed price.
© 2013 GoldCore 20A Comprehensive Guide to the Gold Price
On occasions when the market price spiked above $35,
the Bank of England, backed up by the US, would on
occasion intervene by selling gold, bringing the market
price back towards the official price. However, concern
was such that in 1961, the US, in conjunction with seven
Western European central banks established the initially
secret London Gold Pool, operated by the Bank of
England on behalf of the consortium, and coordinated via regular central bank
meetings at the Bank for International Settlements in Basle. This gold pool, which
shared the cost in terms of gold bullion contributed to the operation, was both a
selling and buying syndicate, and aimed to keep the London price within a tight
range around the $35 rate.
Following a few years of relative success in subduing the price during currency
crises and other speculative episodes, heavy speculative demand occurred in late
1967 and again in March 1968. This led to huge gold losses for the participating
central banks and the suspension of the pool as well as a two week closure of the
London Market.
The Two-Tier Market
So as to avoid further gold losses, the gold pool central
banks devised a two-tier price structure while the market
was closed, agreeing only to transact gold with each other
at the official $35 price, leaving all other parties to trade at
a market price. The $35 price therefore became a de facto
floor price. Over the next three years, the free market price
fluctuated between $35 and up above $40, but central
banks could still convert dollars to gold at $35 per ounce via the gold exchange
service of the New York Federal Reserve Bank.
© 2013 GoldCore 21A Comprehensive Guide to the Gold Price
In 1971, continued US deficits and massive creation of From 1933, the US
US dollars internationally precipitated a rush on US gold
population could no
reserves by foreign central banks, and to preserve
longer own gold
remaining US gold stocks, the US government suspended
nor convert paper
dollar convertibility into gold in August 1971, known as
currency into gold.
the so-called closing of the ‘gold window’.
In light of these changes, international discussions on exchange rates during
December 1971, known as the Smithsonian Agreement, led to a further 9%
official devaluation of the US dollar from $35 to $38 per ounce. Some currencies
began abandoning their fixed links and started floating in tight ranges against the
dollar. With the free market price of gold remaining above $40 during 1971,
pressure continued on the dollar, and the post-World War II exchange rate
system began to crumble. Gold subsequently shot up to $70 in 1972 signalling
continued dollar weakness.
The Floating Exchange Era
In February 1973 there was another 10% official devaluation of
the dollar from $38 per ounce of gold to an official price of
$42.22 per ounce. This devaluation did not calm markets and
the dollar weakened again forcing foreign exchange markets to
close for most of March 1973. When markets reopened, all major currencies began
floating against the US dollar and the gold price rocketed, going as high as $127
during the year and to over $180 in 1974 on the back of the first oil price shock. In
1974 the US government also lifted the ban on US citizens owning gold.
The major Western central banks and finance ministries pursued a number of
initiatives in the second half of the 1970s to de-emphasis gold in the international
system. Gold was written out of the IMF’s Articles of Association, and the IMF
divested of 50 million ounces of its gold holdings through auctions and
© 2013 GoldCore 22A Comprehensive Guide to the Gold Price
distributions to Members. These tactics had variable results, and although the gold
price had a period of consolidation between 1975 and 1977, the price increases
reignited in 1978 and hit new highs in early 1980 peaking at over $850 per ounce
on investor demand, the second oil price shock, and heightened inflationary fears.
US Federal Reserve monetary policy was altered
dramatically in late 1979 to tame inflation through interest
rate increases. Consequently the gold price drifted lower
and became range bound between $300 and $400
throughout the 1980s and into the 1990s. The extensive
use of gold price hedging by gold miners and the growth of
gold leasing by central banks in the 1990s also kept the
price lower than it otherwise would have been.
Similarly, large gold sales in the 1990s by various Western central banks such as
Canada, the Netherlands, the UK and Switzerland acted as breaks on any price
gains since it introduced uncertainty into the market, and encouraged short selling
and hedge fund speculation against price rises.
Despite the gold price hitting a multi-year low of $270 in
2000, that year also marked a turning point and the
beginning of the current bull market in gold. A number of
events are seen as marking this turning point, such as the
launch of the partially gold backed Euro (the ECB
stipulated that 15% of a member countries foreign
exchange reserves be transferred to it in the form of gold). Likewise, the first
Central Bank Gold Agreement in 1999, limiting gold sales of European central
banks, created confidence in the market that the gold price would not be
overwhelmed by unpredictable sales.
© 2013 GoldCore 23A Comprehensive Guide to the Gold Price
Commodities also emerged in the early 2000s as a newly ECB stipulated that
viable asset class and investor demand via products such as
15% of a member
gold ETFs drove the price higher. The onset of the financial
countries foreign
crisis in 2008 also acted as a positive price driver, with
exchange reserves
investors allocating to gold for its inflation hedging,
be transferred to it
currency hedging and safe haven benefits, as well as
portfolio diversification benefits. in the form of gold.
© 2013 GoldCore 24A Comprehensive Guide to the Gold Price
Conclusion _____________________________
G old has been used as money throughout history and many market
participants increasingly view gold as a superior form of money. Gold's
price is a good indication of the world's trust in fiat currencies. Rising gold prices
suggest concern about inflation and currency devaluations and falling gold prices
suggest confidence about the risk of inflation and currency devaluations.
Former Federal Reserve chairman, Alan Greenspan asserted in 2010 that gold
prices are important to watch. Greenspan said that “gold is historically one of the
rare media of exchange that doesn't require any collateral or backing, counter
signatures and is universally acceptable as a means of payment."
The former Federal Reserve chairman noted that gold was a good way to know
how stable the financial system is. "To get a sense of the stability of the system,
watching the price of gold is not too bad,” Greenspan said.
Gold’s position as the universal store of value remains undiminished. Its global
importance is underpinned by the fact that creditor nation central banks such as those
of Russia and China are some of the largest buyers of gold in the world today.
Not monitoring or knowing gold's price can result in not Gold's price is a
having a complete understanding of international financial good indication of
markets which can lead to poor financial decisions.
the world's trust in
Throughout history, there are countless examples of how those fiat currencies.
who did not own gold were wiped out financially. Today most
people in the western world could not quote you the gold price, let alone do they
own physical gold. This could again prove fatal to their financial health.
© 2013 GoldCore 25A Comprehensive Guide to the Gold Price
WRITTEN BY
GoldCore.
ABOUT GOLDCORE
GoldCore are respected international bullion dealers who are experts in the execution and logistics of the
highly specialised precious metals market. GoldCore have been providing precious metal investment
solutions for an International client base since 2003. Today, our team of experts service all investor
classes from private individuals to companies and institutional investors. Whether you are a small or large
investor looking to take delivery or arrange for secure, trusted insured storage, GoldCore has a solution to
suit your needs.
CONTACT GOLDCORE
Ireland England USA
GoldCore Ltd No. 1 Cornhill USA Phone
14 Fitzwilliam Square London EC3V 3ND +1 302 635 1160
Dublin 2 England
Ireland
UK Phone
Low Call Ireland
+44 (0) 203 086 9200
1 850 GOLD IE
Ireland Phone
UK Fax
+353 1 632 5010
+44 (0) 203 031 1046
Disclaimer: The information in this document has been obtained from sources which we believe to be
reliable. We cannot guarantee its accuracy or completeness. It does not constitute a solicitation for the
purchase or sale of any investment. Any person acting on the information contained in this document
does so at their own risk. Recommendations in this document may not be suitable for all investors.
Individual circumstances should be considered before a decision to invest is taken. Investors should note
the following: Past experience is not necessarily a guide to future performance. The value of investments
may fall or rise against investors' interests. Income levels from investments may fluctuate. GoldCore
Limited ( www.goldcore.com), trading as GoldCore is regulated by the Financial Regulator of Ireland.
© 2013 GoldCore. All rights reserved.
© 2013 GoldCore 26You can also read