WHITE PAPER Transforming Markets for VPPs in Europe - Flexibility and Trading Use Cases Grow in Sophistication and Scale Published 4Q 2019 ...
←
→
Page content transcription
If your browser does not render page correctly, please read the page content below
WHITE PAPER

  Transforming Markets for VPPs in Europe
  Flexibility and Trading Use Cases Grow in Sophistication
  and Scale

  Published 4Q 2019

  Commissioned by Enbala

  Peter Asmus
  Research Director

Transforming Markets for VPPs in Europe

Section 1
EXECUTIVE SUMMARY
1.1                     Europe and VPPs: Flexibility and Trading Innovations
                        Europe is pushing the envelope on the virtual power plant (VPP) concept. The continent is
                        adapting platforms to provide new, more sophisticated capabilities to maximize the value of
                        flexibility. At the same time, it is opening doors to new value streams linked to creative
                        ancillary service markets and real-time energy trading.

                        Historically, the European VPP market centered around renewable energy integration. The
                        tightly connected countries in the European Union (and the UK) have an advanced market
                        integration that is taking VPP platforms into a more sophisticated direction, stacking
                        complex use cases. These use cases are vital contributors to the continent reaching its
                        climate and economic efficiency goals and targets. Perhaps the key distinguishing feature
                        of Europe’s VPP market is the use of advanced software platforms to enable smart energy
                        trading. As a result, this region is proving exciting new possibilities to examine how VPPs
                        can balance the grid, provide economic value exchanges between prosumers and the
                        larger grid, and usher in commercially viable forms of transactive energy.

Chart 1-1.              Annual Total VPP Capacity, Implementation Spending and Market Revenues,
                        Europe: 2019-2028

            16,000                                                                                                                                   $3,500

                                           Capacity
            14,000                                                                                                                                   $3,000
                                           Implementation Spending
            12,000                         Market Revenue
                                                                                                                                                     $2,500

            10,000                                                                                                                                            ($ Millions)
                                                                                                                                                     $2,000
     (MW)

             8,000
                                                                                                                                                     $1,500
             6,000

                                                                                                                                                     $1,000
             4,000

             2,000                                                                                                                                   $500

                   -                                                                                                                                 $-
                           2019        2020         2021        2022         2023        2024         2025        2026         2027           2028

                                                                                                             (Source: Navigant Research)

©2019 Guidehouse Inc. Notice: No material in this publication may be reproduced, stored in a retrieval system, or transmitted by any means,
in whole or in part, without the express written permission of Navigant Consulting, Inc.

                                                                                                                                                                             1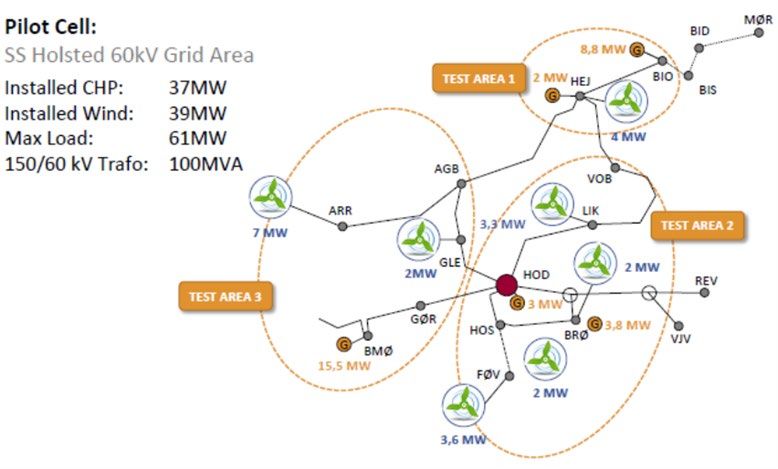
Transforming Markets for VPPs in Europe

Section 2
EARLY EUROPEAN EXPERIMENTS SET STAGE FOR NEXT
GENERATION VPPS
2.1                     Market Design in Europe Shapes VPP Applications
                        The term virtual power plant (VPP) is constantly evolving. A project trumpeted as the
                        world’s first VPP has been operating for the German utility RWE since October 2008,
                        aggregating the capacity of nine different hydroelectric plants ranging in size from 150 kW
                        up to 1.1 MW, initially totaling 8.6 MW of VPP capacity. This VPP framework opened new
                        power marketing channels for these facilities. These marketing channels would not have
                        been viable if distributed energy resource (DER) assets were still operating as standalone
                        systems, since contract commitments could be more easily met if these small facilities
                        responded as a pool of hydro resources aggregated and optimized via software. The VPP
                        expanded over time to include biogas, backup generators, combined heat and power
                        (CHP), and wind to reach 200 MW in size today.

                        Germany is a leader in exploring how a VPP concept could help integrate large volumes of
                        renewable energy. For example, another German VPP—the 23 MW regenerative
                        combined power plant (RCPP)—was touted since it proved (in theory) that a country as
                        large as Germany could rely completely on renewable energy resources for its power
                        supply. A total of 36 wind, solar, biogas, CHP, and hydropower generators were operated
                        as if a single power plant and supplied 24/7 power to the equivalent of 12,000
                        households. 1

Figure 2-1.             Regenerative Combined Power Plant in Germany

                                                                                                              (Source: kombikraftwerk.de)

1
 Others have pointed out that this R&D project failed to account for grid congestion challenges that might frustrate this sort of VPP
under real market conditions; limiting VPPs to common feeders is a more commercially viable approach.

©2019 Guidehouse Inc. Notice: No material in this publication may be reproduced, stored in a retrieval system, or transmitted by any means,
in whole or in part, without the express written permission of Navigant Consulting, Inc.

                                                                                                                                              2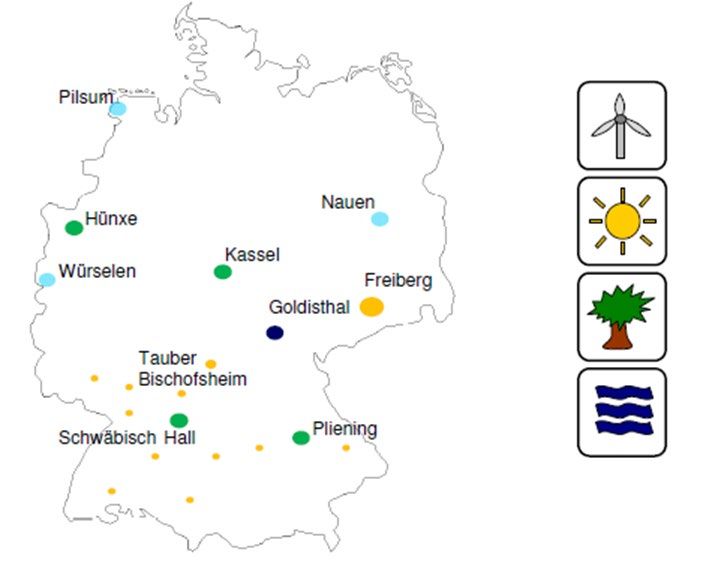
Transforming Markets for VPPs in Europe

                           Today, the concept of a VPP is much more expansive. Europe lags the US in demand
                           response (DR), largely due to the intense efficiency built into both residential and
                           commercial and industrial buildings. However, the large fluctuations in solar and wind
                           generation are providing incentives for aggregators, utilities, and grid operators to search
                           more intensely for new balancing resources. This intense deep dive into potential assets
                           on the demand side of the energy exchange ledger is tilting toward large industrial loads
                           that can be economically harvested with the right software platform.

                           RWE is leading the way in next generation VPPs. It is working to maximize the value of
                           new software platforms that address the technical details of managing pools of diverse
                           assets into a VPP. RWE also plans to use software enhanced over time by machine
                           learning to respond to the real-time needs of the power grid through energy trading.

2.2                        Moving from Supply-Side to Mixed Asset VPP Frameworks
                           Unlike North America, which built initial VPP use cases on the back of DR programs,
                           Europe’s focus has tended to lean on supply-side resources. Given the enormous growth
                           in renewable energy generation—the majority of which flows directly into wholesale
                           markets under feed-in tariff contracts—the VPP market is quickly shifting to tap more
                           diverse assets. As Chart 2-1 illustrates, Europe owns the supply-side VPP market, which is
                           expected to continue growing over the next 10 years. However, the continent is more
                           focused on the orchestration of large wholesale renewable energy fleets than DER-based
                           VPP projects. The mixed asset model remains the primary driver for innovation in VPPs.

Chart 2-1.                 Supply-Side VPP Capacity and Implementation Spending, World Markets: 2019-2028

                                          North America
                5,000                                                                                                                                $600
                                          Europe
                4,500                     Asia Pacific
                4,000
                                          Latin America                                                                                              $500
                                          Middle East & Africa
                3,500                     Implementation Spending                                                                                    $400
                3,000
                                                                                                                                                            ($ Millions)
        (MW)

                2,500                                                                                                                                $300

                2,000
                                                                                                                                                     $200
                1,500

                1,000
                                                                                                                                                     $100
                   500

                       -                                                                                                                             $-
                              2019        2020        2021        2022        2023        2024        2025        2026         2027           2028

                                                                                                             (Source: Navigant Research)

©2019 Guidehouse Inc. Notice: No material in this publication may be reproduced, stored in a retrieval system, or transmitted by any means,
in whole or in part, without the express written permission of Navigant Consulting, Inc.

                                                                                                                                                                           3
Transforming Markets for VPPs in Europe
2.3 Unpacking VPP Use Cases with Enhanced Control Platforms
Though Europe’s foray into VPPs has been focused on renewable energy integration, a
handful of projects highlight pioneering efforts to integrate other DER assets (including
both CHP and EVs) into VPPs, and to layer VPP functionality on top of microgrid
topologies. Two R&D experiments in Denmark showcase how VPPs can provide a
combination of grid services that will be increasingly important as Europe moves to meet
its aggressive renewable energy targets.
2.3.1 Cell Controller Project
The Cell Controller Project consists of distributed wind and CHP units owned by farmers
and village heating districts, and was operated by Energinet.dk, the transmission operator
for Denmark. Since so many different parties own these assets, this project was one of the
most advanced forays into what a distributed energy future could look like. The goal was to
provide services, such as voltage regulation at the local level, in each cell (each discrete
microgrid). Testing was successfully completed in 2012, validating all key VPP operational
solutions. With software and controls, the Danish grid operator Energenit.dk was able to
optimize the coordination of distributed wind and CHP facilities to create a VPP that helped
set the stage for the country’s aggressive renewable energy goals. Multiple non-utility
owners can create a series of microgrids (i.e., cells) that can island and work at an
enterprise level as a VPP. The project concluded in 2012 and served as a basis for
Denmark’s plan to allow renewables to provide 100% of its electricity, thermal, and
transportation energy by 2050.
Figure 2-2. Denmark’s Cell Controller VPP Demonstration Project
(Source: Spirae)
©2019 Guidehouse Inc. Notice: No material in this publication may be reproduced, stored in a retrieval system, or transmitted by any means,
in whole or in part, without the express written permission of Navigant Consulting, Inc.
4Transforming Markets for VPPs in Europe
2.3.2 Island of Bornholm
The VPP system on the Island of Bornholm is another large microgrid demonstration that
represents more than 112 MW of peak capacity capable of islanding from the main grid
(the Nordic interconnected power system). Under normal conditions, the system has a high
penetration of wind and some solar power. When islanded, it depends significantly on fossil
fuel generation. Still, the VPP/microgrid project set a goal to obtain 76% of its total
electricity from renewables by 2025. The testing period for VPP applications, such as DR
from residential electric heating systems and heat pumps in 2,000 homes, concluded in
June 2019. At that point, the island’s DER mix included the following: 29 MW of wind
power, 16 MW of combined heat and power, 6.5 MW of solar PV, 2 MW of biogas, 34 MW
of diesel, and 25 MW of oil-fired steam generation. The latter serves as backup resources.
Plans also include the development of two large solar PV farms. One of the key lessons
learned from this living lab is the need for standardized protocols to move beyond simple
on-off systems, shifting to greater flexibility in load management.
The primary purpose of this demonstration is to test flexible capacity and ways to control
consumption through price signals in a load shifting and DR-type model. It is also testing
the ability of EVs to provide grid services. A vehicle-to-grid (V2G) demonstration will
simulate a full-scale penetration of EVs on Bornholm to assess how the fleet can be
integrated into the grid. It will also deploy a small real-world pilot project with as many as
50 Nissan PEVs on Bornholm, using a V2G platform that enables EV batteries to store and
resell unused energy back to the local grid. At present, 22 EVs on Bornholm Island are
testing this concept in the small pilot. A larger fleet of PEVs could potentially provide peak
shaving and balancing services to the grid. EVs offer several components and services of
value to any VPP aggregation. These include last resort stationary storage services, loads
that (if curtailed or modulated) represent DR resources, and loads coupled with energy
storage for optimized DR firming and flexible capacity. It is this latter use case that has
achieved the greatest market adoption.
©2019 Guidehouse Inc. Notice: No material in this publication may be reproduced, stored in a retrieval system, or transmitted by any means,
in whole or in part, without the express written permission of Navigant Consulting, Inc.
5Transforming Markets for VPPs in Europe
Section 3
EXPANDING VPP MARKETS BEYOND COUNTRY BORDERS
3.1 Early Pioneers Give Way to New Market Opportunities
The VPP platform is agile; its attributes are being tested and expanded upon in Europe.
Although the names of products, services, and markets are different across each regional
market, they tend to have strikingly similar requirements for market participation. Germany
is the largest and most mature VPP market, it leads the region in current deployments and
is expected to continue holding that position over the next decade. Germany is anticipated
to capture about one-third of the total VPP market’s annual capacity by 2028, reaching
approximately $1 billion in annual market revenue and over 4,000 MW of incremental
annual capacity additions. The world’s largest VPP traces back to 2009 and has grown to
over 4,500 MW in size; it is expanding in stages across the entire European continent. With
its Eurocentric focus on energy trading, technologies used for financial transactions,
tracking, and settlements are setting the stage for future VPPs throughout Europe.
Chart 3-1. VPP Annual Capacity, Implementation Spending and Market Revenues, Germany:
2019-2028
5,000 1,200
4,500 Capacity
1,000
4,000 Market Revenue
3,500 Implementation Spending
800
3,000
($ Millions)
(MW)
2,500 600
2,000
400
1,500
1,000
200
500
- -
2019 2020 2021 2022 2023 2024 2025 2026 2027 2028
(Source: Navigant Research)
3.1.1 Case Study: UK
While Germany is the VPP market leader in Europe, the UK is the other hotspot when it
comes to fully commercialized ventures and projects. The UK has always been a bit of an
©2019 Guidehouse Inc. Notice: No material in this publication may be reproduced, stored in a retrieval system, or transmitted by any means,
in whole or in part, without the express written permission of Navigant Consulting, Inc.
6Transforming Markets for VPPs in Europe
outsider; it embraced forms of electricity deregulation well before other nations and
continents, first establishing open markets back in the 1990s.
VPPs mesh well with UK market reforms that fully embrace deregulation, flexibility, and
variable renewable energy generation. From projects large to small, VPPs are emerging
from a variety of vendors, attracting companies throughout the continent. The UK is a
hotspot for VPP innovation. Its projects range from 1 GW from Statkraft, a Nordic energy
company that is combining energy storage with natural gas generation, to another VPP of
just 4 MW that uses resources in 250 homes and 100 schools and other buildings. Along
with private sector vendors and out-of-country arms of utilities now deregulated, distribution
network operators are also moving forward with VPP projects.
For example, UK Power Networks is launching a series of VPPs to substitute for traditional
grid reinforcements. It is creating 25 flexibility first zones across three service areas in
London, the southeast, and east of England. Aggregating rooftop solar PV systems paired
with onsite batteries, these resources will be called upon to discharge electricity into the
regional grid to relieve peaking power needs. In exchange, participating prosumers will be
paid by the network operator. Though limited to 40 homes in the London zone at the
outset, it is evidence that the UK is moving forward with the VPP concept at both wholesale
and retail levels of energy production and consumption. Short-term contracts are being let
for this winter and through 2021, with providers also having an option to bid for longer-term
contracts as long as 4 years.
3.1.2 Markets in Eastern Europe Are Also Opening Up
Many utilities and energy companies start by developing a VPP solution with the help of
software innovators in their primary country of operation, but with an eye toward future
applications in other EU markets. These software vendors can often incorporate lessons
learned from other global markets into their platforms, exploring diverse flexibility resources
that may differ by type or scale in different markets but share fundamental control
characteristics that help informed VPP offerings. Navigant Research, a Guidehouse
company, believes the entire global market—including Europe—is marching toward the
mixed asset model. The twist to the VPP model in Europe revolves around linkages to
active energy trading, the sheer volume of the market (and renewable capacity, including
large wholesale offshore wind farms), and sophisticated load management resources given
the continent’s legacy of embedded efficiency in buildings and industrial processes.
An emerging market for VPPs lies in Eastern Europe both in the north (Estonia) and to the
south (Poland). Renewable capacity in Eastern Europe has traditionally lagged Western
Europe. In these markets, less efficient industries represent harvestable loads not
generally available throughout the rest of the continent. Deregulation of these markets is
now taking hold, so customers, utilities, and regulators are aligned in seeking new forms of
flexibility, exploring the VPP model based on lessons learned in pioneer markets such as
Germany and the UK.
©2019 Guidehouse Inc. Notice: No material in this publication may be reproduced, stored in a retrieval system, or transmitted by any means,
in whole or in part, without the express written permission of Navigant Consulting, Inc.
7Transforming Markets for VPPs in Europe
Section 4
LINKING ENERGY TRADING TO GRID RELIABILITY VIA VPPS
4.1 Europe Leads the Way on Leveraging VPP Platforms for Energy Trading
Automated energy trading is increasingly part of the VPP market in Europe. Germany is a
leader in this space. Increased VPP-related trading activity is also opening up in the
Netherlands, Belgium, the Nordic countries, and across certain Italian energy retailers. The
UK is also a VPP hotspot. It is becoming more and more active on rapid energy trading
opportunities due to the increased competitiveness of the market and the need for the
established players (such as incumbent utilities) to provide innovative and compelling
offers to their clients and to sign up new customers. Each country has its own reasons for
increasing the need for a VPP solution, whether the driver is new regulations, government
strategies, aggressive renewable energy targets, or EV charging. Figure 4-1 provides the
framework in which VPPs operate, with an increased focus on ancillary services that
represent a small fraction of the total market, but highly valuable grid services.
Figure 4-1. Classic Deregulated Market Structure for VPPs in Europe
Power Market
Wholesale Market Ancillary Services
(1%-3% of Wholesale Market)
Control Reserve
Spot Market Inertia
EPEX Spot SE (D)
Exchange APX ENDEX (NL) Re-Dispatch
EEX (D) OTC
APX NL (NL) Reactive Power
Derivatives
Futures, Forwards,
Options, etc. Blackstart/
Isolated Operation
Capacity Reserve
(Source: Navigant Research)
©2019 Guidehouse Inc. Notice: No material in this publication may be reproduced, stored in a retrieval system, or transmitted by any means,
in whole or in part, without the express written permission of Navigant Consulting, Inc.
8Transforming Markets for VPPs in Europe
4.1.1 Tapping Diverse Flexibility Resources for Economic Optimization
VPPs fill the need for flexibility as Europe scales up its renewable energy and DER
portfolios. The beauty of the VPP platform, however, is not limited to flexibility. The full
suite of grid services necessary for moving power grids fully into the 21st century is among
the functionality upgrades being incorporated into VPPs: aggregation, control, scalability,
and real-time active resource and grid management. From a high level perspective, the
VPP solution is also seen as bringing digital transformation and cloud-based software
solutions into commercial and industrial sites that seek greater efficiencies and new
revenue streams from existing or new energy assets.
Since VPPs allow for the management of generation, energy storage, and customer load,
they can aggregate flexibility resources across the entire pool of potential DER assets. This
aggregation enables the determination of market offers, optimization of reserve capacity,
and scheduling of mixed asset portfolios to meet a real-time market commitment or power
grid need. The trend of relying upon a constraint-based approach for flexibility and control
of DER assets is a technical item of note. These constraints typically fall into three
categories:
• Technical: Minimum/maximum power limits, on-off times, and ramp rates)
• Participation: Opt outs due to unplanned outages or non-participation and blackouts
due to planned outages or maintenance
• Other Business Constraints: Such as maximum activations per time period
4.1.2 Market Reforms Could Open up New VPP Use Cases
Europe is moving in the right direction on the VPP front. Nevertheless, experience in other
global markets could inform regulators to fine-tune market structures to ensure the
broadest participation among the universe of potential DER assets. Among the reforms
that could accelerate VPP markets are the following:
• Modify market rules to allow participants to offer smaller bid volumes, for example,
lowering the threshold to 100 kW instead of 5 MW.
• Allow aggregation of smaller generators to participate as flexibility resources and allow
more diverse types of DER to participate in the provision of market services, including
controllable loads and energy storage.
The challenges VPPs and other DER platform face as they bump up against remnants of
the prior monopoly are among the other barriers to full mixed asset VPP commercialization
in Europe. One impediment is that market participation rules often require a highly accurate
meter to be placed on each large load. This requirement can drive up installation costs for
each kilowatt of capacity registered into the market. In turn, this reduces the economic
viability of including smaller generation, load, or energy storage assets into a VPP portfolio.
©2019 Guidehouse Inc. Notice: No material in this publication may be reproduced, stored in a retrieval system, or transmitted by any means,
in whole or in part, without the express written permission of Navigant Consulting, Inc.
9Transforming Markets for VPPs in Europe
Another regulatory reform that could open markets in Europe to lower cost asset
aggregations is adjusting how best to measure performance of a VPP. It is often best when
markets rely upon an aggregated performance score rather than per asset performance
scores, as the former approach reduces the probability of noncompliance. Europe could
learn from the most active VPP markets in the US (the PJM control area) and seek to
reduce the complexity of including demand side resources into a mixed asset VPP. Enbala
was among the first participants to offer controllable loads into PJM for frequency
regulation, which is necessary to keep grids in balance and has emerged as a classic VPP
use case. The company enabled the participation of DR resources by designing metrics
that include calculating (all in megawatts) a basepoint, upper control limit, and lower control
limit for a chiller. It is not as easy to characterize demand resources in this way as it would
be for a generator but capturing the grid value of diverse demand resources opens the
door to state-of-the-art mixed asset VPPs.
4.1.3 How Advanced Platforms Enable Complex Value Stacking Use Cases
Platforms that once only addressed loads, generation, batteries, or EVs are now being
asked to sense, aggregate, control, and respond to market signals for a growing list of grid
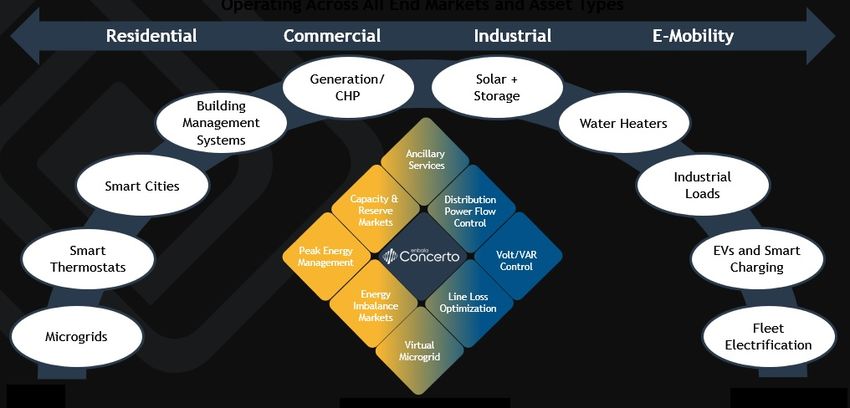
services. Figure 4-2 highlights what is possible with a state-of-the-art platform spanning
residential, commercial, and industrial prosumers. In an ideal world, VPP software
platforms can stack complex use cases that include e-mobility services.
Figure 4-2. Expanding VPP Use Cases Span Market Segments
(Source: Enbala)
©2019 Guidehouse Inc. Notice: No material in this publication may be reproduced, stored in a retrieval system, or transmitted by any means,
in whole or in part, without the express written permission of Navigant Consulting, Inc.
10Transforming Markets for VPPs in Europe
VPPs can only respond to precise grid needs if regulations allow them to do so. DR is
perhaps the most extreme example of how new technology needs to be paired with new
market designs. The aggregation of load to substitute for services was previously only
provided by generators and requires explicit rules for market engagement by either state or
federal regulators. The greatest challenge for regulatory treatment in this area may be for
mixed asset VPPs. Why? They have characteristics that traditionally were treated
separately, often in silos. VPPs instead look to treat these DER aggregations as systems
of systems. The mix of resources ideally does not matter; the services that can be provided
are what should be counted and compensated for. Utilities play a major role in this market
transformation, as this is where many VPPs are incubated. Transparent interconnection
rules, rational telemetry requirements, and coherent and stable subsidy schemes all
contribute to a market environment conducive to VPPs.
©2019 Guidehouse Inc. Notice: No material in this publication may be reproduced, stored in a retrieval system, or transmitted by any means,
in whole or in part, without the express written permission of Navigant Consulting, Inc.
11Transforming Markets for VPPs in Europe
Section 5
IS EUROPE TAKING VPPS TO THE NEXT LEVEL?
5.1 Pushing the Envelope on VPP Platform Innovation
Europe is on the brink of becoming the global VPP leader. Much work has been completed
to align EU member states with an underlying framework of network codes and guidelines
on topics such as transmission system operation, electricity balancing, and demand
connections. These codes may seem like esoteric minutiae, but these are the nitty gritty
details that guide countries to create markets that enable vendors to offer similar solutions
across borders. Without such coordination and harmonization of protocols, the cost of VPP
goes up and the timeline for deployments expands.
The work completed for EU member states is helping speed up the implementation of grid
balancing services that are becoming standardized ancillary services (and include primary
reserves, secondary reserves, tertiary reserves, and replacement reserves). With these
requirements in place, once state-of-the art mixed asset VPPs take hold in a few country
markets, such as Germany and the UK, their transactive energy models will likely be
mimicked by other EU member countries that implement similar market structures as the
early adopters.
5.2 Broadest Possible VPP Participation Due to Interconnected Country Markets
The VPP functions linked to balancing services are just one aspect of market
developments in Europe. The European Power Exchange spot market also provides a key
centralized structure to allow VPPs in member states for intra-day and day-ahead energy
market participation. This single point of clearing bids allows VPPs to move beyond country
boundaries and evolve into a regional solution with a footprint larger than any VPP market
in the world, if measured by customer accounts or generation or load.
5.3 Future Opportunities for VPP Value to Grow
VPP platforms are likely to continue transforming. One twist to grid management now
underway in Europe is that distribution network operators are being asked to become
distribution system operators (DSOs), serving as a traffic cop for DER and energy trades at
the distribution level of electricity service. This will ultimately lead to software platforms that
can offer VPP capabilities on frequency and energy trading and active power management
to solve voltage hotspots and other reliability concerns. Rather than extending investments
in physical power plant-based assets, these DSOs may instead focus on squeezing value
out of flexible resources that help balance the overall power grid. Though taking longer
than some would hope, the shift from VPP to a DER management system appears
inevitable over the long run. Interim steps currently underway include advanced distribution
management systems providing data to localized markets in which VPPs can also play.
©2019 Guidehouse Inc. Notice: No material in this publication may be reproduced, stored in a retrieval system, or transmitted by any means,
in whole or in part, without the express written permission of Navigant Consulting, Inc.
12Transforming Markets for VPPs in Europe
Section 6
ACRONYM AND ABBREVIATION LIST
CHP ...................................................................................................................... Combined Heat and Power
DER ................................................................................................................. Distributed Energy Resources
DR .................................................................................................................................... Demand Response
EPEX ................................................................................................................... European Power Exchange
EU ......................................................................................................................................... European Union
EV ........................................................................................................................................... Electric Vehicle
GW .................................................................................................................................................... Gigawatt
kW ...................................................................................................................................................... Kilowatt
MW .................................................................................................................................................. Megawatt
PV ................................................................................................................................................ Photovoltaic
R&D .................................................................................................................... Research and Development
RCPP ...................................................................................................Regenerative Combined Power Plant
UK ......................................................................................................................................... United Kingdom
US ............................................................................................................................................. United States
V2G ......................................................................................................................................... Vehicle-to-Grid
VPP .................................................................................................................................. Virtual Power Plant
©2019 Guidehouse Inc. Notice: No material in this publication may be reproduced, stored in a retrieval system, or transmitted by any means,
in whole or in part, without the express written permission of Navigant Consulting, Inc.
13Transforming Markets for VPPs in Europe
Section 7
TABLE OF CONTENTS
Section 1 ...................................................................................................................................................... 1
Executive Summary .................................................................................................................................... 1
1.1 Europe and VPPs: Flexibility and Trading Innovations ................................................................. 1
Section 2 ...................................................................................................................................................... 2
Early European Experiments Set Stage for Next Generation VPPs ...................................................... 2
2.1 Market Design in Europe Shapes VPP Applications .................................................................... 2
2.2 Moving from Supply-Side to Mixed Asset VPP Frameworks ........................................................ 3
2.3 Unpacking VPP Use Cases with Enhanced Control Platforms..................................................... 4
2.3.1 Cell Controller Project ............................................................................................................. 4
2.3.2 Island of Bornholm .................................................................................................................. 5
Section 3 ...................................................................................................................................................... 6
Expanding VPP Markets Beyond Country Borders ................................................................................. 6
3.1 Early Pioneers Give Way to New Market Opportunities ............................................................... 6
3.1.1 Case Study: UK ....................................................................................................................... 6
3.1.2 Markets in Eastern Europe Are Also Opening Up ................................................................... 7
Section 4 ...................................................................................................................................................... 8
Linking Energy Trading to Grid Reliability via VPPs ............................................................................... 8
4.1 Europe Leads the Way on Leveraging VPP Platforms for Energy Trading .................................. 8
4.1.1 Tapping Diverse Flexibility Resources for Economic Optimization ......................................... 9
4.1.2 Market Reforms Could Open up New VPP Use Cases .......................................................... 9
4.1.3 How Advanced Platforms Enable Complex Value Stacking Use Cases............................... 10
©2019 Guidehouse Inc. Notice: No material in this publication may be reproduced, stored in a retrieval system, or transmitted by any means,
in whole or in part, without the express written permission of Navigant Consulting, Inc.
14Transforming Markets for VPPs in Europe
Section 5 .................................................................................................................................................... 12
Is Europe Taking VPPs to the Next Level? ............................................................................................. 12
5.1 Pushing the Envelope on VPP Platform Innovation .................................................................... 12
5.2 Broadest Possible VPP Participation Due to Interconnected Country Markets .......................... 12
5.3 Future Opportunities for VPP Value to Grow .............................................................................. 12
Section 6 .................................................................................................................................................... 13
Acronym and Abbreviation List ............................................................................................................... 13
Section 7 .................................................................................................................................................... 14
Table of Contents ...................................................................................................................................... 14
Section 8 .................................................................................................................................................... 16
Table of Charts and Figures..................................................................................................................... 16
Section 9 .................................................................................................................................................... 17
Scope of Study .......................................................................................................................................... 17
Sources and Methodology ....................................................................................................................... 17
Notes .......................................................................................................................................................... 18
©2019 Guidehouse Inc. Notice: No material in this publication may be reproduced, stored in a retrieval system, or transmitted by any means,
in whole or in part, without the express written permission of Navigant Consulting, Inc.
15Transforming Markets for VPPs in Europe
Section 8
TABLE OF CHARTS AND FIGURES
Chart 1-1. Annual Total VPP Capacity, Implementation Spending and Market Revenues, Europe:
2019-2028 ............................................................................................................................... 1
Chart 2-1. Supply-Side VPP Capacity and Implementation Spending, World Markets: 2019-2028 ........ 3
Chart 3-1. VPP Annual Capacity, Implementation Spending and Market Revenues, Germany: 2019-
2028 ......................................................................................................................................... 6
Figure 2-1. Regenerative Combined Power Plant in Germany ................................................................. 2
Figure 2-2. Denmark’s Cell Controller VPP Demonstration Project .......................................................... 4
Figure 4-1. Classic Deregulated Market Structure for VPPs in Europe ..................................................... 8
Figure 4-2. Expanding VPP Use Cases Span Market Segments ............................................................ 10
©2019 Guidehouse Inc. Notice: No material in this publication may be reproduced, stored in a retrieval system, or transmitted by any means,
in whole or in part, without the express written permission of Navigant Consulting, Inc.
16Transforming Markets for VPPs in Europe
Section 9
SCOPE OF STUDY
This white paper was commissioned by Enbala and focuses on the current and future potential VPP and
DERMS market in Europe. This is the fourth and final in a four-part series exploring how new software
control systems can show near-term value within the VPP market and sets the stage for additional
applications under a DERMS framework. These white papers have been developed in parallel with
updates to Navigant Research’s overall market forecast of VPP segments. Navigant Research white
papers are designed to be objective, third-party documents. As such, Navigant Research does not
endorse any specific company or products.
SOURCES AND METHODOLOGY
Navigant Research’s industry analysts utilize a variety of research sources in preparing Research
Reports. The key component of Navigant Research’s analysis is primary research gained from phone and
in-person interviews with industry leaders including executives, engineers, and marketing professionals.
Analysts are diligent in ensuring that they speak with representatives from every part of the value chain,
including but not limited to technology companies, utilities and other service providers, industry
associations, government agencies, and the investment community.
Additional analysis includes secondary research conducted by Navigant Research’s analysts and its staff
of research assistants. Where applicable, all secondary research sources are appropriately cited within
this report.
These primary and secondary research sources, combined with the analyst’s industry expertise, are
synthesized into the qualitative and quantitative analysis presented in Navigant Research’s reports. Great
care is taken in making sure that all analysis is well-supported by facts, but where the facts are unknown
and assumptions must be made, analysts document their assumptions and are prepared to explain their
methodology, both within the body of a report and in direct conversations with clients.
Navigant Research is a market research group whose goal is to present an objective, unbiased view of
market opportunities within its coverage areas. Navigant Research is not beholden to any special
interests and is thus able to offer clear, actionable advice to help clients succeed in the industry,
unfettered by technology hype, political agendas, or emotional factors that are inherent in cleantech
markets.
©2019 Guidehouse Inc. Notice: No material in this publication may be reproduced, stored in a retrieval system, or transmitted by any means,
in whole or in part, without the express written permission of Navigant Consulting, Inc.
17Transforming Markets for VPPs in Europe
NOTES
CAGR refers to compound average annual growth rate, using the formula:
CAGR = (End Year Value ÷ Start Year Value)(1/steps) – 1.
CAGRs presented in the tables are for the entire timeframe in the title. Where data for fewer years are
given, the CAGR is for the range presented. Where relevant, CAGRs for shorter timeframes may be given
as well.
Figures are based on the best estimates available at the time of calculation. Annual revenues, shipments,
and sales are based on end-of-year figures unless otherwise noted. All values are expressed in year
2019 US dollars unless otherwise noted. Percentages may not add up to 100 due to rounding.
©2019 Guidehouse Inc. Notice: No material in this publication may be reproduced, stored in a retrieval system, or transmitted by any means,
in whole or in part, without the express written permission of Navigant Consulting, Inc.
18Transforming Markets for VPPs in Europe
Published 4Q 2019
©2019 Guidehouse Inc.
1375 Walnut Street, Suite 100
Boulder, CO 80302 USA
Tel: +1.303.997.7609
http://www.navigantresearch.com
Navigant Consulting, Inc., n/k/a Guidehouse Inc. (Navigant), 2 has provided the information in this
publication for informational purposes only. The information has been obtained from sources believed to
be reliable; however, Navigant does not make any express or implied warranty or representation
concerning such information. Any market forecasts or predictions contained in the publication reflect
Navigant’s current expectations based on market data and trend analysis. Market predictions and
expectations are inherently uncertain and actual results may differ materially from those contained in the
publication. Navigant and its subsidiaries and affiliates hereby disclaim liability for any loss or damage
caused by errors or omissions in this publication.
Any reference to a specific commercial product, process, or service by trade name, trademark,
manufacturer, or otherwise, does not constitute or imply an endorsement, recommendation, or favoring by
Navigant.
This publication is intended for the sole and exclusive use of the original purchaser. No part of this
publication may be reproduced, stored in a retrieval system, distributed or transmitted in any form or by
any means, electronic or otherwise, including use in any public or private offering, without the prior written
permission of Navigant Consulting, Inc., Chicago, Illinois, USA.
Government data and other data obtained from public sources found in this report are not protected by
copyright or intellectual property claims.
Note: Editing of this report was closed on November 26, 2019.
2
On October 11, 2019, Guidehouse LLP completed its previously announced acquisition of Navigant Consulting Inc. In the months
ahead, we will be working to integrate the Guidehouse and Navigant businesses. In furtherance of that effort, we recently renamed
Navigant Consulting Inc. as Guidehouse Inc. We will continue to perform as proposed during and after this consolidation, using the
same personnel and methods described in this report.
©2019 Guidehouse Inc. Notice: No material in this publication may be reproduced, stored in a retrieval system, or transmitted by any means,
in whole or in part, without the express written permission of Navigant Consulting, Inc.
19You can also read