Oldham's Local Economic Assessment 2019 - Oldham Council
←
→
Page content transcription
If your browser does not render page correctly, please read the page content below
Oldham’s
       Local Economic Assessment
                  2019

Section 2: Labour Market and Skills

An analysis of the local economic conditions in Oldham

Muhammad Ali
Business Intelligence Service
Oldham’s Local Economic Assessment – 2019. Labour Market and Skills Public Version v1   Page 1 of 40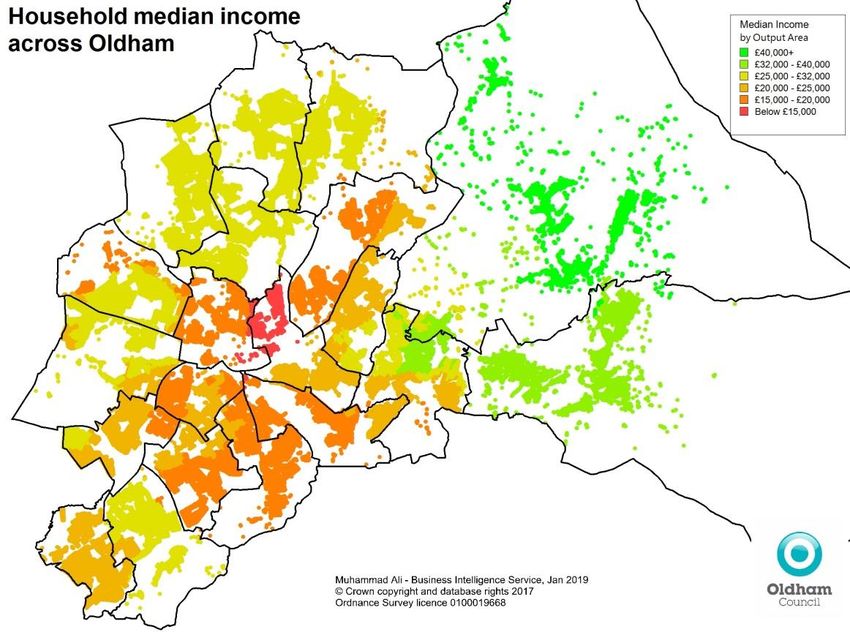
Labour Market and Skills:
Key Points
Overall
Oldham has traditionally had a weak skills base as a legacy of generations of manual
employment, meaning that Oldham residents have found it disproportionally difficult to enter
new growth sectors over recent years. This has made it difficult for Oldham to attract the
inward investment that it is looking for to improve its own economic base and act as a labour
market for the rest of Greater Manchester.
Employment
The employment rate in Oldham (66.7%) is relatively stable and the lowest across
Greater Manchester. It is lower than national average (75.2%) and the gap has
widened slightly from previous years.
With more people commuting out of the borough each day (36,340) than commuting
in (29,137) Oldham is a net exporter of labour (-7,203).
There has been a moderate increase in the proportion of people working full-time
across Oldham, which has pushed Oldham above average.
Unemployment
Oldham’s Annual Population Survey (APS) Unemployment Rate (4.8%) has been
consistently above Greater Manchester (4.6%) and English averages (4.3%) and
have halved since 2013.
The Claimant Count Unemployment Rate for Oldham (4.5%) has increased
significantly over the past year in comparison to Greater Manchester (3.2%) and
England (2.3%). This increase is caused by Universal Credit Full-Service, which
was implemented in April 2017. Until every claimant on the old benefit system is
moved onto Universal Credit, we will not have an accurate representation of
unemployment levels within the borough.
Oldham’s Youth APS Unemployment Rate is now lower than pre-recession levels
and the Greater Manchester average. However, Oldham’s Youth Claimant Count
(7.3%) is the highest in Greater Manchester (4.2%) and higher than the English
(3.1%) average. The reclassification of those unemployed under Universal Credit
Full-Service is a primary factor in the increase of the overall unemployment rate
across Oldham.
These trends in unemployment are likely to continue for a prolonged period as the
unemployed are slowly switched over from their specific Legacy Benefits onto
Universal Credit.
Economic Inactivity
Oldham has a large economically inactive population with high rates of long term
illness/disability. There are also a high numbers of residents choosing not to work.
Oldham has a large South Asian population, where culturally it’s more common for
women to choose not to take paid employment but this is changing, partly because
under the Universal Credit system, they have to partake in some form of employment
or skills training in order to obtain benefits compensation or risk being sanctioned.
Recent trends suggest that there has been a cultural shift, with greater numbers of
younger Pakistani and Bangladeshi women accessing the local labour market.
Universal Credit sanctions or the every looming presence of potential sanctions maybe
responsible for this shift also.
Oldham’s Local Economic Assessment – 2019. Labour Market and Skills Public Version v1 Page 2 of 40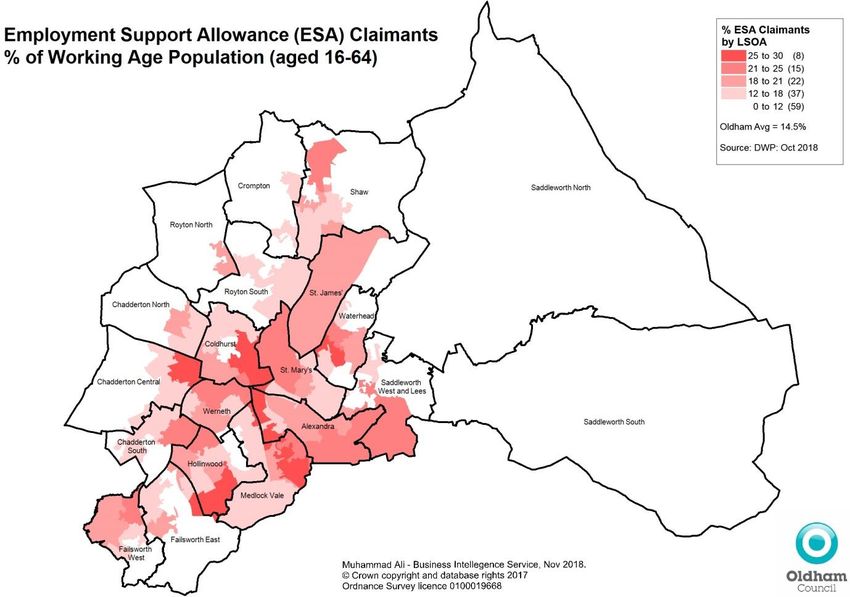
Income and Wages
Median household income in Oldham (£25,000) is lower than GM (£27,198) and Great
Britain (£29,869).
Oldham continues to have lower median wages than across GM and England.
This is likely a reflection on the industry mix within Oldham and the relative skill
levels of the local workforce.
Average resident wages have increased very little in comparison to other districts in
GM. Workplace wages in Oldham rose sharply by 11% in 2018, outstripping resident
wages for the first time since 2010. Oldham has the largest increase in Workplace
Wages in comparison to all other districts within GM, which indicates good growth of
businesses and the local economy of Oldham.
Skills and Qualifications
Oldham has the 3rd lowest percentage of pupils leaving school in GM with 5 GCSE’s
(grades A* to C or attainment 9-4) including English and Maths. GCSE attainment in
Oldham is also below the national average.
While adult skills in Oldham have improved in recent times, Oldham still has both a
higher proportion of residents with no qualifications and fewer residents holding
degree level qualifications compared to GM, North West and national averages.
The forecast growth sectors in GM are going to be found both in the high skilled
occupations and low skilled occupations. It is therefore imperative for Oldham to
comprehensively improve its skills base, allowing residents the opportunities to
access the more skilled and therefore more lucrative new jobs.
Oldham’s Local Economic Assessment – 2019. Labour Market and Skills Public Version v1 Page 3 of 40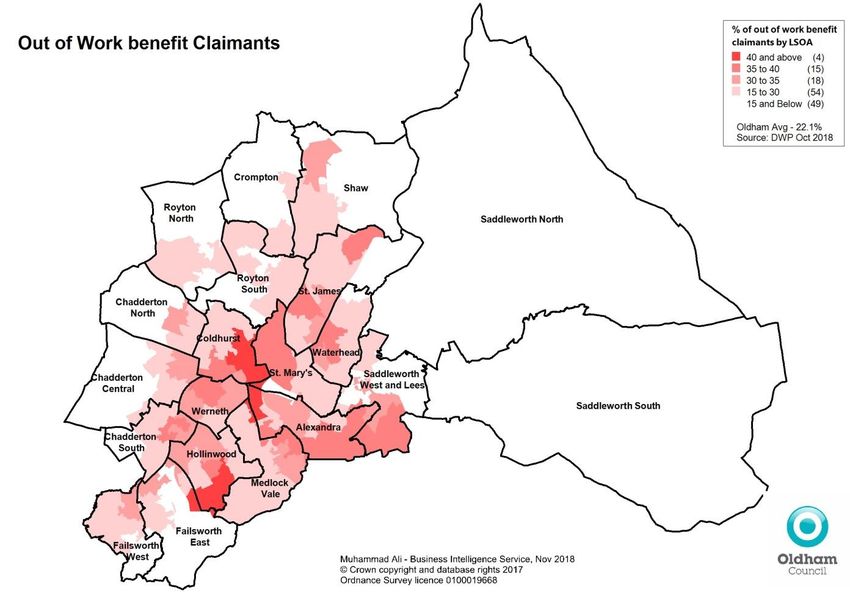
Labour Market and Skills:
Recommendations
The Labour Market and Skills chapter has demonstrated opportunities for Oldham to capitalise
on cultural shifts and growth sectors suited to our young workforce.
Key points are:
Recommendation 1 – Increase Employment – aim to move towards Full Employment
The data demonstrates that a factor in the economic wellbeing of the Borough is to tackle the
underlying issues that have frustrated the achievement of Full Employment.
Key issues include:
Reduce ESA Claimant rates;
Improve female employment rates;
Improve employment rates of 25-34 year olds;
Support Pakistani and Bangladeshi women into the workplace and men into full-time
employment.
Recommendation 2 – Maintain the focus on improving the Skills base.
In order to tackle the low wage/low skill employment cycle, more focus is needed on:
Adults with no qualifications - Oldham is 8 percentage points higher than England
and nearly 5 percentage point higher than GM. This affects not only employment and
productivity but also links to wider inequalities.
Improve the skills base of adults in BME community, particularly those aged 25-34.
Level 4 or higher qualifications – the preferred economic model demands that
business needs will be defined by higher level vocational opportunities which require
investment by individual and business community. There is a need to develop
accessible pathways and promote the value of higher level study and how it can be
linked to key sector priorities of the GM Local Industrial Strategy.
Retention of skilled workforce - the skills dynamic is linked to wider functions of the
economy, including housing offer, employment offer and cost of living/income
generation. The Borough has pursued as skills agenda previously, which did not fail
but clearly suffered with a population dynamic that has led to citizens with skills leaving.
Recommendation 3 – Maintain focus on improving Wage levels.
In order to improve resident and workplace wages, seek to target improvements in:
Connectivity to higher value jobs across GM (with transport infrastructure and skills
being key enablers)
Business stock numbers
Inward investment
Oldham’s Local Economic Assessment – 2019. Labour Market and Skills Public Version v1 Page 4 of 40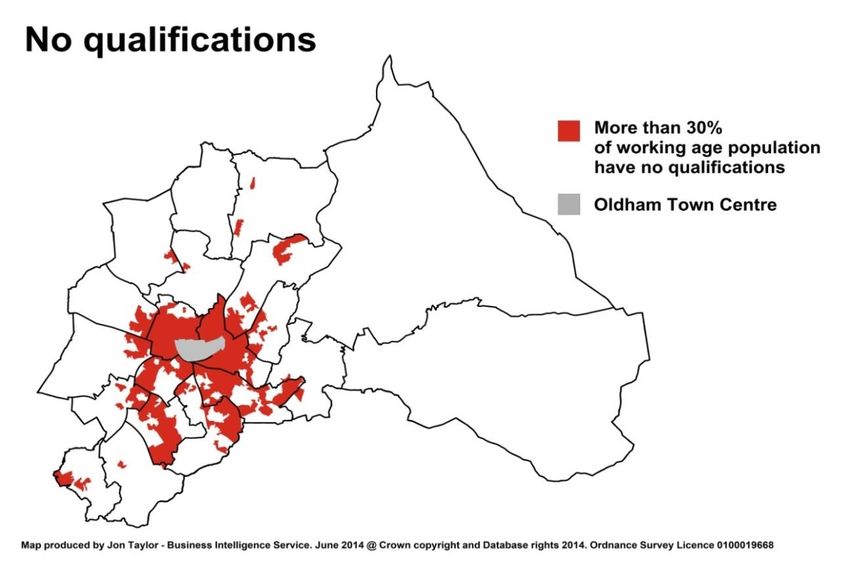
LABOUR MARKET
This chapter of the assessment looks to explore Oldham’s labour market and provide insight
on its wider interaction with the Greater Manchester economy. The diagram below illustrates
Oldham’s labour market as it stands.

Economic Activity
Typically, a high level of economic activity demonstrates that a high proportion of the
population are willing and able to supply their labour. Oldham (71.2%) has a smaller
proportion of its population economically active, compared to that of Greater Manchester
(76.4%) and England (78.7%).

Oldham is home to 104,000 residents, aged 16-64, and classed as economically active. That
means residents are employed, self-employed or unemployed. As previously identified,
Oldham’s economy only provides approximately 81,000 jobs; including for non-residents,
therefore there is a surplus of around 23,000 people that can’t be supported by the local
economy.

Figure 1 – Oldham’s Labour Market

Source:ONS – Annual Population Survey 2018

Oldham’s Local Economic Assessment – 2019. Labour Market and Skills Public Version v1   Page 5 of 40

Employment
High levels of employment are a key indicator that an economy is in good health. Oldham
(67.5%) has the lowest employment rate within GM, and is significantly lower than the
national average (75.4%). Within the GM region, Trafford (80.5%) has the highest
employment rate.

Figure 2 – Employment Rate by Local Authority

Source: Annual Population Survey 2017/18 & 2018/19

Oldham’s employment rate has changed over the years. In 2005, 72.5% of the working age
population were employed, which at the time was higher than the GM (70.3%) and only just
below the national average (73.0%). Since then Oldham’s economy was affected by the
recession and Oldham has only now started to see some form of recovery in their
employment rate.

Figure 3 – Employment Rate since 2005

Source: Annual Population Survey Mar 2005 – Dec 2018

Oldham’s Local Economic Assessment – 2019. Labour Market and Skills Public Version v1   Page 6 of 40
In comparison to men, women are less likely to work, particularly on a full-time basis.
However, as the chart below shows, the proportion of females employed in Oldham is
significantly lower than across GM and England. The difference between male and female
employment is larger in Oldham than compared with GM and England and this difference
has been consistent in Oldham overtime.

Figure 4 – Employment Rate by Gender

Source: Annual Population Survey 2018 & 2013

Analysing employment rates by age can provide further insight, and it is notable that across
all age groups, the employment rate is lower in Oldham, compared to the national average.
The aged 35-49 age band shows the largest difference in employment rate between Oldham
and GM. Oldham’s highest employment rate is in those aged 25-34, however the highest
employment rate for GM and England is in the aged 35-49 cohort. This age band could be a
key demographic cohort which could be targeted to improve employment.

Figure 5 –Employment Rate by Age

Source: Annual Population Survey Jan 2018 – Dec 2018

Oldham’s Local Economic Assessment – 2019. Labour Market and Skills Public Version v1   Page 7 of 40
Since 2005, the younger age cohort (16-24) had fared worst in terms of overall employment
rates and have seen the largest decreases. However, it is important to note that since 2015
all young people are required to stay in education or training until their 18th birthday, which
has significantly reduced the number of 16-18 year olds entering into employment. However,
the data does also suggesting that the younger generations are finding it more difficult to
access the labour market than their Greater Manchester and England average cohorts. It is
therefore important for Oldham to improve employment rates for this age group moving
forward. This analysis is also further validated by figure 6 below.

Figure 6 below illustrate the longitudinal fluctuations in the employment age bands in
Oldham. There has been a slow gradual long term change in the employment rate for
specific age bands. In 2005 the employment rate for the age band 16-24 was around 70%,
today that employment rate has fallen to just under 55%. Also the employment rate for those
aged 50-64 has steadily increased over the past decade.

Figure 6 –Trend in the Employment Rate by Broad Age Bands

Source: Annual Population Survey Mar 2005 – Dec 2018

Oldham’s Local Economic Assessment – 2019. Labour Market and Skills Public Version v1   Page 8 of 40
Across the borough there is a rich mix of people from different communities, cultures and
faiths, with almost 18% of the population being of Pakistani or Bangladeshi origin.
Employment rates within these communities are particularly low, suggesting there is
difficulties in accessing the local Labour market. However, in addition to this there is also a
cultural connection, as women (particularly the older generations) chose not to work.

Figure 7 – Employment Rate by Ethnic Group

Source: ONS 2011 Census & Annual Population Survey 2018

Some progress has been made in improving the employment rate for Oldham’s ethnic
minority groups, particularly over recent years.

Figure 8 – Employment Rate by Ethnic Group and Gender

Source: Annual Population Survey 2018

There is anecdotal evidence to suggest that there has been a gradual cultural shift amongst
young Pakistani and Bangladeshi women, towards accessing the labour market. However,
over the past year there has been a significant decrease in the employment rate of Pakistani
and Bangladeshi women. The data source is from a survey, which carries a certain
confidence interval.
Oldham’s Local Economic Assessment – 2019. Labour Market and Skills Public Version v1   Page 9 of 40
Full-time/Part-time Employment
Since the last recession there has been a large increase in the number of people working
part-time. This in part is a result of the more challenging economic conditions with limited
availability of jobs, particularly those which are full-time. This has not just been a pattern that
has taken place in Oldham, but is a national trend. However, over the past few years in
Oldham there has been an increase in the number of people working full time, which has
seen Oldham’s full time employment rate jump ahead of England and Greater Manchester.
Figure 9– Full-time Employment

Source: Annual Population Survey 2018

Within Oldham, the proportions of part-time work vary considerably by ward. Coldhurst
(48.2%), Werneth (43.6%) and St Mary’s (42.5%) have the largest proportions of residents
employed part-time. These wards are three of Oldham most deprived wards and are also
home to Oldham’s Pakistani and Bangladeshi populations.
Figure 10 – Part-time Employment by Ward

Source: ONS Census 2011
Oldham’s Local Economic Assessment – 2019. Labour Market and Skills Public Version v1   Page 10 of 40
Gendered patterns in employment rates are broadly the same across Oldham, Greater
Manchester and England. The data shows that women are significantly more likely to be in
part-time employment compared to men and this pattern has remained relatively unchanged
over the past 12 years. Child care responsibilities are the main determinant for a much
greater proportion of women working part-time compared to men. The vast majority of men
work full-time, compared to just over half of all women. More women work full-time than they
do part-time, however, unlike men, the differences between those working full and part-time
are not as stark. 4.4% more women work full time in Oldham than compared to the English
average, as a result fewer are working part-time in comparison to GM and England.
Figure 11 – Full-time/Part-time Employment by Gender

Source: Annual Population Survey Jun - 2018

Oldham’s Local Economic Assessment – 2019. Labour Market and Skills Public Version v1   Page 11 of 40
Travel to work
Oldham is a net exporter of labour (-7,203) with more people commuting out of the borough
each day (36,340) than commuting in (29,137). Oldham has strong labour market
interconnections with its neighbouring boroughs, particularly the City of Manchester, which
sees the greatest flow of labour out of Oldham (11,712). This represents nearly a third of
residents commuting out of Oldham. Oldham’s commuting flows with Tameside and
Rochdale are smaller than Manchester but more equal in terms of in and out flows as
highlighted in Figure 11. It is also notable that there is no significant out-commuting to
Yorkshire and only marginal in-commuting, despite Oldham’s gateway location. This
highlights the physical barrier presented by the Pennines that increases the time and cost of
travel to an extent that limits labour market interaction between Greater Manchester and
Leeds.

The relative net migration levels have not changed significantly between 2001 and 2011 but
there is a significant increase in mobility across Greater Manchester with more residents
working outside Oldham being offset by more GM residents travelling into Oldham to work.
Interestingly the significant exporting of labour is to Tameside (increased by 855 – 23%),
Stockport 539 – 47.5%), Bury (396 – 48.1%) and Trafford (324 – 19.3%). The inflow
dynamics is equally interesting with increases from Tameside (937 – 23.8%), Stockport (500
– 56.2%), Manchester (1551, 52.2%), Rochdale (1,189 – 17.4%). The Rochdale dynamic is
the most significant as there is a net increase of 850 people travelling into Oldham.

This data is drawn from the 2001 and 2011 Census, during which time the M60 circular had
been completed and pre-dates developments such as Kingsway. These travel-to-work
patterns reinforce the picture of Oldham having opportunities to further exploit its quality of
life offer in order to become a more successful commuter location (the current housing offer
doesn’t appear strong enough to attract professionals to live in Oldham and commute into
the conurbation core), whilst also needing to increase higher-value economic opportunities
internal.

Oldham’s Local Economic Assessment – 2019. Labour Market and Skills Public Version v1   Page 12 of 40
Figure 12 - Largest travel to work flows in and out of Oldham to/from the rest of the UK, 2011
BURY
BOLTON
1,220 from Oldham
610 from Oldham 1,911 to Oldham ROCHDALE
806 to Oldham
5,869 from Oldham
8,003 to Oldham
SALFORD
2,178 from Oldham
993 to Oldham
OLDHAM
(75,000 jobs available in Oldham)
45,863 live and work in Oldham
TRAFFORD KIRKLEES
29,137 commute in from outside Oldham
2,005 from Oldham 36,340 Oldham residents commute out 543 from Oldham
746 to Oldham 831 to Oldham
Net flow = -7,203
KEY
Live outside Oldham but work inside
Oldham.
Live inside Oldham but work outside
Oldham.
TAMESIDE
4,606 from Oldham
MANCHESTER Flow into Oldham greater than flow out
4,872 to Oldham of Oldham.
11,712 from Oldham
4,525 to Oldham STOCKPORT
Flow from Oldham greater than flow
1,673 from Oldham into Oldham.
Source: Census 2011 1,389 to Oldham
Oldham’s Local Economic Assessment – 2019. Labour Market and Skills Public Version v1 Page 13 of 40Unemployment Figure 13a below shows Oldham’s Claimant Count Unemployment rate to be consistently above GM and England. The 2008 recession was the cause for the increasingly high levels of unemployment up until 2013. Since 2013, the unemployment rate has declined and stayed relatively stable. That was up until Universal Credit Full-Service was rolled out in Oldham in June 2017, which resulted in a steep rise in the Claimant Count Unemployment rate. This rise was caused by a change in the unemployment definitions and the administration of the new benefit system. It has now become difficult to use the Claimant Count Unemployment rate as a proxy measure of unemployment. Figure 13a – Historic Claimant Count Unemployment Rate Source: DWP – Nov 2018 Figure 13b – Claimant Count Unemployment Rate vs APS Unemployment Rate Source: DWP : Jun - 2018 & Annual Population Survey : Jun - 2018 Oldham’s Local Economic Assessment – 2019. Labour Market and Skills Public Version v1 Page 14 of 40
Figure 13b on the previous page shows the Claimant Count Unemployment rate and the
Annual Population Survey (APS) Unemployment rate. The Claimant Count Unemployment
rate is not a true measure of unemployment. However, because it is an administrative
statistic it can be used to measure fluctuations within Oldham’s claimant count, causing it to
be a useful proxy measure of unemployment. The true measurement of unemployment is
that measured by the Annual Population Survey, because it uses the same methodology as
that used by the International Labour Organisation.

The APS Unemployment rate on figure 12b shows a downward post-recession
unemployment trend, similar to the Claimant Count Unemployment rate. The APS
Unemployment rate has recently fallen to similar levels as the Claimant Count
Unemployment rate. This is contradictory to the picture shown by the Claimant Count
Unemployment rate, signalling that Universal Credit Full-Service is primarily responsible for
the hike in the Claimant Count Unemployment rate.

Figure 14 – Unemployment (aged 16-64) by Local Authority
                                                                                          Full
Local                                       %      % Monthly                % Annual    Service
                    Unemployed
Authority                               Unemployed  change                   change     Launch
                                                                                          Date
Bolton                    7,100               4.0                3.6            17.3    Nov-18
Bury                      3,780               3.2                1.6            28.4     Jul-18
Manchester                15,960              4.1                1.8            34.6    Oct-17*
Oldham                    6,605               4.6               -0.8            9.5      Apr-17
Rochdale                  5,815               4.3                2.0            44.8    May-18
Salford                   6,250               3.8                2.6            29.7    Sep-18
Stockport                 4,075               2.3                0.7            20.7    Nov-18
Tameside                  5,420               3.9               -0.8            34.8     Mar-18
Trafford                  3,420               2.4                1.3            14.2     Jul-17
Wigan                     7,510               3.7                0.1            34.8     Apr-18
GM                        65,935              3.7                1.3            27.6        -
England                  929,435              2.7                1.6            26.5        -
Source: DWP – May 2019

The Claimant Count Unemployment rate in Oldham currently stands at 4.6% and is the
highest rate across Greater Manchester and significantly higher than the national average
(2.7%). This picture is skewed by Universal Credit Full-Service, as a result levels of
unemployment have increased in Oldham over the last 12 months (9.5%). Other local
authorities in the GM areas are feeling the earlier spikes of Universal Credit which Oldham
felt, such as Manchester, which has seen their unemployment levels increase by 34.6% over
the past year. It is safe to assume that Universal Credit is the primary cause of the 20% rise
in the Claimant Count Unemployment rate at the national level. Oldham remains in a
challenging position in terms of unemployment, but there has been a positive trend with a
narrowing of the gap to national rates.

Oldham’s Local Economic Assessment – 2019. Labour Market and Skills Public Version v1   Page 15 of 40
Youth Unemployment
Rates of youth unemployment in Oldham have also been consistently above those of the
Greater Manchester and England averages. Oldham’s youth unemployment rate started to
recover from the 2008 recession in early 2012, which saw youth unemployment drop in half
in just 3 years. There seems to be seasonal effects which have a stronger effect on youth
unemployment levels. During the ending of autumn and start of winter periods, youth
unemployment levels decreases, most probably due to fixed term employment contracts
spanning the Christmas period. This seasonal trend breaks as Universal Credit Full-Service
causes youth unemployment to rise. During the same seasonal period in 2017 we can
observe a cancelling out period as unemployment rates don’t fall and instead stay level.
Source: DWP – November 2018
The youth Claimant Count Unemployment rate in Oldham (which is being skewed by
Universal Credit Full-Service) currently stands at 7.3%, the highest rate across Greater
Manchester and significantly higher than the national average (3.5%). Youth unemployment
has increased considerably in Oldham over the last 12 months (7.1%), a smaller increase
than Greater Manchester (25.7%) and England (23.9%) averages. Youth unemployment in
Oldham is back to being higher than pre-recession levels. The continued rise in youth
unemployment has been one of the determining factors causing an increase in the overall
unemployment rate across Oldham.
% Youth % Monthly % Annual Full Service
Local Authority Youth Unemployed
Unemployed change change Launch Date
Bolton 1,355 5.8 1.9 8.0 Nov-18
Bury 725 5.2 -2.7 21.8 Jul-18
Manchester 3,005 3.4 -0.5 36.6 Oct-17*
Oldham 1,425 7.3 -2.7 7.1 Apr-17
Rochdale 1,235 6.8 1.2 50.6 May-18
Salford 1,175 4.7 5.4 37.4 Sep-18
Stockport 710 3.7 0.0 13.6 Nov-18
Tameside 1,095 6.3 -2.2 29.6 Mar-18
Trafford 600 3.9 -2.4 15.4 Jul-17
Wigan 1,440 5.9 -1.4 29.7 Apr-18
GM 12,760 4.8 -0.3 25.7 -
England 171,295 3.5 0.7 23.9 -
Source: DWP – October 2018
Oldham’s Local Economic Assessment – 2019. Labour Market and Skills Public Version v1 Page 16 of 40Economic and Social Impacts of Universal
Credit
These are some of the issues which have arisen as a result of Universal Credit and
associated sanctions1. These issues are sourced from a UK wide longitudinal study, which
affects Oldham Universal Credit service users also:
UC and Social Effects:
a) Universal Credit requires a broader span of people to look for work than was the
case for legacy benefits. The main reason for this is because more people fall under
the new definitions implemented by the administrative system.
b) As job centres move from ‘Live’ to ‘Full’ Service there is likely to be an increase in the
claimant count locally, reflecting the administration changes. This therefore
undermines the usefulness of the claimant count as showing labour market trends in
local areas2. As for Oldham, prior to Full-Service, the Claimant Count on April 2017
was 4225. However, as of November 2018 the Claimant Count is now 6475, which is
a 53.3% hike since Universal Credit Full-Service has been implemented.
c) New claimants who are awaiting or appealing Work Capability Assessments (an
assessment to determine whether claimants should receive Universal Credit through
disability eligibility) are being required to look for work. In the first half of 2018 there
were 919 completed Work Capability Assessment cases. This indicates that at some
point these 919 people were a part of the Claimant Count, which skews the Claimant
Count Higher.
d) According to the longitudinal study conducted by Welfare Conditionality, in-work
conditionality can be viewed as unfair and illogical and the requirements set by
Jobcentre Plus were in some cases at odds with the realities of the contemporary
labour market. Also, working recipients reported struggling to attend Jobcentre Plus
appointments and increasing their hours or work or number of jobs was ineffective in
moving them out of poverty or improving the quality of their work.
e) This heavy pressure to spend many hours taking ineffective action was not well
supported. For example, most UC recipients experienced ‘support’ as self-directed
(i.e. ‘do-it-yourself’ online job search), costly (using the expensive telephone line) or
inaccessible (claims are digital). There remains a need for effective support services.
Services which are personally tailored as each claimant’s situation is unique. An
example of a service within Oldham is the Get Oldham Working service, which helps
1
The following information is pulled from a report commissioned and prepared by the Welfare Conditionality
Organisation and the Economic Social Research Council and is the results of their longitudinal study on
Universal Credit, http://www.welfareconditionality.ac.uk/wp-content/uploads/2018/05/40414-Universal-
Credit-web.pdf. (Part of this study required longitudinal interviews with UC Participants and considering
Oldham was one of the first Local Authorities, within England to move onto Full-Service, it is entirely possible
that some of these interviews may have been with Oldham residents).
2
The ONS are currently unable to accurately take seasonal factors into account. This is because they do not
have information about how Universal Credit full service is impacted by movements in the labour market
throughout the year. Due to the limitations currently present in the claimant count, it has been reclassified by
the ONS as an experimental statistic.
Oldham’s Local Economic Assessment – 2019. Labour Market and Skills Public Version v1 Page 17 of 40to understand a job seekers situation and tailors the best help and approach to allow
them to successfully gain entry into the job market.
f) In-work conditionality can be viewed as unfair and illogical and the requirements set
by Jobcentre Plus were in some cases at odds with the realities of the contemporary
labour market.
g) Working recipients reported struggling to attend Jobcentre Plus appointments and
increasing their hours or work or number of jobs was ineffective in moving them out
of poverty or improving the quality of their work.
Sanctions:
a) The current sanctions regime is unfit for purpose because it has widespread and
deeply negative impacts on wellbeing whilst failing to improve employment outcomes
substantially or enable beneficial in work progression.
b) The application and threat of sanctions impacted negatively on in-work and out-of-
work UC recipients and did more harm than good in terms of gaining or progressing
in work.
c) The stringent sanctions regime does ensure compliance with conditionality
requirements, but could be counterproductive in creating unnecessary barriers to
paid work.
d) Working recipients experienced financial hardship, were forced to use food banks,
accumulated debt or risked losing their homes because of arrears and had worsening
physical and mental health.
Oldham’s Local Economic Assessment – 2019. Labour Market and Skills Public Version v1 Page 18 of 40Sanctions
As of May 2017, DWP now publish Universal Credit sanction statistics along with Job
Seekers Allowance (JSA), Employment Support Allowance (ESA) and Income Support (IS)
sanctions. Claimants of UC were being sanctioned as far back as 2015, but it has taken
DWP several years to publish this data. JSA sanctions, whilst still ongoing, are at a relatively
low level compared to UC sanctions.
Figure 15 below shows that as of May 2019, Oldham has the highest Universal Credit
sanction rate (4.8%) across Greater Manchester and is lower than the national average
(3.5%). UC sanction rates vary significantly across GM; where Stockport has the lowest rate
(0.6%) in this month. It is hard to correlate this picture with deprivation, and we might
hypothesise that individual Job Centre Plus practice is a factor.
Figure 15 - Universal Credit Sanction Rates: May 2019
UC Claimants eligible Number of UC GM Rank
Local Authority Sanction Rate (%)
for sanctions Sanctions (1 = highest)
Bolton 4,808 65 1.4 9
Bury 3,050 74 2.4 6
Manchester 14,126 467 3.3 3
Oldham 6,158 295 4.8 1
Rochdale 4,769 150 3.1 4
Salford 4,678 91 1.9 8
Stockport 2,845 17 0.6 10
Tameside 4,756 213 4.5 2
Trafford 3,007 81 2.7 5
Wigan 6,133 131 2.1 7
GM 54,330 1,584 2.9 -
England 739,090 26,093 3.5 -
Source: DWP – 2019
Why are claimants sanctioned?
The top three reasons for receiving a sanction are:
1. Failed to comply with work focus interview requirements 69%
2. Failed to undertake all reasonable work search 17%
3. Failed to comply with a work preparation requirement 7%
Severity of Sanctions
82% of UC sanctions in Oldham were “Low”, 14% “Medium”, 2% “High” and 2% “Lowest”.
England as a whole has slightly more “Lowest” (8%), but less “Low” sanctions (76%).
Oldham’s Local Economic Assessment – 2019. Labour Market and Skills Public Version v1 Page 19 of 40Trends in Universal Credit Sanctioning Sanctions in Oldham arw currently trending at over 300 per month, a historically very high figure. Sanctions rates in Oldham are also significantly higher than GM and national comparators. Sanctions rates have risen partly because of more rigorous conditionality regimes under UC, but other factors must also be involved. Figure 16 – Trend in Universal Credit Sanctions Source: DWP 2019 Oldham’s Local Economic Assessment – 2019. Labour Market and Skills Public Version v1 Page 20 of 40
Economic Inactivity
Oldham is home to around 42,300 residents aged 16-64 and classed as economically
inactive. That means residents are either not in work, not looking for work or are not
available to start work. 15,900 of those economically inactive are male and 26,400 are
female. The aforementioned females are the largest proportion of Oldham’s economically
inactive population, which have a long term illness, many of whom have never been in
employment. Others may have voluntarily left the labour market; reasons for this might
include early retirement or care responsibilities.

However, some of the economically inactive population would like to work, but might need
additional support to do so, including lone parents and/ or those with disabilities. Recipients
of these other out-of-work benefits (who are currently being moved onto Universal Credit) –
e.g. Incapacity Benefit/ESA - are far less affected by short term economic cycles, since the
majority face personal and structural barriers to employment – including lack of skills, poor
health or caring responsibilities.

Long Term Sickness
People who are unable to work due to long term illness or disability are able to claim an out
of work benefit known as Employment Support Allowance (ESA). ESA replaced Incapacity
Benefit (IB) / Severe Disablement Allowance (SDA) in 2008. In Oldham there are currently
11,260 residents (12.7%) in receipt of ESA, a lower rate than that off Greater Manchester
average (15.6%) but slightly higher than the England average at (11.6%). Within Greater
Manchester, Manchester has the highest rate (21%). Figure 17 below shows Oldham having
the largest drop in ESA cases because of individuals on ESA shifting to Universal Credit
Full-Service and an increase in the overall cohort size.

Figure 17 - Employment Support Allowance Claimants by Local Authority

Source: DWP – 2014, 2016 and 2018

Oldham’s Local Economic Assessment – 2019. Labour Market and Skills Public Version v1   Page 21 of 40
Within Oldham there is concentration of ESA claimants, typically in areas of high deprivation,
and where there are large proportions of social housing such as the Barker Street Estate, St
Mary’s Estate and Greenacres.

Figure 18 – Employment Support Allowance Claimants in Oldham

Source: DWP – 2018

Oldham’s Local Economic Assessment – 2019. Labour Market and Skills Public Version v1   Page 22 of 40
Out of work benefit claimants
Out-of-work benefits claimants include both those individuals classed as economically active
(job seekers) and economically inactive (Employment Support Allowance claimants, Lone
Parent claimants and others on income related benefits). As of April 2018, Oldham has
12.3% of its working age population claiming an out of work benefit. This is slightly above the
Greater Manchester figure of 11.2% but significantly higher than the England average of
8.3%. Since early 2013, the percentage of out of work benefit claimants in Oldham, Greater
Manchester and England has fallen, most specifically until late 2014 the gap between
Oldham and GM has closed marginally. Since 2014, although the numbers for all 3
geographies have fallen slightly, the gap has stayed more or less consistent.

Figure 19 – Percentage of Out of Work Benefits Claimants

Source: DWP & ONS – 2018

Figure 20 below shows reduction across the board for certain out of work benefits such as
ESA (Employment Support Allowance), IS (Income Support), JSA (Job Seekers Allowance),
PC (Pension Credit). The roll out of Universal Credit (single benefit system) has slowly
shifted all other out of work Legacy Benefits onto Universal Credit. Starting early 2015,
Universal Credit Part-Service starts rolling into effect, then in April 2017 Universal Credit
Full-Service was implemented. PC, JSA and IS have nearly all been moved onto Universal
Credit, which will only leave ESA claimants to be moved onto Universal Credit.

Oldham’s Local Economic Assessment – 2019. Labour Market and Skills Public Version v1   Page 23 of 40
Figure 20 – Out of Work Benefits Claimants in Oldham

Source: DWP – 2018

Within Oldham there is huge disparity in where the greatest concentration of benefit
claimants reside. Coldhurst, St Mary’s Estate, Limehurst and other similar deprived
communities across Oldham face a range of barriers. These include poor health, inadequate
housing, poverty, lack of education, skills and ethnicity.

Figure 21 – Map of Out of Work Benefits Claimants in Oldham

Source: DWP – 2018

Oldham’s Local Economic Assessment – 2019. Labour Market and Skills Public Version v1   Page 24 of 40
Looking after home
In Oldham there are a larger proportion of economically inactive residents who are not
interested in finding employment and instead choose to look after their home. The table
below shows that Oldham has a larger proportion than the GM and the national averages.
The vast majority of residents who do choose to look after their home are female.
Figure 22 – Looking after home by Local Authority (aged 16-64)
                  Looking after
                                Number of                 Number of         % Looking after home
                  home aged
  Local Authority 16-64         Males                     Females               aged 16-64

                             Jun-18              Jun-18      Jun-18          Jun-17      Jun-18
Bolton                       26800               10700       16100             21.4       24.7
Bury                         44300               18900       25400             30.4       22.5
Manchester                   103100              42600       60400             22.2       25.7
Oldham                       42300               15900       26400             30.0       29.8
Rochdale                     34800               13900       20900             26.1       25.9
Salford                      33000               12200       20800             16.8       21.1
Stockport                    31900               13300       18600             24.6       23.0
Tameside                     33000               12600       20300             27.2       25.7
Trafford                     25900                9500       16400             24.2       24.9
Wigan                        44400               18800       25600             22.8       22.3
GM                           419500              168600      250900            24.3       24.7
England                     7428000             2833500     4594500            25.5       24.9
Source: Annual Population Survey Jul 2017 - Jun 2018

Oldham has a larger proportion because of its large South Asian population, where culturally
it’s more common for women to choose not to take paid employment. It is noticeable that
over the decade prior to 2011 proportions of people choosing not to work are decreasing
across all ethnic groups.
Figure 23 – Looking after home by Ethnic Group in Oldham

Source: ONS 2001 and 2011 Census

Oldham’s Local Economic Assessment – 2019. Labour Market and Skills Public Version v1   Page 25 of 40
Household Income
The median household income for Oldham in 2016 was £23,606, which is lower than the
Greater Manchester (£25,629) and Great Britain (£33,446) averages. Within Greater
Manchester the Median Household Income varies from £22,363 in Manchester up to
£35,223 in Trafford.
Figure 24 – Median Household Income by Local Authority
Mean Median
Local Authority
Income Income
Trafford £43,622 £35,223
Stockport £40,797 £32,994
Bury £36,356 £29,153
Wigan £32,196 £25,415
Bolton £31,706 £24,565
Tameside £30,728 £24,300
Oldham £30,498 £23,606
Salford £30,449 £23,459
Rochdale £29,709 £22,877
Manchester £29,104 £22,363
GM £33,100 £25,659
Great Britan £39,227 £31,446
Source: Paycheck data, CACI 2018
The chart below compares the household income profiles of Oldham and Great Britain by
£10k bands for 2016. When compared to England, Oldham has a greater proportion of
households falling into the two lowest income bands, particularly the second lowest band
where 25.9% of all Oldham households have a median income less than £20,000, compared
to 20.2% nationally. At the same time, Oldham has a smaller proportion of households in the
highest income bands.
Figure 25 – Household Income by Income Bands
Source: Paycheck data, CACI 2018
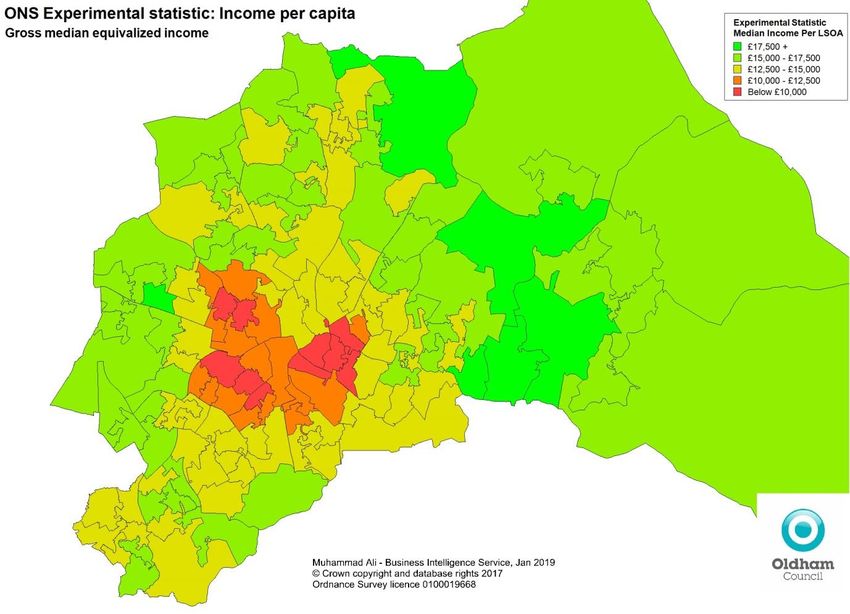
Oldham’s Local Economic Assessment – 2019. Labour Market and Skills Public Version v1 Page 26 of 40At ward level, there is an income gap of around £25,000 between Saddleworth North– the most affluent Ward, where median annual incomes are around £41,316 – and Alexandra – the least affluent with an income of only £15,490 per annum. Like many parts of post- industrial urban Britain, Oldham has a complex mix of relatively affluent and poor areas. The poorest of these are concentrated in the inner urban wards such as Coldhurst, St Mary’s, Alexandra and Werneth, whilst the most affluent wards are found in the more rural eastern half of the borough. The income disparity and inequality is increasing wider year upon year. Figure 26 – Median Household Income by Ward Source: CACI – 2018 The chart below further illustrates the uneven distribution of household income within Oldham. The large concentration of low income households, which are marked in red, mainly surround the town centre, whilst the more affluent areas (green and Blue) are located towards the outer periphery of the borough. Figure 27a – Map of Median Household Income in Oldham Source: CACI – 2018 Oldham’s Local Economic Assessment – 2019. Labour Market and Skills Public Version v1 Page 27 of 40
Figure 27b – Map of Median Household Income in Oldham

Source: ONS – 2018

Figure 27b above is an alternate experimental ONS dataset, which shows the equivalized
median income at the LSOA level, which is derived from multivariate analysis by household
composition. In the case of Figure 27b the median income is derived from the 50 th percentile
across LSOA’s in Oldham. The lowest median income areas are in and around the town centre
area, which is home to some of the Asian communities within Oldham. It is important to note
that this experimental statistic would not take those whom are self-employed into account. As
a result, as a significant number of those employed within Asian communities are self-
employed, the statistics under-represent the actual median income.

Oldham’s Local Economic Assessment – 2019. Labour Market and Skills Public Version v1   Page 28 of 40
Wages
Whereas income data includes welfare benefits as part of household income, earnings data
only reflects wage levels paid by employers. Oldham has traditionally had low wage levels in
terms of residents and work place earning potential (as measured by median weekly wage
levels).This is likely a reflection on the industry mix within Oldham and the relative skill levels
of the local workforce.

Wages for both residents (£476 a week) and those working in Oldham (£481 a week) remain
significantly below the Greater Manchester (£522 and £499 a week) England averages
(£575 and £575 a week respectively). Across GM, Trafford has the highest weekly resident
wage (£648), whereas Manchester has the highest workplace wage (£556).

Figure 28 - Resident and workplace earnings, full-time workers, median wages, 2018
                                      Resident                                                      Workpalce
   Local
  Authority                                               Part-Time                                                    Part-Time
                    Annual             Weekly                                   Anually              Weekly
                                                           Hourly                                                       Hourly
                         % Change            % Change            % Change              % Change           % Change            % Change
                2018     from 2017   2018    from 2017   2018    from 2017    2018     from 2017   2018   from 2017   2018    from 2017
Bolton         £29,374     6.2        £544      0.5      £9.2      -7.2      £26,369     10.0      £513      8.2      £8.8       3.0
Bury           £24,972     2.5        £496      5.2      £8.9      -3.1      £24,731      2.4      £491      5.6      £9.2       2.3
Manchester     £25,660     2.6        £493      3.0      £8.6       1.3      £29,639     -1.0      £556     -2.6      £9.1      -4.3
Oldham         £25,000     0.4        £476     -0.8      £9.1      -2.2      £25,281     11.3      £481      4.5      £9.0       5.1
Rochdale       £24,869     1.1        £487      4.9      £8.7       1.6      £23,658      4.4      £457      2.8      £8.7       4.9
Salford        £26,200     0.4        £500      2.2      £8.8       5.3      £27,797     -0.8      £535      2.6      £9.0       4.2
Stockport      £30,868     6.3        £575      1.5      £9.2       2.1      £27,544      1.5      £539      3.8      £8.6       0.5
Tameside       £24,405     0.5        £480      0.4      £8.8      -2.8      £23,506     -3.3      £479      2.7      £9.3       0.3
Trafford       £33,615     4.9        £648      6.8      £10.0      1.4      £27,565     -0.2      £534      3.3      £9.0       4.9
Wigan          £27,012     0.2        £523      1.4      £8.7       1.4      £24,942      3.0      £488      2.9      £8.6      -2.6
GM             £27,198     2.6        £522      2.6      £9.0      -0.3      £26,103      2.5      £507      3.2      £8.9       1.7
England        £29,869     2.7        £575      3.4      £9.4       2.9      £29,872      2.7      £575      3.4      £9.4       2.9
Source: ONS - Annual Survey of Hours and Earnings 2018

However, over the last 15 years, resident and workplace wages have increased. Positively
for Oldham, these increases have been more pronounced in Oldham than across GM and
England.

Figure 29 – Change in weekly Resident and Workplace wages since 2011

Source: ONS - Annual Survey of Hours and Earnings 2018

Oldham’s Local Economic Assessment – 2019. Labour Market and Skills Public Version v1                         Page 29 of 40
For the first time since 2010 workplace wages have slightly exceeded resident wages, indicating that below average earning residents do not have to leave the borough to receive a better paying job. It is likely that these residents live in the eastern half of the district, where skill levels are much higher and average household incomes are higher than the rest of the borough. Between 2002 and 2016 annual wage levels have been relatively static, a consequence of the previous recession in 2008. However, since 2014, wages have started to show some growth in Oldham, Greater Manchester and across England. The increases have been marginally more pronounced in Oldham, which has resulted in a slight narrowing of the wage gap between Oldham’s average wage and the England average. However when splitting the wages by gender, the order of England, Greater Manchester and Oldham is lost as women are paid similar across the entire UK, with Oldham female annual wages slightly deviating lower over the past few years. Figure 30 – Change in Annual Resident wages since 2008 Source: ONS - Annual Survey of Hours and Earnings 2018 For Oldham to increase its average wage levels, it is important that the majority of new jobs created are of a quality to ensure they are paid above the current median wage. Average wages vary considerable by sector. As outlined in the previous chapter, it was forecasted via the Greater Manchester Forecasting model (GMFM 2017) that over the next 20 years there will be 3800 new jobs created in Oldham. Oldham’s Local Economic Assessment – 2019. Labour Market and Skills Public Version v1 Page 30 of 40
The majority of these new jobs will be in the construction, professional services, Health and
Social Care and Business Services. Using these forecasts it is therefore possible to project
future wage levels in Oldham. As the chart below shows, wage levels over the next 20 years
are unlikely to change a great deal, but do show a marginal rise in wages (1%). This data
suggests that if wage levels in Oldham are to rise with any purpose then there needs to be a
real significant structural change in the economy.

Figure 31 – Forecast Change in Wages

Source: GMFM – 2017

Oldham’s Local Economic Assessment – 2019. Labour Market and Skills Public Version v1   Page 31 of 40
Skills and Qualifications
Skills are one of the most important determinants of socio-economic outcomes. Skills are not
only an important route out of poverty for individuals, but a key driver of economic prosperity.
Skills enhance productivity and competitiveness and are linked to attracting higher valued
businesses and the creation of jobs.

Supply of Skills
Successful economies require a highly qualified workforce. Oldham has traditionally had a
weak skills base, a legacy of generations of manual employment, and means that Oldham
residents have found it disproportionally difficult to enter new growth sectors over recent
years. This has made it difficult for Oldham to attract the inward investment that it is looking
for to improve its own economic base and act as a labour market for the rest of Greater
Manchester.

GCSE Attainment
Educational attainment at GCSE is seen as the first step in terms of developing the high
level of skills needed by the economy. Ensuring that pupils leave school equipped with good
and relevant qualifications is therefore a key priority. There has been a change in the
grading system from GCSE letter grades to numbering grades. The grading below is a
strong A to C GCSE equivalent which is an attainment score of 9 to 5.
The table below shows that within Greater Manchester, Oldham has the 3rd lowest
percentage of pupils leaving school with 5 GCSE’s (grades 9 to 5) including English and
Maths. GCSE attainment in Oldham is also below the national average.

Figure 32 – GCSE Attainment by Local Authority 2017/18

Source: Department for Education (DfE) 2018

This improvement enabled Oldham to close the gap towards the national average, which in
2012 totalled 59.4% However, over the next two years, attainment levels fell, particularly
during 2014. This trend has been attributed to a change in the methodology of GCSE
exams, and a similar trend has also taken place nationally.

Oldham’s Local Economic Assessment – 2019. Labour Market and Skills Public Version v1   Page 32 of 40
As of 2015/16, the proportion of pupils in Oldham achieving 5 GCSE’s (grades A* to C and
9-5) including English and Maths totalled 51.6%, compared to the England average of
57.7%, which has resulted in a widening of the gap.
However there has been a significant drop in Oldham’s attainment levels and all other
attainment levels across the entire UK. The reason for this is because of a change in the
Classification of GCSE levels from letter grading to number grading. It is important to
remember that the data for year 2017/18 on Figure 33 below is the new attainment score as
the old GCSE lettering grade system has been stopped. Therefore, the change over time for
the last year shown below is less representable of changes in achievement rates.

Figure 33 – Trend in GCSE Attainment since 2010

Source: Department for Education (DfE) 2010 to 2018

Adult Skills
The current position of Oldham’s working age population can been seen in the table below. It
highlights that Oldham has both a higher proportion of residents with no qualifications and
fewer residents holding degree level qualifications or higher compared to the Greater
Manchester, North West and national averages.

Figure 34 - Qualifications of the working age population (16-64) - 2017
                                                                           Other             No
                          NVQ 4+        NVQ 3+        NVQ 2+   NVQ 1+
    Local Authority                                                     Qualifications Qualifications
                            (%)           (%)           (%)      (%)
                                                                             (%)            (%)
    Bolton                  39.9          58.5         74.4     85.4         6.2            8.4
    Bury                    34.3          54.3         71.0     81.3         6.6            12.0
    Manchester              39.9          58.5         72.7     82.3         6.6            11.1
    Oldham                  27.5          48.9         66.9     79.0         7.9            13.1
    Rochdale                25.2          46.7         68.0     81.4         6.7            11.9
    Salford                 30.9          51.1         68.4     80.8         8.8            10.4
    Stockport               42.8          61.3         79.0     90.4         4.4            5.2
    Tameside                26.2          46.1         69.1     82.6         6.5            10.9
    Trafford                50.6          67.4         82.2     91.9         3.7            4.4
    Wigan                   26.8          51.4         74.5     87.1         5.3            7.6
    GM                      35.0          55.0         72.8     84.1         6.3            9.6
    Great Britan            38.3          57.1         74.6     85.5         6.9            7.6
Source: ONS Annual Population Survey 2018
Oldham’s Local Economic Assessment – 2019. Labour Market and Skills Public Version v1       Page 33 of 40
Qualifications Working age people with no qualifications will find it more challenging to find work, especially work that is well paid. Oldham has a significantly higher percentage of its working age population with no qualifications, which is a major issue for Oldham. Tackling this gap must a prime objective to enhance economic prosperity to the area and enable Oldham to compete with other Local Authorities in attracting new businesses to the area. Analysis of the map below highlights the inequality found within Oldham. Large proportions of the unskilled population live in close proximity to the town centre. It is no coincidence that these neighbourhoods also suffer with high levels of unemployment, no doubt impacted by the more challenging nature of accessing the labour market without any qualifications. Figure 35 – Oldham Residents (16-64) with No Qualifications Source: ONS 2011 Census Inequalities also exist between the different ethnic groups within Oldham. The Pakistani and Bangladeshi heritage residents have significantly higher proportions of residents aged 16 and over with no qualifications. Oldham’s Local Economic Assessment – 2019. Labour Market and Skills Public Version v1 Page 34 of 40
Figure 36 – Oldham Residents (16-64) with No Qualifications by Ethnic Group

Source: ONS 2011 Census

The reason why there are a disproportionately high percentage of no skills within the Asian
community is linked closely with age. The chart below identifies that 53.8% of all Asian
residents aged 35 and over in Oldham are without any qualifications. This is more than
double the rate of the white population (22.9%), and other BME population (22.3%).

Figure 37 – Oldham Residents (16-64) with No Qualifications by Age and Ethnic Group

Source: ONS 2011 Census

Oldham’s Local Economic Assessment – 2019. Labour Market and Skills Public Version v1   Page 35 of 40
At the other end of the skills spectrum, obtaining a degree or equivalent level of qualification
is going to enhance the opportunities for individuals to find work and be employed in higher
paid jobs. The data shows clearly that Oldham has a significant deficit in the percentage of
the working age population with a level 4 qualification (or above), compared to the GM and
national averages. This signals that there is a shortage of high end skills available in the
borough.
Since 2011, Oldham has increased the proportion of residents with a degree level
qualification, but the chart below shows, the gap between Oldham and that of GM and
England hasn’t narrowed over time. It’s important to remember that breaking sample sizes
down to local authority level does decrease their statistical significance.
There is also some evidence to suggest that Oldham’s talent is being drained by the lure of
higher skilled and higher payed jobs in areas such as Manchester that has a greater
availability of graduate level jobs, which Oldham is in relative shortage of.

Figure 38 – % of Residents with a Level 4 Qualification

Source: ONS 2015, Annual Population Survey

Unless there is a significant increase in the availability of local graduate level jobs it will be
difficult to address this loss of skills through migration. However, improving the proportion of
Oldham residents with a degree level qualification and narrowing the gap towards the
national average must be a priority for Oldham moving forward.

Oldham’s Local Economic Assessment – 2019. Labour Market and Skills Public Version v1   Page 36 of 40
Figure 38 – Oldham participation at different qualification levels

Source: Department of Education 2018

The chart above shows the number of Adults in Oldham participating in different course
levels. There is a general trend which shows that the number of adults in Oldham
participating in courses which are Full Level 2 and below has dropped over the past few
years. Especially those courses which have no level assigned (no level assigned courses
are either not accredited by the Department of Education or have level assigned to them by
the governing body) has seen a significant drop over the past few years. However the
parallel is seen when looking at courses which are Level 3 and above. Adult participation in
Level 3 and Level 4 courses has increased over the past few years.

There seems to be some kind of social divide in Oldham where low skilled adults are
participating less in comparison higher skilled adults. This maybe the case because the
adults which participate in Level 2 and below qualifications feel as though their effort will be
for nothing and the chance of converting their skills set into above average paid employment
prospects looks slim.

According to the most recent update of Greater Manchester’s (GM) Local Industrial Strategy
(LIS), one of the panel’s recommendations is a broader partnership for education, skills and
training, which could be important if Oldham is proportionately included as the populous of
Oldham feel like an organisation which feel disenfranchised isolated by larger organisation
within the GM region.

According to the LIS update, there is going to be a focus on GM’s strengths, which are
advanced materials, health innovation, manufacturing, digital and creative industries and
professional services. It is difficult to see if this is going translate to a shared movement of
industry around the GM region, more specifically Oldham, in order to facilitate high skills
residents here. If the bulk of the change stated by LIS will take place in and around the
current larger industrial sites in GM, then Oldham will remain an exporter of high skilled
employment.

Oldham’s Local Economic Assessment – 2019. Labour Market and Skills Public Version v1   Page 37 of 40
University Data 3
For copyright reasons university student level data (HESA) is not available in the public
version of the Local Economic Assessment.

3
    Source(s): HESA Student Record 2015/16; HESA Student Record 2014/15; HESA Student Record 2013/14; HESA Student
Record 2012/13; HESA Student Record 2011/12; HESA Student Record 2010/11; HESA Student Record 2009/10; HESA Student
Record 2008/09; HESA Student Record 2016/17; HESA Student Record 2017/18.
Copyright Higher Education Statistics Agency Limited. Neither the Higher Education Statistics Agency Limited nor HESA
Services Limited can accept responsibility for any inferences or conclusions derived by third parties from data or other
information supplied by HESA Services.
Oldham’s Local Economic Assessment – 2019. Labour Market and Skills Public Version v1                    Page 38 of 40
You can also read