Marco Polo D7.3 Plan for exploitation of the project results
←
→
Page content transcription
If your browser does not render page correctly, please read the page content below
Ref.: ISARD_7FP_MPOLO_BP_307
                                      Issue: 1.0 / Date: 29 March 2017
                                                               Page: 1

                           Marco Polo

D7.3 Plan for exploitation of
         the project results
                        – Business Plan –

                         Reference: ISARD_FP7_MPOLO_BP_307
                                                   Issue: 1.0

                        Prepared by: Maite Muñoz, Bernat Martinez

                   Approved by: Bernat Martinez, Ronald van der A

                                                Date: 29 March 2017
            Activity: Marco Polo project. FP7 Programme. Id:606953
Ref.: ISARD_FP7_MPOLO_BP_307
                                                 Issue: 1.0 / Date: 29 March 2017
                                                                          Page: 2

This page has been intentionally left blank

                      Marco Polo – Plan for exploitation of the project results
Ref.: ISARD_FP7_MPOLO_BP_307
                                                                                  Issue: 1.0 / Date: 29 March 2017
                                                                                                           Page: 3

                                                   Change Record
        Date            Issue      Section         Page                              Comment

   29 March 2017         1.0          all           all        Initial Issue

                                            Control Document
              Process                               Name                                        Date

Written by:                     Bernat Martínez, Maite Muñoz                         27 March 2017

Checked by:                     Laia Romero                                          28 March 2017

Approved by:                    Ronald van der A                                     29 March 2017

                                                   Marco Polo – Plan for exploitation of the project results
Ref.: ISARD_FP7_MPOLO_BP_307
                                                                                                                       Issue: 1.0 / Date: 29 March 2017
                                                                                                                                                Page: 4

Table of Contents
1   AIR QUALITY SYSTEMS IN CHINA ............................................................................................................... 7
    1.1INTRODUCTION............................................................................................................................................... 7
    1.2LEGAL FRAMEWORK ..................................................................................................................................... 10
    1.3MONITORING AND FORECASTING AQ INFORMATION ....................................................................................... 10

2   MARCO POLO PROJECT RESULTS .......................................................................................................... 15
    2.1EMISSIONS INVENTORY................................................................................................................................. 15
    2.2ENSEMBLE AIR QUALITY FORECAST SERVICE ................................................................................................ 18

3   THE MARKET ............................................................................................................................................... 21
    3.1STAKEHOLDERS INTERVIEWS ........................................................................................................................ 21
    3.2MARKET REPORTS ....................................................................................................................................... 22
    3.3ENVIRONMENTAL/INDUSTRY ANALYSIS ........................................................... ERROR! BOOKMARK NOT DEFINED.

4   CUSTOMERS ................................................................................................................................................ 25

5   SWOT ANALYSIS ......................................................................................................................................... 28

6   COMPETITORS ............................................................................................................................................ 29

7   THE EXPLOITATION PLAN ......................................................................................................................... 30

8   BUSINESS PLAN .......................................................................................................................................... 31

9   ANNEXES ..................................................................................................................................................... 34
    ANNEX A: LIST OF EMCS WEBSITES ................................................................................................................... 34
    ANNEX B: EXAMPLES OF EMCS WEBSITES ......................................................................................................... 37

                                                                                 Marco Polo – Plan for exploitation of the project results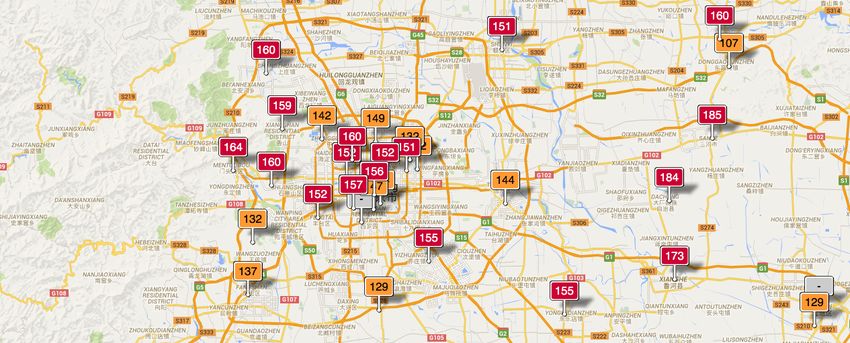
Ref.: ISARD_FP7_MPOLO_BP_307
                                                                                                                        Issue: 1.0 / Date: 29 March 2017
                                                                                                                                                 Page: 5

List of Tables
Table 1.1: Environmental depletion and degradation (% of GNI). Source: World Bank. ......................................... 7

Table 1.2: Air Pollution Action Plan (Source: MEP, Goldman Sachs) ................................................................... 10

Table 1.3: Chinese Air Quality Index and their classes associated (Source: AirInform) ....................................... 12

Table 1.4: Chinese Air Quality Index and health implications (Source: MEP) ....................................................... 13

Table 2.1: Product description ............................................................................................................................... 16

Table 2.2: Product description ............................................................................................................................... 19

Table 3.1: Marco Polo Stakeholders visits ............................................................................................................ 21

Table 5.1: S.W.O.T Analysis ................................................................................................................................. 28

Table 6.1: Competitors .......................................................................................................................................... 29

Table 7.1: Exploitation Plan actions ...................................................................................................................... 30

Table 8.1: Three year business plan. Costs are in Keuro ..................................................................................... 33

Table 9.1: Catalogue of environmental monitoring regional centres ..................................................................... 36

                                                                                   Marco Polo – Plan for exploitation of the project results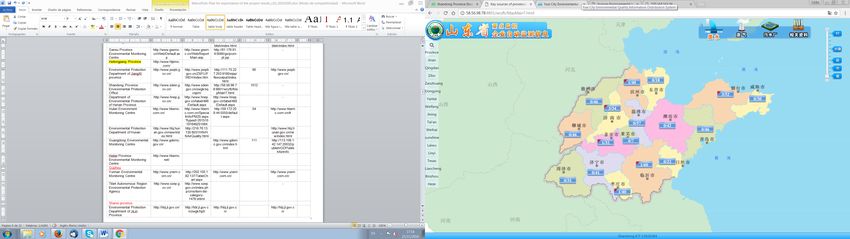
Ref.: ISARD_FP7_MPOLO_BP_307
                                                                                                                              Issue: 1.0 / Date: 29 March 2017
                                                                                                                                                       Page: 6

List of Figures
Figure 1.1: China Top Concerns (Source: Pew Research Center). ........................................................................ 8

Figure 1.2: Real-time Air Quality Index based on on-ground monitoring stations. China. (Source: AQICN, 17 May
2016 16:00h) ........................................................................................................................................................... 9

Figure 1.3: Real-time Air Quality Index based on on-ground monitoring stations. Beijing city. (Source: AQICN, 17
May 2016 16:00h).................................................................................................................................................... 9

Figure 1.4: Sample of Air Quality Index Apps search in Google Play market. (Source: Google Play, 17 October
2016 12:00h) ......................................................................................................................................................... 11

Figure 1.5: Examples of Air Quality Index Apps for China. (Sources: AQICN App, Fresh Ideas Apps and
CastStudio Apps)................................................................................................................................................... 11

Figure 1.6: Distribution of the 6 main pollutants according to their classes. 2015. China (Source: CNEMC) ....... 12

Figure 1.7: CNMEC Regional Forecast Operating System (Source: CNEMC) ..................................................... 14

Figure 2.1: Comparison of Marco Polo and MIX-MEIC emission inventories........................................................ 17

Figure 2.2: Sector split of the yearly total emissions contained in the low resolution MarcoPolo emission
inventory. ............................................................................................................................................................... 17

Figure 2.3: (Left) Forecasted time series for Shanghai. The red line shows the average concentration of this air
pollutant taken from the available stations for this city. The values are taken from www.pm25.in. The grey line
shows the median of the models of the simulated air quality. The grey shaded area indicates the range of the
model predictions. (Right) Gridded 24h-average ensemble forecast for the Shanghai area................................. 20

Figure 3.1: Market geographical distribution of the Air quality control systems (Source: MarketandMarket). ....... 22

Figure 9.1: Air Quality report from Gansu EMC (Source: http://www.gsemc.cn/Web/ReportMain.asp . Consulted
21/11/2016 16:35) ................................................................................................................................................. 37

Figure 9.2: Air Quality map report from Gansu EMC (Source: http://61.178.81.9:8080/gs/prompt.jsp . Consulted
21/11/2016 16:37) ................................................................................................................................................. 38

Figure 9.3: Air Quality report from Fujian EPB (Source: http://fbpt.fjemc.org.cn/. Consulted 21/11/2016 16:50) 38

Figure 9.4: Air Quality report from Shandong EPB (Source: http://www.sdein.gov.cn/zwgk/sqcspm/ . Consulted
21/11/2016 17:10) ................................................................................................................................................. 39

Figure 9.5: Air Quality report from Jilin EMC (Source: http://hbj.jl.gov.cn/ . Consulted 21/11/2016 17:15).......... 40

                                                                                       Marco Polo – Plan for exploitation of the project results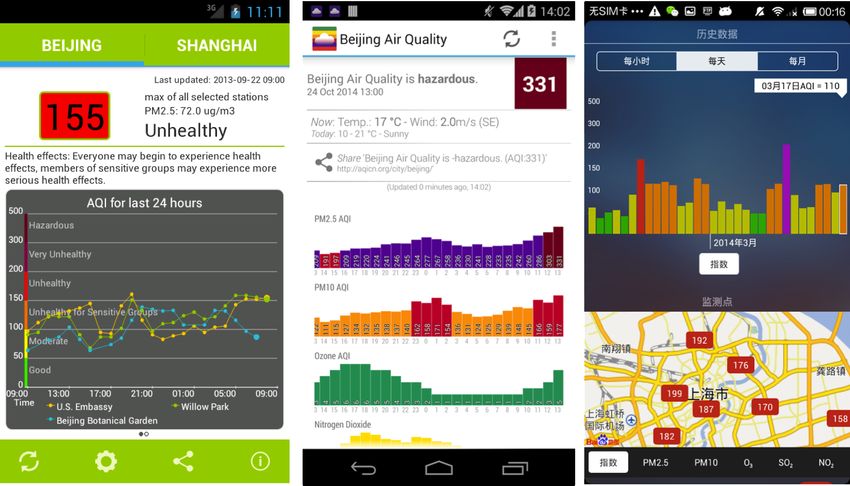
Ref.: ISARD_FP7_MPOLO_BP_307
                                                                                      Issue: 1.0 / Date: 29 March 2017
                                                                                                               Page: 7

1                Air Quality Systems in China

1.1            Introduction
               The management of air quality episodes in China is becoming an important challenge for
               Chinese authorities due to its large economical and societal impact. In 2012, a report from
               the World Bank1 estimated the environmental depletion and degradation in China in 2009
               as 9% of the Gross Net Income (Table 1.1). Air quality pollution is one of the main sources
               of these damages due to the health, material and CO2 damages that accounted for 4.4% of
               the GNI in 2009. This report also showed the trend for 2030 where these environmental
               damages were expected to be reduced to 2.7% of the GNI.

                                      Source                           2009             2030 forecast
              Energy depletion                                          2.9                  1.9
              Mineral depletion                                         0.2                  0.2
              PM10 health damages                                       2.8                  0.1
              Air Pollution material damage                             0.5                  0.1
              Water pollution material damage                           0.5                  0.1
              Soil nutrient depletion                                   1.0                  0.1
              Carbon dioxide damage                                     1.1                  0.2
              TOTAL                                                     9.0                  2.7

                    Table 1.1: Environmental depletion and degradation (% of GNI). Source: World Bank.

               Pew Research Center survey2 showed that air quality pollution was the second top concern
               in China after officials corruption (Figure 1.1).

1
 World Bank & Research Centre for Development (PRC). “China 2030. Building a Modern, Harmonious, and
Creative High-Income Society”. The World Bank.
2
    http://www.pewglobal.org/2015/09/24/corruption-pollution-inequality-are-top-concerns-in-china/

                                                           Marco Polo – Plan for exploitation of the project results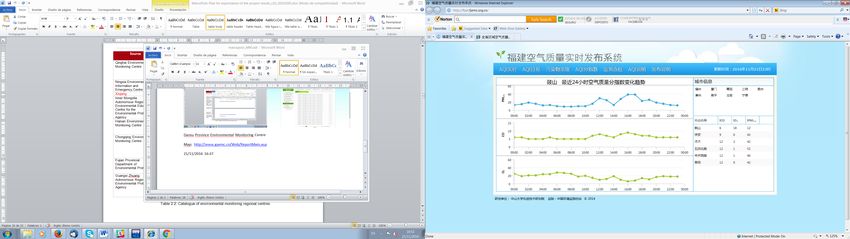
Ref.: ISARD_FP7_MPOLO_BP_307
                                                                                  Issue: 1.0 / Date: 29 March 2017
                                                                                                           Page: 8

                            Figure 1.1: China Top Concerns (Source: Pew Research Center).

              Since last decade, Chinese Government is aware of this big challenge therefore it has
              implemented several new policies to cope with the air quality pollution reduction. In the 12th
              Five Year Plan (2011-2015)3, Chinese Government set up the following objectives to
              reduce air pollutants in China:

                 •   Increase of non-fossil fuel usage in primary energy consumption: 11.4 %

                 •   Decrease in energy consumption per unit of GDP: 16%

                 •   Decrease in CO2 emissions per unit of GDP: 17%

                 •   Chemical Oxygen Demand (COD): 8%

                 •   Sulphur Dioxide (SO2): 8%

                 •   Ammonia Nitrogen: 10%

                 •   Nitrous Oxides (NO2): 10 %

              In order to accomplish these objectives, 12th Five Year Plan estimated that RMB3.4 trillion
              were about to be invested in pollution control and treatment between 2011 and 2015. In
              2013, when Marco Polo project started, the investment in pollution control and treatment
              reached RMB951.7 which was 15% more than 2012 and 1.67% of the annual GDP4.

3
 http://www.cbichina.org.cn/cbichina/upload/fckeditor/Full%20Translation%20of%20the%2012th%20Five-
Year%20Plan.pdf
4
    HKTD Research. 2015. “China’s Environmental Market”. HKTD Research.

                                                       Marco Polo – Plan for exploitation of the project results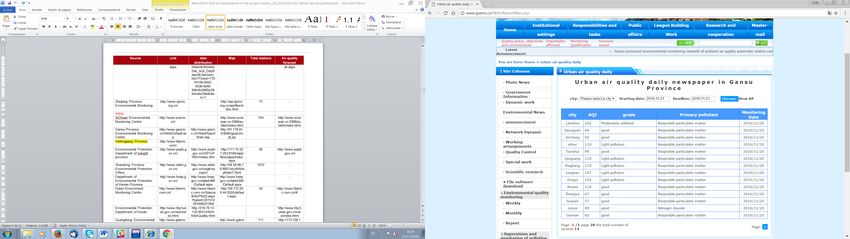
Ref.: ISARD_FP7_MPOLO_BP_307
                                                                                     Issue: 1.0 / Date: 29 March 2017
                                                                                                              Page: 9

              One consequence of this new political paradigm was the expansion and development of
              the national and regional systems which monitor and forecast air quality in China. The
              Ministry of Environment Protection (MEP), through the China National Environment
              Monitoring Centre (CNEMC)5, established new regulations and objectives to be
              accomplished by existing and new provincial and municipal Environmental Protection
              Bureaus (EPB) and Environmental Monitoring Centres (EMC). The development of these
              new monitoring networks expanded the number of monitoring sites providing a large
              amount of new local data (see Figure 1.2 and Figure 1.3).

                Figure 1.2: Real-time Air Quality Index based on on-ground monitoring stations. China. (Source:
                                                  AQICN, 17 May 2016 16:00h)

                  Figure 1.3: Real-time Air Quality Index based on on-ground monitoring stations. Beijing city.
                                             (Source: AQICN, 17 May 2016 16:00h)

5
    http://www.cnemc.cn/

                                                          Marco Polo – Plan for exploitation of the project results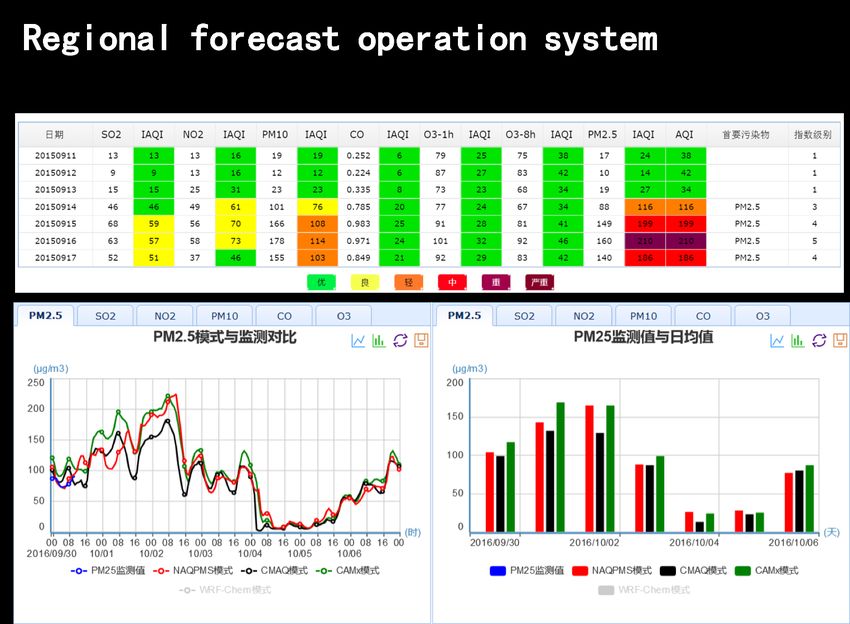
Ref.: ISARD_FP7_MPOLO_BP_307
                                                                           Issue: 1.0 / Date: 29 March 2017
                                                                                                   Page: 10

1.2   Legal Framework
      In September 2013, a new legal and regulatory framework was established through the Air
      Pollution Action Plan. This plan included 10 actions (see Table 1.2) and action number 9
      was “establish a monitoring and early warning system to tackle highly polluted weather”.

                     Table 1.2: Air Pollution Action Plan (Source: MEP, Goldman Sachs)

      In January 2015, a new Environment Protection Law introduced new targets and rules
      such as total emission control system, penalties, legal liabilities, incentives for emissions
      reductions and promotion of information disclosure to the public.

      This new regulatory and legal framework impacted Marco Polo project position because Air
      quality data became publicly available and new monitoring and forecasting systems were
      developed in parallel to the Marco Polo project.

1.3   Monitoring and Forecasting Systems
      During 2014-2016, each Environmental Monitoring Centre (EMC) implemented and
      maintained new monitoring and forecasting systems at local and provincial level. The data
      collected and processed were subsequently published and distributed through their own
      websites and apps. Annex A lists all provincial EMCs websites including the links to the
      websites which are providing air quality data to the public nowadays. An example of the
      information provided by these websites is shown in Annex B.

                                                Marco Polo – Plan for exploitation of the project results
Ref.: ISARD_FP7_MPOLO_BP_307
Issue: 1.0 / Date: 29 March 2017
Page: 11
In addition to these official websites, new channels for air quality communication were
open through the rapid development of new mobile apps (Figure 1.4 and Figure 1.5).
Citizens use these new apps to receive information about the air quality status in almost
near-real time. Most of the sources of these apps are the official data published by EMCs
so they are just merging and improving the communication channel with mobile phone
users. Some of these Apps also provide health assessments and warnings to populations
based on the standards published by both Chinese health authorities and international
organisations (e.g. World Health Organisation).
Figure 1.4: Sample of Air Quality Index Apps search in Google Play market. (Source: Google Play,
17 October 2016 12:00h)
Figure 1.5: Examples of Air Quality Index Apps for China. (Sources: AQICN App, Fresh Ideas Apps
and CastStudio Apps)
The Chinese National Monitoring Environmental Centre (CNMEC) of the Ministry of
Environmental Protection (MEP) also collects the information published and collected at
provincial level and national level. CNMEC publishes monthly, quarterly and yearly reports
showing the evolution of the main pollutants at National level per classes (Figure 1.6).
Marco Polo – Plan for exploitation of the project resultsRef.: ISARD_FP7_MPOLO_BP_307
Issue: 1.0 / Date: 29 March 2017
Page: 12
Figure 1.6: Distribution of the 6 main pollutants according to their classes. 2015. China (Source:
CNEMC)
CNMEC also produces an official Air Quality Index combining different levels of individual
pollutants into different classes (Table 1.3). These AQI are also classified according to their
health impact (Table 1.4).
Classes SO2 NO2 PM10 CO O3 PM2.5
1 50 0.050 0.04 0.050 2.0 0.100 0.035
2 100 0.150 0.08 0.150 4.0 0.160 0.075
3 150 0.475 0.180 0.250 14.0 0.215 0.115
4 200 0.800 0.280 0.350 24.0 0.265 0.150
5/6 300 1.600 0.565 0.420 36.0 0.800 0.250
7 400 2.100 0.75 0.500 48.0 1.000 0.350
500 2.620 0.940 0.600 60.0 1.200 0.500
Table 1.3: Chinese Air Quality Index and their classes associated (Source: AirInform)
Marco Polo – Plan for exploitation of the project resultsRef.: ISARD_FP7_MPOLO_BP_307
Issue: 1.0 / Date: 29 March 2017
Page: 13
Table 1.4: Chinese Air Quality Index and health implications (Source: MEP)
Following Air Quality Action Plan, the “National Center for Environmental Quality
Forecasting”, was established at CNEMC in the summer of 2013. This center was
organized at four levels: national, regional, provincial and city level. Its mission was to
provide air quality forecasts for all these levels within existing seven regions, thirty-one
provinces and major cities. This centre reused four existing forecasting models developed
by the Institute of Atmospheric Physics from the Chinese Academy of Sciences: NAQPMS,
CMAQ, CAMx and WRf-Chem. This system became operational in 2015. Some of the
outputs of this system are shown in Figure 1.7.
Marco Polo – Plan for exploitation of the project resultsRef.: ISARD_FP7_MPOLO_BP_307
Issue: 1.0 / Date: 29 March 2017
Page: 14
Figure 1.7: CNMEC Regional Forecast Operating System (Source: CNEMC)
Marco Polo – Plan for exploitation of the project resultsRef.: ISARD_FP7_MPOLO_BP_307
Issue: 1.0 / Date: 29 March 2017
Page: 15
2 Marco Polo Project results
MarcoPolo project activities are organised on seven work packages delivering 34
deliverables. Among these deliverables, we identified two information services that could
be commercially exploited after H2020 project funding period:
• Emission bottom-up estimates based on satellite data sets.
• Operational models providing validated forecast results on regional, urban and city
scales.
The ensemble of these products information is used to better monitor and predicts any air
quality event in China. The following sub-sections describe in detail the characteristics of
these two services.
2.1 Emissions Inventory
For good air quality modelling and forecasting, a recent and reliable emission inventory is
essential. Marco Polo project developed new emission inventories for China by combining
observations from satellites with information from the MEIC (Multi-resolution Emissions
Inventory for China) bottom-up inventory. Satellites observations have been used to derive
emissions for China on 0.25 degree resolution (around 25km spatial resolution). These
satellite-derived emissions have been combined with existing sector-split and statistical
information from the ground. The continuous stream of satellite observations enables us to
update the emission inventory on an annual basis.
Product Type Emission inventory.
Air pollutants included: aerosols, NO2, VOC, SO2, HCHO, CO, NH3, divided by
six source sectors: industry, power, residential, transportation, shipping and
agriculture.
Spatial 0.25 degrees for most major Chinese cities, the Korean peninsula and parts of
Resolution Mongolia
For selected regions the inventory is downscaled to a 0.01 degree resolution:
• Yangtze River delta: covering an area of 4x3 degrees (including
Nanjing).
• Beijing – Tianjin region covering 2 x 2 degree.
• Pearl River Delta region covering 2 x 2 degree.
Temporal Data for the years 2014 and 2010 (following years available on-request)
Range
Marco Polo – Plan for exploitation of the project resultsRef.: ISARD_FP7_MPOLO_BP_307
Issue: 1.0 / Date: 29 March 2017
Page: 16
Temporal Monthly
Resolution
Update Annual
frequency
Accuracy The emission data has been compared with existing bottom-up emission
inventory. It has been tested with model simulations. Results of validation can be
obtained on-demand.
Spatial East-China (between 102 and 132 eastern longitude, and between 18 and 50
Coverage northern latitude)
Format and netCDF ; approximately 25 Mb
Size
Software No Open Source Code for this product.
Source Code
Variables Aerosols, NO2, VOC, SO2, HCHO, CO ,NH3 per source sector
Impacted
Service The emission inventory is a joint effort of the Flemish Institute for Technological
provider(s) Research (VITO), Tsinghua University, the Royal Netherlands Meteorological
Institute (KNMI), Finnish Meteorological Institute (FMI), Belgian Institute for
Space Aeronomy (BIRA-IASB), and Aristotle University of Thessaloniki (AUTh)
Remarks Emissions for years after 2014 are available on-request.
The emission inventory cannot be fully automated in production.
The emission data has been compared with existing bottom-up emission
inventory. It has been tested with model simulations.
Table 2.1: Product description
Marco Polo – Plan for exploitation of the project resultsRef.: ISARD_FP7_MPOLO_BP_307
Issue: 1.0 / Date: 29 March 2017
Page: 17
Figure 2.1: Comparison of Marco Polo and MIX-MEIC emission inventories
Figure 2.2: Sector split of the yearly total emissions contained in the low resolution MarcoPolo
emission inventory.
Marco Polo – Plan for exploitation of the project resultsRef.: ISARD_FP7_MPOLO_BP_307
Issue: 1.0 / Date: 29 March 2017
Page: 18
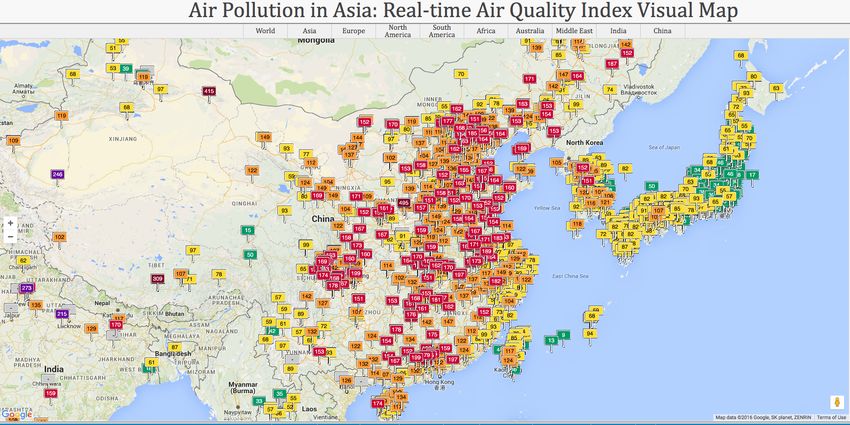
Figure 2.3: High Resolution Marco Polo inventory for SO2 within Beijing region.
The added value of the Emission inventory service is:
• High resolution emission data for specific regions. For three regions a high
resolution inventory on 1x1 km is available: Beijing area, Yangtze area, Pearl River
Delta. Other areas can be provided on demand.
• Timely updates of actual years. Initially the emission inventory is made for 2014. In
the future, emission inventories of the most recent year can be delivered.
The constraint of this service is:
• Does not cover CO pollutant
2.2 Ensemble Air Quality Forecast Service
The MarcoPolo project partners and associated institutes have strong modelling
experience in generating operational air quality forecasts for Europe and China. They use
a wide range of chemical transport models and input data. The best forecast, however, is
delivered by combining the individual forecasts to a model ensemble, which compensates
for possible individual model flaws. The forecast information is delivered for today and two
days in advance, and is updated whenever new model information becomes available.
Ensemble Air Quality forecast for East China (today and two days ahead), and
Product Type forecast of individual ensemble models.
Air pollutants included: PM2.5, PM10, NO2, O3, in units [ug/m3].
0.25 degrees (25Km approx.)
Spatial The forecasted values therefore represent local (e.g. urban) background values.
Resolution They do not contain information on neighbourhood scale or smaller.
Marco Polo – Plan for exploitation of the project resultsRef.: ISARD_FP7_MPOLO_BP_307
Issue: 1.0 / Date: 29 March 2017
Page: 19
The time series span 4x24 hours, starting at 00:00 local Chinese time,
Temporal containing yesterday’s analysis, today’s, and following 48h forecast.
Range
1 hour
Temporal
Resolution
Daily (or every time when new model data is processed)
Update
frequency
The forecasted values of the air pollutants are accompanied with an uncertainty
Accuracy range. Accuracy values can be obtained on-demand.
The time series are based on an ensemble of air quality forecast models of the
Spatial MarcoPolo-Panda consortium. Note that not all models cover the same spatial
Coverage domain, although all of them cover East China. As a consequence, the forecast
of peripheral cities in China might be based on less air quality models.
Format: JSON or ASCII (for location time series), or netCDF (for gridded data)
Format and Size: around 10 kB per location time series;
Size around 50MB for gridded (area) forecasts.
No Open Source Code for this product.
Software
Source Code
NO2, PM10, PM2.5 and O3
Variables
Impacted
The forecast service is hosted by the Royal Netherlands Meteorological Institute
Service (KNMI), and contains currently contributions of KNMI, European Centre for
provider(s) Medium-Range Weather Forecasts (ECMWF), Shanghai Center for Urban
Environmental Meteorology (SCUEM), Finnish Meteorological Institute (FMI),
Max Planck Institute for Meteorology (MPI-M), Norwegian Meteorological
Institute (MET.NO), Netherlands Organization for Applied Scientific Research
(TNO).
The time series will not be delivered with ground truth data, as the MarcoPolo-
Remarks Panda consortium does not own these data.
A fair use policy applies to the delivery of the forecast data. Too frequent
petitions for data will result in temporary restriction of access.
Table 2.2: Product description
Marco Polo – Plan for exploitation of the project resultsRef.: ISARD_FP7_MPOLO_BP_307
Issue: 1.0 / Date: 29 March 2017
Page: 20
Figure 2.4: (Left) Forecasted time series for Shanghai. The red line shows the average
concentration of this air pollutant taken from the available stations for this city. The values are taken
from www.pm25.in. The grey line shows the median of the models of the simulated air quality. The
grey shaded area indicates the range of the model predictions. (Right) Gridded 24h-average
ensemble forecast for the Shanghai area.
The added value of this service is:
• Time series of city forecast. Time series of air pollutants for a predefined Chinese
city. Data is accessed through a specific URL, including a client token.
• Time series of user-specified location. Time series of air pollutants for arbitrary
locations. Locations cover China, Taiwan, North and South Korea. Note that the
forecast quality in West China might be different, due to less coverage by the air
quality models of the ensemble. Data is accessed through a specific URL, including
a client token.
• Time series of a gridded field over East China. Time series of gridded concentration
fields of air pollutants. Spatial resolution: 0.1 degree. The gridded fields cover
China, Taiwan, North and South Korea. Note that the forecast quality in West China
might be different, due to less coverage by the air quality models of the ensemble.
Note also that the resolution of the grid not necessarily represents the spatial
resolution of the forecasts. Data is accessed according to the client’s wishes (e.g.
password-protected FTP).
The constraint of this service is:
• Does not cover SO2 and CO pollutant
Marco Polo – Plan for exploitation of the project resultsRef.: ISARD_FP7_MPOLO_BP_307
Issue: 1.0 / Date: 29 March 2017
Page: 21
3 The Market
3.1 Stakeholders interviews
Our initial market research has been based on dedicated visits and interviews to some key
stakeholders in China (Table 3.1).
Organisation Responsible Date
China National Environment Monitoring Wang Wei Jan 2017
Center
Satellite Environment Monitoring Center Mao Huiqin Jan 2017
Institute for Public Environment Shen Sunan July 2015
China Academy for Environmental Planning Lei Yu Jan 2017
Institute for Remote Sensing and Digital Earth Chen Liangfu Jan 2017
National Satellite Meteorological Center Zhang Xingying July 2015
Air Matters Wang Jun July 2015
China Clean Air Alliance Xie Tonny Feb 2017
IBM Global Clement Dai July 2015
Institute of Atmospheric Physics Tang Xiao Feb 2017
China Unicom Environmental Information Zhu Shuai Feb 2017
Operation Center
Table 3.1: Marco Polo Stakeholders visits
The conclusion from these visits are:
• There is a strong demand for updated emissions inventory based on satellite data.
These data are not available through Chinese official sources yet. Price quotations
were required to Marco Polo project.
• There is a strong demand for improved forecasting systems at provincial and city
level but Marco Polo models performances and uncertainties shall be assessed and
compared against existing local models. Validation reports were required.
• Government guidelines strongly recommend collaborating with Chinese institutions
and companies rather than with foreign organisations. Collaboration through local
partners is a must.
• The market is evolving rapidly since 2014 and new actors and competitors are
emerging.
• New market opportunities can be found out of the institutional market. Examples
are apps, real state, insurance or global supply chain markets.
• The recent trends in the market shows that most of the provinces are developing
their early warning systems but there is still a big gap on forecast systems able to
predict the air quality in a short and long-term basis with high precision and
accuracy. In the case of Marco Polo project, the ensemble of seven models
deployed offers a unique top-quality solution for these forecasting systems covering
90% of Chinese population. We think Marco Polo forecast service based on
satellite data could fill this gap.
Marco Polo – Plan for exploitation of the project resultsRef.: ISARD_FP7_MPOLO_BP_307
Issue: 1.0 / Date: 29 March 2017
Page: 22
• An additional trend shows that most of the Chinese EMCs are able to monitor the
pollution events but not to identify in a simple, accurate and rapid process (less
than one month) the sources of these pollution events. This fact is important to help
decision makers and regulators to plan actions regarding pollutant industries
sources. We think Marco Polo emission inventory service based on satellite data
could fill this gap.
3.2 Market Reports
Existing traditional market
The traditional market driving our proposed services is the air quality monitoring market.
Market and Market report estimated that the air quality monitoring (AQM) market over the
forecast period of 2016 to 2021 was to reach USD 5.64 Billion by 2021, at a CAGR of 8.5%
from 2016 to 2021. Industries such as cement, mining, chemical and steel are growing
rapidly in Asia-Pacific, which will increase the use of air quality monitoring systems. The air
quality control systems market in Asia-Pacific is expected to grow at a CAGR of 6.7%
between 2014 and 2019.
Market and Market report also estimated Air quality control systems market share (value),
by Geography, 2013 as:
Figure 3.1: Market geographical distribution of the Air quality control systems (Source:
MarketandMarket).
BSCC Research estimated that the global air quality monitoring market is expected to
reach $6,889 million by 2022 from a market value of $3,742 million in 2015, growing at a
CAGR of 9.2% from 2016 to 2022.The global air quality monitoring market for government
agencies and academic institutes was valued at $1,219.1 million in 2015 and it is expected
to grow at a CAGR of 9.0% during 2016 – 2022. During the period 2012 – 2015, the air
quality monitoring was used mostly for monitoring the chemical pollutants.
These reports show that the Asia-Pacific market is going to be a lead market for Europe
and the Americas. For instance, Goldman Sachs report “China's environment. Big issues,
accelerating effort, ample opportunities. July 2015” estimated that the Chinese
Marco Polo – Plan for exploitation of the project resultsRef.: ISARD_FP7_MPOLO_BP_307
Issue: 1.0 / Date: 29 March 2017
Page: 23
environmental investment for 2011-2015 (RMB5.1TRN) was larger than the defence
budget (RMB4.0TRN) and expected to grow to RMB8.2 in 2016-2020.
The traditional market consuming air quality monitoring information are environmental
agencies which are monitoring polluting industries (power plants, cement, steel…) and
sectors (transport, residential heating…). Given that many Chinese provinces are
exceeding the air quality thresholds or limits, significant efforts and resources are also
required to prepare and implement air quality plans that describe effective abatement
measures (e.g. Low Emission Zone) that will be put in place to address any infringements.
Put simply, Environmental agencies are moving from a traditional ‘passive’ monitoring
actor to a pro-active integrated air quality management actor. This also applies even more
so to our target market areas where the air pollution concerns are very high on the agenda
and forecasted pollution episodes are frequent.
This new driver necessitates the need for reliable, timely, high quality air pollution data
and improved tools to be able to predict and manage air quality more efficiently. In
particular, at high resolution to provide insight into the impacts at an urban scale which is
where most of the infringements occur. These agencies require reliable, easy to use
decision making tools that support them to make better informed emission reduction plans
to minimise the health, economic and social impact on the population. The complexity and
fast transformation of these ecosystems will need a large volume of updated data to
improve informed decisions.
We think Earth Observation characteristics (wide coverage, long-term monitoring and
frequent observations) will allow a rapid time-to-market products update that will be crucial
for new forecast services.
This ties with the Copernicus Market Report 2016 prepared by Price Waterhouse Coopers
which identified three key drivers for the EO market related to Air Quality: 1) Increasing
demand for air quality applications for cities in developing countries, 2) Increasing demand
for air quality information at street level using EO data and in-situ devices and 3)
Increasing reporting obligations due to strengthening of air quality regulations.
New upcoming markets
In addition to traditional environmental regulation and planning market, new markets are
emerging with need of air quality data. We identified six potential new markets in China:
Green Supply Chain, Smart Cities, Mobile Apps, Real Estate, Insurance Risk and
Smart Home Appliances and Equipments. The trends and drivers of these markets
shows a potential opportunity for our air quality information services.
MarketandMarket estimated that Global Supply Chain market will grow from $2.5 billion
in 2014 to $4.8 billion by 2019. According to the Cap Gemini report “Future Supply Chain.
2016”, one of the key drivers for the sustainability of this market will be the reduction of
energy consumption and CO2 emissions needed to be adapted to new regulations.
Mordorintelligence estimated that the Smart Cities market is projected to grow from
$386.55 billion in 2014 to $1,386.56 billion in 2020, at a CAGR of 20.48% over the forecast
period. One of the key drivers of this market is the widespread adoption of Green
technologies for transport, electricity production and electricity consumption.
Marco Polo – Plan for exploitation of the project resultsRef.: ISARD_FP7_MPOLO_BP_307
Issue: 1.0 / Date: 29 March 2017
Page: 24
The IAIS Global Insurance Market Report 2016 states that the insurance industry is
adapting itself responding to new scenarios derived from Climate Change and new risks
derived from environmental uncertainties scenarios. One new business opportunity for
these insurance companies is offering new products and services covering these new risks
for companies willing to become greener within a new Greenhouse management market
scenario.
A new future opportunity will be the China´s Carbon trading market which started in 2016.
This market is estimated to reach Rmb100 billions in 20206. Marco Polo team could further
develop their project results to include new satellite missions (e.g. Sentinel-5 and
CarbonSAT) to derive new products related to CO2 emissions.
A new future opportunity will also be seasonal and long-term predictions due to future
Climate Change scenarios. Cities and regional governments will need information about
future scenarios in 30-50 years to set up mitigation and adaption measures to future
warming impacts.
In a long-term, Marco Polo project results and lessons learnt could be also be used to find
new opportunities in growing markets such as India or Middle East countries.
The market research shows that air quality treatment and monitoring investment in China is
going to increase during 2016-2020 period so we expect air quality monitoring market to
follow this trend. If the estimated global market value of air quality monitoring systems is
6,889 million by 2022 (9.2% CAGR from 2015), we estimated that the size of the Chinese
market will be 20 % of these market value (1,377 million by 2020).
6
http://www.goldmansachs.com/our-thinking/pages/interconnected-markets-folder/chinas-environment/report.pdf
Marco Polo – Plan for exploitation of the project resultsRef.: ISARD_FP7_MPOLO_BP_307
Issue: 1.0 / Date: 29 March 2017
Page: 25
4 Customers
We identified the following potential customers of the Marco Polo products:
ENVIRONMENT MONITORING INSTITUTIONS
These are considered the key institutional customers of our services.
• Chinese National Monitoring Environment Center (http://www.cnemc.cn/). This is
the main institution in China in charge of the monitoring of environment (air quality,
water and waste). They have a national monitoring system based on regional
monitoring systems. They directly report to the Ministry of Environment Protection
(http://english.mep.gov.cn/).
• Chinese Environmental Monitoring Centers. They are responsible for
implementing and maintaining municipal, provincial, and regional monitoring
networks for air quality. In Annex A and B we listed and described some of these
Chinese EMCs.
• Satellite Environment Center (http://www.hcstzz.com/huanbao.aspx). This is the
main institution in China in charge of monitoring environment (air quality, water and
waste) using satellite data. They directly report to the Ministry of Environment
Protection (http://english.mep.gov.cn/).
• National Satellite Meteorological Center (http://www.nsmc.cma.gov.cn/). This is the
main institution in China in charge of weather forecast using satellite data. They
also design, plan and operate Chinese Fengyun meteorological satellites. They
directly report to the China Meteorological Administration (http://www.cma.gov.cn/).
ENVIRONMENT RESEARCH INSTITUTIONS
These are considered partners working for key customers who can help of developing our
services.
• Institute of Remote Sensing and Digital Earth (http://www.radi.ac.cn/). This is the
main institution in China in charge of remote sensing research. They belong to the
Chinese Academy of Sciences.
• Chinese Research Academy of Environmental Sciences
(http://www.craes.cn/cn/index.html). This is the main institution in China in charge of
science environment research. They belong to the Chinese Academy of Sciences.
• Chinese Academy for Environmental Planning (http://www.caep.org.cn/). Its
mission is to provide technical support and services such as environmental
planning, environmental policy, and consultation on environmental project selection
management for the Chinese government and corporations.
ENVIRONMENT INDUSTRY
These are considered environmental service providers working for key customers who can
help us developing our services.
Marco Polo – Plan for exploitation of the project resultsRef.: ISARD_FP7_MPOLO_BP_307
Issue: 1.0 / Date: 29 March 2017
Page: 26
• Equipment and consultancy solutions monitoring companies. These are
companies providing equipment and solutions to Chinese EMCs. Examples of
these companies are:
o Sinogreen Enviromental Protection Technlology (www.zlhb.com.cn).
o SailHero (http://www.sailhero.com.cn/)
o Wuhan Techking (http://www.tkhb.com.cn/)
o OYST (Beijing Beike Ouyuan Science & Technology (http://www.oyst.com.cn/)
o Yunzhou TechChinese (http://www.yunzhou-tech.com/)
o Environment SA (http://www.environnement-sa.com/)
o Ramboll Environ China (http://www.ramboll-environ.com/)
o IMB Global (https://www.research.ibm.com/green-horizons/interactive/)
• New emerging markets. These are new companies in the Green Market.
Examples of these companies are:
o Insurance and Risk companies
o Real State Companies
o Smart Cities solutions providers
o Air purifiers equipment’s
o Global Supply Chain auditors and certifiers
• China Association of Enviromental Protection Industry
(www.chinaenvironment.org). This is the main association grouping the main
manufacturers and consultancy companies in the environment protection market.
These companies provide products and services to Chinese environmental
protection institutions and organisations. This association also organizes the major
industry event in China (China International Environmental Protection Exhibition &
Conference, CIEPEC).
• Non-Governmental AQI APPs developers. These are APPs developers providing
air quality index information and health assessment to Chinese citizens. Examples
of these companies/APPs are:
o AQICN (http://aqicn.org)
o Air matters (https://air-matters.com/)
o Moji (http://www.moji.com/ )
o Plume Labs (https://air.plumelabs.com)
Non-Profit organisations
These are considered potential partners to rise public funding in China for developing our
services.
o Institute for Public Environment (http://wwwen.ipe.org.cn/)
o Friends of Nature (http://www.fon.org.cn/index.php/en )
o Greenpeace China (http://www.greenpeace.org/hk/ )
Our strategy related to customer demographics is focused on providing data and
information to the main actors disseminating Air Quality Index information through their
own channels such as websites, apps or community tools.
Marco Polo products shall be tailored to each customer need, integrating our flows of
information into target customers processes and systems.
The establishment of a long-term relationship with targeted customers will allow us to
demonstrate the high quality of our products compared with existing products in China.
Marco Polo – Plan for exploitation of the project resultsRef.: ISARD_FP7_MPOLO_BP_307
Issue: 1.0 / Date: 29 March 2017
Page: 27
This relationship should be also consolidated through the establishment of an agreement
with a local partner to promote and develop Marco Polo future opportunities in China. This
local partner could be any of the main research institution mentioned above. Nevertheless,
the business environment in China practically obliges to have a Chinese company to make
business. It means that isardSAT company should be ready to open a subsidiary in China
to further develop business there.
Marco Polo – Plan for exploitation of the project resultsRef.: ISARD_FP7_MPOLO_BP_307
Issue: 1.0 / Date: 29 March 2017
Page: 28
5 SWOT analysis
Strengths Opportunities
Scientific excellence of the products is very high. Most of customers do not have a real-time high-quality
Extension of the service in new customers is more forecasting system implemented.
cost-effective and less time consuming due to the Most of customers do not have a near-real time
global characteristics of EO data and models used. (monthly) high-quality up-bottom emission inventory.
Some consortium partners are public institutions Creating sustainable business and job opportunities for
highly motivated and skilled to further develop a European SME
commercial products and services out of Europe. Fostering innovation, research and job opportunities
Services would need a short time frame (less than for European Meteorological institutes and research
12 months) to become operational marketable centres.
products. th
2011-2015 12 Year Plan investments have been
Marco Polo products are already integrated with focusing in new Air Quality monitoring systems. The
th
bottom-up emissions inventories and with official next step should be forecasting systems for period 13
Chinese ground data. Year Plan 2016-2020.
Sentinel-5 and future Chinese missions data will Products and services could easily be deployed in a
enhance service spatial and time resolution new less developed market such as India and South-
East Asian Countries
Provide value to existing EU programs and projects
beyond their funding period
Weaknesses Threats
Business Chinese company still not in place. Environmental Consultancy companies could become
Chinese human resources and/or local partners competitors in a near future using satellite data and
needed for doing business in China. new models.
Local customisation and personalisation will require EMCs could prefer to develop their own forecast
further investments. systems without external and/or foreign providers.
Investment needed for further develop business.
Lack of long-term business relationships with target
customers need some transition time to increase
customers trust on our services.
Some consortium partners are public institutions not
eager to further develop commercial products and
services.
Provided air quality data might not meet the current
customers quality criteria and standards.
Market acceptance needs to increase
Table 5.1: S.W.O.T Analysis
Marco Polo – Plan for exploitation of the project resultsRef.: ISARD_FP7_MPOLO_BP_307
Issue: 1.0 / Date: 29 March 2017
Page: 29
6 Competitors
Chinese market is highly competitive and evolves rapidly. It means that your local partners,
customers or new emerging actors could become competitors in a short-term. We
identified the following potential competitors in the near future:
Competitor Date Size Market Value to Strengths Weaknesses
share (%) customers
Satellite 2012 More than 60 Unknown They are the They belong to Lack of high
Environment people. official MEP Ministry of quality
Center Turnover institution to Environment emissions
unknown monitor air Protection. inventory.
quality with
satellite data
National 1971 More than 200 Unknown They are the They belong to Lack of high-
Satellite people. official CAP China performing
Meteorological Turnover institution to Meteorological models.
Center unknown monitor air Administration.
quality with
satellite data
31 Provincial 1971 More than Unknown They are the They belong to Lack of high-
Meteorological 1000 people. natural local China performing
Bureaus Turnover partners of the Meteorological models.
unknown EMC province Administration.
institution
IBM China 1996 More than Unknown Commercial Single Entity Costs of the
1000 people. company with and services.
Turnover decision recognised
unknown making tools brand
Wide presence
in China
Breezometer 2012 More than 12 Unknown Commercial Business Lack of EO
people. company development data
Turnover covering end- strategy and expertise
unknown to-end air network very
quality efficient
services
Table 6.1: Competitors
Marco Polo – Plan for exploitation of the project resultsRef.: ISARD_FP7_MPOLO_BP_307
Issue: 1.0 / Date: 29 March 2017
Page: 30
7 The Exploitation Plan
The table below summarises all our identified actions to further exploit Marco Polo results
to transform them into marketable products:
ID Description Date
A-1 Distribute emissions inventory data samples for 2014 period among Q2 2017
all potential customers
A-2 Establish an API to distribute forecast results among potential Q3 2017
customers for a time limited period
A-3 Produce product catalogue in Chinese including pricelist Q3 2017
A-4 Contact potential customers and develop commercial opportunities Q2 2017
A-5 Organise an H2020 proposal for downstream services for exploit Q1 2017
Marco Polo research products commercially
A-6 Explore further opportunities in emerging markets (India, Middle-East) Q3 2017
A-7 Analyse how to further exploit Marco Polo results using Copernicus Q3 2017
data
A-8 Establish a consortium agreement to further exploit commercially Q2 2017
Marco Polo results. This includes IPR settlement and project results
ownership.
A-9 Identify the costs of these exploitation and promotion activities Q3 2017
Table 7.1: Exploitation Plan actions
Marco Polo – Plan for exploitation of the project resultsRef.: ISARD_FP7_MPOLO_BP_307
Issue: 1.0 / Date: 29 March 2017
Page: 31
8 Business Plan
Our Business Plan will follow CANVAS Business Model. Hereafter we define all the
components of this model applied to Marco Polo project.
1) PROBLEM
• Lack of information and decision making tools to manage and predict air quality
pollution events in order to reduce its economic impact and damages.
• Lack of updated information about air quality emissions.
2) CUSTOMER SEGMENT
• Environmental Agencies
• Green Supply consultancy
• Mobile Apps
• Insurance companies
• Real Estate Agencies
• Air Purifier Equipment Vendors
• Urban Planning
3) UNIQUE VALUE PROPOSITION
• Marco Polo service forecast service allows predicting more accurately severe air
quality pollution events in a wide range of cities at lower costs.
• Marco Polo top-down emissions inventory allow building an emission inventory 2 years
before existing competing bottom-up inventories at lower costs. This fact is especially
relevant for China where emissions change very frequently due to new economic
development and new environment framework.
• Monitoring illegal emissions not detected from non-satellite methods.
4) SOLUTION
An integrated service platform providing a full range of services covering all value chain
from AQ information monitoring, emissions inventory up to AQ forecasting systems. See
section 2 for further information.
5) CHANNELS
Dedicated on-site visits and website promotion.
6) UNFAIR ADVANTAGE
• Better low cost solution thanks to the economies of scale of systems based on EO
data.
• Reduced time-to-market because we do not need local deployments and local
resources.
• Technology still not available in all Chinese regions.
Marco Polo – Plan for exploitation of the project resultsRef.: ISARD_FP7_MPOLO_BP_307
Issue: 1.0 / Date: 29 March 2017
Page: 32
7) REVENUE STREAMS and COST STRUCTURE
Our pricing strategy for every target customer will be tailored and it will depend on the following
factors:
● Competition market prices
● Customer financial capacity
● Customer area of interest and time span
● Number of services involved and their licensing model
● Operation costs including data provision, hardware provision, integration, support and
consulting costs
● Commercialisation costs
The initial estimation of our 3-years business plan after project closure is based on our initial
dialogues with some of the key target customers. The first conclusion from these dialogues is
that the value and price of our services depends on each customer benefit so they cannot be
easily standardised. The second conclusion is that the pricing strategy only based on the
surface covered and the timespan of the data cannot fulfil the business models of some actors.
For instance, Environmental Agencies could be comfortable with this pricing model but Apps
developers not. Apps developer would like to tie the price of our data to the number of apps
users using it. Third, the value (and price) of the data decreases with time. For instance, an
emission inventory for February 2017 in March 2017 is precious but its value and price in 2018
could dramatically decrease.
In order to solve this problem, we have simplified our finance plan (Table 6.1) and we have
estimated all the figures taking into account three scenarios: low market acceptance, moderate
market acceptance and high market acceptance. In all scenarios:
• Direct costs will include business development, infrastructure, legal assessment and
consulting services.
• FTE are computed according to Marco Polo project average costs (80Keuros/year)
• Each contract average revenue will be 500Keuros (average of 1 or 2 services
included).
a) Scenario 1: Low Market acceptance
• We roughly estimate to have 10 contracts during 3 years.
• Total revenues 3 years: 5400K; Number of employees created: 4.9FTE;
• Profits for long-term sustainability: -620K
b) Scenario 2: Moderate Market acceptance
Marco Polo – Plan for exploitation of the project resultsRef.: ISARD_FP7_MPOLO_BP_307
Issue: 1.0 / Date: 29 March 2017
Page: 33
• We roughly estimate to have 20 contracts during 3 years.
• Total revenues 3 years: 10850K; Number of employees created: 14.9FTE;
• Profits for long-term sustainability: 2570K
c) Scenario 3: High Market acceptance
• We roughly estimate to have 50 contracts during 3 years.
• Total revenues 3 years: 24800K; Number of employees created: 24.9FTE;
• Profits for long-term sustainability: 11000K
Low market acceptance Moderate market acceptance High market acceptance
Win
Costs Revenues Win Win
Personal (C- Costs Personal Turnover Costs Personal Turnover
Year (C- (C-B-
cost (B) B- (A) cost (B) (C) (A) cost (B) (C)
(A) (C) B-A) A)
A)
-
2020 300 400 400 450 1200 1400 -250 750 2000 3200 450
300
-
2021 620 600 1000 930 1800 3500 770 1550 3000 8000 3450
220
-
2022 1000 800 1700 1500 2400 5950 2050 2500 4000 13600 7100
100
-
TOTAL 1920 1800 5400 620 2880 5400 10850 2570 4800 9000 24800 11000
Employ
(FTE) 4.9 14.9 24.9
Table 8.1: Three year business plan. Costs are in Keuro
From the consortium previous experience, we estimate that moderate and high market
acceptance scenarios are greatly achievable.
Marco Polo – Plan for exploitation of the project resultsRef.: ISARD_FP7_MPOLO_BP_307
Issue: 1.0 / Date: 29 March 2017
Page: 34
9 Annexes
Annex A: List of EMCs websites
The following table shows the list of existing EMCs in China, their organization websites, the websites
where AQI data is published, examples of maps, the number of total monitoring stations and the
availability of forecast information.
Source Link data Map Total stations Air quality
distribution forecast
Beijing Municipal http://www.bjmem http://www.bjme http://zx.bjmemc 35 -
Environmental Monitoring c.com.cn/ mc.com.cn/g377 .com.cn/
Centre .aspx
Tianjin Environment http://www.tjemc.o http://www.tjemc http://air.tjemc.or 27 -
Monitoring Centre rg.cn/html/Pagein .org.cn/html/Pag g.cn/
dex.aspx eDownLoad.asp
x?ChannelID=6
3&CategoryID=1
40
Shangai Environmental http://www.semc.g http://www.semc - 17 http://www.semc
Monitoring Centre ov.cn/home/index. .gov.cn/aqi/hom .gov.cn/home/in
aspx e/Index.aspx dex.aspx
Liaoning Provincial http://www.lnemc. http://www.lnem http://www.lnem 66 -
Environmental Monitoring cn/About.aspx?id c.cn/Download.a c.cn/index.aspx
Experiment Centre =2 spx?id=1
Jiangsu Environmental http://www.jsem.n http://218.94.78. - 302 http://www.jsem.
Monitoring et.cn/jshjjc/default. 64:888/th_ed1/ net.cn/jshjjc/defa
aspx Web/Air/Monitor ult.aspx
Site_AQI_DayR
eportExtension.
htm?Ticket=770
4310b-6052-
4338-8d40-
fe9c6c5965e2&
MonitorSiteBatc
h=1
Zhejiang Province http://www.zjemc. http://aqi.zjemc. 72 -
Environmental Monitoring org.cn/ org.cn/aqi/flex/in
dex.html
SiChuan Environmental http://www.scemc. http://www.scne 104 http://www.scne
Monitoring Centre cn/ wair.cn:3389/pu wair.cn:3389/pu
blish/index.html blish/index.html
Gansu Province http://www.gsemc. http://www.gsem http://61.178.81. -
Environmental Monitoring cn/Web/Default.as c.cn/Web/Report 9:8080/gs/prom
Centre p Main.asp pt.jsp
Heilongjiang Province http://www.hljemc.
com/
Environmental Protection http://www.jxepb.g http://www.jxepb http://111.75.22 60 http://www.jxepb
Department of JiangXI ov.cn/ .gov.cn/ZXFU/F 7.203:9180/eipp/ .gov.cn/
province WEH/index.htm flexoutput/index.
html
Marco Polo – Plan for the exploitation of project resultsYou can also read