European Nursing Homes Report - Spring 2019 Overview of the European Nursing Homes Market - SilverEco
←
→
Page content transcription
If your browser does not render page correctly, please read the page content below

European Nursing Homes Report

Spring 2019

Overview of the European
Nursing Homes Market

                                                           Cushman & Wakefield France
                           Tour Opus 12, 77 Esplanade du Général de Gaulle, 92800 Puteaux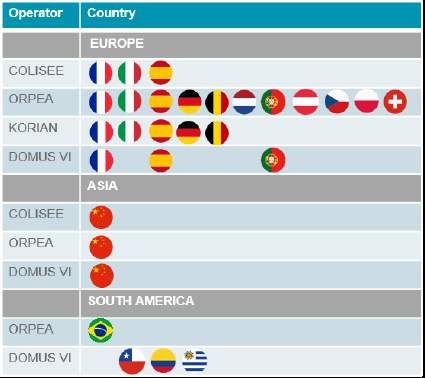
European Nursing Homes Report | 2019

Summary
  Summary

France
   European context
            context           3               3

Spain                                         9
    France
    France            7
Italy                                       13
    Spain												10
    Spain            10
Germany                                     16
    Italy												14
    Italy            14
Belgium                                     21
    Germany											17
    Germany           17
Netherlands                                 24
    Belgium											22
   Belgium
United Kingdom        22                    28

    Netherlands											25
    Netherlands           25

    United Kingdom										29
           Kingdom          29

    Definitions                        32

                                            Page
                                             Page22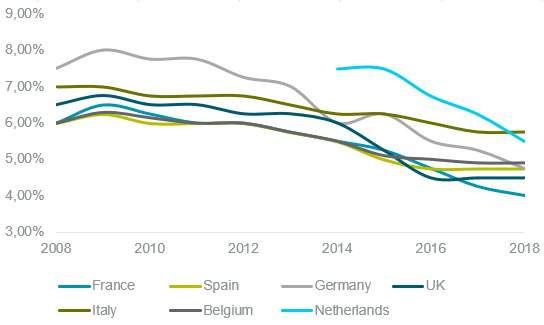
European Nursing Homes Report | 2019
European context
Demographic evolution
Dependency ratio
Dependency ratio
The dependency ratio (the number of people aged over 65 Italy
/ the population aged 15-64) in the European Union was at Germany
28.8% in 2015. It is forecasted to increase to 39.1% by 2030 France
and 50% by 2050. EU (28 countries)
European countries with the highest ratios are Italy and Spain
Germany with 33.7% and 32% respectively in 2015. Belgium
The most important increase among European countries is United Kingdom
expected to happen in Spain with the dependency ratio Austria
increasing from 27.9% in 2015 to 62.1% by 2050. Netherlands
0 10 20 30 40 50 60 70
2015 2030 2050
Source: Eurostat
Population over 80
Growth of the 80+ (Base = 100 in 2015)
Between 2015 and 2030, the 80+ year old population will 240
grow by 40% in the European Union, increasing from 26.7
220
million inhabitants in 2015 to more than 37.6 million by 2030.
In absolute figures, Germany (+ 1,798,000 inhabitants), the 200
UK (+ 1,591,000 inhabitants), France (+ 1,444,000 180
inhabitants) and Italy (+ 1,365,000 inhabitants) will present 160
the biggest upward movement.
140
By 2080, the population aged over 80 years and above will
have multiplied by 2.5 in Europe. The Nordics will witness 120
the strongest increase, close to 4x higher than in 2015. 100
UE-28 Western Europe CEE Southern Europe Nordics
Source: Eurostat
Nursing home landscape Number of beds (in 000s) and equipment rate, 2017
The equipment rate represents the number of beds / 80 and
over population. It varies from 6% in Poland to 25% in
Belgium.
The ageing of the European population will require a large
increase of the number of beds in almost every country.
By 2030, more than 500,000 beds will be needed, in addition
to the needed redevelopment of existing (and obsolete)
ones across the region.
European countries, where traditional family structures still
prevail, are expected to meet a growing demand both from
investors and operators, seeking respectively lower yields
and higher operating figures than in more mature markets. Sources: Eurostat, Operators websites
Page
Page3 3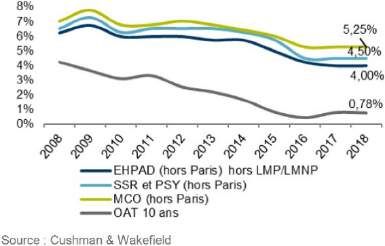
European Nursing Homes Report | 2019

Types of Operator
                                                                          Nursing home beds by type of operator (2018)
Nursing home management can be split between different types of
Operators: Public, Non-Profit or Private.
                                                                                100%
The share of those operators in the local markets often depends on                90%
the existing public regulations:                                                  80%
                                                                                  70%
           •    Licensed: Operators are required to gain prior approval           60%

                from local authorities before they can build, open or             50%
                                                                                  40%
                operate a new care home. E.g. Belgium, France & Italy.            30%

           •    Free market: Operators can develop care homes                     20%
                                                                                  10%
                largely without interference from local and national               0%

                governments. E.g. Germany, Spain or the UK.                                France Belgium             Spain        Italy        UK    Germany Austria   Poland

           •    Outsourced: local authorities outsource operational                                                  Public         Non-profit       Private

                responsibility to private companies, which hold long                 Sources: Orpea, National Statistics, Cushman & Wakefield

                term contracts. E.g. Finland, Norway and Sweden.
           •    The two markets with the most private operators are
                the United Kingdom and Germany, both of which are
                free markets.

With a growing part of the European population becoming elderly and
needing nursing homes, the financing question increases in Examples of international expansion by healthcare and
importance. In this context, we expect to see a decline in public/ non- social welfare operators
profit rates of operators in some countries where they are still high,
namely Italy, France and to some extent in Belgium and Spain. This
trend will help the private operators in healthcare to grow in market
shares.

Supported in their development by shareholders and corporate
investment funds, but limited by their growth in the domestic market,
major healthcare and social welfare providers have started exporting
their expertise. They have seen considerable development in Eastern
and Southern Europe. Major French operators in this sector, ready to
export their models, doubled their foreign acquisitions in 2018. Beyond
the borders of Europe, Asia - and more specifically China - and
Southern America represent vast areas that are still under developed
in this field. In the long term, cultural specifics aside, these two
continents could represent new opportunities for healthcare and social
welfare operators.

                                                                          Sources: Operator websites, Cushman & Wakefield

                                                                                                                                                                            Page
                                                                                                                                                                             Page44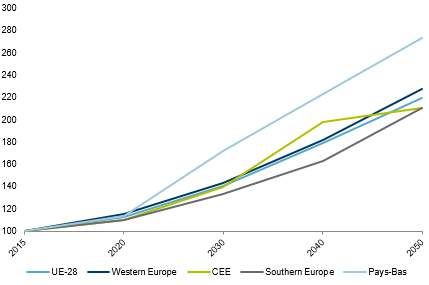
European Nursing Homes Report | 2019

 Investment volume                                                Investment volume in healthcare real estate, € billion

 Across France and Europe, questions are being raised on
 issues regarding ageing populations and the involvement
 of private specialist establishments in public healthcare.
 The development of operator activity in both F&R and
 healthcare and social welfare has naturally led investors
 to take positions beyond their national boundaries,
 negotiating local requirements in terms of health
 legislation and how costs are managed. These asset and
 locational diversification strategies also give breathing
 room to investors who are crammed into their domestic
 market. In just a few years, the European healthcare real         Sources: RCA, Cushman & Wakefield.

 estate market observed an acquisition volume increase
 from €4 to €5 billion. According to our initial estimates,
 these figures could stand at over €6 billion in 2018.            Healthcare real estate investment volume in Europe
                                                                  in 2018

 Most of the healthcare real estate investment volume is
 distributed across the United Kingdom and Germany,
 where the combined asset disposals stood at €2 billion in
 2018. Next in line are those with more modest volumes
 from €100 to €500 million in Scandinavia and Southern
 Europe. It is also worth noting the transactions carried out
 in Ireland, a country that is increasingly attracting investor
 interest.

 The disposals of large healthcare asset portfolios between
 operators and investors are still one of the main sources
 of opportunity in the European healthcare real estate
 market. These transactions accounted for around 69% of
 European investment volumes in 2018. These deals run             Sources: RCA, Cushman & Wakefield.

 alongside a few transactions between investors which,
 although still in the minority, are growing in the market.
                                                                  European prime yields in the care home sector

 Prime yields
 A benchmark of the evolution of the yields for the nursing
 home market across European countries has to be
 regarded with attention since major differences exist.
 Indeed, we observe significant differences regarding the
 lease duration, the type of the lease (double net or triple
 net for example) and the indexation of the rents.
 All these elements have an impact on the yield, which
 makes comparisons somewhat less relevant.
 The most aggressive prime yields are to be found in
 France, where yields for nursing homes are expected to
 reach as low as 4.00% in 2018. We see yields at 4.50% in              Source: Cushman & Wakefield

 the UK and from 4.75% - 4.90% in Belgium, Germany and
 Spain.

                                                                                                                           Page
                                                                                                                            Page5 5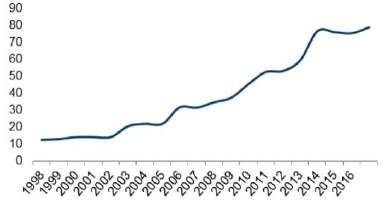
European Nursing Homes Report | 2019

 European Nursing Homes Report | 2019

 Principaux indicateurs européens

  Principaux indicateurs européens

                                                        NETHERLANDS
                                                 5,50%

                 UK                              790
                                                                                GERMANY
                                                 116 000
                   4,50%
                                                           NETHERLANDS                4,75%

                   2100                          305,50%
                                                    000
                                                                                      1760

                 UK
                  460 000                            790
                                                                                    GERMANY
                                                                                     952 000

                   504,50%
                     000                             116 000                          320 000
                                                                                        4,75%

                      2100                           30 000
                                                                                        1760

                      460 000                                                           952 000
 4,90%
                      50 000                                                            320 000
 100

 143 000

 250 000
   4,90%

BELGIUM
   100

   143 000
                                                                          5,75%
   250 000
                                                                          200
BELGIUM
                                                                          390 000
    4,75%
                                           4%
                                                                          805,75%
                                                                            000
    150
                                           500
    360 000
                                           590 000
                                                                      ITALY
                                                                         200

                                                                            390 000
    704,75%
      000
                                           454%
                                             000
                                                                            80 000
 SPAIN
    150
                                FRANCE       500
       360 000
                                             590 000
                                                                        ITALY
       70 000
                                             45 000

  SPAIN                           FRANCE
                                                                                      KPIS 2018
                                                                                      Prime Yield

                                                                     Total Invest Volume in M€

                                                                                        KPIS 2018
                                                                                Number of Beds

                                                                Forecast Number of Beds (2030)
                                                                                     Prime Yield

                                                                       Total Invest Volume in M€
                                                                                  Number of Beds
                                                                                              Page 6
                                                                 Forecast Number of Beds (2030)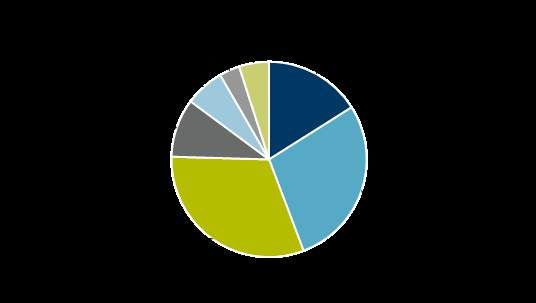
European Nursing Homes Report | 2019
France
Dependency ratio
Demographic evolution
Dependency Ratio Italy
Germany
The dependency ratio in France was at 33.9% in 2015 France
and is forecasted to increase to 52.1% by 2040. EU (28 countries)
Spain
In 2015, the dependency ratio in Ile-de-France (Greater Belgium
Paris Region) was significantly lower than in the rest of United Kingdom
the country (21%), whereas Limousin was by far the Austria
highest (41%). Netherlands
Currently, France’s dependency ratio is slightly above 0 10 20 30 40 50 60 70
the European average and is expected to fall just below 2015 2030 2050
the EU28 average in 2040. Source: Eurostat
Growth of the 80+ (Base = 100 in 2015)
240
Population over 80
220
In 2015, 18.4% of the French population was over 65. 200
This figure is forecasted to rise to 25.2% by 2040. 180
The over 80 group represents 5.8% of the French 160
population, this share is expected to grow and reach
9.3% by 2040.
140
Average life expectancy in France in 2014 was 82.8
120
years. 100
UE-28 Western Europe CEE Southern Europe France
Source: Eurostat
Nursing home landscape Number of beds (in 000s) and equipment rate,
2018
The equipment rate represents the number of beds over
the population aged over 80. It stands at 17% in France.
France is expected to need 45,000 more beds by 2030
and 130,000 units by 2050.
In France the timing of this growth will be mainly
determined by the legal framework: very few
authorisations to open new nursing homes have been
delivered since 2012, apart from extensions, however it
should be noted that the legal framework is likely to
change over the next few years.
Sources: Eurostat, Operators websites
Page
Page7 6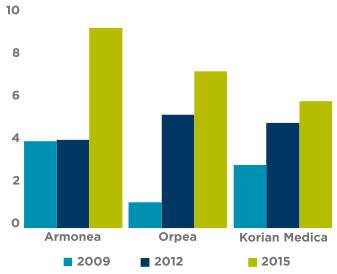
European Nursing Homes Report | 2019
Types of Operator Care home beds by type of Operator
100%
In France, operators are required to gain prior approval from local 90%
authorities before they can build, open or operate a new nursing 80%
70%
home. Operator’s typology can be split as follows: 60%
Public actors dominate the nursing home market in France, 50%
40%
managing around 50% of the total beds, with an average 30%
price/bed/day of around €51. 20%
10%
Non-profit operators manage around 25% of the total beds, 0%
France Belgium Spain Italy UK Germany Austria Poland
with an average price/bed/day of €60.
Private commercial operators manage around 30% of the Public Non-profit Private
total beds, with the higher average price/bed/day of €75. Sources: Orpea, National Statistics, Cushman & Wakefield
Main Operators Main private French Operators (# beds)
The French private commercial providers can be divided
into two categories: 45 000
40 000
• large groups with more than 15,000 beds, 35 000
30 000
• smaller groups mainly owned by their founders. 25 000
In 2018, 5 private providers (Korian, Orpea, DomusVi, 20 000
Colisée & Domidep) were managing more than 5,000 15 000
10 000
beds. A dozen providers were managing between 1,000 5 000
and 5,000 beds, creating a concentration dynamic. -
Korian Orpea DomusVi
We also note that the 3 largest operators manage more France Other European countries
beds in other European countries than in France. This
illustrates the increasing appetite of those actors for Sources: Operators web sites, Le Mensuel des Maisons de Retraite
developing their activities abroad, driven by the lack of new
domestic opportunities to boost their activity in their
domestic market.
Market Trends Evolution in number of beds of the 3 largest
Operators in France in 000s of beds
Concentrated market: the 3 main actors currently manage
more than half of the privately-operated beds.
The number of beds managed by those 3 operators
increased by 50% over the last 10 years, reflecting an
important number of acquisitions and mergers.
The growth rate is now easing off mainly because of:
• the limited number of government authorizations,
• the lack of investment opportunities (mature market).
French operators do not only expand within the European
market; China and South America appear to be the new Sources: Operators web sites, Cushman & Wakefield
target markets.
Page
Page87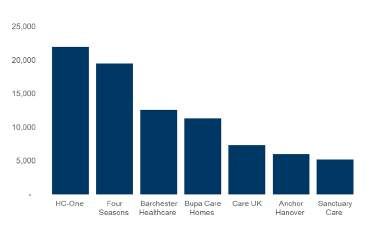
European Nursing Homes Report | 2019
Investment volume Investment volume in healthcare real estate by
type of asset, € million
In 2018 almost €500M was invested in nursing homes on
the French market.
This volume, which is the highest ever transacted in the
last 10 years, was driven by two transactions: the sale of 8
assets by GDP Vendome to AXA IM for almost €250M and
the sale & lease-back by RESIDALYA to ICADE SANTE of
14 assets for €189M.
The number of investment partnerships between
developers & operators should increase in the future.
These partnerships ensure developer’s early access to
new assets in an ultra-competitive environment and
guarantee some support for operators in their expansion
projects and property searches.
Main actors Share of the patrimony (in number of assets)
between main investors
In only 3 to 4 years, the landscape of investors has
considerably changed and broadened. The purchase of the
GECIMED and HORUS portfolios, mainly allocated as
nursing homes (EHPAD), enabled PRIMONIAL REIM to
rise to the second position of healthcare real estate
investors, with an asset portfolio valued at €1.9bn.
A historic property company within the sector and leader in
the current market, ICADE SANTE has a portfolio worth
over €4.5bn as at December 2018. By becoming closer to
KORIAN in 2017, ICADE SANTE entered the nursing
home market from which it was previously absent. ICADE
SANTE consolidated its leading position with the
RESIDALYA acquisition (see above). Sources: Websites operators, Cushman & Wakefield
The development of international operators, in cooperation
with French investors, may create a true expansion
dynamic. Indeed, recent acquisitions confirm this trend by
highlighting new French investment vehicles allocated in
particular to European healthcare real estate.
Prime yields in the healthcare sector (outside
Paris)
Yields
Investors clearly see the multiple advantages of healthcare
real estate; an asset class backed by a certain and legible
demographic reality that enables them to diversify their
portfolios, long-term leases with guaranteed rents and
yields that remain attractive despite the current low-rate
context.
Yield compression is indeed generalizing to healthcare
assets which are becoming rarer because of growing
investor interest. Prime asset yields are positioned at
4.00% for EHPAD nursing homes.
Page
Page9 8European Nursing Homes Report | 2019
Spain
Demographic evolution Dependency ratio
Dependency Ratio
Italy
The dependency ratio in Spain was at 27.9% in 2015 and is Germany
forecasted to increase to 54% by 2040. France
In 2015, the dependency ratio in the Canary and Balearic Islands EU (28 countries)
was significantly lower than the rest of the country (43%), whereas Spain
Castilla y León had by far the highest (60.1%). Belgium
United Kingdom
Currently, Spain’s dependency ratio is slightly below the European
Austria
average, however in 2040, it is expected to increase just over the
Netherlands
EU28 average and is forecasted to have the second highest old- 0 10 20 30 40 50 60 70
age dependency ratio of any European country by 2050.
2015 2030 2050
Sources: Eurostat
Population over 80
Growth of the 80+ (Base = 100 in 2015)
In 2018, 19% of the Spanish population was over 65. This figure is
forecasted to rise to 31.1% by 2040. 240
6.2% of people in Spain were over 80 in 2018 This demographic is 220
expected to increase to 10.3% by 2040.
200
The average life expectancy in Spain in 2018 was 84 years old.
180
160
140
120
100
UE-28 Western Europe CEE Southern Europe Spain
Source: Eurostat
Nursing home landscape Number of beds (in 000s) and equipment rate
The equipment rate represents the number of beds over the
population aged 80 and above. It stands at 14% in Spain.
The equipment rate in Spain is close to the European average but
varies between regions, with much lower equipment rates in the
South than in the Madrid and Barcelona regions.
Spain is expected to need 70,000 more beds until 2030, and more
than 150,000 by 2050, driven by the changes in family structures
and the ageing of the population.
Sources: Eurostat, Operators websites
Page
Page10
9European Nursing Homes Report | 2019
Types of Operator Care home beds by type of Operator
In Spain, organized mainly as a free market, Operators are split as
follows:
Public Operators manage 27% of the total stock.
Private non-profit providers manage the largest share of total
beds, with approximately 43% of the stock.
Private commercial providers operate 30% of the total beds.
Sources: Orpea, National Statistics, Cushman & Wakefield
Main Operators Main private Spanish Operators (# beds)
DomusVI: 141 properties with more than 24,000 beds following
the Geriatros and SARquavitae acquisitions. Furthermore, 60000
DomusVI acquired the group Gerovida in 2018 and has a project
50000
with 4 more properties and 426 beds in Spain in the pipeline.
40000
Orpea Ibérica: 52 properties with more than 8,000 beds.
Intercentros Ballesol: 48 properties with more than 7,000 beds 30000
and 6 properties with 698 beds in the pipeline. 20000
Amavir (Maisons de Famille): 43 properties with 6,399 beds. 10000
Sanitas Residential: 46 properties with 6,196 beds. 0
DomusVi Orpea Ballesol Maisons de Sanitas
Famille Residencial
Spain Other European countries
In 2018, only 7 private operators were managing more than
5,000 beds. Sources: Operators websites, PlantaDoce
In 2018, there was a total of 5,147 properties and 362,426 beds
managed by 2,030 private operators. Note that 33.17% of the
future projects for new property openings will be executed by
private operators.
We also note that the 2 largest operators, DomusVI and Orpea
are now French companies, relegating the first Spanish operator
to 3rd place (Grupo Ballesol) and reflecting the rising appetite of
French operators for the Spanish market.
Page 11
10European Nursing Homes Report | 2019
Market Trends
A high number of transactions took place over 2018. The trend for 2019 is to continue with a high number of
transactions and to improve the visibility of the market for external investors.
Over the course of 2018, most of the top operators like Domusvi and Orpea have implemented an international
expansion strategy. Domusvi expanded its market share to South America and Portugal; this activity is carried out
by the Spanish matrix of the company.
2018 saw the arrival of Spain on the European nursing homes leaderboard: Korian acquired 7 assets in the Malaga
region which represents 1,233 beds.
The centres with more than 100 beds in Spain represent 23,45% of the total market. Most of these centres are
managed by private operators.
Investment volume
Investment activity in 2018 was higher than in previous periods with acquisitions and mergers being the dominant
activities in the market. We estimate that around €150M of care home real estate was traded in 2018 based on RCA
data (this excludes the acquisition of Gerovida by DomusVi).
The number of partnerships between investors and operators could increase in the future, leading to further
increases in investment volumes.
Main investors
The Spanish market is not as developed as the French or German markets. The real estate component is most
often still owned by the operators. However, we are now observing an externalization of the real estate component;
several portfolios have been recently bought by investment funds.
In only 3 years, the landscape of investors has considerably broadened and changed. The good health of the
Spanish economy is reflected by the high number of operations signed during 2018. Most of these operations were
carried out by top operators such as DomusVi or Orpea.
Armonea, the leading Belgian operator of nursing homes is developing an ambitious expansion project. This has
placed the operator amongst the ten largest operators in terms of number of beds, with a total of 4,500.
2018 opened with the sale by La Saleta of 6 nursing homes (800 beds and a global surface of 21,500 sq m) to
Primonial REIM. The agreement was signed for €35M. It must be noted that the La Saleta group was bought a few
months earlier by Armonea, the leading Belgian operator for nursing homes.
2018 also saw the arrival of Spain on to the European nursing home leaderboard: Korian acquired 7 assets in the
Malaga region which represents 1,233 beds.
Page 11
12European Nursing Homes Report | 2019
Date Buyer Seller Assets Location Price (€M) NIY
Portfolio (18 assets, 2500 Share
2018 DomusVi Gerovida Multiregional N/A
beds) deal
Southern
2018 Korian Seniors Portfolio (7 assets, 1300 beds) Conf. Conf.
region
Grupo Portfolio (3 assets, no prime
2018 Healthcare Activos, Multiregional 40 N/A
Baugestión location)
Portfolio (5 assets, 840 beds
2018 Private Investor Urtinsa Group Madrid 60 N/A
no prime location)
Threestones
2018 Lluís Bou 1 asset (120 beds, 45,000m²) Catalonia NA NA
Capital
Sources: Cushman & Wakefield, RCA
Source: Cushman & Wakefield
Yields Prime Spanish yields in the nursing homes sector
Yield compression has become widespread amongst healthcare
assets which are becoming harder to find considering the
growing interest of investors.
C&W’s opinion of yields for prime assets with good
performances, located in prime cities, is estimated to range
between 4.75%-5.00%, in line with the 2017 trend.
For more second-tier locations, we estimate higher yields to be
appropriate, around 6.00%.
Source: Cushman & Wakefield
Page 13
12European Nursing Homes Report | 2019
Italy
Dependency ratio
Demographic evolution
United Kingdom
Dependency Ratio Austria
Netherlands
The dependency ratio in Italy was at 33.7% in 2015 and is Italy
forecasted to increase to 62.5% by 2050. France
Spain
Italy’s dependency ratio is well above the European average; it
Germany
will be 10 points above the European average by 2050. Belgium
EU (28 countries)
0 10 20 30 40 50 60 70
2015 2030 2050
Sources: Orpea, National Statistics, Cushman & Wakefield
Population over 80
In 2018, 21.5% of the Italian population was over 65. Growth of the 80+
6.67% of people in Italy were over 80 in 2018; this demographic Base = 100 in 2015
is expected to increase to 10.5% by 2040. 300
As the 80+ population has already grown substantially over the 250
last few years, demographic perspectives do not show, for this
part of the population, an increase as large as observed in the 200
rest of the CEE countries.
150
Average life expectancy in Italy as at 2018 is 84 years.
100
50
UE-28 Western Europe CEE Southern Europe Italy
Source: Eurostat
Nursing home landscape Number of beds (in 000s) and equipment rate
The equipment rate represents the number of beds over the
population aged 80 and above. It stands at 11% in Italy.
The equipment rate needed depends on the family structure
and considers the diversity of the countries as well as the
ageing rate and growth.
Italy sits close to the European average and is expected to
need 80,000 more beds by 2030; there are important
discrepancies between regions since a large part of the current
390,000 bed supply is in northern regions.
Source: Eurostat
Page 13
14European Nursing Homes Report | 2019
Care home beds by type of operator
Types of Operator 100%
90%
Public Operators. 80%
Operate 45% of the total beds. 70%
60%
Private commercial providers. 50%
40%
Operate approximately 20% of the total beds. 30%
20%
Private non-profit providers. 10%
Operate approximately 35% of the total beds. 0%
France Belgium Spain Italy Germany Austria Poland
Public Non-profit Private
Sources: Orpea, National Statistics, Cushman & Wakefield
Main actors Main Italian operators (# beds)
Accounting for around 15,000 beds, the top four private operators are:
70 000
Korian (Segesta) – 44 nursing homes with over 5,600 beds, 60 000
KOS – Operates over 48 nursing homes in Italy with around 50 000
5,500 beds. Contrary to its competitors which are active in Italy 40 000
and throughout Europe, KOS is the only major player that 30 000
operates exclusively within the domestic market, 20 000
La Villa (Maisons de Famille)– ~2,000 beds spread over 21 10 000
nursing homes, -
Korian KOS Maisons de Orpea
Orpea (Casa Mia) – 16 nursing homes with over 1,800 beds. Famille
Italy Other European countries
Sources: Website operators, Cushman & Wakefield
Market Trends
The privately-operated market in Italy is rather fragmented, with a high number of individual regional Operators.
In Italy, healthcare policies are decided upon at a regional level; care is free in Lombardy and Venetia. However
this is not the case in the other Italian regions.
The largest private Operators in Italy are international companies; French operators such as Maisons de Famille,
Orpea and Korian are all present on this market.
The main domestic Operator is KOS, a healthcare group headquartered in Milan which also operates
rehabilitation centers and hospitals.
By 2020, the rather low equipment rate, especially in southern Italy, is expected to attract both foreign and
domestic operators who will be interested in the strong operating figures.
Page 15
14European Nursing Homes Report | 2019
Investment volume
Investors in Italy are mainly focused on high-quality assets in good locations (especially in the northern regions) that
benefit from good tenants and long lease agreements.
In 2018 the nursing home investment volume in Italy is expected to reach over €200M.
The investment volume was driven by one main deal, the acquisition by ICADE SANTE of 7 nursing homes, yet to be
built, for a total of €112M. The nursing homes will be in the Piemonte, Veneto and Lombardy regions and are
expected to be delivered between 2020 and 2021, for a total of 1,020 beds. They will not be operated by the French
operator but rather by the local operator, Gruppo Gheron.
Main actors
Aside from ICADE SANTE, the investment market in 2018 was largely dominated by local investors, including
InvestiRE of which the Spazio Sanita fund now reaches more than 2,000 beds.
Most of the market activity is concentrated in the north of the country on lots ranging from €10 to €50M, mostly dealt
between local investors.
Date Buyer Seller Assets Location Price (€M) NIY
ICADE Portfolio (7 assets, c. 1,020
2018 NA Multiregional 112 NA
SANTE beds)
Portfolio (3 assets, c. 260
2018 InvestiRE Sereni Orizzonti Multiregional NA NA
beds)
leading Portfolio (6 assets in
2018 institutional NA Venice, Milan, Turin and Multiregional NA NA
investor Ancona)
Primonial Casa di Cura Le Terrazze -
2017 Candia Srl Cunardo NA NA
REIM (185 beds)
Portfolio (5 assets, c. 1,200
2017 AXA Gruppo Technit Multiregional 278 NA
beds)
2017 InvestiRE Undisclosed Vendor RSA Lazio and Emilia Multiregional 35 NA
Source: Cushman & Wakefield
Yields Prime care homes yield
Considering the asset type, (revenue security, long term leases, 7,50%
condition, structure, and location), we can compare healthcare 7,25%
yields to retail and office yields. 7,00%
High quality nursing homes (in terms of the building and the 6,75%
services offered), located near to or in urban centers that are 6,50%
6,25%
considered ‘prime,’ are expected to reach gross yields around
6,00%
5.75%, marking a slight decrease compared to 2017 levels. 5,75%
Prime assets continue to attract more and more foreign investors. 5,50%
2 0 0 7 2 0 0 8 2 0 0 9 2 0 1 0 2 0 11 2 0 1 2 2 0 1 3 2 0 1 4 2 0 1 5 2 0 1 6 2 0 1 7 2 0 1 8
They are drawn to the low equipment rate of the country and bet
on decreasing yields that are expected to reach sub 5,75% levels
Source: Cushman & Wakefield
in 2019.
For secondary assets, yields could rise to 7.00%-9.00%
depending on the property.
Page 15
16European Nursing Homes Report | 2019
Germany
Demographic evolution Dependency ratio
Dependency Ratio
Italy
The dependency ratio in Germany was at 32% in 2015 and is Germany
forecasted to increase to 51% by 2050. France
EU (28 countries)
The German dependency ratio is one of the highest in Europe Spain
with one person of 65+ for every three-working people. Currently, Belgium
Germany’s dependency ratio is slightly above the European United Kingdom
average; in 2050 it is expected to still be above the EU28 Austria
average. Netherlands
Germany is one of the European countries facing the most 0 10 20 30 40 50 60 70
challenging demographic changes. 2015 2030 2050
Source: Eurostat
Growth of the 80+ (Base = 100 in 2015)
Population over 80
The number of working people is expected to decrease steadily 240
from 2020 onward; from 54 million to 45 million within twenty 220
years. Over the same period, the elderly population is expected
200
to grow to a degree unseen elsewhere in Europe.
180
With 21.1% of its population over 65, Germany reaches the
highest proportion of elderly people in Europe. 160
140
120
100
UE-28 Western Europe CEE Southern Europe Germany
Source: Eurostat
Nursing home landscape Number of beds (in 000s) and equipment rate
The equipment rate represents the number of beds over the
population aged 80 and above. It stands at 18% in Germany.
Germany appears as one of the most mature nursing homes
markets in Europe: it benefits from the second highest equipment
rate in Europe, from the highest number of establishments and
from a very stable funding system.
Nursing homes in Germany are still regulated regionally; this has
prevented a high degree of market consolidation by limiting until
now the access of foreign investors.
Sources: Eurostat, Operators websites
Page 17
16European Nursing Homes Report | 2019
Types of Operator Care home beds by type of Operator
In Germany, private care and rehabilitation facilities are operated by
public, non-profit or private organizations:
Public operators manage 5% of the total beds, which is the
lowest rate in the nursing home landscape in Europe.
Private non-profit providers operate 53% of the total beds.
Private commercial providers operate 42% of the total beds,
the second highest share in Europe after the UK.
Sources: Orpea, National Statistics, Cushman & Wakefield
Main Operators Main private Operators in Germany (# beds)
According to the German Federal Statistical Office, there is a 45 000
total of 952,367 care beds in 14,480 facilities (+6.5% compared 40 000
to Dec-2015) in Germany. 35 000
The five largest Operators account for only 10% of all beds 30 000
provided, whereas the remainder of the market is very 25 000
fragmented. Those five Operators provide 26% of all private 20 000
beds, while the German care home market remains 15 000
10 000
fundamentally a regionally based industry.
5 000
Since 2015, Korian is the largest nursing home provider in -
Germany, with 234 facilities and 30,320 beds. Korian Alloheim Victor's Group Orpea Kursana
Germany Other European countries
Sources: Cushman & Wakefield, Operators websites, Care Invest
Page 17
18European Nursing Homes Report | 2019
Market Trends Care homes forecast in Germany until 2030
While around 3.4 million people required care in 2018 (19.4%
more than two years ago), this figure is likely to increase by
around 18 percent to over 4 million by 2023. However, the level
of demand already exceeds the supply of residential, inpatient
and semi-residential care places. Waiting lists for
accommodation for parents or elderly relatives requiring care
are becoming the norm yet nursing homes are already
operating at full capacity.
Assuming the proportion of elderly people requiring care
remains stable, the construction of at least 320,000 new care
places is imperative by 2030. In addition, many existing nursing
homes are ageing themselves and require high maintenance
Source: Cushman & Wakefield, Philips GmbH & Institute for Healthcare Business (hcb)
works. The investment required to build new facilities and to
modernize existing ones amounts to around €70bn. In addition,
there is a lack of appropriate alternative forms of housing for
those requiring care, especially barrier-free housing in
accordance with DIN 18040-2 regulations. This type of
housing, adapted for unrestricted wheelchair use, enables the
desired close integration during visitation. It also facilitates
outpatient and inpatient services to the benefit of those
requiring care.
More staff, better training and better pay, as well as raising the
status of care professionals in society, are just as essential as
a reliable and sustainable economic and legislative
background for private investments in nursing homes.
Investment volume Investment volume in nursing home real estate assets (€M)
German investment in nursing homes is dominated by listed
real estate companies and institutional investors pursuing long-
term investment strategies.
Between 2013 and 2017, more than €6.3bn was invested in
nursing homes and senior residence facilities throughout
Germany. In 2018, transaction volume in this sector increased
by 63% year-on-year to €1.76bn. This is the second highest
investment volume after the record year of 2016 which was
mainly dominated by large portfolio sales.
It should also be noted that there are increasing numbers of
health care REITs, Real Estate Investment Trusts, and Source: Cushman & Wakefield, RCA
investment funds specializing in this asset class.
Page 19
18European Nursing Homes Report | 2019
Main investors
2018 was dominated by some larger portfolio transactions. Deutsche Wohnen bought a 30 nursing homes for a
combined total of €680M, adding a further 4,600 care places to its existing portfolio. Thirteen of the nursing facilities
are situated in the Hamburg city area and were acquired from US investor Oaktree. To manage the facilities,
Deutsche Wohnen also bought a minority interest in Pflegen & Wohnen Hamburg GmbH. The other 17 facilities are
located across the country and are fully let to well-known operators under long leases.
Furthermore, Deutsche Wohnen bought seven senior centers and care facilities owned by Vivaplan GmbH of
Regensburg for €65M. The properties are located in Obertraubling, Parsberg, Mitterteich, Vilseck, Seubersdorf, and
Breitenbrunn (Bavaria), and Plauen (Saxony). Smaller lot sizes were invested during 2017 by German investment
funds specializing in this asset class with a regional/local investment focus, such as INP Holding AG, Patrizia,
Immac Group, Capital Bay, etc. This market fragmentation is attracting international investors to Germany.
In addition to the increasing interest from German institutional investors, Belgian investors such as REIT-type
vehicles like Cofinimmo and Aedifica and insurance-backed institutional investors like AG Real Estate are
particularly drawn to the German market. French investment managers and family offices like Primonial or
DOREA are also expanding their investment footprint with strategic acquisitions across Germany.
Recent deals
Main investment transactions in Germany (2018)
Price
Portfolio Properties Beds Yield OpCo / PropCo Buyer Seller Year
in M€
Pflege &
Senior Housing Deutsche Wohnen Wohnen /
30 4,600 680 n/a OpCo/PropCo Q3 2018
Portfolio AG SHI
Management
RevCap Semnior 5.50%
17 1,477 172 PropCo Cofinimmo Revcap Q2 2018
Housing (cap rate)
AG Insurance SA SHI
Healthcare Portfolio 7 n/a 130 4.30% (NIY) PropCo Q2 2018
(35%) Management
5.00% Deutsche Wohnen
Together 7 650 64 PropCo VivaPlan Q2 2018
(cap rate) AG
Cura Satana
9 604 45 n/a PropCo Dorea Cura Sana Q4 2018
Portfolio
Primonial REIM
BestCare Portfolio 5 n/a 39 n/a PropCo n/a Q2 2018
(SCPI Primovie)
Aedifica Senior 6.00%
4 465 39 PropCo Aedifica n/a Q2 2018
Housing (gross)
Bad Sachsa Senior 7.00%
4 221 19 PropCo Aedifica n/a Q4 2018
Housing Portfolio (gross)
Source: Cushman & Wakefield
Page 19
20European Nursing Homes Report | 2019
Yields Prime care homes yield
Prime yields (net) compressed further in 2018 to 4.75% – a 8,50%
decrease of 25 base points compared to YE 2017 – due to the 8,00%
high demand from institutional investors and the lack of suitable, 7,50%
newly built investment product. 7,00%
This level of yield is the lowest ever recorded for care homes but 6,50%
is still significantly higher than the yields of the main asset 6,00%
categories. Offices for example, have an average prime yield of 5,50%
2.94% across the five major German investment markets, in line 5,00%
with other European countries. 4,50%
It can be expected that new domestic and foreign market 4,00%
2 0 0 7 2 0 0 8 2 0 0 9 2 0 1 0 2 0 11 2 0 1 2 2 0 1 3 2 0 1 4 2 0 1 5 2 0 1 6 2 0 1 7 2 0 1 8
participants will increasingly seek established investment niches. Source: Cushman & Wakefield
The demand from institutional investors for well-positioned care
homes is unceasingly high, while new development activity in this
asset class is far too low. The resulting lack of supply puts
pressure on yields; first class-core property yields will remain
strong while net initial yields will be further compressed.
Page 21
20European Nursing Homes Report | 2019
Belgium
Dependency ratio
Demographic evolution
Dependency Ratio Italy
Germany
The dependency ratio (Inhabitants over 65 / Inhabitants France
between 15-64 years of age) in Belgium was at 27.9% in 2015 EU (28 countries)
and is forecasted to increase to 41.4% by 2050. Spain
In comparison to other European countries Belgium’s Belgium
dependency ratio is currently just below the EU28 average. It is United Kingdom
forecasted to be one of the lowest dependency ratios by 2050. Austria
Netherlands
Like in other European countries, the dependency ratio is lower 0 10 20 30 40 50 60 70
in the capital city than in the rest of the country. The 2015 2030 2050
dependency ratio in the Brussels-Capital Region is only 19%.
Sources: Eurostat
Population over 80 Growth of the 80+ (Base = 100 in 2015)
In 2015, 17.9% of the Belgian population was over 65, and this
figure is forecasted to rise to 22.5% by 2040. 240
5.4% of people in Belgium were over 80 in 2015; this age group 220
is also expected to increase to 7.5% by 2040. 200
Average life expectancy in Belgium in 2016 was 84.1 years and 180
should slightly increase in the coming years. 160
140
120
100
UE-28 Western Europe CEE Southern Europe Belgium
Sources: Eurostat
Nursing home landscape Belgium # Beds (in 000s, LHS) and annual growth
(%, RHS)
In Belgium, since 2000, we have observed a constant increase in
the total number of beds to reach around 148,000 beds in 2018.
150 6,0%
Flanders presents the lowest equipment rate with 116 beds per 145 5,0%
1,000 inhabitants of 75+ compared to Brussels (189) and Wallonia 140 4,0%
(158). Average for Belgium is around 135. 135
3,0%
130
The growth rate has been relatively stable, increasing by around 2,0%
125
1% per year between 2003 and 2012. From 2013 onward, growth 120 1,0%
has been slightly more substantial. In absolute figures, it 115 0,0%
represents a yearly increase of around 2,400 beds while the
annual needs are estimated to be between 3,000 and 3,500 beds.
# Beds Growth
Source: INAMI up to 2013, Korian Medica for 2014, 2015 and 2016
Page 21
22European Nursing Homes Report | 2019
Types of Operator Care home beds by type of Operators
Public Operators manage 30% of the total beds. On average they
manage the largest nursing homes (around 105 beds per nursing
home).
Private non-profit providers operate 37% of the total beds. This
type of operator dominates the market in Flanders (over 50% of
the beds).
Private commercial providers operate 33% of the total beds. This
type of operator is predominant in the Brussels region where it
makes up over 60% of the market (in terms of no. of beds)
Sources: Orpea, National Statistics, Cushman & Wakefield
Main Operators Main private Operators in Belgium (# beds)
Armonea: In 2015, the Belgian company Armonea acquired the 60000
care home operator Soprim@. Cumulatively, they now operate
9 000 beds. They operate around 85 nursing homes throughout 50000
Belgium. Moreover, in July 2016, Armonea acquired two 40000
operators abroad: La Saleta in Spain (32 nursing homes) and
DPUW in Germany (approximately 17 nursing homes). 30000
Orpea: The French group has more than 7,000 beds present in 20000
60 homes in Belgium. 10000
Korian: Since the 2013 merger with Medica, Korian has enlarged
0
its geographical coverage to include Belgium, which now Armonea Orpea Korian
accounts for around 11% of their total beds (over 7 000 beds). Belgium Other European countries
Sources: Cushman & Wakefield, Operators websites
Main private Operators in Belgium, number of beds
Market Trends (in 000s)
In Belgium, private operators manage around 32% of the total
number of beds which represents around 45,000 units.
As witnessed in Europe, we observe a trend towards an
expansion and consolidation of the private sector in the Belgian
nursing homes landscape.
In Belgium, the three largest private operators managed a total of
around 25,000 beds in 2017.
This represents around 20% of the total number of existing beds.
Compared to 2012, the three largest operators increased the
number of beds by more than 7,500 beds, mainly due to mergers
and acquisitions.
Local Operators like Armonea have started developing and Source: various
operating abroad with acquisitions to experience faster growth.
This trend is like the one we have seen in past years, mainly in
France.
Page 23
22European Nursing Homes Report | 2019
Investment volume in nursing home real estate
assets in Belgium (€M)
Investment volume
350 7,0%
The invested volumes for 2017 and 2018 in nursing homes stand 300 6,5%
at around €100M per year. However, the market lacks 250 6,0%
5,5%
transparency and invested volumes should be higher (around 200
5,0%
€250M on a yearly basis). 150
4,5%
100 4,0%
The security offered by this type of investment and the appetite 50 3,5%
for a more diversified portfolio, combined with positive aspects 0 3,0%
such as long-term and indexed cash flows (based on long-term
lease contracts) and limited capex for operational buildings (due
to the triple net leases) make investments in this sector very
attractive.
Invested volumes Prime yield
Assuming a need of 3,500 beds per year, the nursing home
market should record investment volumes between €450M and
€525M per year.
Share of the invested volumes between main
investors
Main investors
Care Property Invest and Aedifica were the most active
purchasers in 2018 on the Belgium market, continuing their
domination since 2016.
Some insurance companies such as Generali, Belfius, Federales
Assurances or Ethias purchased nursing homes over the past
few years without communicating the amounts and/or yields
recorded. They are therefore not included in the main investor
amounts.
Sources: Cushman & Wakefield, RCA
Recent deals
Main investment transactions in Belgium nursing homes (2018)
Investor Number of
Property Name City / Region Price (€M) NIY
beds
Portfolio of 2 nursing
Aedifica Multi-region 235 35 +/- 5%
homes
Aedifica Hof van Schoten Schoten 101 18 +/- 5%
Care Property Invest Ter Meeuwen Meeuwen-Gruitrode 81 14.8 NC
Care Property Invest ’t Neerhof Brakel 108 14.8 NC
Care Property Invest De Anjers Balen 62 11.1 NC
Yields
Following the strong compression observed these last years,
combined with growing involvement of institutional investors and
the low level of interest rates, prime yields stabilised in 2018 and
now stand at around 4.90%. Stabilization at this low level is also
expected in 2019, following the monetary policy of the ECB.
This level of yield is the lowest ever recorded for healthcare
assets.
Page 23
24European Nursing Homes Report | 2019
Netherlands
Dependency ratio
Demographic evolution
Dependency ratio
The dependency ratio (inhabitants over 65 / inhabitants between
15-64 years of age) in the Netherlands is currently at 29.5% and
is forecasted to increase to 45.3% by 2040.
The Dutch dependency ratio is currently well below the European
average and is expected to be below the EU28 average in 2040
as well.
Source: Eurostat
Sources: Eurostat
Population over 80
Growth of the 80+ (Base = 100 in 2015)
Currently, 19.2% of the Dutch population is over 65 years old. This
figure is expected to increase to 26.1% by 2040. Furthermore,
4.6% of the population is currently over 80 years old. This
demographic is also expected to rise to 8.7% by 2040.
In 2017 the average life expectancy in the Netherlands was 81.7
years. It is expected that the average life expectancy in 2040 will
be 86 years.
In 2017 the average life expectancy in the Netherlands was 81.7
years. It is expected that the average life expectancy in 2040 will
be 86 years.
Sources: Eurostat
Nursing home landscape
The equipment rate (the number of beds / the population aged 80 Number of beds (in 000s) and equipment rate, 2018
and above) in the Netherlands stands at approximately 15%.
It is expected that more than 30,000 additional beds will be
needed by 2030. This number is in addition to the required
redevelopment of existing (and obsolete) homes across the
country.
The government provision for elderly care in the Netherlands has
been under pressure from 2013 to 2017. This is due to cutbacks
and government policy that aims to change the funding system
and advocates for in-home care for the elderly with less
specialized needs.
Sources: Eurostat
Page 25
24European Nursing Homes Report | 2019
Types of Operator Care home beds by type of Operator
In the wake of the privatization of the Dutch market for elderly
care and recent government policy, the number of privatized
homes is on the rise. Although still relatively small compared to
the public sector, the privatized sector has grown exponentially
over the last years.
Public operators manage approximately 94% of the total capacity
of roughly 116.000 beds. On average they manage larger homes
(around 60 beds per home).
Private operators manage the remaining 6% of the total capacity.
On average they manage smaller homes (around 20 beds per
home). Sources: Orpea, National Statistics, Cushman & Wakefield
Main Operators
Traditionally, the elderly care sector was operated by approximately 400 public operators, each servicing their own
local working area. Because of the large number of public operators dispersed geographically and demographically,
there is no distinct market leader.
Since the privatization and government prompted changes in funding of elderly care, private operators have entered
the market with a predominately national focus for mid- and high-end concepts. In recent years however, more
operators are developing low-end concepts as well.
Currently, the approximately 350 privatized homes are operated by 85 commercial operators. Although the number
of commercial operators remains quite constant, the number of homes is on the rise. As seen in other countries,
we also expect to see operator consolidation in the Netherlands.
At the moment, approximately 10 domestic, commercial operators are actively expanding their portfolios. The
biggest operators currently operate up to 40 properties.
Market Trends
The financial results of Dutch public operators remain under pressure. Nonetheless, overall yields for the sector are
up over recent years. This is mainly due to increased volume agreements, arranged by the government.
Demographic evolution will require public operators to revitalize their existing capacity and expand with new homes.
(Foreign) investors may provide the necessary financial means to do so, when traditional ways of financing by
covered loans prove insufficient.
Although they still account for a small part of total capacity, larger private operators are quickly gaining market
shares. They achieve this primarily through opening completely new locations. Private operators are focused on
small scale residences versus large scale facilities; they are prioritizing better qualified staff in greater numbers to
achieve the overall result of quality over quantity.
In the coming years, private pan-European operators are expected to enter and expand the Dutch market for
privatized elderly homes.
Page 25
26European Nursing Homes Report | 2019
Investment volume in healthcare real estate in
Investment volume Netherlands
Investment activity in the healthcare sector in the Netherlands has
grown rapidly since 2015 and reached its highest level in 2018 with
a total transaction volume of €790M, an increase of more than 34%
compared to 2017.
The security offered by investments in real estate for elderly care
and the appetite for a more diversified portfolio, combined with
positive aspects such as long-term indexed cash flows (based on
long-term lease contracts) and limited capex (due to the triple net
leases) make these kinds of investments attractive.
It is expected that the total investment volume will increase in
coming years. However, the constrained availability of investment Source: Cushman & Wakefield
grade real estate is crucial for the outcome of total investment
volumes.
The investment market for elderly care homes has been polarized
for some time. High quality assets are benefitting from excess
demand, while predominantly inefficient and/or dated homes at the
opposite end of the spectrum have suffered from flat or falling
prices.
Main investors
Traditionally, Dutch elderly care homes were owned by public operators and housing corporations. These investors
and owner-/occupiers seldom sold their real estate; therefore, transactions were and are still scarce.
Due to the current interest of (foreign) investors, the real estate market for healthcare started to develop and mature.
Although the market is not as developed as in other European countries, an externalization of real estate to
investment funds is clearly visible.
This creates opportunities for sale and leaseback-transactions with operators to finance their growth strategy and/or
to solve troubled financial operations. Average investment size per location varies from €10M for public nursing homes.
Foreign investors like Belgian Aedifica and Cofinimmo were once again among the most active purchasers in 2018
on the Dutch market, following their domination in 2016 and 2017.
Dutch investors like pension funds Syntrus Achmea and Bouwinvest and investment funds like Holland Immo Group
and Sectie5 picked up the pace in 2017 and 2018 as well.
Page 27
26European Nursing Homes Report | 2019
Main investment transactions in the Netherlands in 2018:
Investor Seller Assets City / Region Price (€M) NIY
Heitman Bonita Group Woonlandschap Leyhoeve (423 beds) Groningen 82 NA
Zorgcentrum Het
Holland Immo Group Portfolio (4 assets, 396 beds) Overijssel 56 ~ 5,75%
Zand
Aedifica ECR Portfolio (3 assets, 254 beds) Multiregional 45 ~ 6.00%
Bouwinvest Stichting Inovium Veenstaete (152 beds) Kortenhoef 27,6 ~ 5,25%
Aedifica RW Capital I B.V. Portfolio (2 assets, 107 beds) Smakt & Velp 16 ~ 6.00%
Yields
Following the growing involvement of foreign investors and the low
level of interest rates, prime yields for elderly care homes continued
to compress throughout 2017 and 2018.
Currently, prime yields stand around 5.50% for newly delivered
buildings with tenants with a proven track record and long term (20
years) contracts.
Discounts are considered when an investment poses reduced risk
compared to a prime investment-profile, for example for contracts
with rent levels below market level. Discounts are also considered
when an investment poses increased risk, for example for contracts
shorter than 20 years. Source: Cushman & Wakefield
Under current market conditions, yields are expected to compress
even further in the months and years to come.
Page 27
28European Nursing Homes Report | 2019
UNITED KINGDOM
Dependency ratio
Demographic Evolution
Italy
Dependency Ratio Germany
France
The dependency ratio in the UK was at 27.4% in 2015 and it is EU (28 countries)
forecasted to increase to 40% by 2050. Spain
In 2015, the dependency ratio was only 12% in London; this is
Belgium
United Kingdom
significantly lower than the country’s average.
Austria
In comparison to other European countries the UK has a Netherlands
reasonably low dependency ratio. It is currently below the EU28 0 10 20 30 40 50 60 70
average and is also forecasted below the average for 2040. 2015 2030 2050
Source: Eurostat
Population over 80 Growth of the 80+ (Base = 100 in 2015)
The UK is projected to have more people than France by 2030 260
(UK: 70.47 million vs FRA: 70.40 million). By 2047 it is expected 240
to have the largest population in the EU. 220
In 2015, 17.7% of the UK population was over 65; this figure is 200
forecasted to rise to 23.3% by 2040. 180
4.7% of people in the UK were over 80 in 2015. This demographic 160
is also expected to increase to 7.6% by 2040, one of the highest 140
levels in Europe. 120
100
UE-28 Western Europe CEE Southern Europe UK
Source: Eurostat
Nursing home landscape Number of beds (in 000s) and equipment rate
The equipment rate represents the number of beds / populations
aged 80 and above. It varies from 6% in Poland to 25% in
Belgium and stands at 15% in the UK.
Residential elder care in the UK has effectively been partially
privatised since the 1980s, driven by the lower cost of
independent sector homes compared to the public sector. This in
turn is mainly due to the lower costs of labour in the independent
sector.
The independent sector has grown significantly over the last 25
years, with voluntary and public sector providers reducing in
number. Local authorities, however, remain the largest single
source of funding for older people in private residential settings.
Sources: Eurostat, Operators websites
Page 29
28European Nursing Homes Report | 2019
Care home beds by type of Operator
Types of Operator
Public Operators in the UK operate 5% of the total beds, the
lowest share in Europe along with Germany.
In contrast, private commercial providers manage 82% of
the total beds which is by far the highest ratio in Europe.
Private non-profit providers operate 13% of the total beds.
Sources: Orpea, National Statistics, Cushman & Wakefield
Main private Operators in the UK (# beds)
Main Operators
HC-One Ltd: with almost 22,000 beds, HC-One became the
largest provider of care home beds in the UK after its recent
acquisition of 122 care homes from Bupa. It is currently owned
by the PE firms Formation Capital and Safanad.
Four Seasons Health Care (“FSHC”) has almost 20,000 beds.
The organisation is owned by Terra Firma.
Barchester Healthcare: with almost 12,800 beds, Barchester
is planning on opening 600 more every year to expand its
portfolio.
Source: LaingBuisson
Bupa is still one of the largest UK providers, with more than
11,000 beds.
Care UK has over 7,000 beds spread over 100-plus residential
care homes in the UK. Currently owned by Bridgepoint.
Anchor Hanover is a not-for-profit organisation that manages
over 6,000 care beds across 121 homes.
Sanctuary Care has 5,200 beds across 100 homes and is also
a not-for-profit organisation.
Market Trends
The UK care home market is mainly operated by private commercial providers, representing more than 80% of
total beds. Within this figure, most of the residents’ funding comes from public sources, primarily local authorities.
The elderly care home industry remains a dispersed industry in the UK. The top 25 corporate Operators represent
only about 30% of bed stock.
The for-profit market has grown from 338,000 beds in 2007 to 376,000 in 2017, and although the growth has stalled
since 2015 (nationally, 6,000 beds deregistered in 2016 and 3,000 new beds were built which means a net loss of
3,000 beds) it is expected to need 50,000 more beds by 2030.
Many Operators continue to have appetite for development, although this is focused on the private pay market. As
a result, a high proportion of new build care home development is in South-Eastern England, while the economic
rationale for new buildings in less affluent areas remains challenging.
Page 29
30You can also read