SOCIODEMOGRAPHIC VARIABLES AS PREDICTORS OF ADVERSE OUTCOME IN SARS-COV-2 INFECTION: AN IRISH HOSPITAL EXPERIENCE
←
→
Page content transcription
If your browser does not render page correctly, please read the page content below
Irish Journal of Medical Science (1971 -)
https://doi.org/10.1007/s11845-020-02407-z

    ORIGINAL ARTICLE

Sociodemographic variables as predictors of adverse outcome
in SARS-CoV-2 infection: an Irish hospital experience
Richard J. Farrell 1 & Rhea O’Regan 1 & Eoghan O’Neill 2 & Grainne Bowens 2 & Anne Maclellan 2 & Anne Gileece 2 &
Maeve Bradley 1 & Claire Smyth 1 & Orlaith Kelly 1 & Barry Hall 1 & Liam Cormican 1 & John Faul 1 & Krzysztof Wanic 1 &
John McDermott 1 & Seamus Sreenan 1 & Tommy Kyaw Tun 1 & Trevor Duffy 1 & Azhar Iqbal Bhatti 1 & Orla Donohoe 1 &
Eamon Leen 3 & Niamh Collins 4 & Shane McGeary 5 & Catriona Cody 5 & Eamon Dolan 1 & Conor Burke 1

Received: 17 June 2020 / Accepted: 15 October 2020
# Royal Academy of Medicine in Ireland 2020

Abstract
Introduction Our hospital found itself at the epicentre of the Irish COVID-19 pandemic. We describe the organisational chal-
lenges faced in managing the surge and identified risk factors for mortality and ICU admission among hospitalised SARS-CoV-
2-infected patients.
Methods All hospitalised SARS-CoV-2 patients diagnosed between March 13 and May 1, 2020, were included. Demographic,
referral, deprivation, ethnicity and clinical data were recorded. Multivariable regression, including age-adjusted hazard ratios (HR
(95% CI), was used to explore risk factors associated with adverse outcomes.
Results Of 257 inpatients, 174 were discharged (68%) and 39 died (15%) in hospital. Two hundred three (79%) patients
presented from the community, 34 (13%) from care homes and 20 (8%) were existing inpatients. Forty-five percent of commu-
nity patients were of a non-Irish White or Black, Asian or minority ethnic (BAME) population, including 34 Roma (13%)
compared to 3% of care home and 5% of existing inpatients, (p < 0.001). Twenty-two patients were healthcare workers (9%). Of
31 patients (12%) requiring ICU admission, 18 were discharged (58%) and 7 died (23%). Being overweight/obese HR (95% CI)
3.09 (1.32, 7.23), p = 0.009; a care home resident 2.68 (1.24, 5.6), p = 0.012; socioeconomically deprived 1.05 (1.01, 1.09), p =
0.012; and older 1.04 (1.01, 1.06), p = 0.002 were significantly associated with death. Non-Irish White or BAME were not
significantly associated with death 1.31 (0.28, 6.22), p = 0.63 but were significantly associated with ICU admission 4.38 (1.38,
14.2), p = 0.014 as was being overweight/obese 2.37 (1.37, 6.83), p = 0.01.
Conclusion The COVID-19 pandemic posed unprecedented organisational issues for our hospital resulting in the greatest surge
in ICU capacity above baseline of any Irish hospital. Being overweight/obese, a care home resident, socioeconomically deprived
and older were significantly associated with death, while ethnicity and being overweight/obese were significantly associated with
ICU admission.

Keywords Clinical care . COVID-19 . Ethnicity . Obesity . Outcomes . Socioeconomic deprivation

* Richard J. Farrell                                                     Introduction
  rfarrell@rcsi.ie

                                                                         On February 29, 2020, the first case of novel severe acute
1
     Departments of Medicine, Connolly Hospital, Ireland and Royal       respiratory syndrome coronavirus-2 (SARS-CoV-2) infection
     College of Surgeons Ireland, Dublin, Ireland
                                                                         in Ireland was reported in a woman who had travelled through
2
     Departments of Microbiology, Connolly Hospital, Ireland and Royal   Dublin Airport on her way to Northern Ireland from Northern
     College of Surgeons Ireland, Dublin, Ireland
                                                                         Italy [1]. On March 11, the first death of a patient in Ireland—
3
     Departments of Pathology, Connolly Hospital, Ireland and Royal      a woman in the east of the country [2]—was confirmed, the
     College of Surgeons Ireland, Dublin, Ireland
                                                                         same day the World Health Organisation announced that the
4
     Emergency Department, Connolly Hospital, Ireland and Royal          coronavirus disease 2019 (COVID-19) was a pandemic. Since
     College of Surgeons Ireland, Dublin, Ireland
                                                                         then, there has been a rapid increase in cases, with over 20,833
5
     Departments of Anaesthetics, Connolly Hospital, Ireland and Royal   confirmed cases and 2768 hospital admissions including 367
     College of Surgeons Ireland, Dublin, Ireland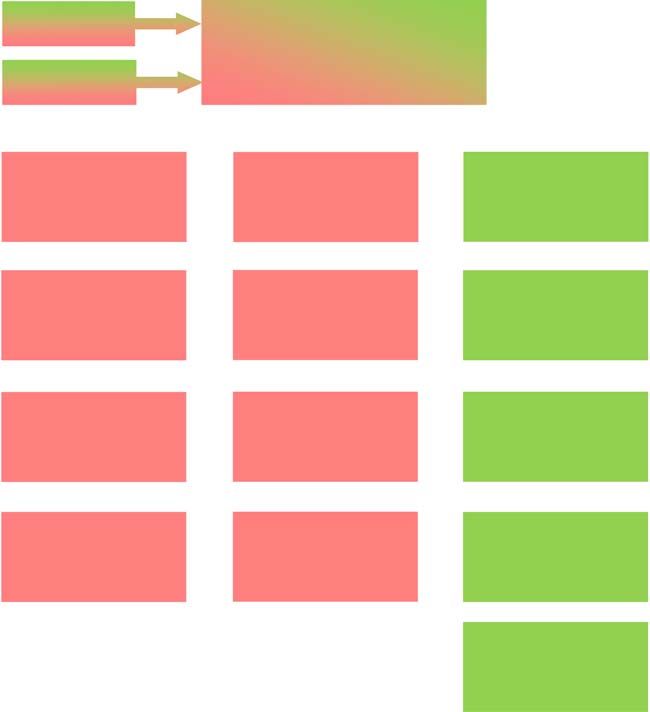
Ir J Med Sci

ICU admissions and 1265 deaths as of May 1 in the Republic       HCWs were defined as any staff working in any public or
of Ireland [3]. Dublin has become the epicentre of the Irish     private healthcare facility (includes care assistants, cleaners,
outbreak with the highest incidence across the country and       caterers, home help). The Charlson Comorbidity Index was
half of all confirmed cases. Connolly Hospital                   used to score the severity and number of comorbidities. With
Blanchardstown (CHB) is a 400-bed academic tertiary care         the exception of care home residents, all patients admitted to
centre, located in the northwest of Dublin, with high levels     CHB had their relative affluence and deprivation measured
of socioeconomic deprivation, care homes and non-Irish           using the 2016 Pobal HP Deprivation Index which was calcu-
White and Black, Asian or minority ethnic (BAME) popula-         lated from their Eircode or residential address, as recorded
tions among its large catchment area, contributing to the fact   from the hospital’s patient electronic record. The Pobal HP
that Dublin northwest has the highest concentration of           Deprivation Index for Small Areas maps socioeconomic data
COVID-19 in Ireland, with 2183 cases and 115 deaths [4].         among all residents in the Republic of Ireland and is more
While initial reports suggest that ethnic minorities may be      homogeneous in its social composition than previous indices
experiencing more severe COVID-19 outcomes, to date it           with a uniform population size of just under 100 households
remains unclear to what degree this association is driven by     [5]. Ethical approval was waived on the basis that this clinical
socioeconomic deprivation.                                       research took place during a pandemic emergency.
   The first case of COVID-19 pneumonia was confirmed in
our hospital on March 13. Here, we present details of all pa-    Statistical analysis
tients admitted to our hospital over the subsequent 6-week
period with laboratory confirmed SARS-CoV-2 infection            A descriptive summary of patient characteristics at admittance
and a definite clinical outcome (death or discharge) as of       was produced for all patients and stratified by location prior to
May 1, 2020. We aim to explore risk factors for death in         admission (i.e. community, care home or existing inpatient).
hospitalised patients and risk of ICU admission, as well as      The distribution of continuous variables was assessed for nor-
share our early experience in managing the surge of SARS-        mality using histograms and skewness tests. The variables
CoV-2-infected patients that required hospital admission, a      were found to be normally distributed and therefore were
significant proportion of whom included care home residents      summarised using mean (standard deviation [SD]).
and healthcare workers as well as patients from an ethnically    Categorical variables were summarised using number (%).
diverse population. We describe the unprecedented                Admittance characteristics were compared between locations
organisational issues faced by our hospital which, at its peak   prior to admission using ANOVA tests for continuous vari-
in early April, saw 43% of all acute medical beds occupied by    ables and chi-square tests for categorical variables. The depri-
patients with COVID-19 pneumonia, 159 staff (12% of our          vation index was not estimated for care home patients because
WTE) on COVID-19-related leave while having to increase          this Eircode-based score is unlikely to be a reasonable mea-
our critical care capacity by 240% from baseline, the largest    sure of deprivation score for care home residents.
such increase in Ireland (https://www.noca.ie/audits/irish-na-      The primary outcome was death in hospital. For each
tional-icu-audit).                                               categorical attendance characteristic, the number (%) of
                                                                 survivors and non-survivors was produced. For each con-
                                                                 tinuous attendance characteristic, the mean (SD) for sur-
Methods                                                          vivors and non-survivors was estimated. Survival analy-
                                                                 sis was used to test whether there was a difference in the
Following confirmation of the first COVID-19 pneumonia           risk of hospital death based on attendance characteristics
diagnosis at our hospital on March 13, our Microbiology          using a Cox proportional hazards model. Patients still
Department generated and maintained a Microsoft Excel            alive at the end of the observation period (May 1,
spreadsheet database detailing all confirmed cases of SARS-      2020) were censored. Initial analysis showed that age
CoV-2 infection collected by our hospital’s laboratory. Basic    was a strong confounder of the relationship between at-
demographic data (age, gender, ethnicity), source of referral    tendance characteristics and hospital death; therefore,
(community, care home, existing inpatients) and date naso-       age-adjusted hazard ratios, 95% confidence intervals
pharyngeal RT-PCR swabs were collected, and admission            and two-sided p values are presented. Similar analysis
date, location, ward transfer (including ICU admittance), dis-   was performed for the secondary outcome of ICU admit-
charge date and re-admission if applicable were all recorded.    tance. As people admitted from care homes or as existing
An audit of the Emergency Department’s Symphony electron-        inpatients had characteristics that are not necessarily rep-
ic information software system was carried out to establish      resentative of the general population, a sensitivity analy-
ethnicity, healthcare worker (HCW) status, comorbidities,        sis was conducted by repeating the main analyses with
body mass index (BMI), smoking history and medications           only patients admitted from a community setting includ-
used in patients presenting with SARS-CoV-2 infection.           ed. All analysis was performed in Stata 16.0.
Ir J Med Sci
Organisational measures were re-assigned including three designated COVID-19 wards
and five designated non-COVID-19 wards.
In our hospital, preparations for the COVID-19 outbreak be- From March 23, all outpatient biologic infusions were
gan in late January 2020 with the establishment of a multi- moved from the main hospital to a separate infusion facility
disciplinary outbreak management team which included in our adjacent Ambulatory Paediatric Hospital. On March 25,
Emergency Medicine and Microbiology. Following confirma- twice daily in-house SARS-CoV-2 testing was introduced
tion of our first COVID-19 inpatient, our hospital was trans- using the Seegene molecular system (Allplex 2019-nCoV as-
formed in order to manage a large influx of COVID-19 pa- say) for all patients who fit the national testing criteria [6].
tients while, at the same time, ensuring safe urgent care for This ensured a maximum turnaround time from sampling to
non-COVID-19 patients. In addition to twice daily ICU hud- test result of 24 h and allowed optimum patient and bed man-
dles, a daily ED huddle, three-weekly consultant huddles ex- agement during the peak of the pandemic. COVID-19 antivi-
ecutive team meetings took place every Monday to Sunday ral protocols were established in line with national HSE guide-
morning in our auditorium to update the COVID-19 manage- lines, and all clinical pathways were uploaded to the hospital’s
ment team on the status of all confirmed and suspected pa- X-drive. On March 30, an ED triage tent was installed by the
tients with SARS-CoV-2 infection. Discussions took place Irish Defence Forces, and the HSE took over the running of all
with regard to Emergency Department; medical and critical private hospitals to increase inpatient and critical care capac-
care bed capacity; daily personal protective equipment (PPE) ity. Following this, all elective surgery was moved to the
stock and usage updates; microbiology, laboratory and infec- Hermitage Medical Clinic, Cappagh Orthopaedic Hospital
tion prevention and control updates; radiology pathways; and the Santry Sports Clinic. On March 31, local guidance
pharmacy updates on critical care medications; and updates was updated to ensure that all HCWs use face masks for all
on the hospital’s oxygen capacity. Intensive training and clinical encounters, particularly where social distancing (2 m)
upskilling of all HCWs were facilitated by daily PPE donning could not be maintained.
and doffing education sessions while nursing ICU up-skill On April 1, a comfort room was set up for staff by our
training was arranged for nurses redeployed from the wards Social Work Department, peer support sessions were provided
to critical care. Our Occupational Health Department pro- in the oratory by the hospital chaplaincy and an isolation unit
vided daily updates regarding on the number of staff self- in City West Hotel was opened for patients discharged from
isolating. Our Human Resources Department coordinated hospital with SARS-CoV-2 infection who could not safely
hospital volunteers including former employees, while self-isolate at home. On April 8, our Surgical Day Ward
twenty RCSI medical students volunteered to be part of opened as a High-Dependency Unit to facilitate patients being
our ICU proning teams. discharged from ICU. On April 17, hospital policy was
The COVID-19 pandemic forced a major reorganisation of amended to test all patients admitted from care homes for
our patient flow (Fig. 1). A 5-cubicle section of ED and the 3- SARS-CoV-2 infection, regardless of the presence or absence
bed ED resuscitation area were cordoned off for all suspected of symptoms. On April 23, all outpatient endoscopy was
admissions with SARS-CoV-2 infection. On March 20, a 7- transferred to the Bon Secours, and emergency endoscopies
bed triage, assessment and isolation area adjacent to the ED were moved to theatre, and on April 29, discharge pathways
for cohorting suspected COVID-19 patients pending results were established to Cappagh Rehabilitation Unit and the Bon
was opened. Suspected COVID-19 patients with an early Secours Hospital for ambulatory non-COVID-19 inpatients as
warning score (EWS) of less than 3 were typically discharged, well as Clontarf Rehabilitation Unit for less ambulant
while those with an EWS greater than 3 were admitted. Our COVID-19 inpatients.
critical care capacity increased by 240%, from 5 to 17 ICU At its peak on April 6, we had 64 inpatients with confirmed
beds making our 6-bed CCU into a 2nd ICU and our Recovery SARS-CoV-2 infection across three designated wards, ac-
Unit in Theatre into a 3rd ICU making an additional 6 critical counting for 43% of all acute medical beds, while on April
care beds available. One operating theatre was kept open for 8, 159 staff were registered as being on COVID-19 leave
inpatient care or emergency surgery and endoscopy. In tan- representing 11.9% of our current 1340 whole-time equivalent
dem with HSE guidelines, our hospital adopted a no visiting hospital staff complement. On March 30, 11 ventilated pa-
policy, and from March 23, all outpatient clinics, ambulatory tients with confirmed SARS-CoV-2 infection were occupying
surgeries, elective admissions and procedures were cancelled all three ICUs, and the hospital experienced a surge of criti-
and staff leave was cancelled. This enabled our 18 medical cally ill patients arriving to its ED department which exceeded
consultants and 64 NCHDs to cover a COVID-19 and non- our hospital’s critical care capacity requiring the transfer of
COVID-19 rota. Approximately 40 inpatients who had been patients to ICUs in other hospitals identified by the recently
identified as delayed discharges prior to the COVID-19 pan- established ICU bed information system. This was achieved
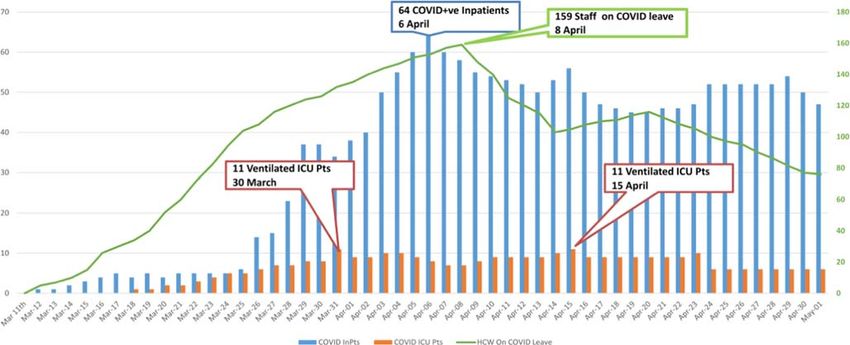
demic were moved to care homes in our catchment area, in safely and efficiently by the MICAS service. Figure 2 sum-
order to increase medical bed capacity. Eight home wards marises the total number of COVID inpatients, ventilated ICUIr J Med Sci
Fig. 1 Reorganisation of COMMUNITY EMERGENCY DEPARTMENT
Connolly Hospital patient flow PRESENTATIONS 6 COVID-19 Cubicles
3 COVID-19 Bed Resuscitaon Area
CARE HOMES Emergency Physicians
PRESENTATIONS
HOLLY DAY WARD INTENSIVE CARE UNIT 1 ELM WARD
COVID-19 COVID-19 NON COVID-19
7 Triage Beds 5 Crical Care Beds 32 Beds
Exisng ICU (1 single) 8 Single Rooms
Emergency Physicians Crical Care Specialists Respiratory Physicians
BEECH WARD INTENSIVE CARE UNIT 2 CYPRESS WARD
COVID-19 COVID-19 NON COVID-19
24 Beds 6 Crical Care Beds 16 Beds
4 Single Rooms Exisng CCU (1 single) 4 CCU, 4 Single Rooms
Rheumatology Physicians Crical Care Specialists Cardiologists
ROWAN WARD INTENSIVE CARE UNIT 3 LAUREL/REDWOOD WARD
COVID-19 COVID-19 NON COVID-19
28 Beds 6 Crical Care Beds 64 Beds
6 Single Rooms Exisng OR Recovery 16 Single Rooms
Gerontologists Crical Care Specialists Physicians/Surgeons
MAPLE WARD SURGICAL DAY WARD WOODLANDS WARD
COVID-19 COVID-19 NON COVID-19
32 Beds 6 Step Down Beds 24 Beds
8 Single Rooms 2 Single Rooms 4 Single Rooms
Gastroenterologists Respiratory Physicians Gerontologists
CHERRY WARD
NON COVID-19
20 Beds
8 Single Rooms
Endocrinologists
Fig. 2 COVID-19 inpatients, ventilated ICU patients and healthcare 11 ICU patients and the total number of Connolly Hospital healthcare
workers on COVID-19 leave. Legend Fig. 2. This figure summarises workers on COVID leave (green trend line) peaking on April 8 when 159
the total number of COVID inpatients (blue bars) peaking on April 6 members of staff were on COVID leave representing 12% of our hospital
with 64 COVID inpatients, the number of ventilated COVID ICU staff complement
patients (orange bars) peaking on March 30 and again on April 15 withIr J Med Sci
COVID patients and a trend line reflecting the number of Outcomes during stay
HCWs on COVID leave between March 11 and May 1,
2020. As of May 1, there were 186 inpatients (53 COVID- Of the 257 patients admitted with confirmed SARS-CoV-2
19 cases, 116 non-COVID-19 and 17 query COVID-19), 6 infection, there were 218 (84.8%) survivors and 39 non-
patients with COVID-19 pneumonia remained in ICU (4 on survivors (15.2%) (Fig. 3). Of the 218 survivors, 174
ventilators) and a total of 76 staff remained on COVID-19 (79.8%) were discharged and 44 (20.2%) were still in hospital
leave. at the end of the May 1 observation period. Mean length of
stay did not differ significantly (p = 0.3) between survivors
(mean [SD] = 13.5 days [1.3], range = 1 to 121) and non-
survivors (mean [SD] = 10.3 [2.0], range = 1 to 65). Of the
Results 31 patients admitted to ICU, 18 (58%) were discharged, 6
(19.3%) were still in ICU as of May 1 and 7 (22.6%) died
Descriptive characteristics (Fig. 4). Twenty-five of the 31 patients admitted to ICU re-
quired ventilation (80.6%), the majority of whom required
Between March 13 and May 1, a total of 382 laboratory- frequent proning. The length of stay did not significantly dif-
confirmed COVID-19 cases were recorded in the fer (p = 0.3) between patients admitted to ICU (mean [SD] =
Microbiology database. Two hundred fifty-seven people 16.1 days [1.5]) and those not admitted to ICU (mean [SD] =
were admitted with a diagnosis of SARS-CoV-2 infection 12.6 days [1.3]). There was no significant difference in mor-
(203 from community, 34 from care homes and 20 tality risk between those admitted and not admitted to ICU
existing inpatients). Table 1 shows their descriptive char- after adjusting for age (HR [95% CI] = 1.66 [0.69, 4.01],
acteristics at admittance. Patients admitted from care p = 0.26.
homes (mean [SD] = 76.9 years[13.5]) and existing inpa-
tients (mean [SD] = 74.8 years [10.2]) were significantly Risk factors for hospital death
older than those admitted from the community (mean
[SD] = 55.9 years [17.4]; p < 0.001). Existing inpatients Age was a strong predictor of hospital death with a 4% in-
(mean [SD] = − 2.1 [8.4]) were also more deprived on av- crease in mortality for each year increase in age (HR [95%
erage than community patients (mean [SD] = 2.8 [10.2]; CI] = 1.04 [1.01, 1.06], p = 0.002; Table 2). Table 2 shows the
p < 0.5) and predominantly male, p = 0.01. Another sig- age-adjusted hazard ratios for risk of hospital death based on
nificant difference at admittance was that 45% of commu- other admittance characteristics. Deprivation was a strong pre-
nity patients were of a non-Irish White or BAME popu- dictor of mortality, even after adjustment for age, with a per-
lation compared to 3% of care home and 5% of existing centage point increase in deprivation associated with a 5%
inpatients, (p < 0.001). The ethnicities of the community increase in mortality (adjusted HR [95% CI] = 1.05 [1.01,
patients comprised 49 BAME and 42 other White includ- 1.09], p = 0.012). After adjusting for age, having a comorbid-
ing 33 from the Roma community which included a clus- ity (p = 0.1), gender (p = 0.2) and smoking status (p = 0.24)
ter of infections identified among Roma members of a were not significantly associated with hospital death. There
congregation attending a church service. There were 22 was no significant difference in mortality between community
HCWs, all BAME and all admitted from the community. patients and existing inpatients (p = 0.07). However, patients
There were 7 healthcare assistants, 6 cleaners, 4 caterers, from care homes were more likely (adjusted HR [95% CI] =
3 nurses, 1 doctor and 1 home help. There were no dif- 2.68 [1.24, 5.60], p = 0.012) to die than community patients
ferences in terms of smoking status (p = 0.78) or after adjusting for age. Some of this excess risk was explained
overweight/obese status (p = 0.87). Comorbidities were by the additional comorbidity burden among care home resi-
present in over three-quarters of our patients with hyper- dents. After adjusting for Charlson Comorbidity Index and
tension being the most common comorbidity, followed by age, care home patients no longer had a significantly increase
type 2 diabetes mellitus, ischaemic heart disease and asth- mortality risk compared with community patients (adjusted
ma. Among community patients, 70% had at least one HR [95% CI] = 1.96 [0.87, 4.42], p = 0.1.
comorbidity, whereas all care home patients and all but Patients who were overweight (BMI 25–30) or obese (BMI
one existing inpatient had at least one comorbidity (p < > 30) were over 3 times as likely to die in hospital than those
0.001). Care home patients and existing inpatients also with a BMI in the normal range after adjusting for age (adjust-
tended to have a higher Charlson Comorbidity Index com- ed HR [95% CI] = 3.09 [1.32, 7.23], p = 0.009). Further
pared with community patients (p < 0.001). Sustained vi- adjusting for their Charlson Comorbidity Index reduced the
ral detection in nasopharyngeal samples among some el- risk, and it was no longer statistically significant (adjusted HR
derly survivors significantly delayed their discharge back [95% CI] = 2.20 [0.88, 5.52], p = 0.093; data not in Table).
to care homes in many cases by several weeks. Results were similar in the sensitivity analysis restricted toIr J Med Sci
Table 1 Descriptive characteristics at admittance of 257 COVID-19 patients
Location prior to admission All (n = 257)
Characteristic Community (n = 203) Care Home (n = 34) Existing inpatient (n = 20) p valuea
Mean (SD) Mean (SD) Mean (SD) Mean (SD)
Age, years 55.9 (17.4) 76.9 (13.5) 74.8 (10.2) < 0.001 60.1 (18.4)
Deprivation scoreb 2.8 (10.2) – − 2.1 (8.4) 0.049 2.4 (10.1)
N (%c) N (%c) N (%c) N (%c)
Gender
Female 86 (42.4) 16 (47.1) 2 (10.0) 104 (40.5)
Male 117 (57.6) 18 (52.9) 18 (90.0) 0.013 153 (59.5)
Ethnicity
White–Irish 112 (55.2) 33 (97.1) 19 (95.0) 164 (63.8)
White–other 42 (20.7) 1 (2.9) 1 (5.0) 44 (17.1)
BAME 49 (24.1) 0 (0.0) 0 (0.0) < 0.001 49 (24.1)
Healthcare worker
No 181 (89.2) 34 (100.0) 20 (100.0) 235 (91.4)
Yes 22 (10.8) 0 (0.0) 0 (0.0) 0.041 22 (8.6)
Smoker
No 180 (88.7) 31 (91.2) 17 (85.0) 228 (88.7)
Yes 23 (11.3) 3 (8.8) 3 (15.0) 0.786 29 (11.3)
Overweight/obese
No 73 (36.0) 12 (35.3) 6 (30.0) 91 (35.4)
Yes 130 (64.0) 22 (64.7) 14 (70.0) 0.868 166 (64.6)
At least one comorbidity
No 60 (29.6) 0 (0.0) 1 (5.0) 61 (23.7)
Yes 143 (70.4) 34 (100.0) 19 (95.0) < 0.001 196 (76.3)
Charlson Index
0 62 (30.5) 1 (2.9) 1 (5.0) 64 (24.9)
1 53 (26.1) 3 (8.8) 3 (15.0) 59 (23.0)
2 40 (19.7) 11 (32.4) 5 (25.0) 56 (21.8)
3 25 (12.3) 8 (23.5) 3 (15.0) 36 (14.0)
≥4 23 (11.3) 11 (32.4) 8 (40.0) < 0.001 42 (16.3)
Abbreviations: SD standard deviation
There were no missing data for any of the variables, except deprivation score as described below
a
p values test for a difference between patients from community, care home and inpatient settings. They are estimated using ANOVA tests for
continuous variables and chi-square tests for categorical variables
b
Deprivation score was measured using Pobal HP Deprivation Index (PDI), which is an Eircode-based relative measure of deprivation. Deprivation
scores are not generated for care home residents
c
Percentage out of total number of patients admitted from that location
only those patients admitted from the community. Compared not associated with admittance to ICU. Only 1 of the ICU
with White Irish people, those of other White (p = 0.886) and patients was from a non-community setting. Compared with
BAME (p = 0.405) ethnicities did not have an increased risk White Irish patients, all other ethnic groups including other
of hospital death, after adjusting for age. This was also the White (p = 0.008) and other BAME (p = 0.023) had an ap-
case when ethnicity was broken down into further proximately fourfold increased risk of ICU admittance after
subcategories. adjusting for age (Table 3). HCWs were also more likely to be
admitted to ICU than non-HCWs (age-adjusted HR [95%
Risk factors for ICU admittance CI] = 2.71 [1.01, 7.25], p = 0.047); however, of the 5
healthcare workers admitted to ICU, one died. This increased
Table 3 shows risk factors for admittance to ICU. As age risk of ICU admittance was still present, albeit non-signifi-
increased, the chance of ICU admittance decreased which re- cantly, after adjusting for ethnicity (adjusted HR [95% CI] =
flects both increasing comorbidity with age and COVID-19 2.87 [0.53, 15.59], p = 0.222; data not in Table). After
severity (HR [95% CI] = 0.94 [0.92, 0.97], p < 0.001). After adjusting for age patients who were overweight or obese were
adjusting for age, deprivation (p = 0.196), comorbidity (p = over twice as likely to require admission to ICU (age-adjusted
0.128), gender (p = 0.927) or smoking status (p = 0.527) were HR (95% CI) = 2.37 (1.37, 6.83), p = 0.01.Ir J Med Sci
Fig. 3 Total number of Connolly 250
Hospital COVID admissions:
survivors and deaths between 200
March 11 and May 1, 2020
150
Admied Paents
100 Survivors 218
Admied Paents
50
Deaths 39
0
Apr-01
Apr-25
May-01
Apr-04
Apr-07
Apr-10
Apr-13
Apr-16
Apr-19
Apr-22
Apr-28
Mar-14
Mar-17
Mar-20
Mar-23
Mar-26
Mar-29
Mar 11th
Discussion development of a large cluster of SARS-CoV-2 infection
among patients admitted to our Woodlands ‘nursing home’
The first phase of the COVID-19 pandemic posed many un- ward. This in turn led to the triage criteria in our ED being
precedented challenges in the organisation of an acute Irish adjusted accordingly, with introduction of testing for SARS-
hospital, in particular the delivery of acute medical and critical CoV-2 infection on all ED admission from care homes in mid-
care and the management of SARS-CoV-2 infection among a April extended to all ED admissions by end of April.
large caseload of patients from care homes. We maintained Advanced age has been reported as an independent predic-
adequate stocks of PPE throughout the surge and our tor of mortality in COVID-19 [11], as it was with SARS and
reorganisation of critical care facilities allowed all patients MERS [12, 13]. Our initial analysis showed that age was such
with COVID-19 pneumonia who required ICU admission ac- a strong confounder of the relationship between hospital ad-
cess to mechanical ventilation. We noted a remarkably similar mission and death that age-adjusted hazard ratios were calcu-
pre-admission disease course in most patients, which reflects lated. Age-dependent defects in T cell and B cell function and
the first reports from Wuhan, China [7, 8]. The disease starts the excess production of type 2 cytokines could lead to a
with mild respiratory symptoms, fever, and malaise followed deficiency in the hosts’ ability to control viral replication,
by a gradual progressive dyspnoea over the subsequent 5– potentially leading to poor outcome [14]. While our youngest
8 days. Radiological evidence of bilateral infiltrates, elevated patients requiring hospital admission were aged just 18 years,
levels of C-reactive protein, D-dimer, troponin, ferritin and our survivor group included a 99-year-old man who was suc-
lactate dehydrogenase and lymphopaenia were more com- cessfully discharged home 5 days after ED admission.
monly seen in severe illness. During the course of the pan- Our experience also replicates the established association
demic, it became clear that elderly patients, including care between obesity and COVID-19 mortality with a threefold
home and existing inpatients, may present with minimal or increased risk for death and ICU admittance among our
atypical symptoms as a result of SARS-CoV-2 infection [7], hospitalised patients with COVID-19 pneumonia who were
with a significant proportion of elderly patients presenting either overweight or obese. Similar to other studies, we found
with symptoms such as anosmia, ageusia, abdominal pain, a higher prevalence of being overweight or obese among the
vomiting and diarrhoea [9, 10]. This was underscored by the 31 patients requiring admission to ICU. This contributed to
Fig. 4 Total number of Connolly 35
Hospital ICU COVID admissions
between March 18 and May 1, 30
2020
25
20
15
10
5
0
ICU Admied Paents 31 ICU Discharged Paents 18 ICU Deaths 7Ir J Med Sci
Table 2 Age-adjusted risk of death among 257 COVID-19 patients
Characteristic Survivors (n = 218) Non-survivors (n = 39) Age-adjusted hazard ratioa
Mean (SD) Mean (SD) HR (95% CI) p value
Age, years 57.7 (17.9) 73.5 (15.5) 1.04 (1.01, 1.06) 0.002
Deprivation scoreb 3.3 (9.9) − 4.3 (9.7) 1.05 (1.01, 1.09) 0.012
N (%c) N (%c) HR (95% CI) p value
At least one comorbidity
No 60 (98.4) 1 (1.6) Baseline
Yes 158 (80.6) 38 (19.4) 5.07 (0.68, 38.00) 0.114
Charlson Index
0 63 (98.4) 1 (1.6) Baseline
1 53 (89.8) 6 (10.2) 3.61 (0.43, 30.38) 0.238
2 50 (89.3) 6 (10.7) 3.14 (0.37, 26.90) 0.297
3 25 (69.4) 11 (30.6) 7.87 (0.97, 63.95) 0.054
≥4 27 (64.3) 15 (35.7) 7.91 (0.99, 63.49) 0.052
Location prior to admittance
Community 182 (90.0) 21 (10.3) Baseline
Care home 20 (58.8) 14 (41.2) 2.68 (1.24, 5.60) 0.012
Existing inpatient 16 (80.0) 4 (20.0) 0.24 (0.05, 1.11) 0.067
Gender
Female 93 (89.4) 11 (10.6) Baseline
Male 125 (81.7) 28 (18.3) 1.59 (0.78, 3.27) 0.203
Ethnicity
White–Irish 131 (79.9) 33 (20.1) Baseline
White–other 41 (93.2) 3 (6.8) 0.91 (0.24, 3.44) 0.886
BAME 46 (92.2) 3 (7.8) 1.05 (0.19, 6.31) 0.445
Healthcare worker
No 196 (83.4) 39 (16.6) Baseline
Yes 22 (100.0) 0 (0.0) 0.00 (0.00, 0.00) –
Smoker
No 195 (85.5) 33 (14.5) Baseline
Yes 23 (79.3) 6 (20.7) 1.73 (0.70, 4.31) 0.237
Overweight/obese
No 84 (92.3) 7 (7.7) Baseline
Yes 134 (80.7) 32 (19.3) 3.09 (1.32, 7.23) 0.009
Abbreviations: SD standard deviation
There were no missing data for any of the variables, except deprivation score as described below
a
All models adjusted for age, except the model with age as the independent variable of interest which is a univariate model
b
221 patients only (missing for all care home patients and 2 existing inpatients). Deprivation score was measured using Pobal HP Deprivation Index
(PDI), which is an Eircode-based relative measure of deprivation. Deprivation scores are not generated for care home residents
c
Percentage out of total number of patients with that characteristic
the mechanical problems of having to manage obese patients recently reported that the presence of obesity in patients with
who require mechanical ventilation and frequent proning [15, fatty liver was associated with a sixfold increased risk of se-
16]. Earlier reports have identified a threefold association be- vere COVID-19 illness and this association remained signifi-
tween obesity and severe COVID-19 illness, with a dose- cant even after adjusting for age, sex, smoking, diabetes, hy-
effect relationship between increasing BMI and the proportion pertension and dyslipidaemia [18]. There is increasing evi-
of patients with severe illness [17]. Zheng and colleagues dence that the IL-6-mediated ‘cytokine storm’ promoted byIr J Med Sci
Table 3 Age-adjusted risk of ICU admission in hospital among 257 COVID-19 patients
ICU admittance
Characteristic No (n = 226) Yes (n = 31) Age-adjusted hazard ratio
Mean (SD) Mean (SD) HR (95% CI) p value
Age, years 60.5 (19.1) 56.7 (11.8) 0.94 (0.92, 0.97) < 0.001
Deprivation scoreb 2.3 (10.5) 3.2 (7.2) 0.97 (0.94, 1.01) 0.196
N (%c) N (%c) HR (95% CI) p value
At least one comorbidity
No 59 (96.7) 2 (3.3) Baseline
Yes 167 (85.2) 29 (14.8) 3.13 (0.72, 13.57) 0.128
Charlson Index
0 62 (96.9) 2 (3.1) Baseline
1 47 (79.7) 12 (20.3) 3.72 (0.82, 16.93) 0.089
2 46 (82.1) 10 (17.9) 3.02 (0.64, 14.34) 0.163
3 30 (83.3) 6 (16.7) 2.73 (0.52, 14.18) 0.233
≥4 41 (97.6) 1 (2.4) 0.44 (0.04, 5.16) 0.513
Location prior to admittance
Community 173 (85.2) 30 (14.8) Baseline
Care home 33 (97.1) 1 (2.9) 0.63 (0.08, 4.96) 0.661
Existing inpatient 20 (100.0) 0 (0.0) –
Gender
Female 95 (42.0) 9 (29.0) Baseline
Male 131 (58.0) 22 (71.0) 1.04 (0.47, 2.30) 0.927
Ethnicity
White–Irish 153 (93.3) 11 (6.7) Baseline
White–other 34 (77.3) 10 (22.7) 4.22 (1.45, 12.31) 0.008
BAME 39 (78.4) 10 (21.6) 4.58 (1.33, 15.84) 0.018
Healthcare worker
No 209 (88.9) 26 (11.1) Baseline
Yes 17 (77.3) 5 (22.7) 2.71 (1.01, 7.25) 0.047
Smoker
No 206 (90.4) 22 (9.7) Baseline
Yes 20 (69.0) 9 (31.0) 1.31 (0.57, 2.99) 0.527
Overweight/obese
No 85 (37.6) 4 (12.9) Baseline
Yes 141 (62.4) 27 (87.1) 2.37 (1.37, 6.83) 0.01
Abbreviations: SD standard deviation
There were no missing data for any of the variables, except deprivation score as described below
a
p values test for a difference between patients from community, care home and inpatient settings. They are estimated using ANOVA tests for
continuous variables and chi-square tests for categorical variables
b
221 patients only (missing for all care home patients and 2 existing inpatients). Deprivation score was measured using Pobal HP Deprivation Index
(PDI), which is an Eircode-based relative measure of deprivation. Deprivation scores are not generated for care home residents
c
Percentage out of total number of patients with that characteristic
the activation of CD14+ and CD16+ inflammatory monocytes activity in the liver and visceral fat is independently correlated
[8, 19] may play a key role in mediating the systemic inflam- with increased levels of IL-6 [20], which might have an
matory response syndrome in obese patients with severe additive/synergistic role in promoting greater severity of
COVID-19 illness. In obese patients, increased inflammatory SARS-CoV-2 infection. While additional studies are neededIr J Med Sci
to better understand the underlying mechanisms between obe- percentage point increase in income deprivation associated
sity and poorer outcomes with SARS-CoV-2 infection, it is with a 2% increase in COVID-19 mortality while each per-
conceivable that the secretion of hepatokines or the altered centage point increase in the proportion of the population from
secretion of inflammatory lipid mediators in obese patients BAME backgrounds associated with a 1% increase in
with metabolic syndrome or non-alcoholic fatty liver disease COVID-19 mortality. Our findings similarly suggest that so-
(NAFLD) may also contribute to current observations [21]. cioeconomic deprivation is a more significant factor in deter-
Our study found that socioeconomic deprivation was a mining COVID-19 mortality than belonging to an ethnic
strong predictor of mortality, even after adjustment for age, group. Indeed sub-analysis of our two largest ethnic sub-
with a percentage point increase in deprivation associated with groups, the socioeconomically deprived Roma cluster of 34
a 5% increase in COVID-19 mortality. By contrast, compared patients (Deprivation Index − 0.21) and the 34 more affluent
with White Irish people, those of other White and BAME Asian patients (Deprivation Index + 6.25) including 22
ethnicities did not have an increased risk of hospital death. healthcare workers underscores the critical importance of dep-
There is growing evidence from both the USA and the UK rivation in determining poor COVID-19 outcomes. While 10
that the adverse outcomes of the COVID-19 pandemic are of the Roma cluster required admission to ICU (29.4%) and 3
falling disproportionately on more disadvantaged groups, par- died (8.8%), only 6 of the Asian subgroup required admission
ticularly those from ethnic minorities. In Chicago, around to ICU (17.6%) and 1 died (2.9%), p = 0.03.
70% of deaths have involved people of Black origin despite Finally, while 13% of our hospital admissions were from
this ethnic group making up only 30% of the population [22]. care homes, 36% of our deaths were among care home pa-
Estimates suggest that American counties where Black resi- tients reflecting the fact that care home residents were almost 3
dents are in the majority have a sixfold higher rate of death due times more likely to die than community patients after
to COVID-19 compared to counties with predominantly adjusting for age. Some of this excess risk was explained by
White residents [23]. In the UK, 19% of deaths occurring in the additional comorbidity burden and age profile among care
hospital have involved individuals from ethnic minority back- home residents and nationally may relate to a lower staffing
grounds, even though these groups make up only 14% of the ratios coupled with a relative lack of personal protection
population [24]. Forty-five percent of our COVID patients equipment compared to acute hospitals. Despite blanket visi-
admitted from the community were from non-Irish ethnic tor restrictions for care homes being introduced more quickly
groups: BAME (24%), non-Irish White (21%) including in Ireland than in any other country, clusters of SARS-CoV-2
Roma (16%) compared to 5%, 10% and 0.1%, respectively, infection developed in over 230 of the country’s 540 care
expected for the proportion of BAME, non-Irish White and homes with Ireland having one of the highest rates of reported
Roma in the general Irish population [25]. In our study, ethnic care home COVID-19 deaths in the world with 62% of
minority groups had an approximately fourfold increased risk COVID-19 deaths in Ireland associated with care homes, a
of ICU admittance reflecting the fact that almost two-thirds of figure surpassed only by Canada, where 82% of deaths oc-
all patients admitted to ICU were non-Irish including 10 pa- curred in care home settings [28].
tients from the Roma community. Recent UK data reported In conclusion, the COVID-19 pandemic posed unprece-
BAME groups accounted for 35% of all patients with dented organisational issues for our hospital which at one
COVID-19 pneumonia in critical care units in England [26]. stage accounted for admissions occupying 45% of all our
The extent to which higher COVID-19 mortality in ethnic acute medical beds, our ICU requiring the greatest increase
minority groups is primarily due to socioeconomic depriva- in capacity of any ICU in Ireland and 12% of our staff requir-
tion is not fully understood and there has been little or no ing COVID-19-related leave. Being overweight/obese, a care
research investigating whether poverty itself is an independent home resident, socioeconomically deprived and older were
risk factor for COVID-19-associated mortality. The same significantly associated with death, while ethnicity and being
risks such as household overcrowding, increased comorbidi- overweight/obese were significantly associated with ICU ad-
ties including diabetes and obesity, unequal access to mission. Our findings have important implications for
healthcare and reliance of public transport are equally associ- healthcare planning for future epidemics and resource alloca-
ated with living in deprivation as well as ethnicity. Recent tion as we now move into a continued phase of testing and
analysis by the University of Liverpool’s Department of tracing of SARS-CoV-2 cases. Our experience has demon-
Public Health and Policy reported significantly higher strated that our hospital’s critical care and respiratory HDU
COVID-19 mortality rates among local authorities with a capacity needs to be rapidly expanded in advance of future
greater proportion of residents experiencing socioeconomic surges, with particular attention paid to the large numbers of
deprivation and with a greater proportion of residents from care home residents and disadvantaged groups in our catch-
ethnic minority backgrounds [27]. Interestingly, they reported ment area with rapid testing of all hospital admissions,
that the negative effects of socioeconomic deprivation was existing inpatients and discharges as well as healthcare
twice that of belonging to a BAME group with each workers facilitated.Ir J Med Sci
Acknowledgements The authors would like to thank Danielle Bodicoat, 13. Hong KH, Choi JP, Hong SH et al (2018) Predictors of mortality in
PhD, Consultant Statistician as well as our Hospital and Nursing Middle East Respiratory Syndrome (MERS). Thorax 73:286–289
Management Staff; Ms. Barbara Keogh Dunne, Hospital General 14. Opal SM, Girard TD, Ely EW (2005) The immunopathogenesis of
Manager; Marie Murray, Chief Operating Officer; and Judy McEntee, sepsis in elderly patients. Clin Infect Dis 41(suppl 7):S504–S512
Director of Nursing. 15. Simonnet A, Chetboun M, Poissy J et al (2020) High prevalence of
obesity in severe acute respiratory syndrome coronoavirus-2
Compliance with ethical standards (SARS-CoV-2) requiring invasive mechanical ventilation. Obesity
28(7):1195–1199
Conflict of interest The authors declare that they have no conflicts of 16. Palaiodimos L, Kokkinidis DG, Li W et al (2020) Severe obesity is
interest. associated with higher in-hospital mortality in a cohort of patients
with COVID-19 in the Bronx, New York. Metabolism 108:154262.
https://doi.org/10.1016/j.metab.2020.154262 Epub 2020 May 16
Ethical approval Ethical approval was waived on the basis that this
17. Gao F, Zheng KI, Wang XB et al (2020) Obesity is a risk factor for
clinical research took place during a pandemic emergency.
greater COVID-19 severity. Diabetes Care 43(7):e72–e74
18. Zheng KI, Gao F, Wang XB et al (2020) Obesity as a risk factor for
greater severity of COVID-19 in patients with metabolic associated
References fatty liver disease. Metabolism 154244:108
19. Feng G, Zheng KI, Yan QQ et al (2020) COVID-19 and liver
1. HSE Update. First case of COVID-19 diagnosed in east of Ireland. dysfunction: current insights and emergent therapeutic strategies.
RTE News 29 February 2020 J Clin Transl Hepatol. 8(1):18–24
2. Cullen P. https://www.irishtimes.com/news/health/coronavirus- 20. Van der Poorten D, Milner KL, Hui J et al (2008) Visceral fat: a key
first-death-confirmed-in-ireland-as-who-declares-a-pandemic-1. mediator of steatohepatitis in metabolic liver disease. Hepatology.
4199223. Accessed 25 May 2020 48:449–457
3. Department of Health Coronavirus Update: 34 more coronavirus 21. Chen F, Esmaili S, Rogers GB et al (2020) Lean NAFLD: a distinct
deaths in Ireland as 221 new cases announced. RTE News 1st entity shaped by differential metabolic adaptation. Hepatology.
May 2020 71(4):1213–1227
4. Power J. https://www.irishtimes.com/news/ireland/irish-news/ 22. Yancy CW (2020) COVID-19 and African Americans. JAMA.
highest-covid-19-incidence-recorded-on-north-side-of-dublin-1. https://doi.org/10.1001/jama.2020.6548 published online April 15
4261097. Accessed 25 May 2020 23. Thebault R, Tran AB, Williams V (2020) The coronavirus is infect-
5. Haase T, Pratschke J (2017) The 2016 Pobal HP Deprivation Index ing and killing black Americans at an alarmingly high rate.
for Small Areas (SA) Introduction and Reference Tables Washington Post. published online April 7. https://www.
6. COVID-19 Risk assessment for use in a hospital setting. http:// washingtonpost.com/nation/2020/04/07. Accessed 25 May 2020
www.hpsc.ie. Accessed 25 May 2020 24. NHS England. Statistics: COVID-19 Daily Deaths. https://www.
7. Wu Z, McCoogan JM (2020) Characteristics of and important les- england.nhs.uk/statistics/statisticalwork-areas/covid-19-daily-
sons from the coronavirus disease 2019 (COVID-19) outbreak in deaths. Accessed 25 May 2020
China. JAMA 323(13):1239–1242 25. Ireland 2016 Census. https://www.cso.ie. Accessed 25 May 2020
8. Huang C, Wang Y, Li X et al (2020) Clinical features of patients 26. Intensive Care National Audit and Research Centre. ICNARC re-
infected with 2019 novel coronavirus in Wuhan, China. Lancet port on COVID-19 in critical care: 17 April 2020. 2020. https://
395:497–506 www.icnarc.org/Our-Audit/Audits/Cmp/Reports
9. Liu K, Chen Y, Lin R et al (2020) Clinical features of COVID-19 in
27. Rose TC, Mason K, Pennington A et al (2020) Inequalities in
elderly patients: a comparison with young and middle-aged pa-
COVID-19 mortality related to ethnicity and socioeconomic depri-
tients. J Infect 80(6):E14–E18
vation. MedRxIV. https://doi.org/10.1101/2020.04.25.20079491
10. Jin X, Lian J-S, Hu J-H et al (2020) Epidemiological, clinical and
28. Cullen P. https://www.irishtimes.com/news/health/ireland-has-one-
virological characteristics of 74 cases of coronavirus-infected dis-
of-the-highest-rates-of-covid-19-deaths-in-care-homes-in-world-1.
ease 2019 (COVID-19) with gastrointestinal symptoms. Gut 69(6):
4260140. Accessed 25 May 2020
1002–1009
11. Guan W, Ni Z, Hu Y et al (2020) Clinical characteristics of coro-
navirus disease 2019 in China. N Engl J Med 382:1708–1720 Publisher’s note Springer Nature remains neutral with regard to jurisdic-
12. Choi KW, Chau TN, Tsang O et al (2003) Outcomes and prognos- tional claims in published maps and institutional affiliations.
tic factors in 267 patients with severe acute respiratory syndrome in
Hong Kong. Ann Intern Med 139:715–723You can also read