Persistent Symptoms and Association With Inflammatory Cytokine Signatures in Recovered Coronavirus Disease 2019 Patients

Page created by Floyd Armstrong
 
CONTINUE READING
Persistent Symptoms and Association With Inflammatory Cytokine Signatures in Recovered Coronavirus Disease 2019 Patients
Open Forum Infectious Diseases
    Major Article

Persistent Symptoms and Association With Inflammatory
Cytokine Signatures in Recovered Coronavirus Disease
2019 Patients
Sean Wei Xiang Ong,1,2,a, Siew-Wai Fong,3,4,a Barnaby Edward Young,1,2,5 Yi-Hao Chan,3,4 Bernett Lee,4 Siti Naqiah Amrun,3,4 Rhonda Sin-Ling Chee,3,4
Nicholas Kim-Wah Yeo,3,4 Paul Tambyah,6,7 Surinder Pada,8 Seow Yen Tan,9 Ying Ding,1 Laurent Renia,3,4 Yee-Sin Leo,1,2,5,7 Lisa F. P. Ng,3,4,7,10 and
David Chien Lye,1,2,5,7
1
 National Centre for Infectious Diseases, Singapore, 2Tan Tock Seng Hospital, Singapore, 3A*STAR Infectious Diseases Labs (A*STAR ID Labs), Agency for Science, Technology and Research,
Singapore, 4Singapore Immunology Network, Agency for Science, Technology and Research, Singapore, 5Lee Kong Chian School of Medicine, Nanyang Technological University, Singapore,

                                                                                                                                                                                           Downloaded from https://academic.oup.com/ofid/article/8/6/ofab156/6208280 by guest on 19 August 2021
6
 National University Health System, Singapore, 7Yong Loo Lin School of Medicine, National University of Singapore, Singapore, 8Ng Teng Fong General Hospital, Singapore, 9Changi General
Hospital, Singapore, and 10Institute of Infection, Veterinary and Ecological Sciences, University of Liverpool, United Kingdom

   Background. The complications and sequelae of coronavirus disease 2019 (COVID-19) and their effect on long-term health are
unclear, and the trajectory of associated immune dysregulation is poorly understood.
   Methods. We conducted a prospective longitudinal multicenter cohort study at 4 public hospitals in Singapore. Patients with
COVID-19 were monitored for a median of 6 months after recovery from acute infection. Clinical symptoms and radiologic data
were collected, along with plasma samples for quantification of immune mediators. The relationship between clinical symptoms and
immune cytokine profiles was investigated.
   Results. Two hundred eighty-eight participants were recruited, and follow-up data were available for 183, 175, and 120 participants at
days 30, 90, and 180 postsymptom onset, respectively. Symptoms related to COVID-19 were present in 31 (16.9%), 13 (7.4%), and 14 (11.7%)
at days 30, 90, and 180. In a multivariable model, age >65 years, non-Chinese ethnicity, and the severity of acute infection were associated
with increased likelihood of persistent symptoms. Recovered COVID-19 patients had elevated levels of proinflammatory interleukin (IL)-
17A, stem cell factor, IL-12p70, and IL-1β and pro-angiogenic macrophage inflammatory protein 1β, brain-derived neurotrophic factor,
and vascular endothelial growth factor at day 180 compared with healthy controls. Higher levels of monocyte chemoattractant protein-1
and platelet-derived growth factor-BB were detected in patients with persistent symptoms, versus symptom-free patients.
   Conclusions. Approximately 10% of recovered patients had persistent symptoms 6 months after initial infection. Immune cyto-
kine signatures of the recovered patients reflected ongoing chronic inflammation and angiogenesis. Patients with COVID-19 should
be monitored closely for emerging long-term health consequences.
   Keywords. chronic fatigue; COVID-19; cytokines; long-term; persistent symptoms.

The collective understanding of coronavirus disease 2019                                          phenotype resembling myalgic encephalomyelitis/chronic fa-
(COVID-19) has evolved rapidly since its emergence, with rec-                                     tigue syndrome (ME/CFS), with prominent features of myalgia
ognition of the causative virus, evaluation of effective thera-                                   and fatigue [1, 2]. However, there are limited data as to the fre-
peutics, and development of multiple vaccines within the span                                     quency of such symptoms or the pathophysiologic mechanisms
of 1 year. However, there remain significant unanswered ques-                                     driving them [3]. Studies have reported dysregulated cytokine
tions with regard to the long-term sequelae associated with                                       release in patients with acute COVID-19 associated with worse
COVID-19. Persistent symptoms post-COVID-19 recovery,                                             disease outcomes [4, 5]. However, the dynamics of cytokine re-
termed “long COVID,” have been reported, describing a clinical                                    sponse during recovery and its association with recovery tra-
                                                                                                  jectories and long-term outcomes have not been well studied.
                                                                                                     Cohort studies tracking COVID-19 patients postrecovery de-
  Received 12 March 2021; editorial decision 20 March 2021; accepted 24 March 2021.               scribed a high frequency (55% to 87.6%) of persistent symptoms
  Correspondence: David Chien Lye, MBBS, National Centre for Infectious Diseases, 16 Jln Tan      (most commonly fatigue and dyspnea) for up to several months,
Tock Seng, 308442, Singapore (david_lye@ncid.sg).
  a
   S. W. X. O. and S.-W. F. contributed equally to this work.                                     with an associated decrease in quality of life [6–9]. However,
Open Forum Infectious Diseases®2021                                                               some of these are limited by their single-center study design,
© The Author(s) 2021. Published by Oxford University Press on behalf of Infectious Diseases       small sample sizes, and an absence of correlation with objective
Society of America. This is an Open Access article distributed under the terms of the Creative
Commons Attribution-NonCommercial-NoDerivs licence (http://creativecommons.org/licenses/          biomarkers of disease activity or immune dysregulation to ex-
by-nc-nd/4.0/), which permits non-commercial reproduction and distribution of the work, in any    plain persistent symptoms.
medium, provided the original work is not altered or transformed in any way, and that the
work is properly cited. For commercial re-use, please contact journals.permissions@oup.com           In this prospective multicenter cohort study, we aimed to as-
DOI: 10.1093/ofid/ofab156                                                                         sess the frequency of persistent symptoms up to 6 months across

                                   Persistent Symptoms and Association With Inflammatory Cytokine Signatures in Recovered COVID-19 Patients • ofid • 1
Persistent Symptoms and Association With Inflammatory Cytokine Signatures in Recovered Coronavirus Disease 2019 Patients
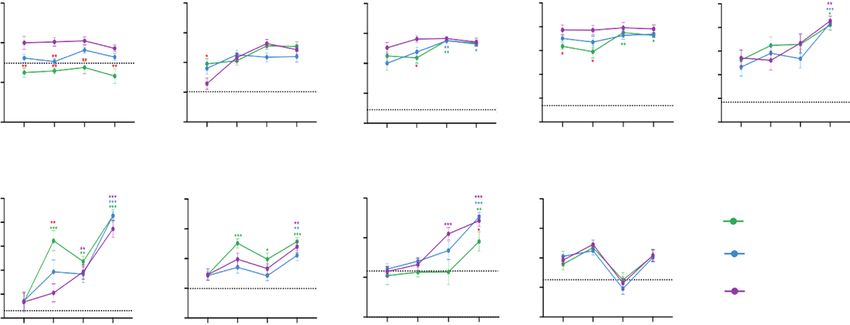
a spectrum of confirmed COVID-19 patients with varying ini-               Multiplex Microbead-Based Immunoassay
tial disease severity. We also studied the longitudinal temporal          Plasma samples were extracted and treated with a solvent/
dynamics of cytokine response, and we determined the rela-                detergent based on Triton X-100 (1%) for virus inactivation
tionship of persistent symptoms with immune cytokine profiles             [11]. Immune mediator levels were measured using Cytokine/
during the recovery course.                                               Chemokine/Growth Factor 45-Plex Human ProcartaPlex Panel
                                                                          1 (Thermo Fisher Scientific, Waltham, MA) (full details in
METHODS                                                                   Supplementary Methods). Cytokine levels were also measured
                                                                          in 24 healthy donor (10 males, 14 females; median age 55 years;
Patient Recruitment
                                                                          details in Supplementary Table S1) plasma samples as baseline
This was a multicenter study conducted in 4 public hospitals in
                                                                          controls.
Singapore that managed COVID-19 inpatients. As part of en-
hanced surveillance in line with national public health policy, all
                                                                          Statistical Analysis
patients with upper respiratory tract infection or pneumonia are
                                                                          Unpaired t-test or Mann-Whitney U test was applied to ascer-
tested for COVID-19 with severe acute respiratory syndrome co-
                                                                          tain significant differences in immune mediator levels between

                                                                                                                                               Downloaded from https://academic.oup.com/ofid/article/8/6/ofab156/6208280 by guest on 19 August 2021
ronavirus 2 (SARS-CoV-2) polymerase chain reaction (PCR). In
                                                                          COVID-19 patients and healthy controls at different DPSO
addition, several asymptomatic individuals were tested, namely,
                                                                          and between patients with and without persistent symptoms.
close contacts of confirmed cases and individuals living in con-
                                                                          A multiple linear regression analysis was conducted to examine
gregate settings (namely, migrant worker dormitories where large
                                                                          the association between plasma cytokines and the presence of
outbreaks occurred). Hence, confirmed diagnoses included a
                                                                          symptoms in COVID-19 patients after adjustment for age and
large proportion of mild and asymptomatic cases. In the initial
                                                                          disease severity. Two-way repeated measure analysis of variance
phase of the outbreak, all patients with confirmed COVID-19 in-
                                                                          with Tukey post hoc correction for multiple testing was used to
fection were hospitalized for initial evaluation, regardless of illness
                                                                          discern the differences between various disease severity groups
severity.
                                                                          and timepoints. Plots were generated using GraphPad Prism,
   Inclusion criterion was confirmed COVID-19 via SARS-
                                                                          version 8 (GraphPad Software, San Diego, CA). ClustVis was
CoV-2-specific PCR and admitted in the study period from
                                                                          used to compute hierarchical clustering and heat map on the
January 30 to August 14 2020. There were no predefined ex-
                                                                          immune mediators [12]. In the heat map presentation, the con-
clusion criteria. Patients were invited to participate; however,
                                                                          centrations of immune mediators were scaled between 0 and 1
not all patients could be approached due to resource limitations
                                                                          for visualization. Principal component analysis was performed
at the peak of the outbreak. Participants were offered outpa-
                                                                          on the logarithmically transformed concentrations using the
tient follow-up postdischarge at 30, 90, 180, 270, and 360 days
                                                                          singular value decomposition method in ClustVis.
postsymptom onset (DPSO).
                                                                             The Mann-Whitney U test was used to compare continuous
                                                                          variables, and the Fisher’s exact test was used for categorical
Clinical Data and Specimen Collection
                                                                          variables. Variables that were significantly different between
Clinical data were extracted from the electronic medical record
                                                                          participants with and without persistent symptoms in univar-
using a standardized data collection form adapted from the
                                                                          iate analysis were selected to construct a multivariable logistic
International Severe Acute Respiratory and Emerging Infection
                                                                          regression model to identify variables independently associ-
Consortium (ISARIC) case record form [10]. Disease severity
                                                                          ated with risk of developing persistent symptoms. P < .05 were
was categorized based on worst clinical status during hospital
                                                                          considered statistically significant, and all tests were 2-tailed.
admission: mild (no pneumonia on chest radiographs [CXR]
                                                                          Analyses were performed using Stata Release 13 (StataCorp,
throughout admission), moderate (pneumonia on CXR without
                                                                          College Station, TX).
hypoxia), and severe (pneumonia with hypoxia [oxygen satura-
tion ≤94%] requiring supplemental oxygen). Severe was further
                                                                          Patient Consent Statement
subdivided into noncritical (not requiring intensive care unit
                                                                          Written informed consent was obtained from all study partici-
[ICU] admission) and critical (requiring ICU admission or me-
                                                                          pants. The study protocol was approved by the institutional review
chanical ventilation) for the clinical analysis.
                                                                          board (IRB) (National Healthcare Group Domain Specific Review
   Patients were followed up postdischarge at multiple time
                                                                          Board, Study Reference 2012/00917). Healthy donor samples were
points (approximately 30, 90, and 180 DPSO). A standardized
                                                                          collected under study numbers 2017/2806 and NUS IRB 04-140.
symptom questionnaire was administered at each outpatient
visit, in addition to an objective assessment and physical exam-
                                                                          RESULTS
ination by a study physician. Plasma samples were collected in
cell preparation tubes during hospital admission on days 1, 3,            Patient Recruitment
7, 14, 21, and 28 (if still admitted), and at each outpatient clinic      Two hundred eighty-eight participants were recruited into the
visit on days 30, 90, and 180.                                            study and consented for outpatient follow-up and serial blood

2 • ofid • Ong et al
Persistent Symptoms and Association With Inflammatory Cytokine Signatures in Recovered Coronavirus Disease 2019 Patients
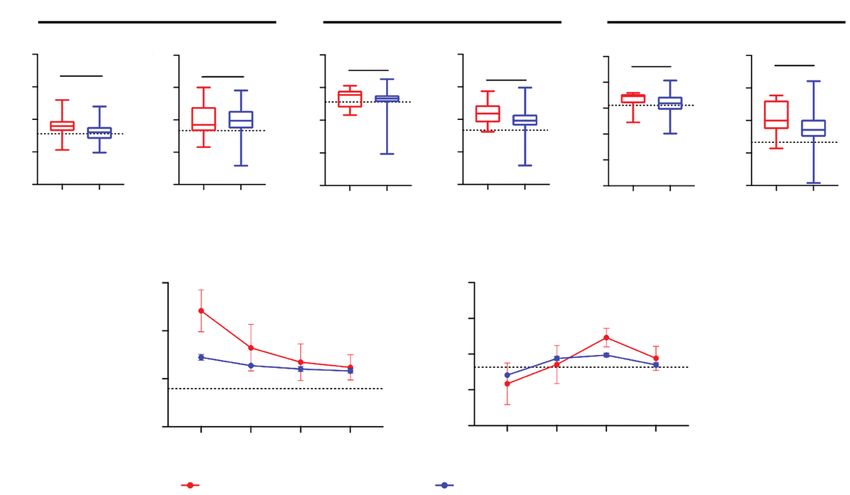
sample collection (see Supplementary Figure S1 for study recruit-                                Persistent Symptoms and Association With Clinical Features
ment flowchart). Median duration of follow-up in this cohort                                     The number of patients with persistent symptoms at day 30, 90,
was 181 days (interquartile range [IQR], 103–191 days; range,                                    and 180 were 31 (16.9%), 13 (7.4%), and 14 (11.7%), respec-
31–295 days). Follow-up visit data were available for 183, 175, and                              tively. The detailed breakdown of individual symptoms is shown
120 participants at days 30, 90, and 180, respectively. Forty-five                               in Supplementary Table S2. Symptoms were predominantly
(24.6%) participants were female and median age was 44 years old                                 pulmonary, with the most common being cough and dyspnea.
(IQR, 33–56; range, 20–80). Seventy-five (41.0%) participants had                                Participants with persistent symptoms at either day 90 or 180
at least 1 comorbidity, most commonly hypertension (28.4%) and                                   were older, had a higher Charlson’s comorbidity index, and were
diabetes mellitus (14.8%). Clinical features, presenting symptoms,                               more likely to have required supplemental oxygen or ICU admis-
and investigations during the index hospitalization are summar-                                  sion during their index hospitalization (Table 1). Ethnicity was
ized in Table 1. Patients had a range of disease severity during their                           significantly different between patients with and without per-
index hospitalization: 30 (16.4%) asymptomatic, 51 (27.9%) mild,                                 sistent symptoms, although we did not capture detailed ethnicity
47 (25.7%) moderate, and 55 (30.1%) severe as defined above.                                     data for those outside the 3 major categories used in Singapore.

                                                                                                                                                                                   Downloaded from https://academic.oup.com/ofid/article/8/6/ofab156/6208280 by guest on 19 August 2021
Table 1. Clinical Features and Outcomes During Index Hospitalization for Entire Cohort, and by Patients With and Without Persistent Symptoms at Day
90 or 180

Variable                                   All Patients (n = 183)    No Persistent Symptoms (n = 161)               Persistent Symptoms at Day 90 or 180 (n = 22)       P Valuea

Demographics
     Female sex                                  45 (24.6)                           38 (23.6)                                              7 (31.8)                      .43
     Age, years                                 44 (33–56)                          43 (31–55)                                          50.5 (39–66)                     .042
     Ethnicity                                                                                                                                                           .039
     Chinese                                     92 (50.3)                           85 (52.8)                                              7 (31.8)
     Indian/South Asian                          55 (30.1)                           49 (30.4)                                              6 (27.3)
     Malay                                        14 (7.7)                           10 (6.2)                                              4 (18.2)
     Others                                      22 (12.0)                           17 (10.6)                                             5 (22.7)
Comorbidities
     Charlson’s comorbidity                       0 (0–1)                             0 (0–0)                                               0 (0–1)                      .039
     index
     Any comorbidity                             75 (41.0)                           63 (39.1)                                             12 (54.6)                      .18
     Hypertension                                52 (28.4)                           44 (37.3)                                             8 (36.4)                       .45
     Diabetes mellitus                           27 (14.8)                           22 (13.7)                                             5 (22.7)                       .33
     Ischemic heart disease                       13 (7.1)                           10 (6.2)                                              3 (13.6)                       .19
Baseline Symptoms
     Duration of symptoms be-                     3 (1–6)                             2 (1–6)                                               4 (1–7)                       .43
     fore hospitalization, days
     Fever                                      119 (65.8)                          102 (64.2)                                             17 (77.3)                      .34
     Cough                                      106 (58.6)                           90 (56.6)                                             16 (72.7)                      .17
     Sputum production                           38 (21.0)                           32 (20.1)                                              6 (27.3)                      .41
     Dyspnea                                     22 (12.2)                           18 (11.3)                                             4 (18.2)                       .32
     Rhinorrhea                                  46 (25.4)                           41 (25.8)                                             5 (22.7)                      >.99
     Sore throat                                 64 (35.4)                           58 (36.5)                                              6 (27.3)                      .48
     Diarrhea                                    28 (15.5)                           20 (12.6)                                             8 (36.4)                      .009
     Myalgia                                     32 (17.7)                           27 (17.0)                                             5 (22.7)                       .55
     Asymptomatic                                30 (16.4)                           27 (16.8)                                             3 (13.6)                      >.99
Clinical Outcomes
     CXR opacities                              101 (55.2)                           85 (52.8)                                             16 (72.7)                      .11
     Supplemental oxygen                         54 (29.5)                           42 (26.1)                                             12 (54.6)                     .011
     ICU admission                               33 (18.0)                           25 (15.5)                                             8 (36.4)                      .033
     Mechanical ventilation                       11 (6.0)                            8 (5.0)                                              3 (13.6)                       .13
Severity                                                                                                                                                                 .040
     Mildb                                       81 (44.3)                           75 (46.6)                                              6 (27.3)
     Moderate                                    47 (25.7)                           43 (26.7)                                             4 (18.2)
     Severe                                      55 (30.1)                           43 (26.7)                                             12 (54.6)

Abbreviations: CXR, chest radiograph; ICU, intensive care unit.
NOTE: Values reported as number (percentage) for categorical variables and median (interquartile range) for continuous variables. Bold text indicates P values < .05.
a
 Comparing patients without persistent symptoms against patients with persistent symptoms at day 90 or day 180.
b
    Including asymptomatic patients.

                                       Persistent Symptoms and Association With Inflammatory Cytokine Signatures in Recovered COVID-19 Patients • ofid • 3
In the multivariable model imputing age, sex, ethnicity,                                         levels of multiple growth factors, cytokines, and chemokines.
Charlson’s comorbidity index, and disease severity; age group                                       Recovered patients who had severe illness demonstrated higher
>65 years old, non-Chinese ethnicity, and critical illness severity                                 levels of hepatocyte growth factor (HGF) compared with healthy
(defined as ICU admission or requiring mechanical ventilation)                                      controls (Figure 1C, Supplementary Table S3). Overall, the 180-
during the index admission were independently associated with                                       day profile of recovered COVID-19 patients revealed signs of
increased odds of persistent symptoms (Table 2).                                                    ongoing chronic inflammation (high levels of IL-17A, IL-12p70,
   Follow-up CXRs were reviewed for all patients with an initial                                    stem cell factor [SCF], and IL-1β) and endothelial repair and
abnormal CXR, and the latest abnormal CXR date was recorded                                         angiogenesis (high levels of BDNF, MIP-1β, and VEGF) (Figure
in relation to the symptom onset date. Median time to resolu-                                       1C, Supplementary Table S3). It is notable that there were no
tion of CXR opacities was 14 days (IQR, 9–32; range, 1–195).                                        significant differences in the levels of these immune mediators
However, because CXRs were not systematically repeated in a                                         between patients with different disease severity.
protocolized manner, there was a wide range of durations be-                                           The temporal changes of systemic cytokine profiles were
tween follow-up CXRs. Hence, we did not further analyze this.                                       further profiled by longitudinal analysis of plasma immune

                                                                                                                                                                                                    Downloaded from https://academic.oup.com/ofid/article/8/6/ofab156/6208280 by guest on 19 August 2021
                                                                                                    mediators from the acute phase to day 180 in 64 patients who
Longitudinal Cytokine Responses in Recovered Coronavirus Disease 2019                               provided blood samples across all 4 time points, stratified by in-
Patients
                                                                                                    itial disease severity. The levels of inflammation-associated IL-6,
There was a prominent increase in levels of inflammation-
                                                                                                    IP-10, IL-18, and MCP-1 significantly decreased at the second
associated markers interleukin (IL)-6, IL-8, interferon (IFN)-α,
                                                                                                    timepoint (14–75 DPSO) in patients across all severity strata
IL-18, IL-1RA, monocyte chemoattractant protein (MCP)-1,
                                                                                                    (Supplementary Figure S3). Among immune mediators that re-
and macrophage inflammatory protein (MIP)-1α at the acute
                                                                                                    mained high at day 180, levels of BDNF, MIP-1β, VEGF-A, and
phase of disease, which subsided significantly over the 30-day
                                                                                                    IL-12p70 were already increased in the early phase of infection,
or 90-day period (Figure 1A). Compared with healthy con-
                                                                                                    which persisted over time (Figure 2). It is notable that persistent
trols, at day 90, recovered patients across all severity strata had
                                                                                                    elevation of HGF was only observed in patients with initial se-
higher levels of growth factors platelet-derived growth factor
                                                                                                    vere infection. Levels of VEGF-D, IL-17A, and SCF increased
(PDGF-BB), brain-derived neurotrophic factor (BDNF), vas-
                                                                                                    slowly during convalescent phase and remained high at day 180
cular endothelial growth factor (VEGF)-A, and VEGF-D,
                                                                                                    (Figure 2).
which are associated with endothelial activation. Similar trends
were observed for proinflammatory mediators MIP-1β, stromal                                         Comparison of Cytokine Responses Between Patients With and Without
cell-derived factor (SDF)-1α, eotaxin, IL-12p70, and IL-17A                                         Persistent Symptoms
(Supplementary Figure S2). At day 180, all recovered patients,                                      We next examined the relationship between systemic cyto-
regardless of severity of initial illness, had systemic cytokine                                    kine profiles and persistent symptoms. At day 30, there was a
profiles distinct from healthy controls (Figure 1B), with higher                                    significantly higher level of MCP-1 in patients with persistent

Table 2.      Logistic Regression Analysis of Variables Associated With Persistent Symptoms at 90 or 180 days

                                                                                Univariable Model                                                    Multivariable Model

Variable                                                       Odds Ratio (95% CI)                            P Value                   Adjusted Odds Ratio (95% CI)                   P Value
Age Group
    65 years old                                                6.67 (1.89–23.57)                              .003                            8.75 (1.68–48.34)                       .013
Female sex                                                         1.52 (.57–4.01)                              .40                              3.05 (.88–10.56)                       .078
Ethnicity
    Chinese                                                               Ref                                   N.A.                                    Ref                             N.A.
    Indian/South Asian                                             1.62 (.51–5.11)                              .41                             5.49 (1.15–26.14)                       .033
    Malay                                                         4.74 (1.18–19.09)                             .028                             5.23 (.94–29.22)                       .059
    Others                                                       3.71 (1.04–13.15)                              .043                            17.14 (2.99–98.16)                      .001
Charlson’s comorbidity index ≥ 1                                   2.25 (.89–5.69)                              .087                              1.48 (.46–4.76)                        .51
Severity
    Mild                                                                  Ref                                   N.A.                                    Ref                             N.A.
    Moderate                                                       1.05 (.28–3.95)                              .94                               1.23 (.28–5.32)                        .78
    Severe                                                        3.24 (1.13–9.28)                              .029                             3.10 (.91–10.62)                       .072a

Abbreviations: CI, confidence interval; N.A., not applicable; Ref, reference variable.
NOTE: Patients who only had data up to 30 days were excluded from logistic regression analysis. Bold text indicates P values < .05.
a
 Further stratification into noncritical severe (not requiring intensive care unit [ICU] admission) and critical (requiring ICU admission or mechanical ventilation) showed critical severity was
independently associated with persistent symptoms in the multivariable model (adjusted OR, 4.23; 95% CI, 1.02–17.56; P = .047).

4 • ofid • Ong et al
A                            HC                                                                                                                            COVID-19
                                                                                                                                                                                                                                                                                                                            Post-
                                                        2 weeks                                                                                  30 days                                                                 90 days                                                        180 days                          symotom
                             IL-6
                             IL-8
                                                                                                                                                                                                                                                                                                                            onset
Acute phase

                           IFN-α
 markers

                            IP-10                                                                                                                                                                                                                                                                                          High
                          MCP-1
                            IL-18
                         MIP-1α
                         IL-1RA
                       PDGF-BB
                             HGF
                           BDNF
     Persistent high

                         MIP-1β
                        VEGF-A
                        VEGF-D
                          IL-17A
                        IL-12p70
                             SCF
                            IL-1β                                                                                                                                                                                                                                                                                          Low

   B                                                                   C                                      HGF                                                 BDNF                                          MIP-1β                                             VEGF-A                                       VEGF-D

                                                                                                                                Log10 concentration (pg/ml)

                                                                                                                                                                                  Log10 concentration (pg/ml)
                                                                           Log10 concentration (pg/ml)

                                                                                                                                                                                                                                                                             Log10 concentration (pg/ml)
                                                                                                                                                                                                                                 Log10 concentration (pg/ml)
                        10                                                                               3                                                    4                                           3                                                    5                                           3

                                                                                                                                                                                                                                                                                                                                    Downloaded from https://academic.oup.com/ofid/article/8/6/ofab156/6208280 by guest on 19 August 2021
                                                                                                                                                              3                                                                                                4                                           2
                                                                                                         2                                                                                                2
                                                                                                                      HC                                      2                                                                                                3                                           1
                         5
                                                                                                                                                              1          HC                                                                                    2                                           0
                                                                                                         1                                                                                                1
   PC2 (15.7%)

                                                                                                                                                              0                                                                                                1                                     –1                    HC
                                                                                                                                                                                                                         HC                                                 HC                       –2
                         0                                                                               0                                             –1                                                 0                                                    0

                                                                                                             IL-17A                                           IL-12p70                                            SCF                                               IL-1β
                                                                           Log10 concentration (pg/ml)

                                                                                                                                                                            Log10 concentration (pg/ml)
                                    Healthy control                                                      3                                                                                                3
                                                                                                                        Log10 concentration (pg/ml)
                                                                                                                                                      1.0                                                                                                      3

                                                                                                                                                                                                                              Log10 concentration (pg/ml)
                        –5          Mild                                                                 2                                            0.5                                                                                                      2                                               Mild
                                                                                                                                                                                                          2
                                    Moderate                                                                                                          0.0
                                                                                                         1                                                                                                                                                     1
                                    Severe                                                                                                                                                                1                                                                                                    Moderate
                                                                                                                                            –0.5
                       –10                                                                               0                                                                                                               HC                                    0
                         –10           –5         0       5       10                                                                        –1.0                                                                                                                                                               Severe
                                                                                                                                                                                                          0                                                                 HC
                                                                                                 –1                   HC –1.5                                                                                                                         –1
                                                                                                                                                                         HC
                                            PC1 (17.7%)                                          –2                                         –2.0                                                  –1                                                  –2

Figure 1. Plasma immune mediator levels of coronavirus disease (COVID-19) patients at 90 and 180 days postsymptom onset. Concentrations of 45 immune mediators
were quantified using a 45-plex microbead-based immunoassay. (A) Heatmap of immune mediator levels in plasma samples of COVID-19 patients at first 2 weeks, 30 days,
90 days, and 180 days postsymptom onset. Each color represents the relative concentration of a particular analyte. Blue and red indicates low and high concentration, re-
spectively. (B) Principal component analysis of 45 immune mediator levels analyzed in 101 COVID-19 patients (mild, n = 38; moderate, n = 34; severe, n = 29) at 180 days
postsymptom onset and healthy controls (HC) (n = 24). PC1 explains 17.7% of the variation, whereas PC2 explains 15.7% of the variation; color denotes different groups
of patients and healthy donors. (C) Profiles of immune mediators that are significantly higher in COVID-19 patients at 180 days postsymptom onset compared with HCs are
illustrated as scatter plots. Immune mediator levels in plasma fraction samples of COVID-19 patients collected during 180-day follow up (median 186 days postillness onset)
were compared with the levels in HCs. Unpaired t test was performed on the logarithmically transformed concentration (*P < .05; **P < .01; **P < .0001). Immune mediator
levels for HCs are indicated by the black dotted line. Patient samples with concentration out of measurement range are presented as the value of logarithm transformation
of limit of quantification. BDNF, brain-derived neurotrophic factor; HGF, hepatocyte growth factor; IL, interleukin; MIP, macrophage inflammatory protein; SCF, stem cell factor;
VEGF, vascular endothelial growth factor.

symptoms versus symptom-free patients (Figure 3A). Patients                                                                                                        symptoms (Supplementary Table S6). Overall, persistent symp-
with persistent symptoms also had high levels of PDGF-BB                                                                                                           toms in recovered COVID-19 patients might be associated with
at 90 and 180 days (Figure 3A). Both PDGF-BB and MCP-1                                                                                                             elevated levels of MCP-1 in the early convalescent phase and
may be associated with respiratory manifestations, because                                                                                                         PDGF-BB at 30-day assessment or later.
patients with persistent respiratory symptoms showed higher
levels of MCP-1 and PDGF-BB, particularly at days 90 and 180
                                                                                                                                                                   DISCUSSION
(Supplementary Figure S4). After adjustment for age, ethnicity,
and disease severity by multiple linear regression analysis, levels                                                                                                In this multicenter cohort study, COVID-19 was associated
of MCP-1 and PDGF-BB were significantly associated with                                                                                                            with a significant but overall low frequency of persistent symp-
persistent symptoms (Supplementary Table S4) or respiratory                                                                                                        toms after resolution of the acute illness: 7.4% and 11.7% at 90
symptoms (Supplementary Table S5) at day 30 and day 90, re-                                                                                                        and 180 days, respectively. This is lower compared with other
spectively. Longitudinal profiling of MCP-1 and PDGF-BB in                                                                                                         similar cohort studies in Italy, France, the United Kingdom, and
patients with persistent symptoms revealed upregulation of                                                                                                         China, which reported persistent symptoms in 55% to 87.6%
MCP-1 at the early stage of disease (first 2 weeks of infection)                                                                                                   of patients [6–9]. Despite the proportion of severe initial infec-
with gradual increase of PDGF-BB at the convalescent phase (90                                                                                                     tions being similar in our cohort compared with these cohorts
DPSO) (Figure 3B). Other cytokines evaluated were not signif-                                                                                                      (18% admitted to ICU compared with 12.6%, 20%, 32%, and
icantly different between patients with and without persistent                                                                                                     4%, respectively) [6–9], we showed that cytokine expression

                                                      Persistent Symptoms and Association With Inflammatory Cytokine Signatures in Recovered COVID-19 Patients • ofid • 5
HGF                                                                  BDNF                                                              MIP-1β                                                           VEGF-A                                                              IL-12p70
   Log10 concentration (pg/ml)   2.5                                                                  2.5                                                                2.0                                                         2.5                                                                      0.5

                                                                                                                                                                                                            Log10 concentration (pg/ml)

                                                                                                                                                                                                                                                                                Log10 concentration (pg/ml)
                                                                                                                                           Log10 concentration (pg/ml)
                                                                        Log10 concentration (pg/ml)
                                                                                                                                                                                                                                     2.0                                                                      0.0
                                                                                                      2.0                                                                1.5
                                 2.0
                                                                                                                                                                                                                                      1.5                                                             –0.5
                                                                   HC                                 1.5                                                                1.0
                                                                                                                                                                                                                                      1.0                                                             –1.0
                                 1.5
                                                                                                      1.0                               HC                               0.5                                                         0.5                                                              –1.5                                        HC
                                                                                                                                                                                                           HC                                                              HC
                                 1.0                                                                  0.5                                                                0.0                                                         0.0                                                              –2.0
                                       1-14    15-75 76-150 >150                                            1-14    15-75 76-150 >150                                          1-14    15-75 76-150 >150                                        1-14   15-75 76-150 >150                                            1-14    15-75   76-150 >150
                                       Days post-symptom onset                                              Days post-symptom onset                                             Days post-symptom onset                                         Days post-symptom onset                                             Days post-symptom onset

                                              VEGF-D                                                               IL-17A                                                              SCF                                                             IL-1β
                                 1.5                                                                   2                                                               1.5                                                                 2

                                                                                                                                                                                                            Log10 concentration (pg/ml)
Log10 concentration (pg/ml)

                                                                        Log10 concentration (pg/ml)

                                                                                                                                         Log10 concentration (pg/ml)
                                 1.0
                                                                                                       1                                                                                                                                   1                                                                           Mild
                                                                                                                                                                       1.0
                                 0.5
                                                                                                       0                                                                                                                                   0                                                                           Moderate
                                 0.0                                                                                                                                                                       HC
                                                                                                                                                                       0.5                                                                                                 HC

                                                                                                                                                                                                                                                                                                                                                       Downloaded from https://academic.oup.com/ofid/article/8/6/ofab156/6208280 by guest on 19 August 2021
                                                                                                      –1                                HC                                                                                                –1
                              –0.5                                                                                                                                                                                                                                                                                     Severe
                                                                   HC                                                                                                                                                                     –2
                              –1.0                                                                    –2                                                               0.0
                                       1-14    15-75 76-150 >150                                            1-14    15-75 76-150 >150                                          1-14    15-75 76-150 >150                                        1-14   15-75 76-150 >150
                                       Days post-symptom onset                                               Days post-symptom onset                                           Days post-symptom onset                                         Days post-symptom onset

                1-14 DPSO versus 15-75 DPSO or 76-150 DPSO or >150 DPSO in mild patients;
                1-14 DPSO versus 15-75 DPSO or 76-150 DPSO or >150 DPSO in moderate patients;
                1-14 DPSO versus 15-75 DPSO or 76-150 DPSO or >150 DPSO in severe patients; * mild or moderate patients versus the severe patients

Figure 2. Dynamic changes of plasma immune mediator levels in coronavirus disease (COVID-19) patients across 4 time periods, including 1 to 14 days (2 weeks), 15 to
75 days, 76 to 150 days, and ≥150 days postsymptom onset. Longitudinal plasma samples were collected across 4 timepoints up to 180 days postsymptom onset from 64
COVID-19 patients with different disease severity outcomes (mild, n = 18; moderate, n = 23; severe, n = 23). Concentrations of 45 immune mediators were quantified using a
45-plex microbead-based immunoassay. The levels of immune mediators that persist high in COVID-19 patients at 180 days postsymptom onset at various timepoints were
shown as mean ± standard error of the mean. Two-way repeated measure analysis of variance with Tukey post hoc correction for multiple testing was used to discern the
differences between various disease severity groups and timepoints (*P < .05; **P < .01; ***P < .0001). Mean levels of immune mediators for healthy controls are indicated
by the black dotted line. Patient samples with concentration out of measurement range are presented as the value of logarithm transformation of limit of quantification. BDNF,
brain-derived neurotrophic factor; HGF, hepatocyte growth factor; IL, interleukin; MIP, macrophage inflammatory protein; SCF, stem cell factor; VEGF, vascular endothelial
growth factor.

for proinflammatory cytokines was only marginally different                                                                                                                                 Nevertheless, the finding that 3 of these asymptomatic patients
in follow-up samples for those with initial severe disease com-                                                                                                                             went on to develop persistent symptoms later on, coupled with
pared with asymptomatic and mildly infected individuals, sug-                                                                                                                               cytokine analysis showing abnormal cytokine profiles even in
gesting that other reasons are important for the development of                                                                                                                             asymptomatic patients, is novel and stresses the importance of
persistent symptoms.                                                                                                                                                                        disregarding patients with asymptomatic index infection.
   For example, differences in demographics and ethnicity may                                                                                                                                  We found that COVID-19 patients had distinct systemic
explain this discordance in the frequency of persistent symp-                                                                                                                               cytokine profiles at up to 6 months postsymptom onset com-
toms. Epidemiologic studies of ME/CFS demonstrated differ-                                                                                                                                  pared with healthy controls, regardless of initial severity of
ences in incidence rates across ethnic groups [13], which may                                                                                                                               illness or persistent symptoms. Levels of proinflammatory T
be explained by genetic differences because specific human                                                                                                                                  cell-associated cytokines such as IL-17A, IL-12p70, IL-1β, and
leukocyte antigen alleles were associated with ME/CFS [14].                                                                                                                                 SCF were elevated and increased postdischarge. Interleukin-
Indeed, in our cohort, there were significant differences in the                                                                                                                            12p70, SCF, and IL-17A have been found to be associated with
frequency of persistent symptoms across ethnic groups (with                                                                                                                                 chronic inflammatory diseases such as ME/CFS and inflam-
higher proportions in the “Others” category, which included                                                                                                                                 matory spondyloarthropathy [15, 16]. Liu et al [17] found that
those of European descent), which merits further investigation.                                                                                                                             convalescent individuals still experienced enhanced CD4 and
Although Huang et al [9] found a high proportion (76%) of per-                                                                                                                              CD8 T-cell activation and proliferation, along with a contrac-
sistent symptoms in a Chinese cohort, they had a much higher                                                                                                                                tion of NKT-like cells 3 months after resolving SARS-CoV-2 in-
proportion of patients with severe disease (75% requiring sup-                                                                                                                              fection, whereas Bergamaschi et al [18] observed that persistent
plemental oxygen), which may explain the difference between                                                                                                                                 inflammation correlates with activation of cell metabolic path-
our cohorts.                                                                                                                                                                                ways. This sustained immune and metabolic dysregulation may
   Furthermore, we had a higher proportion of patients                                                                                                                                      be a driver of chronic inflammation in recovered COVID-19
(16.4%) with asymptomatic index infection. This may result in                                                                                                                               patients.
an underestimation of the frequency of persistent symptoms                                                                                                                                     Our longitudinal analyses of cytokine responses in recovered
at follow-up for patients with symptomatic index infection.                                                                                                                                 patients revealed subclinical changes potentially underpinning

6 • ofid • Ong et al
A                                         1 month                                                                                                               3 months                                                                                                   6 months
Log10 concentration (pg/ml)         MCP-1                                                             PDGF-BB                                               MCP-1                                                  PDGF-BB                                             MCP-1                                                PDGF-BB

                                                                   Log10 concentration (pg/ml)

                                                                                                                        Log10 concentration (pg/ml)

                                                                                                                                                                        Log10 concentration (pg/ml)

                                                                                                                                                                                                                                 Log10 concentration (pg/ml)

                                                                                                                                                                                                                                                                                       Log10 concentration (pg/ml)
                              4                                                                  4                                                     3                                                    4                                                  2.5    p = .167                                       3.0     p = .093
                                                                                                       p = .442                                             p = .450
                                        **                                                                                                                                                                               *                                     2.0
                              3                                                                  3                                                     2                                                    3                                                                                                        2.5
                                                                                                                                                                       HC                                                                                      1.5                HC
                              2                                                                  2                                                     1                                                    2                                                                                                        2.0
                                              HC                                                                   HC                                                                                                          HC                              1.0
                                                                                                                                                                                                                                                                                                                                        HC
                              1                                                                  1                                                     0                                                    1                                                                                                        1.5
                                                                                                                                                                                                                                                               0.5
                              0                                                                  0                                                    –1                                                    0                                                  0.0                                                   1.0
                                    s

                                        No

                                                                                                       s

                                                                                                           No

                                                                                                                                                             s

                                                                                                                                                                 No

                                                                                                                                                                                                                    s

                                                                                                                                                                                                                         No

                                                                                                                                                                                                                                                                       s

                                                                                                                                                                                                                                                                            No

                                                                                                                                                                                                                                                                                                                             s

                                                                                                                                                                                                                                                                                                                                 No
                                  Ye

                                                                                                     Ye

                                                                                                                                                           Ye

                                                                                                                                                                                                                  Ye

                                                                                                                                                                                                                                                                     Ye

                                                                                                                                                                                                                                                                                                                           Ye
                                   Symptoms                                                           Symptoms                                              Symptoms                                               Symptoms                                           Symptoms                                              Symptoms
        B
                                                                                                                  MCP-1                                                                                                        PDGF-BB
                                                                                                                                                                                                            3.0
                                              Log10 concentration (pg/ml)

                                                                            2.5

                                                                                                                                                                              Log10 concentration (pg/ml)

                                                                                                                                                                                                                                                                                                                                             Downloaded from https://academic.oup.com/ofid/article/8/6/ofab156/6208280 by guest on 19 August 2021
                                                                                                                                                                                                            2.5
                                                                            2.0
                                                                                                                                                                                                            2.0
                                                                                                                                                                                                                                                                                  HC
                                                                            1.5
                                                                                                                                                                  HC                                        1.5

                                                                            1.0                                                                                                                             1.0
                                                                                                     1-15    15-75 75-150 >150                                                                                          1-15   15-75 75-150                                >150
                                                                                                        Days post-symptom onset                                                                                          Days post-symptom onset
                                                                                                       With persistent symptoms                                                                                 Without persistent symptoms

Figure 3. Plasma immune mediator levels in coronavirus disease (COVID-19) patients with symptoms at 1 month, 3 months, and 6 months postsymptom onset. (A) Profiles
of immune mediators that are significantly higher in COVID-19 patients with symptoms at 30 days (n = 28), 90 days (n = 12), and 180 days (n = 8) postsymptom onset are
illustrated as box plots. Immune mediator levels in plasma fraction samples of COVID-19 patients with respiratory symptoms collected during 30, 90, and 180-day follow-up
were compared with the levels in those without respiratory symptoms (30 days, n = 72; 90 days, n = 155; 180 days, n = 87). Mann-Whitney U test was performed on the loga-
rithmically transformed concentration (*P < .05; **P < .01). Median levels of immune mediator in healthy controls (HC) are indicated by the black dotted line. Patient samples
with concentration out of measurement range are presented as the value of logarithm transformation of limit of quantification. (B) Dynamic changes of plasma monocyte
chemoattractant protein (MCP)-1 and platelet-derived growth factor (PDGF-BB) in COVID-19 patients with (n = 4) and without persistent symptoms (n = 77) across 4 time
periods, including 1 to 14 days, 15 to 75 days, 16 to 150 days, and >150 days postsymptom onset.

the development of post-COVID-19 cardiovascular compli-                                                                                                                                               to ameliorate the progression of pulmonary symptoms in re-
cations even in those who did not have persistent symptoms.                                                                                                                                           covered COVID-19 patients [27, 28].
Regulators of endothelial activation such as VEGF, BDNF, and                                                                                                                                             There are several limitations to our study. First, although we
MIP-1β could promote atherosclerosis and potentially result in                                                                                                                                        correlated the presence of persistent symptoms with cytokine
silent coronary artery disease [19–22]. Convalescent patients                                                                                                                                         features, we did not systematically evaluate end-organ involve-
were found to have pronounced endothelial activation hall-                                                                                                                                            ment using functional assessments such as lung function tests,
marks, abnormal cardiovascular imaging findings, and ongoing                                                                                                                                          exercise tolerance scales, or detailed imaging. Second, symptom
myocardial inflammation after COVID-19 recovery [23, 24].                                                                                                                                             questionnaires were qualitative, and we did not utilize quanti-
Our findings of persistent elevation of pro-angiogenic factors                                                                                                                                        tative indices to measure impact on quality-of-life or functional
warrants long-term monitoring and assessment of potential                                                                                                                                             status; thus, there may be intersubject variability and subjec-
cardiovascular effects.                                                                                                                                                                               tivity. Third, we did not have a control group to compare the
   Platelet-derived growth factor-BB, a potent chemotactic                                                                                                                                            frequency of persistent symptoms following other respiratory
growth factor that stimulates the growth and migration of lung                                                                                                                                        viruses to determine whether COVID-19 is associated with an
fibroblasts, has been implicated in the pathogenesis of pul-                                                                                                                                          increased risk of persistent symptoms. We also cannot be cer-
monary fibrosis [25], whereas elevated levels of MCP-1 in pa-                                                                                                                                         tain whether reported symptoms are due to COVID-19 or other
tients with chronic obstructive pulmonary disease play a role                                                                                                                                         conditions. Finally, a significant proportion of patients were lost
in inducing emphysema [26]. Increased levels of PDGF-BB and                                                                                                                                           to follow-up, which may introduce an element of selection bias.
MCP-1 in patients with persistent respiratory symptoms sug-                                                                                                                                           However, it is likely that those who defaulted further follow-up
gest a mechanism for chronic lung disease, and therapeutic                                                                                                                                            were more likely to not have persistent symptoms, because those
strategies targeting these immune mediators could be beneficial                                                                                                                                       with persistent symptoms would be expected to have continued

                                                                                       Persistent Symptoms and Association With Inflammatory Cytokine Signatures in Recovered COVID-19 Patients • ofid • 7
seeking medical care, and as such selection bias is more likely to   features, risk factors, and pathophysiology behind persistent
have overestimated the frequency of persistent symptoms.             COVID-19.
   Differences among study cohorts make comparison of per-
sistent COVID-19 symptoms difficult, and a consensus case            Supplementary Data
                                                                     Supplementary materials are available at Open Forum Infectious Diseases
definition should be developed to standardize diagnosis and
                                                                     online. Consisting of data provided by the authors to benefit the reader,
data collection to better understand this condition. The rela-       the posted materials are not copyedited and are the sole responsibility
tively nonspecific and subjective nature of persistent symptoms      of the authors, so questions or comments should be addressed to the
makes the clinical picture harder to define. Establishing a causal   corresponding author.

link between COVID-19 and persistent symptoms remains chal-
                                                                     Acknowledgments
lenging in the absence of a control group of non-COVID-19 pa-           We thank all clinical and nursing staff who looked after patients with
tients. The presence of persistent symptoms posthospitalization      coronavirus disease 2019 (COVID-19) in participating hospitals; the indi-
has been described in many conditions, including community-          viduals who participated in this study and donated their clinical data and
                                                                     biological samples; and the research team at Singapore Infectious Disease
acquired pneumonia [29], severe acute respiratory syndrome
                                                                     Clinical Research Network and Infectious Disease Research and Training

                                                                                                                                                             Downloaded from https://academic.oup.com/ofid/article/8/6/ofab156/6208280 by guest on 19 August 2021
(SARS) [30, 31], Middle East respiratory syndrome [32], and a        Office for coordinating patient recruitment, sample collection, and ship-
general “post-ICU syndrome” [33, 34].                                ment. We are grateful to staff from the Singapore Immunology Network
   Nevertheless, the persistent symptoms of COVID-19 should          (SIgN) Multiplex Analysis of Proteins (MAP) platform for their assistance
                                                                     in running multiplex microbead-based immunoassay and staff at the Duke-
not be overlooked, given (1) the significant impact on quality-      NUS Medical School ABSL3 for processing patient samples.
of-life and functional status and (2) a potentially huge im-            Author contributions. S. W. X. O. and S.-W. F. have full access to all the
pact on costs and resource utilization. It is clear that there are   data in the study and take responsibility for the integrity of the data and
                                                                     the accuracy of the data analysis. B. E. Y., Y.-S. L., and D. C. L. designed the
long-lasting immune changes triggered by COVID-19 infec-             study protocol. S. W. X. O., B. E. Y., P. T., S. P., S. Y. T., and Y. D. collected
tion, and although we could not establish a strong association       the data. S. W. F., Y.-H. C., B. L., S. N. A., R. S.-L. C., N. K.-W. Y., L. R., and
between these immune signatures and persistent symptoms in           L. F. P. N. conducted the laboratory investigations. S. W. X. O. and S.-W.
                                                                     F. conducted the data analysis and drafted the manuscript. L. R., Y.-S. L.,
our study, it is an intriguing signal that requires further study.
                                                                     L. F. P. N., and D. C. L. provided overall supervision. All authors read and
   Further questions remain regarding persistent COVID-19.           approved the final manuscript.
Although we have demonstrated differences in the immune                 Disclaimer. The funders had no role in the design and conduct of the
signatures of recovered COVID-19 patients, the mechanism             study; collection, management, analysis, and interpretation of the data;
                                                                     preparation, review, or approval of the manuscript; and decision to submit
behind this remains unclear. Prolonged viral shedding of             the manuscript for publication.
SARS-CoV-2 nucleic acid has been observed from the respi-               Financial support. Recruitment of study participants and sample col-
ratory tract, although multiple studies have shown that these        lection was funded by the Singapore National Medical Research Council
                                                                     COVID-19 Research Fund (COVID19RF-001, COVID19RF-060) and
are largely nonviable genetic material [4, 35]. A postmortem         A*STAR COVID-19 Research funding (H/20/04/g1/006). The SIgN
pathologic study showed evidence of persistent viral infection       Immunomonitoring Platform is supported by a BMRC IAF 311006 grant
of pneumocytes and endothelial cells in patients who died of         and BMRC transition funds (H16/99/b0/011). The SIgN MAP plat-
                                                                     form was supported by a grant from the National Research Foundation,
severe COVID-19, even later in the illness up to 30–40 days
                                                                     Immunomonitoring Service Platform (NRF2017_SISFP09) from the
postinfection [36]. The persistently elevated levels of cytokines    National Research Foundation Singapore.
in our cohort involved in endothelial repair and angiogenesis           Potential conflicts of interest. B. E. Y. reports personal fees from Roche
(MIP-1β, BDNF, and VEGF-A) are consistent with a hypoth-             and Sanofi, outside the submitted work. D. C. L. was on the Gilead COVID-
                                                                     19 global advisory panel without taking personal honorarium. All authors
esis of active endothelial inflammation even in the absence of       have submitted the ICMJE Form for Disclosure of Potential Conflicts of
persistent symptoms. Viral persistence in sanctuary sites could      Interest. Conflicts that the editors consider relevant to the content of the
elicit an ongoing immune response, providing a pathophysio-          manuscript have been disclosed.
logic basis for endothelial dysfunction and some of the symp-
                                                                     References
toms observed in persistent COVID-19.                                 1. Mahase E. Covid-19: what do we know about “long covid”? BMJ 2020; 370:m2815.
                                                                      2. Marshall M. The lasting misery of coronavirus long-haulers. Nature 2020;
                                                                         585:339–41.
CONCLUSIONS                                                           3. Yelin D, Wirtheim E, Vetter P, et al. Long-term consequences of COVID-19: re-
                                                                         search needs. Lancet Infect Dis 2020; 20:1115–7.
In conclusion, we have shown that there remain durable                4. Young BE, Ong SWX, Ng LFP, et al. Viral dynamics and immune correlates of
                                                                         COVID-19 disease severity. Clin Infect Dis 2020; doi:10.1093/cid/ciaa1280.
changes in immune signatures in recovered COVID-19 pa-
                                                                      5. Leisman DE, Ronner L, Pinotti R, et al. Cytokine elevation in severe and critical
tients, and this is seen across the entire spectrum of disease           COVID-19: a rapid systematic review, meta-analysis, and comparison with other
severity at index presentation. Some of these dysregulated               inflammatory syndromes. Lancet Respir Med 2020; 8:1233–44.
                                                                      6. Carfì A, Bernabei R, Landi F; Gemelli Against COVID-19 Post-Acute Care Study
immune changes may underlie the pathophysiologic mech-                   Group. Persistent symptoms in patients after acute COVID-19. JAMA 2020;
anisms of persistent COVID-19 symptoms in a subset of re-                324:603–5.
                                                                      7. Garrigues E, Janvier P, Kherabi Y, et al. Post-discharge persistent symptoms and
covered patients. Further large multicenter and international            health-related quality of life after hospitalization for COVID-19. J Infect 2020;
cohort studies are needed to better characterize the clinical            81:e4–6.

8 • ofid • Ong et al
8. Halpin SJ, McIvor C, Whyatt G, et al. Postdischarge symptoms and rehabilitation       23. Chioh FW, Fong S-W, Young BE, et al. Convalescent COVID-19 patients are sus-
    needs in survivors of COVID-19 infection: a cross-sectional evaluation. J Med             ceptible to endothelial dysfunction due to persistent immune activation. Elife
    Virol 2021; 93:1013–22.                                                                   2021; 10:e64909.
 9. Huang C, Huang L, Wang Y, et al. 6-month consequences of COVID-19 in pa-              24. Puntmann VO, Carerj ML, Wieters I, et al. Outcomes of cardiovascular magnetic
    tients discharged from hospital: a cohort study. Lancet 2021; 397:220–32.                 resonance imaging in patients recently recovered from coronavirus disease 2019
10. COVID-19 CRF - ISARIC. https://isaric.tghn.org/novel-coronavirus/. Accessed               (COVID-19). JAMA Cardiol 2020; 5:1265–73.
    17 December 2020.                                                                     25. Bonner JC. Regulation of PDGF and its receptors in fibrotic diseases. Cytokine
11. Darnell ME, Taylor DR. Evaluation of inactivation methods for severe acute res-           Growth Factor Rev 2004; 15:255–73.
    piratory syndrome coronavirus in noncellular blood products. Transfusion 2006;        26. Di Stefano A, Coccini T, Roda E, et al. Blood MCP-1 levels are increased in
    46:1770–7.                                                                                chronic obstructive pulmonary disease patients with prevalent emphysema. Int
12. Metsalu T, Vilo J. ClustVis: a web tool for visualizing clustering of multivariate        J Chron Obstruct Pulmon Dis 2018; 13:1691–700.
    data using principal component analysis and heatmap. Nucleic Acids Res 2015;          27. Kardas G, Daszyńska-Kardas A, Marynowski M, et al. Role of platelet-derived
    43:W566–70.                                                                               growth factor (PDGF) in asthma as an immunoregulatory factor mediating airway
13. Dinos S, Khoshaba B, Ashby D, et al. A systematic review of chronic fatigue, its          remodeling and possible pharmacological target. Front Pharmacol 2020; 11:47.
    syndromes and ethnicity: prevalence, severity, co-morbidity and coping. Int J         28. Ojo AS, Balogun SA, Williams OT, Ojo OS. Pulmonary fibrosis in COVID-
    Epidemiol 2009; 38:1554–70.                                                               19 survivors: predictive factors and risk reduction strategies. Pulm Med 2020;
14. Lande A, Fluge Ø, Strand EB, et al. Human leukocyte antigen alleles associated            2020:6175964.
    with myalgic encephalomyelitis/chronic fatigue syndrome (ME/CFS). Sci Rep             29. Metlay JP, Fine MJ, Schulz R, et al. Measuring symptomatic and functional re-
    2020; 10:5267.                                                                            covery in patients with community-acquired pneumonia. J Gen Intern Med 1997;

                                                                                                                                                                                      Downloaded from https://academic.oup.com/ofid/article/8/6/ofab156/6208280 by guest on 19 August 2021
15. Montoya JG, Holmes TH, Anderson JN, et al. Cytokine signature associated with             12:423–30.
    disease severity in chronic fatigue syndrome patients. Proc Natl Acad Sci U S A       30. Lam MH, Wing YK, Yu MW, et al. Mental morbidities and chronic fatigue in se-
    2017; 114:E7150–8.                                                                        vere acute respiratory syndrome survivors: long-term follow-up. Arch Intern Med
16. Taams LS, Steel KJA, Srenathan U, et al. IL-17 in the immunopathogenesis of               2009; 169:2142–7.
    spondyloarthritis. Nat Rev Rheumatol 2018; 14:453–66.                                 31. Ngai JC, Ko FW, Ng SS, et al. The long-term impact of severe acute respira-
17. Liu J, Yang X, Wang H, et al. Analysis of the long-term impact on cellular immu-          tory syndrome on pulmonary function, exercise capacity and health status.
    nity in COVID- 19-recovered individuals reveals a profound NKT cell impair-               Respirology 2010; 15:543–50.
    ment. mBio 2021; 12:e00085–21.                                                        32. Ahmed H, Patel K, Greenwood DC, et al. Long-term clinical outcomes in sur-
18. Bergamaschi L, Mescia F, Turner L, et al. Early immune pathology and per-                 vivors of severe acute respiratory syndrome and Middle East respiratory syn-
    sistent dysregulation characterise severe COVID-19 [preprint]. medRxiv 2021:              drome coronavirus outbreaks after hospitalisation or ICU admission: a systematic
    2021.01.11.20248765.                                                                      review and meta-analysis. J Rehabil Med 2020; 52:jrm00063.
19. Shibuya M. Vascular endothelial growth factor (VEGF) and its receptor (VEGFR)         33. Bein T, Weber-Carstens S, Apfelbacher C. Long-term outcome after the acute res-
    signaling in angiogenesis: a crucial target for anti- and pro-angiogenic therapies.       piratory distress syndrome: different from general critical illness? Curr Opin Crit
    Genes Cancer 2011; 2:1097–105.                                                            Care 2018; 24:35–40.
20. Kermani P, Hempstead B. Brain-derived neurotrophic factor: a newly described          34. Myers EA, Smith DA, Allen SR, Kaplan LJ. Post-ICU syndrome: rescuing the un-
    mediator of angiogenesis. Trends Cardiovasc Med 2007; 17:140–3.                           diagnosed. JAAPA 2016; 29:34–7.
21. Chang TT, Lin LY, Chen JW. Inhibition of macrophage inflammatory protein-1β           35. Bullard J, Dust K, Funk D, et al. Predicting infectious severe acute respiratory syn-
    improves endothelial progenitor cell function and ischemia-induced angiogenesis           drome coronavirus 2 from diagnostic samples. Clin Infect Dis 2020; 71:2663–6.
    in diabetes. Angiogenesis 2019; 22:53–65.                                             36. Bussani R, Schneider E, Zentilin L, et al. Persistence of viral RNA, pneumocyte
22. Camaré C, Pucelle M, Nègre-Salvayre A, Salvayre R. Angiogenesis in the athero-            syncytia and thrombosis are hallmarks of advanced COVID-19 pathology.
    sclerotic plaque. Redox Biol 2017; 12:18–34.                                              EBioMed 2020; 61:103104.

                                Persistent Symptoms and Association With Inflammatory Cytokine Signatures in Recovered COVID-19 Patients • ofid • 9
You can also read