Integrative Network Analysis of Multi-Omics Data in the Link between Plasma Carotenoid Concentrations and Lipid Profile
←
→
Page content transcription
If your browser does not render page correctly, please read the page content below
Research Article

                                                              Lifestyle Genomics 2020;13:11–19                                                  Received: August 23, 2019
                                                                                                                                                Accepted: September 24, 2019
                                                              DOI: 10.1159/000503828                                                            Published online: November 26, 2019

Integrative Network Analysis of Multi-Omics
Data in the Link between Plasma Carotenoid
Concentrations and Lipid Profile
Bénédicte L. Tremblay a, b Frédéric Guénard a, b Benoît Lamarche a, b
Louis Pérusse a, c Marie-Claude Vohl a, b
a Institute
          of Nutrition and Functional Foods (INAF), Laval University, Quebec City, QC, Canada; b School of Nutrition,
Laval University, Quebec City, QC, Canada; c Department of Kinesiology, Laval University, Quebec City, QC, Canada

Keywords                                                                                        groups of highly correlated genes represented by colors,
Carotenoids · DNA methylation · Gene expression · Lipids ·                                      were identified and linked to the lipid profile. Probes clus-
Weighted gene correlation network analysis                                                      tered in the turquoise and green modules correlated with
                                                                                                plasma lipid concentrations. A total of 28 hub genes were
                                                                                                identified. Conclusions: Genome-wide DNA methylation
Abstract                                                                                        and gene expression levels were both associated with plas-
Introduction: Carotenoids, which are a reliable biomarker of                                    ma total carotenoid concentrations. Several hub genes,
fruit and vegetable consumption, are positively associated                                      mostly involved in lipid metabolism and inflammatory re-
with the lipid profile. Circulating carotenoid concentrations                                   sponse with several genetic variants associated with plasma
may interact with several omics profiles including genome,                                      lipid concentrations, came out of the integrative analysis.
transcriptome, and epigenome. Few studies have used                                             This provides a comprehensive understanding of the inter-
multi-omics approaches, and they rarely include environ-                                        active molecular system between carotenoids, omics, and
mental factors, such as diet. Objective: The objective of this                                  plasma lipid profile.                © 2019 The Author(s)
observational study was to examine the potential role of                                                                                              Published by S. Karger AG, Basel

multi-omics data in the interconnection between diet, rep-
resented by total carotenoids, and lipid profile using weight-
ed gene correlation network analysis (WGCNA). Methods:                                              Introduction
Blood leukocyte DNA methylation levels of 472,245 CpG
sites and whole blood gene expression levels of 18,160 tran-                                       Diet is the cornerstone for the prevention and treat-
scripts were tested for associations with total carotenoid                                      ment of chronic diseases. A diet rich in fruits and vegeta-
concentrations using regressions in 48 healthy subjects.                                        bles is inversely associated with the incidence of cardio-
WGCNA was used to identify co-omics modules and hub                                             vascular diseases [1]. Plasma carotenoid concentrations
genes related to the lipid profile. Results: Among genes as-                                    are a reliable biomarker of fruit and vegetable consump-
sociated with total carotenoid concentrations, a total of 236                                   tion [2, 3]. Variability in circulating carotenoids may be
genes were identified at both DNA methylation and gene                                          due to several factors including age, sex, body weight,
expression levels. Using WGCNA, six modules, consisting of                                      physical activity, genetic, and lipid profile [3]. Accord-

                           © 2019 The Author(s)                                                 Marie-Claude Vohl, PhD
                           Published by S. Karger AG, Basel                                     Institute of Nutrition and Functional Foods (INAF), Laval University
                                                                                                2440 Hochelaga Blvd
E-Mail karger@karger.com   This article is licensed under the Creative Commons Attribution-
                           NonCommercial-NoDerivatives 4.0 International License (CC BY-        Quebec City, QC G1V 0A6 (Canada)
www.karger.com/lfg                                                                              E-Mail marie-claude.vohl @ fsaa.ulaval.ca
                           NC-ND) (http://www.karger.com/Services/OpenAccessLicense).
                           Usage and distribution for commercial purposes as well as any dis-
                           tribution of modified material requires written permission.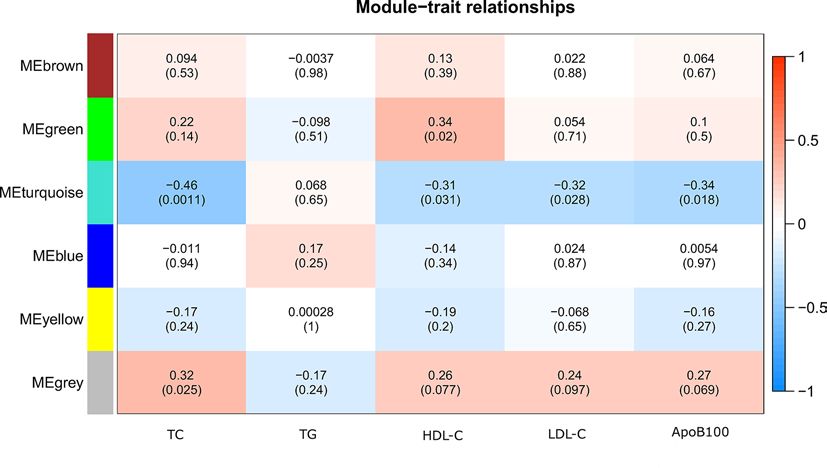
ingly, the majority of circulating carotenoids are associ- files on cardiometabolic health. Families living under the same roof
ated with several lipoproteins and plasma lipids [4, 5]. comprised at least the mother and one child aged between 8 and 18
years. Parents had to be the biological parents of their child (or chil-
Several genome-wide association studies have identi- dren), in good general health, non-smokers, with a body mass index
fied genetic variants that influence circulating carotenoid ranging between 18 and 35, and free of any metabolic conditions
concentrations [6, 7]. Moreover, carotenoids may exert requiring treatment, although the use of Synthroid® (levothyroxine)
their effect on gene expression, via several transcriptional or oral contraceptive was tolerated. Children also had to be non-
systems [8], and on DNA methylation of specific genes smokers, in good general health and not using psychostimulators
(Ritalin® [methylphenidate], Concerta® [methylphenidate], and
[9]. Thus, omics profiles, including genome, transcrip- Strattera® [atomoxetine]). Families were composed of 16 mothers,
tome, and epigenome, may interact with circulating ca- 6 fathers, and 26 children. Blood samples were taken from both par-
rotenoids. Relating omics data to a specific trait requires ents and children during their visit at the Institute of Nutrition and
the integration of a very large amount of data. Weighted Functional Foods (INAF). The experimental protocol was approved
gene correlation network analysis (WGCNA) is a widely by the Ethics Committees of Laval University Hospital Research
Center and Laval University. All participants (adults and children)
used system biology approach designed for high dimen- signed an informed consent form. Parental consent was also ob-
sional data such as omics data [10]. It then becomes pos- tained by signing the child consent document.
sible to relate highly correlated genes (modules) to a phe-
notypic trait, and to identify key hub genes within mod- Anthropometric and Lipid Parameter Measurements
ules that are related to a phenotypic trait [10]. Body weight and height were measured according to the proce-
dures recommended by the Airlie Conference [18]. Blood samples
Studies usually include only one type of omics data. were collected from an antecubital vein into vacutainer tubes con-
However, omics data are not only interconnected with taining EDTA after a 12-h overnight fast and a 48-h alcohol absti-
each other, but also with the environment and pheno- nence. Plasma was separated by centrifugation (2,500 g for 10 min at
typic traits [11]. An integrative multi-omics approach 4 ° C), and samples were aliquoted and frozen (–80 ° C) for subsequent
may provide a holistic understanding of an interactive analyses. Enzymatic assays were used to measure plasma total cho-
lesterol (TC) and triglyceride (TG) concentrations [19, 20]. Precipi-
molecular system [12]. Only a few studies have used tation of very-low-density lipoprotein (VLDL) and low-density lipo-
multi-omics approaches and most focused on the effect protein (LDL-C) particles in the infranatant with heparin manganese
of genetics on omics markers, including DNA methyla- chloride generated the high-density lipoprotein cholesterol (HDL-
tion (meQTLS) and gene expression (eQTLs) [12]. More- C) fraction [21]. LDL-C was calculated with the Friedewald formula
over, studies rarely include environmental factors, such [22]. Apolipoprotein B-100 (ApoB100) concentrations were mea-
sured in plasma by the rocket immunoelectrophoretic method [23].
as diet. A study in healthy overweight men reported the
effects of specific dietary components on low-grade in- RNA Extraction and Gene Expression Analysis
flammation using a multi-omics approach [13]. Total RNA was isolated and purified from whole blood using
In the present study, the objective was to examine the PAXgene Blood RNA Kit (QIAGEN) as previously described [15].
potential role of multi-omics data in the interconnection The HumanHT-12 v4 Expression BeadChip (Illumina Inc., San
Diego, CA, USA) was used to measure expression levels of ∼47,000
between diet, represented by total carotenoids, and lipid probes (> 31,000 annotated genes). This was performed at the
profile using WGCNA. First, multi-omics data (DNA McGill University and Genome Quebec Innovation Center (Mon-
methylation and gene expression levels) were tested for treal, QC, Canada). The FlexArray software (version 1.6) [24] and
associations with plasma total carotenoid concentrations the lumi R package were used to analyze and normalize gene ex-
using linear regressions. Second, WGCNA was used to pression levels. Probes with a detection p value ≤0.05 in at least
25% of all subjects were considered in the analysis. A total of 18,160
link carotenoids-associated multi-omics data to lipid probes among the 47,323 probes on the microarray (38.4%)
profile. showed significant gene expression in the blood.
DNA Extraction and Methylation Analysis
Genomic DNA was extracted from blood leukocytes using the
Materials and Methods GenElute Blood Genomic DNA Kit (Sigma-Aldrich, St. Louis,
MO, USA) as previously described [14]. Methylation levels were
Patients and Design measured using Infinium Human Methylation 450 array (Illumi-
A total of 48 Caucasian French-Canadian subjects from 16 fami- na, San Diego, CA, USA). Bisulfite conversion and quantitative
lies were recruited in the Greater Quebec City metropolitan area, in DNA methylation analysis were processed at the McGill Univer-
Canada, as part of the GENERATION Study, whose recruitment be- sity and Genome Quebec Innovation Center (Montreal, QC, Can-
gan in May 2011. The GENERATION Study was designed to evalu- ada). Illumina GenomeStudio software v2011.1 and the Methyla-
ate familial resemblances in omics (DNA methylation [14] and gene tion Module were used to analyze methylation data on 485,577
expression [15]) and metabolic (metabolites [16] and carotenoids CpG sites. Global normalization using control probes was per-
[17]) profiles in healthy families and to test the impact of these pro- formed in GenomeStudio. Probes with a detection p value >0.01 in
12 Lifestyle Genomics 2020;13:11–19 Tremblay/Guénard/Lamarche/Pérusse/
DOI: 10.1159/000503828 Vohlmore than 5 subjects (>10% of all subjects) were removed, as well Table 1. Characteristic and lipid profile parameters of study sub-
as probes on the X and Y chromosomes (to eliminate gender bias), jects
and probes mapped to multiple chromosomes [25]. Thus, 472,245
probes were considered in the analysis. Biochemical parameters Parents (n = 22) Children (n = 26)
Carotenoid Measurements Age, years 42.3±5.3 11.3±3.4
Samples and standards used for the measurement of carotenoid BMI, kg/m2 23.9±3.0 –
concentrations were prepared as reported previously [17]. Briefly, BMI percentile – 50±31.1
carotenoid standards were purchased from Sigma (Oakville, ON, TC, mmol/L 4.68±0.55 4.28±0.51
Canada). A total of 100 µL of plasma, 20 µL of 2-propanol, and 20 HDL-C, mmol/L 1.63±0.38 1.55±0.29
µL of carotenoid standard were transferred in Eppendorf tubes. LDL-C, mmol/L 2.61±0.55 2.31±0.45
Samples were transferred on a 400-μL fixed well plate (ISOLUTE® ApoB100, g/L 0.80±0.15 0.70±0.13
SLE+, Biotage, Charlotte, NC, USA) with 900 µL of hex TG, mmol/L 0.95±0.35 0.93±0.39
ane:isopropanol (90/10, v/v) in each well. Each extracted sample Total carotenoids 6.35±2.39 5.70±2.05
was evaporated under nitrogen and reconstituted with 300 µL of
methanol:dichloromethane (65/35, v/v). Plates were shaken for 10 All values are means ± SD. ApoB100, apolipoprotein B100;
min and samples were transferred into high-performance liquid HDL-C, high-density lipoprotein cholesterol; LDL-C, low-density
chromatography glass vials to be analyzed. lipoprotein cholesterol; SD, standard deviation; TC, total choles-
High-performance liquid chromatography-UV analysis was terol; TG, triglycerides.
performed using an Agilent 1260 liquid handling system (Agilent,
Mississauga, ON, Canada) as previously described [17]. Carot-
enoids were separated with a mobile phase consisting of
methanol:water (98/2, v/v; Eluent A) and methyl tert-butyl ether with unassigned probes. To identify modules associated with lipid
(Eluent B; VWR, Mississauga, ON, Canada) with a flow rate of profile traits (TC, LDL-C, HDL-C, TG, ApoB100), correlations be-
1 mL/min. UV detector was set at 450 nm and identification of each tween module eigengenes (MEs; i.e., the first principal component
compound was confirmed using retention time and UV spectra of the module) [31] and traits were computed. Gene significance
(190–640 nm) of the pure compounds. Data acquisition was carried (GS), defined as the absolute correlation between the probe and the
out with the Chemstation software (Agilent, Mississauga, ON, Can- trait, was used to quantify associations of individual probes with lip-
ada). For all carotenoids the concentrations are reported in μmol/L id profile traits. To quantify the similarity of all probes to every mod-
of plasma. One outlier in β-cryptoxanthin, defined as a value falling ule, a quantitative measure of module membership (MM) was de-
outside of the mean ± 4 SD, was excluded from analyses. fined as the correlation of the ME and the probe DNA methylation
or gene expression levels. Probes with the highest MM and highest
Associations between Multi-Omics Data and Plasma Total
GS were those with high significance (hub genes) [32]. The hub genes
Carotenoids
within a module were chosen based on GS >0.2 and MM >0.8, with
a p value ≤0.05. Topological interaction network in the turquoise
Total plasma carotenoid (µmol/L of plasma) concentrations
were calculated as the sum of α-carotene, β-carotene, β-
module was constructed and visualized using VisANT 5.0, a software
cryptoxanthin, lutein, lycopene, and zeaxanthin concentrations.
framework for hierarchical organization of biological networks [33].
Concentrations of plasma carotenoids are available in a previous
Moreover, to obtain a visually interpretable network, a weighted cor-
study [17]. As previously described, R software v2.14.1 (R Founda- relation cutoff of 0.42 was used in the turquoise module. Genes with
tion for Statistical Computing; http://www.r-project.org) [26] was four connections or more were selected as central genes.
used to compute linear regressions between gene expression levels
of all 18,160 transcripts, DNA methylation levels of all 472,245 Statistical Analysis
CpG sites and total carotenoids adjusted for the family ID [27, 28]. Statistical Analysis Software (SAS) version 9.4 was used to com-
pute means and SD of biochemical parameters in parents and chil-
Weighted Gene Correlation Network Analysis
dren. Coefficient of variation (CV) was computed as the ratio of
WGCNA was performed with the WGCNA package [10, 29] in
the SD to the mean for each 240 expression transcripts and 466
R software [26]. A weighted adjacency matrix was established by cal-
CpG sites. The nonparametric one-way Wilcoxon procedure was
culating Pearson correlations between each probe pair. The co-
used to test difference in CV (non-normally distributed), while an
omics similarity was raised to a power β = 3 to calculate adjacency
unpaired t test was used to test difference in MM of the turquoise
[30]. Correlations between probes were used to construct a topo-
module (normally distributed).
logical overlap matrix (TOM), which provided a similarity measure.
The TOM was then used to calculate the corresponding dissimilar-
ity (1 – TOM). Average linkage hierarchical clustering coupled with
the TOM-based dissimilarity was used to group probes with coher- Results
ent omics profiles into modules [30]. More specifically, the dynamic
tree cutting algorithm (deep split = 3, minimum number of probes Characteristics of Study Participants
per module = 30, cut height = 0.25) was used to detect modules. The
assignment of outlying probes to modules was made using the Par- Characteristics including plasma total carotenoid and
titioning Around Medoids method. Colors are randomly assigned to lipid concentrations of healthy participants (parents and
modules except for the grey color, which is reserved for the module children) are presented in Table 1. Concentrations of all
Multi-Omics Data in the Link between Lifestyle Genomics 2020;13:11–19 13
Carotenoids and Lipids DOI: 10.1159/000503828Color version available online
Cluster dendrogram
1.0
0.9
0.8
Height
0.7
0.6
Dynamic tree cut
Merged dynamic
Fig. 1. Gene dendrogram obtained using average linkage hierarchical clustering. Six module colors are shown
correspondingly. The merged dynamic yielded the same modules as the dynamic tree cut using a cutoff of 0.25.
6 main plasma carotenoids (α-carotene, β-carotene, fied at both DNA methylation and gene expression levels
β-cryptoxanthin, lutein, lycopene, and zeaxanthin) and (online suppl. Table S1, for all online suppl. material, see
total carotenoids are presented in a previous study [17]. www.karger.com/doi/10.1159/000503828). WGCNA was
then conducted on these subsets of probes as illustrated in
Associations between Multi-Omics Data and Plasma the study schematic (online suppl. Fig. S1).
Total Carotenoids
As previously reported in studies by our group, genome- Weighted Gene Correlation Network Analysis
wide DNA methylation levels of 20,687 out of 472,245 CpG A total of 6 distinct modules were identified from
sites [28] and genome-wide expression levels of 533 out of DNA methylation levels of the 466 CpG sites and gene
18,160 transcripts [27] were associated (p ≤ 0.05) with plas- expression levels of the 240 transcripts using a dynamic
ma total carotenoid concentrations. In order to perform an tree cutting algorithm (Fig. 1). The blue, brown, green,
integrative analysis, subsets of CpG sites and transcripts as- turquoise, yellow, and grey modules contained 133, 96,
sociated with total carotenoids were collapsed to gene level 34, 381, 38, and 24 probes, respectively. The grey module
to retain only common genes. A total of 236 genes (repre- contained the 24 uncorrelated probes, which were ex-
sented by 466 CpG sites and 240 transcripts) were identi- cluded from further analysis. None of the modules were
14 Lifestyle Genomics 2020;13:11–19 Tremblay/Guénard/Lamarche/Pérusse/
DOI: 10.1159/000503828 VohlColor version available online
Fig. 2. Heatmap of module-trait relationships depicting correlations between module eigengenes and lipid profile
traits. Numbers in the table correspond to the correlation r and the p value in parentheses. The degree of correla-
tion is illustrated with the color legend. ApoB100, apolipoprotein B100; HDL-C, high-density lipoprotein choles-
terol; LDL-C, low-density lipoprotein cholesterol; ME, module eigengene; TC, total cholesterol; TG, triglycerides.
merged using the merged dynamic algorithm (cutoff green modules in order to refine the analysis of potential
height of 0.25) (Fig. 1). Correlations between MEs and mechanisms linking carotenoids to lipid profile. A total of
lipid profile traits (TC, LDL-C, HDL-C, TG, ApoB100) 35 probes (28 unique genes) were identified in the tur-
were computed to find lipid profile-correlated modules. quoise module: AFF1, AMICA1, ARHGEF10, AZU1,
ME representing the 381 probes clustered in the turquoise C10orf105, C19orf76, CDH23, ENSA, FES, GABBR1,
module correlated inversely with TC (r = –0.46, p = 0.001), HCCA2, ICAM4, IFRD1, IKZF3, LBH, LCOR, LGALS2,
HDL-C (r = –0.31, p = 0.03), LDL-C (r = –0.32, p = 0.03), MBNL1, MPO, NLK, PRKCZ, PTPRJ, RPUSD3, SAMD3,
and ApoB100 (r = –0.34, p = 0.02) (Fig. 2). ME represent- SCRN1, SLC24A4, SPTLC2, and TRIB1. None of the
ing the 34 probes clustered in the green module corre- probes in the green module passed predetermined cutoffs.
lated positively with HDL-C (r = 0.34, p = 0.02) (Fig. 2). Detailed gene-trait associations with GS and MM of the
GS of each plasma lipid was correlated with MM of each turquoise module are presented in the online supplemen-
module. MM in the turquoise module correlated with GS tary Table S2. Interestingly, hub genes were represented
for TC (r = 0.42, p = 1 ×10–17), HDL-C (r = 0.11, p = by 34 CpG sites and only 1 transcript. Since one of the cri-
0.032), LDL-C (r = 0.39, p = 2.7 × 10⁻¹⁵), and ApoB100 teria for the selection of hub genes is MM (>0.8), we test-
(r = 0.43, p = 1.4 × 10⁻¹⁸). MM in the green module cor- ed the potential difference in the MM of expression tran-
related with GS for HDL-C (r = 0.35, p = 0.042). This sug- scripts and methylation CpG sites in the turquoise mod-
gests that probes highly significantly associated with these ule. The mean MM of expression transcripts (0.064 ± 0.40)
lipid profile traits were also the most important elements was significantly lower (p = 0.01) than the mean MM of
of the turquoise and green modules. Thus, the turquoise methylation CpG sites (0.14 ± 0.39). MM was defined as
and green modules were selected as modules of interest the correlation of the MEs and the gene expression or
in subsequent analyses. DNA methylation levels. Thus, the variability in gene ex-
pression and DNA methylation levels may impact this
Hub Gene Analysis correlation (i.e., the MM). Across all 240 transcripts, ex-
Hub gene analysis, identifying genes with the highest pression levels had a mean CV significantly lower than the
MM and highest GS, was conducted for the turquoise and mean CV of methylation levels of all 466 CpG sites (0.013
Multi-Omics Data in the Link between Lifestyle Genomics 2020;13:11–19 15
Carotenoids and Lipids DOI: 10.1159/000503828Color version available online
FES PRKCZ
MPO
PTPRJ
C100RF105
STK36
IKZF3
AFF1 ARHGEF10
MBNL1
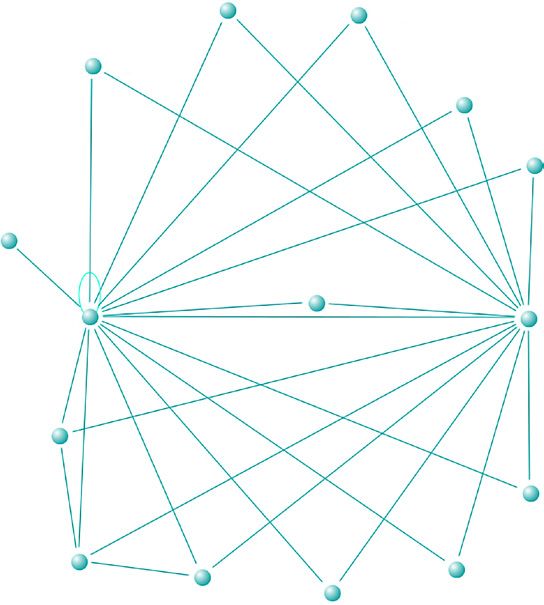
Fig. 3. Topological interaction network of ENSA
15 unique genes in the turquoise module.
Each gene is represented by a node and the
edge number is proportional to the con- CDH23 NLK
nection strength. The gene-gene interac- ICAM4
tion network was constructed and visual- IFRD1
ized using VisANT 5.0.
± 0.001 vs. 0.16 ± 0.18, p < 0.0001). Thus, the fact that CpG profile using WGCNA. First, the association between
sites represent 34 of the 35 hub probes seems to be ex- multi-omics data and plasma total carotenoid concentra-
plained by their higher MM due to a greater variability in tions was assessed. Based on previous studies by our
methylation levels as compared to expression levels. group [27, 28], transcripts and CpG sites associated with
total carotenoid concentrations were identified. This is
Topological Network Analysis concordant with the previously reported effects of carot-
In order to better define gene-gene interactions in the enoids on gene expression [8] and DNA methylation [9].
turquoise and green modules, topological network analy- For the purpose of the multi-omics analysis, genes identi-
sis was performed. In the turquoise module (381 probes), fied at both gene expression and DNA methylation levels
only annotated probes with a weighted correlation cutoff were retained to study their combined effects on lipid
of 0.42 were included. Thus, a total of 15 unique genes profile.
were included. Three genes with more than 4 connections Second, WGCNA was used to link multi-omics data,
(AFF1, ARHGEF10, and CDH23) were central to the net- associated with carotenoids, to lipid profile. WGCNA
work (Fig. 3). Considering that genes in the green module yielded 6 modules including the turquoise and green
were weakly interconnected (highest weighted correla- modules, which were relevant considering their associa-
tion of 0.14), the analysis was not done in this module. tions with the lipid profile. Interestingly, in the turquoise
module, 72 out of 228 unique genes were in common be-
tween expression transcripts and methylation CpG sites,
Discussion/Conclusion suggesting a concordance in the potential biological ef-
fects of some genes. The turquoise module seems biolog-
The aim of the present study was to examine the po- ically plausible since its ME is correlated with several plas-
tential role of multi-omics data in the interconnection be- ma lipids. In addition, as shown by their GS, genes clus-
tween diet, represented by total carotenoids, and lipid tering in this module are also correlated with lipids, and
16 Lifestyle Genomics 2020;13:11–19 Tremblay/Guénard/Lamarche/Pérusse/
DOI: 10.1159/000503828 Vohlhave biological functions as well as associations reported sphingomyelin levels in both HDL-C and non-HDL-C with lipids in the literature. Indeed, among the 28 unique fractions [47]. TRIB1 encodes for the tribbles pseudoki- hub genes identified, the following 9 hub genes were of nase 1. Genetic variants within TRIB1 have been associ- interest in the context of lipid profile: AFF1, ARHGEF10, ated with plasma lipid concentrations (TG, HDL-C, and LCOR, LGALS2, MBNL1, MPO, SLC24A4, SPTLC2, and TC) [48] and with an increased risk of ischemic heart dis- TRIB1. The correlation graphs between methylation lev- ease [48, 49]. Genetic variants in TRIB1 have an effect on els of CpG sites within these genes, lipid concentrations, α-tocopherol levels [6]. Even though the ME representing and ME of the turquoise module are presented in online probes in the green module correlated with HDL-C, none supplementary Figures S2 to S5. AFF1 encodes for the of the probes passed pre-determined cutoffs of GS and AF4/FMR2 family member 1 implicated in lymphocyte MM. Moreover, topological network analysis was per- development and autoimmune disease [34]. Single nucle- formed in the turquoise module to investigate gene-gene otide polymorphisms within this gene have been associ- interactions independently of the GS and MM. A total of ated with plasma TG and HDL-C concentrations [35, 36]. 3 central genes (AFF1, ARHGEF10, and CDH23) were ARHGEF10 encodes for the Rho guanine nucleotide ex- identified. These genes were also highlighted as hub genes change factor 10. Interestingly, a study by our group re- in the previous analysis. ported that a single nucleotide polymorphism within this This multi-omics approach allowed to better under- gene alters the activity of delta-6-desaturase and influ- stand the potential underlying mechanisms of action of ences susceptibility to hypertriglyceridemia [37]. A ge- plasma carotenoids on the lipid profile. It provided a netic variant within this gene was also associated with more global understanding of the role of genome-wide atherosclerotic stroke in the Chinese population [38]. DNA methylation and gene expression in this associa- LCOR encodes for the ligand-dependent nuclear receptor tion. Indeed, WGCNA was computed on both DNA corepressor that regulates lipogenesis and may be a po- methylation and gene expression levels to evaluate their tential target for treating hepatic steatosis [39]. LGALS2 combined effects on the plasma lipid profile. We com- encodes for galectin 2. Variations in this gene were asso- pared results obtained in the combined WGCNA with ciated with inflammatory biomarkers, cellular adhesion results obtained in WGCNA independently performed molecules, risk of coronary heart disease, as well as with on methylation and expression. Only a small proportion the insulin-glucose profile [40, 41]. MBNL1, encoding for of genes (n = 62) within the modules of interest (i.e., that the muscleblind like splicing regulator 1, modulates alter- showed correlations with plasma lipid concentrations) native splicing of pre-mRNAs. A variation in this gene were in common between methylation and expression has been associated with HDL-C levels [35]. MPO gene analysis in previous studies. Interestingly, the vast major- encodes for a myeloperoxidase, a pro-inflammatory en- ity of probes found in the module of interest, obtained in zyme stored in granulocytes [42]. Myeloperoxidase also WGCNA independently performed on methylation and promotes oxidation of HDL-C particles potentially in- expression, were also identified in the present combined volved in the development of atherosclerosis. An increase WGCNA. These results suggest that a combined in MPO concentration leads to a decrease in ApoAI and WGCNA can highlight genes of important modules of HDL-C levels and disturbs HDL-C function [43]. More- interest observed in WGCNA independently performed over, the level of myeloperoxidase was significantly lower on methylation and expression data. in rats following a supplementation with lycopene [44]. The present study has several strengths. To the best of SLC24A4 encodes for the solute carrier family 24 member our knowledge, this is the first study to examine the po- 4. Variations within this gene have been associated with tential role of multi-omics data in the interconnection be- lipoprotein concentrations and size measurements of tween plasma carotenoids and the lipid profile. This ap- more than 1,000 subjects of the GOLDN study [45]. How- proach allowed evaluating the combined effect of DNA ever, the role of SLC24A4 in the lipid metabolism remains methylation and gene expression on lipid profile. unclear. SPTLC2 encodes for the serine palmitoyltrans- WGCNA also allowed relating large omics data sets to ferase long chain base subunit 2. SPTLC2+/– macro- phenotypic traits, while reducing multiple comparison phages have significantly lower sphingomyelin levels in burdens by clustering correlated genes into modules [10]. plasma membrane and lipid rafts. This reduction im- The study also considered genome-wide omics data and paired inflammatory responses and also enhanced re- 6 predominant plasma carotenoid concentrations to ob- verse cholesterol transport mediated by ABC transport- tain a more complete picture of the association. However, ers [46]. Liver SPTLC2 deficiency also decreased plasma this study has some limitations. The main one is the small Multi-Omics Data in the Link between Lifestyle Genomics 2020;13:11–19 17 Carotenoids and Lipids DOI: 10.1159/000503828
sample size. This may limit the statistical power to detect                        Statement of Ethics
significant associations between total carotenoids and
                                                                                  All participants (adults and children) signed an informed con-
DNA methylation and gene expression levels. It may also                        sent document. Parental consent was also obtained by signing the
reduce variability in DNA methylation and gene expres-                         child consent document. The experimental protocol was approved
sion levels, and thus limit the identification of hub genes,                   by the Ethics Committees of Laval University Hospital Research
based on the MM, in the WGCNA. Finally, our study did                          Center and Laval University.
not account for dietary profiles, physical activity, smok-
ing, and alcohol consumption, which may affect circulat-
ing carotenoid concentrations [50, 51].                                            Disclosure Statement
   In conclusion, genome-wide DNA methylation and
                                                                                   The authors have no conflicts of interest to declare.
gene expression levels were both associated with plasma
total carotenoid concentrations. WGCNA clustered
multi-omics data into modules that were further linked
                                                                                   Funding Sources
to lipid profile to reveal key hub genes involved in lipid
metabolism, plasma lipid concentrations and carot-                                This work was supported by the Canada Research Chair in Ge-
enoids. This integrative analysis provides a comprehen-                        nomics Applied to Nutrition and Metabolic Health. M.-C.V. is
sive understanding of the interactive molecular system                         Tier 1 Canada Research Chair in Genomics Applied to Nutrition
between carotenoids, DNA methylation, gene expres-                             and Metabolic Health. B.L.T. is a recipient of a scholarship from
                                                                               Canadian Institutes of Health Research (CIHR).
sion, and the plasma lipid profile.

                                                                                   Author Contributions
     Acknowledgement
                                                                                  Each author contribution to the work: B.L. and M.-C.V. de-
   We would like to thank Christian Couture, Véronique Gar-                    signed the research; B.L.T., F.G., and L.P. conducted the research
neau, Catherine Raymond, and Véronique Richard who contrib-                    and performed statistical analysis; B.L.T. wrote the paper; B.L.T.
uted to the success of this study.                                             and M.-C.V. have primary responsibility for the final content. All
                                                                               authors read and approved the final manuscript.

     References
1 Martínez-González MA, de la Fuente-Arrilla-         6 Ferrucci L, Perry JR, Matteini A, Perola M,            spectrometry and nuclear magnetic reso-
  ga C, López-Del-Burgo C, Vázquez-Ruiz Z,              Tanaka T, Silander K, et al. Common varia-             nance spectroscopy. Chem Soc Rev. 2011 Jan;
  Benito S, Ruiz-Canela M. Low consumption              tion in the beta-carotene 15,15′-monooxy-              40(1):387–426.
  of fruit and vegetables and risk of chronic dis-      genase 1 gene affects circulating levels of ca-   12   Sun YV, Hu YJ. Integrative Analysis of Multi-
  ease: a review of the epidemiological evidence        rotenoids: a genome-wide association study.            omics Data for Discovery and Functional
  and temporal trends among Spanish gradu-              Am J Hum Genet. 2009 Feb;84(2):123–33.                 Studies of Complex Human Diseases. Adv
  ates. Public Health Nutr. 2011 Dec; 14 12A:         7 Zubair N, Kooperberg C, Liu J, Di C, Peters U,         Genet. 2016;93:147–90.
  2309–15.                                              Neuhouser ML. Genetic variation predicts se-      13   Bakker GC, van Erk MJ, Pellis L, Wopereis S,
2 Souverein OW, de Vries JH, Freese R, Watzl            rum lycopene concentrations in a multiethnic           Rubingh CM, Cnubben NH, et al. An antiin-
  B, Bub A, Miller ER 3rd, et al. Prediction of         population of postmenopausal women. J                  flammatory dietary mix modulates inflam-
  fruit and vegetable intake from biomarkers            Nutr. 2015 Feb;145(2):187–92.                          mation and oxidative and metabolic stress in
  using individual participant data of diet-con-      8 Sharoni Y, Danilenko M, Dubi N, Ben-Dor A,             overweight men: a nutrigenomics approach.
  trolled intervention studies. Br J Nutr. 2015         Levy J. Carotenoids and transcription. Arch            Am J Clin Nutr. 2010 Apr;91(4):1044–59.
  May;113(9):1396–409.                                  Biochem Biophys. 2004 Oct;430(1):89–96.           14   Tremblay BL, Guénard F, Lamarche B,
3 Couillard C, Lemieux S, Vohl MC, Couture P,         9 Bollati V, Favero C, Albetti B, Tarantini L,           Pérusse L, Vohl MC. Familial resemblances in
  Lamarche B. Carotenoids as biomarkers of              Moroni A, Byun HM, et al. Nutrients intake is          blood leukocyte DNA methylation levels. Epi-
  fruit and vegetable intake in men and women.          associated with DNA methylation of candi-              genetics. 2016 Nov;11(11):831–8.
  Br J Nutr. 2016 Oct;116(7):1206–15.                   date inflammatory genes in a population of        15   Tremblay BL, Guénard F, Lamarche B,
4 Allore T, Lemieux S, Vohl MC, Couture P, La-          obese subjects. Nutrients. 2014 Oct; 6(10):            Pérusse L, Vohl MC. Familial resemblances in
  marche B, Couillard C. Correlates of the dif-         4625–39.                                               human whole blood transcriptome. BMC Ge-
  ference in plasma carotenoid concentrations        10 Langfelder P, Horvath S. WGCNA: an R pack-             nomics. 2018 Apr;19(1):300.
  between men and women. Br J Nutr. 2019 Jan;           age for weighted correlation network analysis.    16   Tremblay BL, Guénard F, Lamarche B,
  121(2):172–81.                                        BMC Bioinformatics. 2008 Dec;9(1):559.                 Pérusse L, Vohl MC. Familial resemblances in
5 Clevidence BA, Bieri JG. Association of carot-     11 Dunn WB, Broadhurst DI, Atherton HJ, Goo-              human plasma metabolites are attributable to
  enoids with human plasma lipoproteins.                dacre R, Griffin JL. Systems level studies of          both genetic and common environmental ef-
  Methods Enzymol. 1993;214:33–46.                      mammalian metabolomes: the roles of mass               fects. Nutr Res. 2019 Jan;61:22–30.

18                        Lifestyle Genomics 2020;13:11–19                                                Tremblay/Guénard/Lamarche/Pérusse/
                          DOI: 10.1159/000503828                                                          Vohl
17 Tremblay BL, Guénard F, Lamarche B, 30 Zhang B, Horvath S. A general framework for 41 Christensen MB, Lawlor DA, Gaunt TR, Pérusse L, Vohl MC. Genetic and Common weighted gene co-expression network analy- Howell WM, Davey Smith G, Ebrahim S, et al. Environmental Contributions to Familial Re- sis. Statistical applications in genetics and Genotype of galectin 2 (LGALS2) is associat- semblances in Plasma Carotenoid Concentra- molecular biology. Stat Appl Genet Mol Biol. ed with insulin-glucose profile in the British tions in Healthy Families. Nutrients. 2018 Jul; 2005;4:Article17. Women’s Heart and Health Study. Diabetolo- 10(8):E1002. 31 Langfelder P, Horvath S. Eigengene networks gia. 2006 Apr;49(4):673–7. 18 Callaway C, Chumlea W, Bouchard C, Himes for studying the relationships between co-ex- 42 Zou S, Pan X, Hua C, Wu M, He B, Chen Z. J, Lohman T, Martin A, et al. Standardization pression modules. BMC Syst Biol. 2007 Nov; Myeloperoxidase -463 G/A polymorphism is of anthropometric measurements: The Airlie 1(1):54. associated with lung cancer risk: A meta-anal- (VA) Consensus Conference; 1988; Cham- 32 Horvath S, Zhang B, Carlson M, Lu KV, Zhu ysis with 7420 cases and 9132 controls. J paign (IL). S, Felciano RM, et al. Analysis of oncogenic Cancer Res Ther. 2018 Jun; 14(9 Supple 19 McNamara JR, Schaefer EJ. Automated enzy- signaling networks in glioblastoma identifies ment):S282–7. matic standardized lipid analyses for plasma ASPM as a molecular target. Proc Natl Acad 43 Kimak E, Zięba B, Duma D, Solski J. Myelo- and lipoprotein fractions. Clin Chim Acta. Sci USA. 2006 Nov;103(46):17402–7. peroxidase level and inflammatory markers 1987 Jun;166(1):1–8. 33 VisANT 5.0. Visual analyses of metabolic net- and lipid and lipoprotein parameters in stable 20 Burstein M, Samaille J. [On a rapid determi- works in cells and ecosystems [accessed 2018 coronary artery disease. Lipids Health Dis. nation of the cholesterol bound to the serum Dec 18]. Available from: http://visant.bu.edu. 2018 Apr;17(1):71. alpha- and beta-lipoproteins]. Clin Chim 34 Sun QQ, Hua DJ, Huang SC, Cen H, Zhou L, 44 Reifen R, Nur T, Matas Z, Halpern Z. Lyco- Acta. 1960 Jul;5:609. Shao S. Association study of AFF1 rs340630 pene supplementation attenuates the inflam- 21 Albers JJ, Warnick GR, Wiebe D, King P, polymorphism with genetic susceptibility to matory status of colitis in a rat model. Int J Steiner P, Smith L, et al. Multi-laboratory rheumatoid arthritis in Chinese population. Vitamin Nutr Res. 2001;71(6):347-51. comparison of three heparin-Mn2+ precipi- Braz J Med Biol Res. 2018;51(7):e7126. 45 Kraja AT, Borecki IB, Tsai MY, Ordovas JM, tation procedures for estimating cholesterol 35 Klarin D, Damrauer SM, Cho K, Sun YV, Tes- Hopkins PN, Lai CQ, et al. Genetic analysis of in high-density lipoprotein. Clin Chem. 1978 lovich TM, Honerlaw J, et al.; Global Lipids 16 NMR-lipoprotein fractions in humans, the Jun;24(6):853–6. Genetics Consortium; Myocardial Infarction GOLDN study. Lipids. 2013 Feb; 48(2): 155– 22 Friedewald WT, Levy RI, Fredrickson DS. Es- Genetics (MIGen) Consortium; Geisinger- 65. timation of the concentration of low-density Regeneron DiscovEHR Collaboration; VA 46 Chakraborty M, Lou C, Huan C, Kuo MS, lipoprotein cholesterol in plasma, without use Million Veteran Program. Genetics of blood Park TS, Cao G, et al. Myeloid cell-specific of the preparative ultracentrifuge. Clin Chem. lipids among ∼300,000 multi-ethnic partici- serine palmitoyltransferase subunit 2 haplo- 1972 Jun;18(6):499–502. pants of the Million Veteran Program. Nat insufficiency reduces murine atherosclerosis. 23 Laurell CB. Quantitative estimation of pro- Genet. 2018 Nov;50(11):1514–23. J Clin Invest. 2013 Apr;123(4):1784–97. teins by electrophoresis in agarose gel con- 36 Spracklen CN, Chen P, Kim YJ, Wang X, Cai 47 Li Z, Li Y, Chakraborty M, Fan Y, Bui HH, taining antibodies. Anal Biochem. 1966 Apr; H, Li S, et al. Association analyses of East Peake DA, et al. Liver-specific deficiency of 15(1):45–52. Asian individuals and trans-ancestry analyses serine palmitoyltransferase subunit 2 de- 24 Blazejczyk MM, Nadon R. FlexArray: A statis- with European individuals reveal new loci as- creases plasma sphingomyelin and increases tical data analysis software for gene expres- sociated with cholesterol and triglyceride lev- apolipoprotein E levels. J Biol Chem. 2009 sion microarrays. Montreal, Canada: Ge- els. Hum Mol Genet. 2017 May; 26(9): 1770– Sep;284(39):27010–9. nome Quebec; 2007. 84. 48 Willer CJ, Sanna S, Jackson AU, Scuteri A, 25 Price ME, Cotton AM, Lam LL, Farré P, Em- 37 de Toro-Martin J, Guenard F, Rudkowska I, Bonnycastle LL, Clarke R, et al. Newly identi- berly E, Brown CJ, et al. Additional annota- Lemieux S, Couture P, Vohl MC. A common fied loci that influence lipid concentrations tion enhances potential for biologically-rele- variant in ARHGEF10 alters delta-6 desatu- and risk of coronary artery disease. Nat Genet. vant analysis of the Illumina Infinium Hu- rase activity and influence susceptibility to 2008 Feb;40(2):161–9. manMethylation450 BeadChip array. hypertriglyceridemia. J Clin Lipidol. 2018; 49 Varbo A, Benn M, Tybjærg-Hansen A, Epigenetics Chromatin. 2013 Mar;6(1):4. 12(2):311-20.e3. Grande P, Nordestgaard BG. TRIB1 and 26 Team RC. A language and environment for 38 Li H, Yu S, Wang R, Sun Z, Zhou X, Zheng L, GCKR polymorphisms, lipid levels, and risk statistical computing. Vienna, Austria: R et al. ARHGEF10 gene polymorphism is of ischemic heart disease in the general popu- Foundation for Statistical Computing; 2013. closely associated with the risk of ischemic lation. Arterioscler Thromb Vasc Biol. 2011 27 Tremblay BL, Guénard F, Lamarche B, stroke in Northern Han Chinese population. Feb;31(2):451–7. Pérusse L, Vohl MC. Weighted gene co-ex- Neurol Res. 2017 Feb;39(2):158–64. 50 Gruber M, Chappell R, Millen A, LaRowe T, pression network analysis to explain the rela- 39 Song Y, Shan S, Zhang Y, Liu W, Ding W, Ren Moeller SM, Iannaccone A, et al. Correlates of tionship between plasma total carotenoids W, et al. Ligand-dependent corepressor acts serum lutein + zeaxanthin: findings from the and lipid profile. Genes Nutr. 2019 May; as a novel corepressor of thyroid hormone re- Third National Health and Nutrition Exami- 14(1):16. ceptor and represses hepatic lipogenesis in nation Survey. J Nutr. 2004 Sep;134(9):2387– 28 Tremblay BL, Guénard F, Lamarche B, mice. J Hepatol. 2012 Jan;56(1):248–54. 94. Pérusse L, Vohl MC. Network Analysis of the 40 Asselbergs FW, Pai JK, Rexrode KM, Hunter 51 Al-Delaimy WK, van Kappel AL, Ferrari P, Potential Role of DNA Methylation in the Re- DJ, Rimm EB. Effects of lymphotoxin-alpha Slimani N, Steghens JP, Bingham S, et al. Plas- lationship between Plasma Carotenoids and gene and galectin-2 gene polymorphisms on ma levels of six carotenoids in nine European Lipid Profile. Nutrients. 2019 Jun;11(6):1265. inflammatory biomarkers, cellular adhesion countries: report from the European Prospec- 29 Langfelder P, Horvath S. Fast R Functions for molecules and risk of coronary heart disease. tive Investigation into Cancer and Nutrition Robust Correlations and Hierarchical Clus- Clin Sci (Lond). 2007 Mar;112(5):291–8. (EPIC). Public Health Nutr. 2004 Sep; 7(6): tering. J Stat Softw. 2012 Mar;46(11):i11. 713–22. Multi-Omics Data in the Link between Lifestyle Genomics 2020;13:11–19 19 Carotenoids and Lipids DOI: 10.1159/000503828
You can also read