Genetic Structure in Populations of Euterpe precatoria Mart. in the Brazilian Amazon
←
→
Page content transcription
If your browser does not render page correctly, please read the page content below
ORIGINAL RESEARCH
                                                                                                                                          published: 11 January 2021
                                                                                                                                      doi: 10.3389/fevo.2020.603448

                                            Genetic Structure in Populations of
                                            Euterpe precatoria Mart. in the
                                            Brazilian Amazon
                                            Santiago Linorio Ferreyra Ramos 1 , Gabriel Dequigiovanni 2 ,
                                            Maria Teresa Gomes Lopes 3* , Ananda Virginia de Aguiar 4 , Ricardo Lopes 5 ,
                                            Elizabeth Ann Veasey 6 , Jeferson Luis Vasconcelos de Macêdo 5 ,
                                            Alessandro Alves-Pereira 7 , Therezinha de Jesus Pinto Fraxe 1 , Marcos Silveira Wrege 4
                                            and José Nivaldo Garcia 8
                                            1
                                             Universidade Federal do Amazonas, Manaus, Brazil, 2 Centro Universitário UNIVEL, Avenida Tito Muffato, Cascavel, Brazil,
                                            3
                                             Faculdade de Ciências Agrícolas, Universidade Federal do Amazonas, Manaus, Brazil, 4 Embrapa Florestas, Colombo,
                                            Brazil, 5 Embrapa Amazônia Ocidental, Manaus, Brazil, 6 Luiz de Queiroz College of Agriculture, University of São Paulo,
                                            Piracicaba, Brazil, 7 Departamento de Biologia Vegetal, Instituto de Biologia, Universidade Estadual de Campinas
                                            (UNICAMP), Campinas, Brazil, 8 Escola Superior de Agricultura Luiz de Queiroz/Universidade de São Paulo (ESALQ/USP),
                                            Departamento de Ciências Florestais, Piracicaba, Brazil

                                            Euterpe precatoria is a palm tree belonging to the Arecaceae family, occurring in Western
                                            and Central Brazilian Amazonia. Its fruit, which is very appreciated in the Amazon
                                            region, produces pulp that is consumed in fresh form. Its production is carried out
                                            almost exclusively by extractive farmers. In order to establish adequate strategies to
                         Edited by:         sustain this genetic resource, we need knowledge about the diversity and genetic
                    Lawrence Hurd,
                                            structure in natural populations. This study aimed to evaluate the influence of geographic
       Washington and Lee University,
                       United States        distance on genetic structure in the main extractive populations of E. precatoria in the
                       Reviewed by:         Brazilian Amazon. Leaves from 377 plants were collected in 19 populations located in
                      Christina Vinson,     16 municipalities in the State of Amazonas and three in the State of Rondônia. Twelve
           University of Brasilia, Brazil
         Evandro Vagner Tambarussi,         microsatellite loci were used to genotype the plants. The diversity and genetic structure
  State University of Midwest Paraná,       among populations were estimated. The average number of alleles per locus was
                                   Brazil
                                            5.97. The observed heterozygosity means (HO ) were higher than expected (HE ) at the
                  *Correspondence:
                                            population level (HO = 0.72, HE = 0.66) and fixation index (f = -0.100) was negative. The
           Maria Teresa Gomes Lopes
              mtglopes@hotmail.com          FST value (0.1820) and the AMOVA results (8 = 0.1796) showed population structure.
                                            The populations were clustered into three groups (K = 3) in the Bayesian analysis. The
                   Specialty section:
         This article was submitted to
                                            Discriminant Analysis of Principal Components (DAPC) confirmed eight clusters, with
    Biogeography and Macroecology,          the populations close to those identified by the Bayesian analysis. The geographic
                a section of the journal    differentiation was confirmed by the groupings obtained in the Structure analysis
    Frontiers in Ecology and Evolution
                                            and the DACP function. Information related to phenotypic, genetic and environmental
      Received: 06 September 2020
      Accepted: 10 December 2020            characterization of populations is important to guide conservation and management
        Published: 11 January 2021          strategies and the formulation of public species management policies in Amazonia.
                              Citation:
                                            Keywords: Amazon, Arecaceae, microsatellites, açaí-do-Amazonas, genetic diversity, genetic structure
        Ramos SLF, Dequigiovanni G,
     Lopes MTG, Aguiar AV, Lopes R,
              Veasey EA, Macêdo JLV,
Alves-Pereira A, Fraxe TJP, Wrege MS
                                            INTRODUCTION
        and Garcia JN (2021) Genetic
   Structure in Populations of Euterpe
                                            Palm trees compose a group of plants of particular economic importance, especially in rural
       precatoria Mart. in the Brazilian    communities in tropical forests. More specifically, extractives provide building materials, fabrics,
 Amazon. Front. Ecol. Evol. 8:603448.       fuels, food, ornamental plants and medicines (Sosnowska and Balslev, 2009). These present greater
      doi: 10.3389/fevo.2020.603448         abundance in regions closer to the Equator (Eiserhardt et al., 2011), but they are also found in

Frontiers in Ecology and Evolution | www.frontiersin.org                          1                                          January 2021 | Volume 8 | Article 603448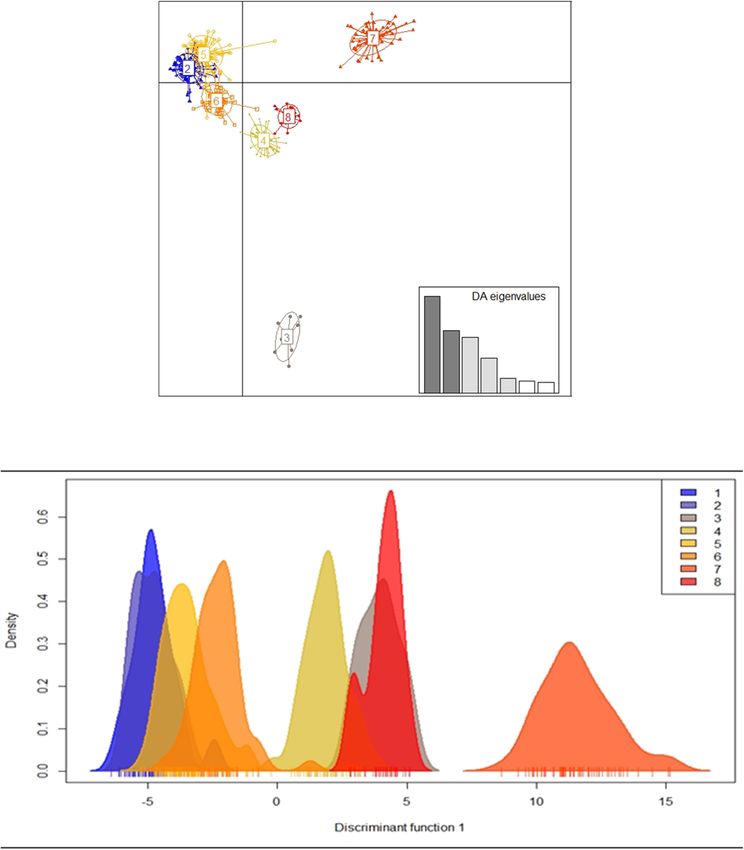
Ramos et al.                                                                                              Genetic Structure Euterpe precatoria Amazon

other tropical and subtropical regions, with spatial patterns               Such programs will also result in genotypes with more diverse
according to geographic variation. The Arecaceae family has                 characteristics for farmers, such as higher fruit production per
more than 2,400 species grouped within the subfamilies                      plant, less harvesting of individuals, and early production. No
Arecoideae, Calamoideae, Ceroxyloideae, Coryphoideae, and                   such ex situ conservation and genetic improvement programs
Nypoideae (Dransfield et al., 2005; Govaerts and Dransfield,                are currently in practice in Brazil for E. precatoria. The current
2005). In the Brazilian Amazon, the subfamily Arecoideae,                   conservation strategy adopted is in situ, and it occurs empirically
tribe Euterpeae (Dransfield et al., 2005), has two palm trees               in an agroforestry production system (Noda, 2012), or within
of significant economic and social importance, Euterpe oleracea             secondary forests.
Mart. and Euterpe precatoria Mart (Kahn, 1991). The fruit of                   E. precatoria is known locally as açaí-do-Amazonas, açaí-
these species are exploited mainly by extractive agriculture. The           solitary, or açaí-de-terra-firma (Bovi and Castro, 1993) by
production by extractivist farmers, of these two species, has               its unique characteristics (FAO – Food and Agriculture
allowed the Amazon region to be the largest producer of açaí in             Organization of the United Nations, 1987; Kang et al., 2012).
the national and international markets.                                     Its occurrence is limited to the western and central Brazilian
    The açaí fruit is obtained from E. oleracea in Pará, Maranhão           Amazon, but the species also occurs in the Amazonian borders
and Amapá states, while in the states of Amazonas, Acre and                 of Peru, Brazil, Colombia (Kahn, 1991), and Bolivia (FAO –
Rondônia it is extracted from E. precatoria. Between the years              Food and Agriculture Organization of the United Nations, 1987;
1986 and 2010, the production of commercialized açaí fruit                  Bussmann and Zambrana, 2012). In addition to its use in the
averaged 117,063.59 tons per year. This average production                  production of açaí, which has antioxidant and anti-inflammatory
increased by 80.3% (211,100.63 tons) from 2011 to 2018. The                 properties superior to those of E. oleracea (Kang et al., 2012), the
state of Pará remains the largest producer of açaí fruit (58.4%),           species is also used in the construction of houses. Its roots are
followed by the states of Amazonas (31.0%) and Maranhão                     the source of medicinal preparations to treat malaria, hepatitis
(7.1%) (Instituto Brasileiro de Geografia e Estatística – IBGE,             and other diseases (Bussmann and Zambrana, 2012). Another
2019). In the state of Amazonas, the fruit production increased             important characteristic is its evolutionary adaptation. Plants of
more than 6,317.7%, from an average production of 1,013.17–                 this species grow in the forest (sub-canopy) in environments with
65,021.8 tons per year in the last 8 years, by extractive                   both favorable and unfavorable soils, frequently forming small
exploitation from E. precatoria. This highly significant increase           groups of plants, between 10 and 20 individuals (FAO – Food
in production in recent years could be affecting the genetic                and Agriculture Organization of the United Nations, 1987), or
variability of these species, leading to important impacts on               among 50–250 plants/ha (Kahn, 1988). It also occurs in lower
the structure and genetic composition of populations due to                 densities, around 2–3 trees.ha−1 (FAO – Food and Agriculture
anthropic interference. This calls for the development of public            Organization of the United Nations, 1987), in places with rainfall
policies that can contribute to more sustainable management and             in the range of 1,900–4,000 mm per year and average annual
development models for palm species to meet current demands                 temperatures of 26◦ C (FAO – Food and Agriculture Organization
without compromising the ability to serve future generations                of the United Nations, 1987). A study carried out on samples
(García-Fernández et al., 2008).                                            distributed throughout the Amazon, shows that E. precatoria
    We asked if current extraction of E. precatoria fruits                  is a common species and with Hyperdominant Patterns, in
would create a problem in the future for obtaining successful               the Amazon Forest Types, with a maximum abundance of
regenerants to replace the current parents. The sustainability of           168/ha and an average presence of 32.7% in all sampled areas
a fruit production system, for example E. precatoria, depends not           (Steege et al., 2013). It is also of secondary successional class
only on the intensity of the fruit harvest, but also on other aspects       (Condé and Tonini, 2013).
of the process, such as the period of abundance and distribution               Euterpe precatoria is a highly promising species; therefore,
of the resource, the strategy of growth and regeneration of the             efforts are needed to establish strategies for domestication,
species, as well as other management practices associated with the          conservation, and management of its natural populations with
harvest (Vallejo et al., 2014). Lack of natural regeneration of E.          the support of riverside communities and farmers in the state
precatoria has already been identified in communities in Bolivia            of Amazonas in Brazil. This calls for research in the areas of
where palm heart production and exploitation were carried out               management and conservation (in situ, ex situ, or on farm) in the
in an extractive manner by cutting of the plant (Mostacedo                  short term to meet the high product demand, as well as stimulate
and Fredericksen, 1999). Plant cutting is a standard practice in            the implementation of areas of monoculture of the species
the economic exploitation of palm trees, as it is fast and easy             with more quality genetics. Accordingly, it will be necessary
(Bernal et al., 2011), but it is not a method that comports with            to monitor the diversity and genetic structure of natural E.
conservation. Therefore, we need a better model for exploiting              precatoria populations, especially those exploited in an extractive
palm products, such as fruits, seeds, and other parts of the plant.         manner, to conserve this species based on managing genetic
    The success of natural regeneration will help guarantee the             viability for the long term, but without affecting the mechanisms
sustainability of managed forests in the long term (Mostacedo               of pollen and seed dispersal, or the spatial distribution of
and Fredericksen, 1999). At the same time, ex situ conservation             individuals and effective population size (Novello et al., 2018).
programs based on the establishment of active germplasm                        Therefore, we aimed to evaluate the patterns of diversity and
banks and E. precatoria genetic improvement programs are                    genetic structure of the Amazonian E. precatoria palm tree in the
recommended to guarantee the long-term use of the species.                  main areas of its extractive production. It is expected that our

Frontiers in Ecology and Evolution | www.frontiersin.org                2                                     January 2021 | Volume 8 | Article 603448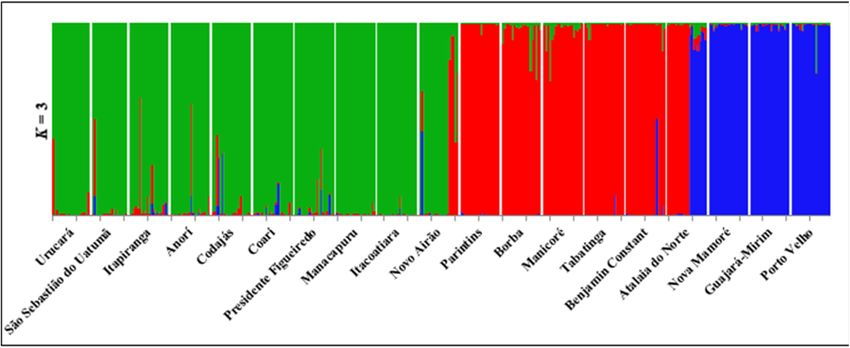
Ramos et al. Genetic Structure Euterpe precatoria Amazon
results will become the basis for programs highlighting rational (Lewis and Zaykin, 2002), and the tests LD and Nm_private
management and genetic conservation to foster continued function of the genepop package (Rousset, 2008) on the R
economic sustainability. platform (R Core Team, 2019). HWE and LD were performed
by Fisher’s exact test with 20,000 permutations. The significance
level (P ≥ 0.05) of HWE and LD was adjusted with Bonferroni’s
MATERIALS AND METHODS correction (Rice, 1989). The number of null alleles was calculated
using the null function of the genepop package (Rousset, 2008).
Material For analysis of the genetic structure, Wright’s F statistics
This study was carried out in the Amazon rainforest in two of the were used (Wright, 1951), including FIT (total inbreeding levels
main producing states of E. precatoria. The plant material (leaves) in individuals of all populations), FIS (fixation index within
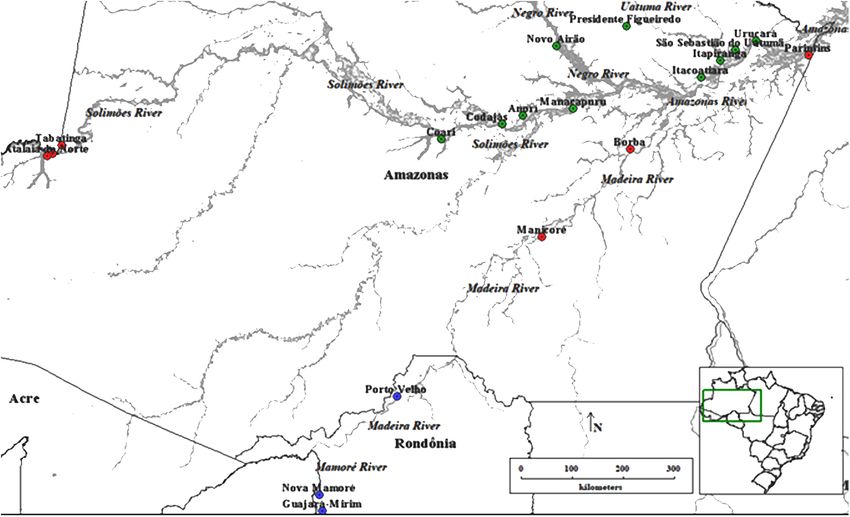
of E. precatoria was collected in 19 municipalities (Figure 1), 16 subpopulations owing to the reproductive system), and FST
in the state of Amazonas and three in the state of Rondônia. (genetic differentiation owing to subdivision), and calculations
The municipalities are located on the margins of different were performed using the algorithms of Weir and Cockerham
hydrographic basins, which, for the most part, serve as the only (1984). An FST matrix was estimated from the general fixation
route of river transport of people, food, and genetic material to index and in pairs of populations (Weir and Cockerham,
other areas of the Amazon, mainly the capitals of these states. 1984). The Wright F-statistics (1951) and the FST matrix were
These municipalities are all within the geographic distribution calculated and evaluated with significance (P ≤ 0.05) from 20,000
of the species (Lorenzi, 2010) and present a substantial record bootstrapping, using the diffCalc function of the diveRsity package
of açaí in the aggregated data of the Brazilian Institute of (Keenan et al., 2013).
Geography and Statistics (Instituto Brasileiro de Geografia e To verify the degree of genetic variation according to
Estatística – IBGE, 2019). Each sampled collection site was hierarchical levels among and within populations and among
called a population. Samples ranging from 17 to 20 plants were all individuals sampled, molecular variance analysis (AMOVA)
collected in each of the 19 populations, totaling 377 samples was performed, followed by estimating the extent of genetic
(Supplementary Table 1). The collection was carried out within differentiation with phi-statistics, both using the poppr.amova
the rules of SisGen (National System for the Management of function in the poppr package (Kamvar et al., 2014). The
Genetic Heritage and Associated Traditional Knowledge, Decree significance of the components of variance through the
no 8.772, of May 11, 2016, which regulates Law no 13.123, of May Monte-Carlo test, 8CP, differentiation among populations,
20, 2015, registration AA9537B). 8CAP, differentiation among samples within populations, 8CA,
and differentiation among samples were evaluated using a
DNA Extraction and Genotyping permutation test implemented in the randtest function in the
DNA extraction was performed using the CTAB protocol, as ape4 package (Chessel et al., 2004; Dray and Dufour, 2007; Dray
described by Doyle and Doyle (1990), and quantified with et al., 2007; Bougeard and Dray, 2018) with 9,999 permutations.
GelRed dye. Subsequently, the genomic DNA was standardized In order to determine the correlation coefficient among
at 10 ng/µl for use in amplification. The 377 DNA samples the FST geographic and genetic distance matrices (Weir and
were amplified by polymerase chain reaction (PCR), using 12 Cockerham, 1984), the Mantel test (Mantel, 1967; Smouse et al.,
microsatellite loci developed for E. precatoria (Epr01, Epr02, 1986) was performed with 999 replicates, using the mantel. rtest
Epr05, Epr13, Epr14, Epr15, Epr18, Epr19, Epr21, Epr31, Epr32, function of the ade4 package (Chessel et al., 2004; Dray and
and Epr36) (Ramos et al., 2016). The amplification products were Dufour, 2007; Dray et al., 2007; Bougeard and Dray, 2018). The
quantified with GelRed dye. The amplified PCR products were geographic distance matrix was calculated using the DIVA-GIS
subjected to an automatic DNA analyzer by ABI 3130XL capillary v7.5 program (DIVA-GIS, 2012).
electrophoresis in the Genetic Analyzer (Applied Biosystems). Within the analysis of genetic structure, two Bayesian analysis
GeneScanTM -500 ROX standard size (Life Technologies do
R
techniques were performed to determine the number of clusters
Brasil Ltda.) was used to determine the size of the alleles. within the set of evaluated samples. In the first analysis, Structure
The amplified fragments were observed and analyzed with software (Pritchard et al., 2000) from the Admixture model was
GeneMapper v4.0 software (Applied Biosystems). used. This is normally applied to real or natural populations. The
number of clusters (K) was defined from 1 to 21, and for each K,
Statistical Analysis 10 iterations were performed with a Burn-in of 5,00,000 followed
The genetic diversity, compared among the populations collected by 10,00,000 Markov Chain Monte Carlo (MCMC) iterations.
in the states of Amazonas and Rondônia, was obtained using The number of clusters was estimated using the Evanno 1K
the following genetic parameters: total number of alleles (AT ), method, indicating that the most likely K is where the change
average number of alleles/locus (A), observed heterozygosity is greatest in the second order rate of change in Pr (X| K)
(HO ) and expected heterozygosity (HE ), fixation index (f ), and among successive K values (Evanno et al., 2005). With the K
Hardy-Weinberg equilibrium (HWE). These parameters were value selected, a consensus was reached on the iterations carried
calculated using the divBasic function of the diveRsity package out in this cluster through CLUMPP v.1.1.2 (Cluster Matching
(Keenan et al., 2013) on the R platform (R Core Team, 2019). program and Permutation Program) (Jakobsson and Rosenberg,
The linkage disequilibrium (LD) and the number of 2007) and with Distruct v. 1.1 (Rosenberg, 2004), a graphical
private alleles (Ap) were calculated using the softwares GDA visualization of the population structure was performed. In the
Frontiers in Ecology and Evolution | www.frontiersin.org 3 January 2021 | Volume 8 | Article 603448Ramos et al. Genetic Structure Euterpe precatoria Amazon
FIGURE 1 | Collection of Euterpe precatoria vegetal materials in the areas of açaí-do-Amazonas extraction by traditional extractivist farmers in the states of
Amazonas and Rondônia. Using the Structure software (Circle), three main groups formed by the 19 populations of E. precatoria according to the three main river
basins, using the structure. Through the Discriminant Principal Component Analysis—DACP (square) eight groups formed by the proximity of the collection sites.
second analysis of the population genetic structure, Discriminant The fixation index (f ) showed values below zero, which shows
Principal Component Analysis (DACP) was used (Jombart et al., an excess of heterozygotes, although the Epr02 (f = 0.084) and
2010), considering the clusters as unknown (Roullier et al., 2013). Epr14 (f = 0.100) loci showed a small degree of inbreeding for the
First, the probability of adherence of each sample to the different evaluated populations. However, the negative value found for the
groups was determined, using k-means (Jombart et al., 2010). average (f = –0.108) shows the absence of inbreeding and excess
Then, the possible ideal number of clusters was identified, using heterozygotes for all populations and loci.
k-means, comparing and discriminating possible groupings using The 19 natural populations of E. precatoria showed high levels
Bayesian Information Criterion (BIC) (Jombart et al., 2010), of genetic diversity. An average of 5.97 alleles per locus, ranging
using 10,00,000 permutations within the find.structure and dapc from 4.08 in Parintins to 7.92 for Guajará Mirim and Porto Velho
functions of the adegenet package 2.1.0 (Jombart and Ahmed, populations (Table 1). High values were observed for HO and
2011) on the R platform (R Core Team, 2019). HE for all populations, with HO showing values equal to, or
slightly higher than HE in 18 populations, with a single exception
for the population of Atalaia do Norte, AM. The mean HO of
RESULTS all populations (0.72) was also higher than the HE (0.66). The
average of f values per locus was below zero (f = –0.100), showing
Genetic Diversity Indices an excess of heterozygotes (Table 1). The allelic richness was 5.13.
From the 12 loci analyzed, 11 were in Hardy-Weinberg The analyzes also showed a total of 37 private alleles observed
equilibrium (P > 0.00417) (Supplementary Table 2), and the in 16 populations, for all evaluated loci, except for the Epr36
analysis of loci pairs showed 15.7% with linkage disequilibrium. locus (Supplementary Table 2), indicating a mean frequency of
The 12 highly polymorphic loci had a high content of genetic private alleles of 0.0986. Most of the studied loci showed linkage
information, with a total of 211 alleles, ranging from 8 (Epr15) equilibrium, with percentages of LD that varied between zero
to 27 (Epr22) alleles per locus, with an average of 17.6 alleles percentage for the Borba population to 51.5% for the Atalaia
per locus. The expected heterozygosity (HE ) varied between 0.53 do Norte population (Supplementary Table 2). Possible null
for Epr32 and 0.77 for Epr01 loci. The observed heterozygosities alleles were detected for all microsatellite loci used. However,
(HO ) showed higher values than HE , with an exception for Epr02 the frequency of these possible null alleles was found for some
(0.73) and Epr14 (0.66) loci. HO ranged between 0.56 for Epr32 populations with frequencies less than 0.20. Null alleles with
locus and 0.86 for Epr13 and Eper05 loci. The average of all a frequency of less than 0.20 do not compromise population
loci for HO was 0.72, higher than the average for HE (0.66). assessments (Dakin and Avise, 2004). Loci Epr22, Epr13, Epr14,
Frontiers in Ecology and Evolution | www.frontiersin.org 4 January 2021 | Volume 8 | Article 603448Ramos et al. Genetic Structure Euterpe precatoria Amazon
and Epr19 presented higher frequencies in a single population. was observed among the sampled populations of Parintins and
These alleles were maintained in the current study, for keeping Itacoariara (39.57%) and the smallest among the populations
their frequencies below 0.20. of Anorí and Codajás (1.68%), the latter showing no statistical
difference (p < 0.05) (Table 3).
Genetic Structure The AMOVA results confirm the existence of genetic structure
Estimates of Wright’s F (Wright, 1951) in the 19 populations of in the set of populations evaluated. Significant differences were
E. precatoria sampled suggest that diversity is more concentrated observed among populations (18%; p = 0.004); however, most of
within populations than among populations; however, high the genetic variation occurred among the individuals evaluated
levels of genetic differentiation are indicated by an FST of (87.8%; p = 0.004) (Table 4). The significance of the components
0.1820 (Wright, 1978). The estimates of FIT (0.1215) and FIS of variance of differentiation among populations (8CP = 0.1796),
(-0.0740) were lower compared to FST (Table 2). The FST and among samples within populations (8CAP = -0.0697) and
FIT fixation indexes were outside the upper and lower limits among samples (8CA = 0.1224) is compatible with the results
of the bootstrappping, which indicates that the estimates are identified in statistical estimates of Wright’s F(1, 951), such as
significantly different from zero. However, the FIS was not FST , FIS , and FIT , respectively. Under this scenario, the Mantel
significant because it is lower than zero, indicating that the test, using the genetic matrices of FST and geographical distances
frequency of homozygotes is less than expected under EHW, of the populations, showed positive and significant correlations
showing an absence of inbreeding crosses (Table 2). In the FST (r = 0.4044, p = 0.001), proving the existence of isolation by
estimates pair by pair (Table 3), most of the sampled populations distance among the populations evaluated.
showed significant differences. The largest statistical difference The estimate of the number of genetically homogeneous
populations (K) among all individuals sampled in the 19
populations, as performed by the Structure software, showed the
TABLE 1 | Genetic diversity indices for 19 natural populations of E. precatoria occurrence of three clusters (K = 3) (Figure 1). The classification
analyzed with 12 microsatellite loci in the states of Amazonas and Rondônia. of populations into three groups (K = 3) shows consistency in
relation to geographical distance (Figure 3). The groups formed,
Populations n AT A HO HE f
considering K = 3, were as follows: group I covers the populations
Parintins 19.92 49 4.08 0.52 0.50 −0.044 of the geographical basins of the Solimões, Negro, Uatumã and
Urucara 19.92 55 4.58 0.69 0.58 −0.182 Amazonas Rivers (Ucurará, São Sebastião do Uatumã, Itapiranga,
São Sebastião do Uatumã 17.00 63 5.25 0.74 0.61 −0.200 Anorí, Codajas, Coari, Presidente Figueiredo, Manacapuru,
Itapiranga 19.83 78 6.50 0.75 0.70 −0.062 Itacoatiara, Novo Airão); group II is composed of the populations
Anorí 19.92 77 6.42 0.72 0.67 −0.079 of the Solimões, Madeira and Amazonas Rivers (Parintins, Borba,
Codajas 19.83 81 6.75 0.80 0.67 −0.193 Manicoré, Tabatinga, Benjamin Constant, Atalaia do Norte),
Coari 19.92 64 5.33 0.75 0.64 −0.183 and group III is found in populations of the Mamoré and
Presidente Figueiredo 19.75 72 6.00 0.75 0.65 −0.161 Madeira Rivers (Nova Mamoré, Guajará Mirim and Porto Velho)
Manacapuru 19.83 71 5.92 0.72 0.67 −0.065 (Figures 1, 2).
Itacoatiara 19.75 52 4.33 0.65 0.57 −0.145 Using DACP analysis, population structure is formed by eight
Novo Airão 19.67 69 5.75 0.63 0.63 0.002 groups (Figure 3 and Table 5). The seven eigenvalues obtained
Borba 19.58 59 4.92 0.75 0.65 −0.152 in the Discriminant Analysis (32.5, 21.1, 18.8, 11.7, 4.9, 4.1, and
Manicore 19.92 69 5.75 0.68 0.60 −0.140 3.5%) explain 96.7% of the genetic variation among populations,
Tabatinga 19.67 64 5.33 0.70 0.63 −0.097 with the first three eigenvectors explaining a greater percentage
Benjamin constant 19.75 72 6.00 0.74 0.68 −0.094 of the variation (72.4%). The results obtained are different from
Atalaia do Norte 19.83 90 7.50 0.69 0.76 0.099 those verified by the Bayesian analysis carried out in the Structure
Nova Mamoré 20.00 87 7.25 0.82 0.74 −0.113 program. However, DACP groupings I, IV, V, VI, and VII are
Guajará Mirim 19.67 95 7.92 0.77 0.77 0.003 closely related to the hydrographic basins where the populations
Porto Velho 20.00 95 7.92 0.86 0.76 −0.140 were sampled (Table 5). In DACP group I, the populations
Average 19.67 71.68 5.97 0.72 0.66 −0.100 of Urucara and São Sebastiao do Uatumã are grouped within
n, Average number of individuals analyzed by loci; AT , total number of alleles the Uatumã River. In group IV, the populations of Tabatinga,
identified in the population; A, average number of alleles per locus; HO , observed Benjamin Constant and Atalaia do Norte are grouped at the
heterozygosity; HE , expected heterozygosity; f, fixation index. headwaters of the Solimões River. In group V, the populations
of Anori, Codajas, and Manacapuru are at the center and end
TABLE 2 | Results of Wright’s F-statistics estimates (Wright, 1951) obtained for 19 of the Solimões River basin. In group VI, Borba and Manicore
populations of Euterpe precatoria using 12 specific microsatellite loci.
are located on the Madeira River. In group VII, Nova Mamoré,
FIS FST FIT Guajará Mirim and Porto Velho are part of the Mamoré River
that originated the Madeira River.
All loci −0.0740 0.1820 0.1215
Superior (CI95% ) −0.0537 0.1915 0.1365 Discussion
Inferior (CI95% ) −0.0949 0.1730 0.1068
This is the first study to report on diversity and genetic structure
CI95%, 95% confidence interval through 20,000 bootstrapping. of the natural populations of E. precatoria. The results will
Frontiers in Ecology and Evolution | www.frontiersin.org 5 January 2021 | Volume 8 | Article 603448Frontiers in Ecology and Evolution | www.frontiersin.org
Ramos et al.
TABLE 3 | Pairwise comparisons of the FST among the 19 populations of E. precatoria collected in the states of Amazonas and Rondonia.
Populations 1 2 3 4 5 6 7 8 9 10 11 12 13 14 15 16 17 18
1 = Parintins
2 = Urucara 0.3044*
3 = São Sebastião do Uatumã 0.3066* 0.0677*
4 = Itapiranga 0.2418* 0.0555* 0.0552*
5 = Anorí 0.3121* 0.1158* 0.1084* 0.0912*
6 = Codajas 0.3104* 0.1137* 0.1153* 0.0940* 0.0168
7 = Coari 0.3392* 0.1554* 0.1056* 0.1322* 0.0451 0.0553*
8 = Presidente Figueiredo 0.3496* 0.1376* 0.1245* 0.1228* 0.0188 0.0503* 0.0479
9 = Manacapuru 0.3347* 0.1337* 0.1138* 0.0944* 0.0649* 0.0838* 0.0898* 0.0565*
6
10 = Itacoatiara 0.3957* 0.1833* 0.1820* 0.1539* 0.1826* 0.1826* 0.1928* 0.1826* 0.1530*
11 = Novo Airão 0.3539* 0.1664* 0.1453* 0.1426* 0.0919* 0.1190* 0.1222* 0.0913* 0.1077* 0.1396*
12 = Borba 0.2332* 0.1754* 0.1735* 0.1258* 0.1266* 0.1382* 0.1745* 0.1602* 0.1770* 0.2454* 0.1581*
13 = Manicore 0.3282* 0.1976* 0.1947* 0.1589* 0.1399* 0.1690* 0.1931* 0.1776* 0.1891* 0.2647* 0.1796* 0.0991*
14 = Tabatinga 0.2741* 0.2378* 0.2284* 0.1922* 0.2106* 0.2165* 0.2404* 0.2352* 0.2307* 0.2557* 0.1975* 0.1360* 0.1286*
15 = Benjamin Constant 0.2881* 0.2134* 0.2074* 0.1704* 0.1642* 0.1764* 0.1943* 0.1894* 0.1984* 0.2433* 0.1598* 0.1234* 0.1080* 0.0548*
16 = Atalaia do Norte 0.2596* 0.1753* 0.1671* 0.1382* 0.1335* 0.1496* 0.1726* 0.1580* 0.1676* 0.2066* 0.1338* 0.1137* 0.1259* 0.0845* 0.0680*
17 = Nova Mamoré 0.3293* 0.2316* 0.2105* 0.1860* 0.1991* 0.1919* 0.2017* 0.2088* 0.1947* 0.2358* 0.2070* 0.2339* 0.2334* 0.2220* 0.1984* 0.1540*
18 = Guajará Mirim 0.3097* 0.2549* 0.2278* 0.1902* 0.1982* 0.1976* 0.2045* 0.2110* 0.1997* 0.2467* 0.2119* 0.2213* 0.2406* 0.2183* 0.1953* 0.1538* 0.0328
19 = Porto Velho 0.3149* 0.2447* 0.2187* 0.1834* 0.1907* 0.1837* 0.1980* 0.2034* 0.1933* 0.2503* 0.2114* 0.2165* 0.2249* 0.2199* 0.1903* 0.1591* 0.0240 0.0174
Genetic Structure Euterpe precatoria Amazon
*FST pairwise significant comparisons, indicating difference among populations (P ≤ 0.05).
January 2021 | Volume 8 | Article 603448Ramos et al. Genetic Structure Euterpe precatoria Amazon TABLE 4 | Analysis of molecular variance (AMOVA) performed for 19 populations of E. precatoria collected in the states of Amazonas and Rondônia. Variation source Medium square Variance component Percentage of variation P-value 8 AMOVA—No individual levels (populations) Among populations 78.838 1.795 17.96 0.004 0.1796 Among samples within populations 7.625 −0.572 −5.72 1.000 −0.0697 Among samples 8.769 8.769 87.76 0.004 0.1224 Total 9.900 9.992 100.00 Variation source, Medium square, Variance component, Percentage of variation, P-value. p-value = 0.000 (Estimated based on 20,000 permutations). FIGURE 2 | Structure of individuals from 19 populations of E. precatoria when grouped toward the North, South and Center of Amazonas. help define domestication and in situ and ex situ conservation fixation of morphological and genetic characteristics carried out strategies, as well as the management of natural or planted by human selection (Pickersgill, 2007). Thus, the domestication populations for the benefit of traditional Amazonian farmers and process must be part of any proposals for genetic conservation future enterprises. The E. precatoria plants sampled in the 19 and management in order to contribute adequately to the process populations under study revealed high levels of genetic diversity, of evolution and adaptation throughout the region of occurrence mainly confirmed by the high content of genetic information of the species and the planting zones (Kalinowski, 2004). observed in each index analyzed. The results on genetic diversity Traditionally, genetic analyses in natural populations may not presented for this species are close to those of E. oleracea Mart. present equilibrium conditions when based on the assumption (Oliveira et al., 2010) and E. edulis (Novello et al., 2018). The of panmixia that is not always met (Oosterhout et al., 2006). We negative values for the fixation indices (f ) and the observed also observed a great geographical distance among many of the (HO ) and expected (HE ) heterozygosity coefficients indicate high studied populations, and different evolutionary events may have genetic diversity (Nazareno and Reis, 2014), as confirmed by taken place in each location, causing the absence of HWE for the excess of heterozygotes in the populations. The low f values some of the initiators of certain populations. and high HO also indicate that the result may be influenced The 19 populations of E. precatoria distributed in the Legal by the reproductive system of the species (Ramos et al., 2011) Amazon showed genetic differentiation when Wright’s F statistics which is allogamy (Ramos et al., 2018, 2019). Similar results were (Hartl and Clark, 2010) was analyzed, indicating the existence found in other palm species, such as Geonoma schottiana (Silva of a population genetic structure according to the FST values. et al., 2011), Phoenix dactylifera (Arabnezhad et al., 2012) and The results also confirm that a large part of the genetic Oenocarpus bataua (Ottewell et al., 2012), which could indicate variability observed for the set of populations sampled is mostly a behavior common to plants of the family Arecaceae. within populations, owing to the reproductive system (FIS ). The The high genetic diversity observed for the species is populations also showed significant differences when analyzed an important information for the domestication process of in pairs (FST ), also confirming the existence of genetic structure E. precatoria, even though the anthropic extraction may affect among the sampled populations (Wright, 1951). This result may the genetic diversity of the species in the future, in the be strongly influenced by the reproductive characteristics of the process of recruiting new plants, in the seedling bank. However, species, as well as the dispersion capacity of its genetic material, domestication generally begins with the exploration of wild the degree of isolation of the population, the self-incompatibility plants, proceeds with the cultivation of plants selected in nature, system and allelic diversity that it presents (Leducq et al., 2011; not genetically different from wild plants, and ends with the Ramos et al., 2018). Frontiers in Ecology and Evolution | www.frontiersin.org 7 January 2021 | Volume 8 | Article 603448
Ramos et al.                                                                                                             Genetic Structure Euterpe precatoria Amazon

  FIGURE 3 | Dispersion graph of clusters formed by the k-means method (A) and density graph of individuals according to clusters identified along the discriminant
  function obtained in the DAPC for the 19 populations of E. precatoria (B).

   The genetic structure observed also indicates that the sampled                     distance), confirming the population structure of the species. The
populations would be grouped according to the geographical                            positive and significant genetic correlation between geographical
distances within the hydrographic basins. Moreover, the                               distance (as a dispersion limiter) and genetic distance supports
occurrence of gene flow among populations is inversely                                this hypothesis and the dissimilarity in the composition of
proportional to the geographical distances among them. Isolation                      E. precatoria populations (Freeland et al., 2011; Kristiansen
by distance has been previously identified to occur among                             et al., 2012). Therefore, the allelic frequencies observed in
populations of E. oleracea (Freeland et al., 2011). Thus,                             the studied populations are related to geographic distances.
considering the geographical distance among populations of E.                         This geographic differentiation information is confirmed by
precatoria and the results of the comparisons of the FST analysis                     the groupings obtained in the analyses by the Structure
pair by pair, this result, hypothetically, shows that the gene flow                   program and the DACP function. The connectivity of the
that would be shared among these populations is proportional                          populations, according to the group they are in, is similar
to the geographical distances among them because individuals                          between both analyses (Figures 2, 3 and Table 5). For example,
are more likely to disperse to nearby locations (isolation by                         in the three municipalities of Nova Mamoré, Guajara Mirim

Frontiers in Ecology and Evolution | www.frontiersin.org                          8                                          January 2021 | Volume 8 | Article 603448
Ramos et al.                                                                                                               Genetic Structure Euterpe precatoria Amazon

TABLE 5 | Distribution of E. precatoria individuals among the groups formed by the Principal Component Discriminant Analysis (DACP) and Structure (K) based on 12
microsatellite loci.

Populations                                                                Cluster DACP                                                           Cluster K

                                      1            2          3           4             5           6             7           8            1           2            3

Parintins                              –           –           –           –             –           –            –           20           –          20            –
Urucara                              19#           –           –           –            1            –            –            –          20#          –            –
São Sebastião do Uatumã              16#           –           –           –             –          1             –            –          17#          –            –
Itapiranga                           19#           –           –           –             –          1             –            –          20#          –            –
Anorí                                 2            –           –           –            17*         1             –            –          20*          –            –
Codajas                               1            –           –           –            18*         1             –            –          20*          –            –
Coari                                  –           –           –           –            20*          –            –            –          20*          –            –
Presidente Figueiredo                  –           –           –           –            20           –            –            –          20           –            –
Manacapuru                            2            2           –           –            16*          –            –            –          20*          –            –
Itacoatiara                            –          20           –           –             –           –            –            –          20           –            –
Novo Airão                             –           8           –           –            6           6             –            –          20           –            –
Borba                                  –           –           –           –             –         20&            –            –           –          20&           –
Manicore                               –           –           –           –             –         20&            –            –           –          20&           –
Tabatinga                              –           –           –         18*             –          2             –            –           –          20*           –
Benjamin Constant                     1            –           –         18*             –          1             –            –           –          20*           –
Atalaia do Norte                       –           –          9          11*             –           –            –            –           –          20*           –
Nova Mamoré                            –           –           –           –             –           –          20&            –           –           –           20&
Guajará Mirim                          –           –           –           –             –           –          20&            –           –           –           20&
Porto Velho                            –           –           –           –            1            –          19&            –           –           –           20&
# Hydrographic   basin of the Uatumã river. & Hydrographic basins of the Madeira and Mamoré rivers. *Solimões river hydrographic basin.

and Porto Velho in the state of Rondonia, the same group                                nearest communities. Therefore, sampling of seeds or propagules
was observed.                                                                           to compose tests of origins and progenies and/or commercial
    The results also suggest that the populations of E. precatoria                      plantations, both for conservation and improvement, must
would have started the process of formation of subpopulations                           consider the three groups identified in the analysis of genetic
in different parts of the Amazon, which could be related to                             structure, as well as the estimated diversity among and within
the domestication process of E. precatoria, likely initiated by                         populations. This means that seed collections must be carried out
the Amerindians (Clement, 2001). This event may be closely                              across the three main hydrographic basins.
related to their behavior because the Amerindians had a                                    There is a concern about the intensification of fruit collection
traditional subsistence system with high species diversification                        by extractive exploitation which is driven by the market (Instituto
and building complex agroecosystems, including wood and                                 Brasileiro de Geografia e Estatística – IBGE, 2019) as it could
non-wood products (Caviglia-Harris and Sills, 2005). Secondary                          be having significant impacts on genetic erosion in the near
dispersion is also carried out by birds and monkeys and also by                         future, and, consequently, the reduction of fruit availability
man, transporting the fruit to consume, sell or plant in other                          for frugivorous vertebrates, as well as the reduction of gene
areas. This seed dispersal will determine the colonization of new                       flow among populations (Ramos et al., 2018). To address this,
sites and migration among neighboring populations, especially                           restrictions on fruit harvesting should be carried out, such
if it is zoochoric because the range of seed dispersion can be                          as avoiding fruit collection in years of low productivity and
substantially greater (Barluenga et al., 2011). However, the Acai-                      maintaining at least minus 50% of the fruits on mother palms
do-Amazonas, as well as the production of agricultural products                         for later consumption of fauna (Novello et al., 2018) and
already domesticated, incipiently domesticated, or collected in                         regeneration of new remnants.
the forests by farmers, is traded among these local populations,                           In the process of ecological and dynamic succession of the
and they mainly use river transport for this purpose. This                              forest with respect to the species E. precatoria, the plants of
is a dispersion vector that influences the movement of seeds,                           the populations may be showing high levels of genetic diversity
affording the plant with the capacity to persist, expand and                            at different ontogenetic ages (Ramos et al., 2018). The seeds
colonize new habitats (Liu et al., 2013). This was also observed in                     are expected to represent a mixture of half sibs and full sibs
the population of Presidente Figueiredo, which comes from fruits                        (Bittencourt and Sebbenn, 2007). However, it is important to
obtained by different government projects that were transported                         adopt a management plan that includes the destination of some
from Anori and Codajas.                                                                 E. precatoria fruits to the ecological community to maintain forest
    It is believed that the genetic structure of populations may                        dynamics. Studies aimed at characterizing populations based
be related to the dispersion of seeds carried out among the                             on morpho-agronomic characters related to fruit production,
extractive farmers themselves, who use river transport among the                        as well as plant resistance and adaptation, will be important to

Frontiers in Ecology and Evolution | www.frontiersin.org                            9                                          January 2021 | Volume 8 | Article 603448
Ramos et al. Genetic Structure Euterpe precatoria Amazon
identify the most productive individuals and progenies that can analysis of the data, and writing of the manuscript. EV, GD,
be used in different production systems, as well as enrich natural AA-P, and JG contributed to the laboratory work. JM contributed
populations with the species. Information related to phenotypic, to the sampling of the populations and contacts with farmers.
genetic and environmental characterization of populations is AA and TF collaborated with writing of the manuscript. MW
important to guide conservation and management strategies collaborated statistical analysis of the data. All authors read and
and the formulation of public species management policies in revised the manuscript.
Amazonian watersheds.
DATA AVAILABILITY STATEMENT ACKNOWLEDGMENTS
The datasets presented in this study can be found in online We thank CNPq, FAPESP, CAPES, and FAPEAM for their
repositories. The names of the repository/repositories and financial support.
accession number(s) can be found below: https://www.ncbi.nlm.
nih.gov/genbank/, KT198662−KT198684.
SUPPLEMENTARY MATERIAL
AUTHOR CONTRIBUTIONS
The Supplementary Material for this article can be found
SR, RL, and ML contributed to all stages, by planning the study online at: https://www.frontiersin.org/articles/10.3389/fevo.2020.
design, sampling the populations, laboratory analyses, statistical 603448/full#supplementary-material
REFERENCES Doyle, J. J., and Doyle, J. L. (1990). Isolation of plant DNA from fresh tissue. Focus
12, 13–15.
Arabnezhad, H., Bahar, M., Mohammadi, H. R., and Latifian, M. (2012). Dransfield, J., Uhl, N. W., Asmussen, C. B., Baker, W. J., Harley, M. M., and Lewis,
Development, characterization and use of microsatellite markers for germplasm C. E. (2005). A new phylogenetic classification of the palm family, Arecaceae.
analysis in date palm (Phoenix dactylifera L.). Sci. Hortic. 134, 150–156. doi: Kew Bull. 60, 559–569.
10.1016/j.scienta.2011.11.032 Dray, S., and Dufour, A. (2007). The ade4 Package: implementing the duality
Barluenga, M., Austerlitz, F., Elzinga, J. A., Teixeira, S., Goudet, J., and Bernasconi, diagram for ecologists. J. Stat. Softw. 22, 1–20. doi: 10.18637/jss.v022.i04
G. (2011). Fine-scale spatial genetic structure and gene dispersal in Silene Dray, S., Dufour, A., and Chessel, D. (2007). The ade4 package – II: two-table and
latifolia. Heredity 106, 13–24. doi: 10.1038/hdy.2010.38 K-table methods. R News 7, 47–52.
Bernal, R., Torres, C., García, N., Isaza, C., Navarro, J., Vallejo, M. I., et al. (2011). Eiserhardt, W. L., Svenning, J. C., Kissling, W. D., and Balslev, H. (2011).
Palm management in South America. Bot. Rev. 77, 607–646. doi: 10.1007/ Geographical ecology of the palms (Arecaceae): determinants of diversity and
s12229-011-9088-6 distributions across spatial scales. Ann. Bot. 108, 1391–1416. doi: 10.1093/aob/
Bittencourt, J. V. M., and Sebbenn, A. M. (2007). Patterns of pollen and seed mcr146
dispersal in a small, fragmented population of the wind pollinated tree Evanno, G., Regnaut, S., and Goudet, J. (2005). Detecting the number of clusters of
Araucaria angustifolia in southern Brazil. Heredity 99, 580–591. doi: 10.1038/ individuals using the software STRUCTURE: a simulation study. Mol. Ecol. 14,
sj.hdy.6801019 2611–2620. doi: 10.1111/j.1365-294x.2005.02553.x
Bougeard, S., and Dray, S. (2018). Supervised multiblock analysis in R with the ade4 FAO – Food and Agriculture Organization of the United Nations (1987). Especies
package. J. Stat. Softw. 86, 1–17. doi: 10.1007/978-1-4939-8850-1_1 Forestales Productoras de Frutas y Otros Alimentos, 3. Ejemplos de América
Bovi, M. L. A., and Castro, A. (1993). “Assaí (Euterpe oleracea, palmae),” in Selected Latina. Estudio FAO Montes 44/3. Roma: FAO, 265.
Species and Strategies to Enhance Income Generation from Amazonian Forests, Freeland, J. R., Kirk, H., and Petersen, S. (2011). Molecular Ecology, 2nd Edn.
eds J. W. Clay and C. R. Clement (Roma: Food and Agriculture Organization of Oxford: Wiley-Blackwell.
the United Nations), 58–67. García-Fernández, C., Ruiz-Perez, M., and Wunder, S. (2008). Is multiple-use forest
Bussmann, R. W., and Zambrana, N. Y. P. (2012). Facing global markets-usage management widely implementable in the tropics? Forest Ecol. Manag. 256,
changes in Western Amazonian plants: the example of Euterpe precatoria Mart. 1468–1476. doi: 10.1016/j.foreco.2008.04.029
and E. oleracea Mart. Acta Soc. Bot. Pol. 81, 257–261. doi: 10.5586/asbp.2012. Govaerts, R., and Dransfield, J. (2005). World Checklist of Palms. Kew: Royal
032 Botanic Gardens.
Caviglia-Harris, J. L., and Sills, E. O. (2005). Land use and income diversification: Hartl, D. L., and Clark, A. G. (2010). Princípios de Genética de Populações, 4th Edn.
comparing traditional and colonist populations in the Brazilian Amazon. Agric. Porto Alegre: Artmed.
Econ. 32, 221–237. doi: 10.1111/j.1574-0862.2005.00238.x Instituto Brasileiro de Geografia e Estatística – IBGE (2019). Sistema IBGE
Chessel, D., Dufour, A., and Thioulouse, J. (2004). The ade4 package – I: one-table de Recuperação Automática – SIDRA: Produção da Extração Vegetal e da
methods. R News 4, 5–10. Silvicultura, ano de 2017. Available online at: https://sidra.ibge.gov.br/tabela/
Clement, C. R. (2001). “Melhoramento de espécies nativas,” in Recursos Genéticos 289 (accessed October 29, 2019).
e Melhoramento – Plantas, eds L. L. Nass, A. C. C. Valois I, S. Melo, and M. C. Jakobsson, M., and Rosenberg, N. A. (2007). CLUMPP: a cluster matching and
Valadares-Inglis (Rondonópolis: Fundação de Apoio à Pesquisa Agropecuária permutation program for dealing with label switching and multimodality in
de Mato Grosso), 423–441. analysis of population structure. Bioinformatics 23, 1801–1806. doi: 10.1093/
Condé, T. M., and Tonini, H. (2013). Fitossociologia de uma Floresta Ombrófila bioinformatics/btm233
Densa na Amazônia Setentrional, Roraima, Brasil. Acta Amaz. 43, 247–260. Jombart, T., and Ahmed, I. (2011). Adegenet 1.3-1: new tools for the analysis
doi: 10.1590/s0044-59672013000300002 of genome-wide SNP data. Bioinformatics 27, 3070–3071. doi: 10.1093/
Dakin, E. E., and Avise, J. C. (2004). Microsatellite null alleles in parentage analysis. bioinformatics/btr521
Heredity 93, 504–509. doi: 10.1038/sj.hdy.6800545 Jombart, T., Devillard, S., and Balloux, F. (2010). Discriminant analysis of
DIVA-GIS (2012). User Manual, version 7.5. Available online at: http://www.diva- principal components: a new method for the analysis of genetically structured
gis.org/docs/DIVA-GIS_manual_7.pdf (accessed June 01, 2013). populations. BMC Genet. 11:94. doi: 10.1186/1471-2156-11-94
Frontiers in Ecology and Evolution | www.frontiersin.org 10 January 2021 | Volume 8 | Article 603448Ramos et al. Genetic Structure Euterpe precatoria Amazon Kahn, F. (1988). Ecology of economically important palms in Peruvian Amazonia. R Core Team (2019). R: A Language and Environment for Statistical Computing. R Adv. Econ. Bot. 6, 42–49. Foundation for Statistical Computing. Available online at: http://www.R-project. Kahn, F. (1991). Palms as key swamp forest resources in Amazonia. Forest Ecol. org/ (accessed December 20, 2019). Manag. 38, 133–142. doi: 10.1016/0378-1127(91)90139-m Ramos, S. L. F., Dequigiovanni, G., Lopes, M. T. G., Veasey, E. A., De Macedo, Kalinowski, S. T. (2004). Counting alleles with rarefaction: private alleles and J. L. V., Batista, J. S., et al. (2016). Microsatellite records for volume 8, issue 1: hierarchical sampling designs. Conserv. Genet. 5, 539–543. doi: 10.1023/b: microsatellite markers for Euterpe precatoria Mart. (Arecaceae) a palm species coge.0000041021.91777.1a used by extractive traditional farmers of Amazon. Conserv. Genet. Resour. 8, Kamvar, Z. N., Tabima, J. F., and Grünwald, N. J. (2014). Poppr: an R package 43–81. doi: 10.1007/s12686-016-0522-2 for genetic analysis of populations with clonal, partially clonal, and/or sexual Ramos, S. L. F., Dequigiovanni, G., Sebbenn, A. M., Lopes, M. T. G., Macêdo, reproduction. PeerJ. 2:e281. doi: 10.7717/peerj.281 J. L. V. D., Veasey, E. A., et al. (2018). Paternity analysis, pollen flow, and spatial Kang, J., Thakali, K. M., Xie, C., Kondo, M., Tong, Y., Ou, B., et al. (2012). genetic structure of a natural population of Euterpe precatoria in the Brazilian Bioactivities of açaí (Euterpe precatoria Mart.) fruit pulp, superior antioxidant Amazon. Ecol. Evol. 8, 11143–11157. doi: 10.1002/ece3.4582 and anti-inflammatory properties to Euterpe oleracea Mart. Food Chem. 133, Ramos, S. L. F., Lopes, M. T. G., Lopes, R., Cunha, R. N. V. D., Macêdo, J. L. V. D., 671–677. doi: 10.1016/j.foodchem.2012.01.048 Contim, L. A. S., et al. (2011). Determination of the mating system of Tucumã Keenan, K., McGinnity, P., Cross, T. F., Crozier, W. W., and Prodohl, P. A. palm using microsatellite markers. Crop Breed. Appl. Biot. 11, 181–185. doi: (2013). diveRsity: an R package for the estimation and exploration of population 10.1590/S1984-70332011000200011 genetics parameters and their associated errors. Methods Ecol. Evol. 4, 782–788. Ramos, S. L. F., Lopes, M. T. G., Lopes, R., Dequigiovanni, G., Macedo, J. L. V. D., doi: 10.1111/2041-210x.12067 Sebbenn, A. M., et al. (2019). Mating system analysis of Açaí-do-Amazonas Kristiansen, T., Svenning, J. C., Eiserhardt, W. L., Pedersen, D., Brix, H., (Euterpe precatoria Mart.) using molecular markers. Crop Breed. Appl. Biot. 19, Kristiansen, S. M., et al. (2012). Environment versus dispersal in the assembly 126–130. doi: 10.1590/1984-70332019v19n1n17 of western Amazonian palm communities. J. Biogeogr. 39, 1318–1332. doi: Rice, W. R. (1989). Analyzing tables of statistical test. Evolution 43, 223–225. 10.1111/j.1365-2699.2012.02689.x doi: 10.1111/j.1558-5646.1989.tb04220.x Leducq, J. B., Llaurens, V., Castric, V., Saumitou-Laprade, P., Hardy, O. J., and Rosenberg, N. A. (2004). Distruct: a program for the graphical display of Vekemans, X. (2011). Effect of balancing selection on spatial genetic structure population structure. Mol. Ecol. Notes 4, 137–138. doi: 10.1046/j.1471-8286. within populations: theoretical investigations on the self-incompatibility locus 2003.00566.x and empirical studies in Arabidopsis halleri. Heredity 106, 319–329. doi: 10. Roullier, C., Benoit, L., McKey, D. B., and Lebot, V. (2013). Historical collections 1038/hdy.2010.68 reveal patterns of diffusion of sweet potato in Oceania obscured by modern Lewis, P. O., and Zaykin, D. (2002). Genetic Data Analysis: Computer Programe for plant movements and recombination. Proc. Natl. Acad. Sci. U.S.A. 110, 2205– the Analyse of Allelic Data. Version 1.0.1. Available online at: https://phylogeny. 2210. doi: 10.1073/pnas.1211049110 uconn.edu/software/# (accessed November 21, 2020). Rousset, F. (2008). genepop’007: a complete re-implementation of the genepop Liu, B., Su, J., Chen, J., Cui, G., and Ma, J. (2013). Anthropogenic halo disturbances software for Windows and Linux. Mol. Ecol. Resour. 8, 103–106. doi: 10.1111/j. alter landscape and plant richness: a ripple effect. PLoS One 8:e56109. doi: 1471-8286.2007.01931.x 10.1371/journal.pone.0056109 Silva, M. S., Vieira, F. A., and Carvalho, D. (2011). Diversity and genetic structure Lorenzi, H. J. (2010). Flora Brasileira:’Arecaceae’(Palmeiras). Nova Odessa: in natural population of Geonoma schottian Mart (ARECACEAE): implications Instituto Plantarum. for conservation. Cerne 17, 195–201. doi: 10.1590/s0104-7760201100020 Mantel, N. (1967). The detection of disease clustering and a generalized regression 0006 approach. Cancer Res. 27, 209–220. Smouse, P. E., Long, J. C., and Sokal, R. R. (1986). Multiple regression and Mostacedo, B., and Fredericksen, T. S. (1999). Regeneration status of important correlation extensions of the Mantel test of matrix correspondence. Syst. Zool. tropical forest tree species in Bolivia: assessment and recommendations. Forest 35, 627–632. doi: 10.2307/2413122 Ecol. Manag. 124, 263–273. doi: 10.1016/s0378-1127(99)00076-6 Sosnowska, J., and Balslev, H. (2009). American palm ethnomedicine: a meta- Nazareno, A. G., and Reis, M. S. D. (2014). At risk of population decline? an analysis. J. Ethnobiol. Ethnomed. 5:43. ecological and genetic approach to the threatened palm species Butia eriospatha Steege, H. T., Pitman, N. C., Sabatier, D., Baraloto, C., Salomão, R. P., Guevara, (Arecaceae) of Southern Brazil. J. Hered. 105, 120–129. doi: 10.1093/jhered/ J. E., et al. (2013). Hyperdominance in the Amazonian tree Flora. Science est065 342:1243092. doi: 10.1126/science.1243092 Noda, H. (2012). “In situ breeding and conservation of Amazonian horticultural Vallejo, M. I., Galeano, G., Bernal, R., and Zuidema, P. A. (2014). The fate of species,” in Domestication and Breeding: Amazonian Species, eds A. Borém, populations of Euterpe oleracea harvested for palm heart in Colombia. Forest M. T. G. Lopes, C. R. Clement, and H. Noda (Viçosa: Universidade Federal de Ecol. Manag. 318, 274–284. Viçosa), 170–208. Weir, B. S., and Cockerham, C. C. (1984). Estimating F-stattistic for the analysis of Novello, M., Viana, J. P. G., Alves-Pereira, A., de Aguiar Silvestre, E., Nunes, H. F., population structure. Evolution 38, 1358–1370. Pinheiro, J. B., et al. (2018). Genetic conservation of a threatened Neotropical Wright, S. (1951). The genetical structure of populations. Ann. Eugen. 15, 323–354. palm through community-management of fruits in agroforests and second- Wright, S. (1978). Variability Within and Among Natural Populations, Vol. 4. growth forests. Forest Ecol. Manag. 407, 200–209. doi: 10.1016/j.foreco.2017.06. Chicago, IL: The University of Chicago Press. 059 Oliveira, M. S. P. D., Santos, J. B. D., Amorim, E. P., and Ferreira, Conflict of Interest: The authors declare that the research was conducted in the D. F. (2010). Variabilidade genética entre acessos de açaizeiro utilizando absence of any commercial or financial relationships that could be construed as a marcadores microssatélites. Cienc. Agrotec. 34, 1253–1260. doi: 10.1590/s1413- potential conflict of interest. 70542010000500025 Oosterhout, C. V., Weetman, D., and Hutchinson, W. F. (2006). Estimation and The reviewer, ET, declared a past co-authorship with several of the authors, GD, adjustment of microsatellite null alleles in nonequilibrium populations. Mol. AA, EV, and AA-P to the handling editor. Ecol. Notes 6, 255–256. doi: 10.1111/j.1471-8286.2005.01082.x Ottewell, K., Grey, E., Castillo, F., and Karubian, J. (2012). The pollen dispersal Copyright © 2021 Ramos, Dequigiovanni, Lopes, Aguiar, Lopes, Veasey, Macêdo, kernel and mating system of an insect-pollinated tropical palm, Oenocarpus Alves-Pereira, Fraxe, Wrege and Garcia. This is an open-access article distributed bataua. Heredity 109, 332–339. doi: 10.1038/hdy.2012.40 under the terms of the Creative Commons Attribution License (CC BY). The Pickersgill, B. (2007). Domestication of plants in the Americas: insights from use, distribution or reproduction in other forums is permitted, provided the Mendelian and molecular genetics. Ann. Bot. 100, 925–940. doi: 10.1093/aob/ original author(s) and the copyright owner(s) are credited and that the original mcm193 publication in this journal is cited, in accordance with accepted academic practice. Pritchard, J. K., Stephens, M., and Donnelly, P. J. (2000). Inference of population No use, distribution or reproduction is permitted which does not comply with structure using multilocus genotype data. Genetics 155, 945–959. these terms. Frontiers in Ecology and Evolution | www.frontiersin.org 11 January 2021 | Volume 8 | Article 603448
You can also read