Biomonitoring of Polycyclic Aromatic Hydrocarbons (PAHs) Using Lichens and Bromeliads
←
→
Page content transcription
If your browser does not render page correctly, please read the page content below
Australian Journal of Basic and Applied Sciences
                                                                                                                        2021 February; 15(2): pages 19-32
                                                                                                              https://doi.org/10.22587/ajbas.2021.15.2.3
    CASE STUDY                                                                                                                    AENSI PUBLICATIONS

Biomonitoring of Polycyclic Aromatic Hydrocarbons (PAHs)
Using Lichens and Bromeliads
Priscila Natasha Kinas1, Vander Kaufmann2*, Francisco Henrique de Oliveira3, Josué Raizer4
1
  University of the State of Santa Catarina. Department of Civil Engineering. Alto Vale do Estado Teaching Center, Rua Dr. Getulio Vargas, 2822, Bela Vista -
Ibirama, SC, Brazil, CEP: 89140-000 Brazil
2
  Environmental Engineering Program - Regional University of Blumenau - FURB - Rua São Paulo, 3.250, Itoupava Seca, Blumenau, Santa Catarina, Brazil, CEP
89030-000.
3
  Professor, PhD, Center for Humanities and Education, State University of Santa Catarina, Florianópolis, Santa Catarina, Brazil
4
  Federal University of Dourados, Faculty of Environmental and Biological Sciences. Rodovia Dourados km 12, Cidade Universitária / MS, Brazil, Caixa Postal 364,
CEP: 79825-070

Correspondence Author: Priscila Natasha Kinas - University of the State of Santa Catarina, Center for Teaching Upper Valley State, Dr. Getulio Vargas street,
2822, Bela Vista - Ibirama, SC, Brazil, Zip Code: 89140-000 Brazil, Tel: (55) 47 997705103 . E-mail address: prikinas@gmail.com / kinasdoc2017@gmail.com
ORCID : https://orcid.org/0000-0003-3338-2781

Received date: 12 December 2020, Accepted date: 28 February 2021

Cite as: P. N. Kinas., V. Kaufmann., F. H. de Oliveira., J. Raizer., 2021. Biomonitoring of Polycyclic Aromatic Hydrocarbons (PAHs) Using Lichens and Bromeliads.
Australian Journal of Basic and Applied Sciences, 15(2): 19-32. DOI: 10.22587/ajbas.2021.15.2.3.

    ABSTRACT

    In this study biomonitoring was used as a tool for assessing air quality in an industrial area in Pomerode, Santa Catarina State,
    southern Brazil, through the determination of polycyclic aromatic hydrocarbon (PAH) concentrations. The industrial area in
    Pomerode is of great relevance in this context since it hosts various types of industry: slaughterhouse, ceramic plant, cement
    plant, foundry, textile plant, mining activities and asphalt plant, among others. Part of the SC 418 highway runs through the
    industrial district of Pomerode. This study showed that it is possible to monitor the levels of the compounds of interest in the
    atmosphere by means of biomonitoring using lichens and bromeliads. The most significant amounts of PAHs found in this
    study are derived essentially from combustion processes which may be stationary sources, such as smokestacks, or mobile
    sources, such as vehicles. The concentration of PAHs found in the lichens represents an accumulation over time. The overall
    sum of the PAH concentrations (ΣPAH) found in the lichens was 6,264.6 ng kg-1, and at each site the sums of the PAH
    concentrations were: site 01 – 2,000.86 ng kg-1, site 02 – 256.93 ng kg-1, site 03 – 375.15 ng kg-1, site 04 – 411.77 ng kg-1 , site
    05 -1,632.30 ng kg-1, site 06 – 140.10 ng kg-1, site 07 – 1,064.,50 ng kg-1 e site 08 – 382.80 ng kg-1. The variation among the
    sites evaluated was 140.10 ng kg-1 to 2,000.86 ng kg-1.The overall ∑PAH for the bromeliads was 707.73 ng kg-1 and the
    following values were obtained for the sites: site 01 - 55.39 ng kg-1, site 02 - 67.21 ng kg-1, site 03 – 301.59 ng kg-1, site 04 -
    27.49 ng kg-1, site 05 - 62.57 ng kg-1, site 06 – 18.58 ng kg-1, site 07 - 134.00 ng kg-1 and site 08 – 36.09 ng kg-1. The ∑PAH
    varied from 18.58 ng kg-1 to 301.59 ng kg-1. However, all of the study sites were probably contaminated with PAHs originating
    from the industrial areas of Pomerode. The PAH values obtained in this study can be considered similar to those of remote
    regions of the globe, which characterizes low PAH contamination in the industrial area of Pomerode, especially when
    compared with older industrial and urban areas in Brazil, such as Cubatão, São Paulo State, Brazil. Air monitoring with the
    use of these bioindicators is effective and inexpensive, and this can be an important tool for the control and verification of
    environmental toxicity

    Keywords: Biomonitoring, PAH, industrial zone of the city of Pomerode, Parmelia minarum, Aechmea nudicaulis

                                                                  INTRODUCTION

         The assessment of air quality is essential to ensure adequate living conditions, both in health and economics. There is
consensus among experts that the current atmospheric levels found in urban regions can exacerbate morbidity, especially concerning
respiratory and cardiovascular diseases, and can lead to premature mortality (WHO, 2016). There are significant correlations
Australian Journal of Basic and Applied Sciences
ISSN: 1991-8178, EISSN: 2309-8414
Journal home page: www.ajbasweb.com
Copyright © The Author(s) 2021. This is an open-access article distributed under the terms of the Creative Commons Attribution License, which
permits unrestricted use, distribution, and reproduction in any medium, provided the original author and source are credited
20
AUSTRALIAN JOURNAL OF BASIC AND APPLIED SCIENCES                                                                        ARTICLES

between air pollutants and the occurrence of different types of cancer, with 14% of lung cancer cases attributable to this type of
pollution (Gouveia and Junger, 2018; Pruss-Ustun et al., 2016).

          Several different sampling and analysis techniques have been employed in studies to determine chemical species in the
atmosphere. However, many difficulties have been reported, especially concerning the sampling conditions, which often reduce the
results' quality. Another complication is identifying the emission sources, as it is not always possible to verify the geographic
allocation of the sources of emissions and atmospheric emissions (Cetesb,2020).

         Biomonitoring is a tool for measuring environmental quality, notably in investigations on atmospheric contamination,
within defined temporal and spatial scales. The effect of contamination can be studied at various levels, ranging from the response
of an individual to the community as a whole (García-Fernández et al., 2013; Garty, 2001). Essential features of effective
bioindicators include the following: they should be abundant in the survey area, they should be present all year round, they should
not be affected by climate change, and their collection should be rapid and easy (Lehndorff and Schwark, 2010).

          Of the various types of organisms used as bioindicators of atmospheric pollution, trees, lichens, mosses and bromeliads are
considered the most effective, these being used to determine the distribution and level of the effects of pollutants in the long-term
and over large areas. Besides, it may be possible to determine the concentrations of contaminants they were exposed to (González
et al., 2003). They offer easy handling, cultivation, and care at relatively low cost and quickly provide a reliable assessment response.
Lichens are exclusively dependent on the atmosphere to capture nutrients as they have no structures such as roots or cuticles. Their
geographical distribution is broad and they accumulate minerals; therefore, they are good indicators of air quality (Garty et al.,
2002). Many researchers consider lichens to be the bioindicator most widely used to verify air quality.

         Bioindicators for evaluating air pollution are defined as permanent control systems due to their high sensitivity to specific
pollutants and large storage capacity for contaminants in their biological tissues (Aslan et al., 2011; Markert et al., 2012; Petrescu-
Mag et al., 2010). Some pollutants are found in the environment in deficient concentrations, which can hinder their determination
by chemical or physical methods, but bioindicator plants can efficiently detect some of these concentrations (Pedruzi, 2016). Lichens
are examples of bioindicators or bio accumulators. In numerous studies, the determination of heavy metals, PAHs and other chemical
species has been carried out using lichens (Aslan et al., 2011; Garty et al., 2002; Petrescu-Mag et al., 2010; Sawicka-Kapusta et al.,
2007; Styers and Chappelka, 2009).

          Bromeliads have physiological and morphological structures that favor the absorption of chemical species since they feed
directly from the atmosphere, using their roots only for fixation onto trees or substrates. They can be found in all climates, either in
epiphytic form, with sources that favor their attachment to the host plant, or in terrestrial form, with functional roots that allow
extension and the uptake of water and nutrients from the soil (Chaparro and Ticktin, 2011; Rocha-Pessoa et al., 2008; Zanella et al.,
2012). Studies using bromeliads to evaluate environmental pollution's impact began in the first decades of the XX century (Saiki et
al., 2007). The bromeliad family members Tillandsia were used as bioindicators for heavy metals and PAHs (Figueiredo et al.,
2007). The bromeliad species Tllandsia usneoide was first evaluated as a biomonitor for fluoride in rainwater. It has since been used
as an atmospheric biomonitor to determine the composition of particulate materials and metals in addition to diagnosing the presence
of PAHs (Martins et al., 2017). The old beard easily adapts to hot dry conditions and is efficient in mercury (Hg) (Gadsdon et al.,
2010; Lu et al., 2005). Several techniques are used for biomonitoring (Citterio et al., 2002; Lang and Murphy, 2012; Markert, 2008;
Markert et al., 2012), including those which consider variations in community diversity and/or species abundance, physiological
variations, or simply the accumulation of pollutants.

          PAHs result from the incomplete combustion or pyrolysis of organic matter sources. They are ubiquitous in the global
environment and are typically more concentrated in urban centers' vicinity (Oguntimehin et al., 2010a; Oguntimehin et al., 2010b).
The occurrence of PAHs is essentially a result of anthropogenic emissions from, for instance, motor vehicles, burning of fossil fuels,
incinerators, oil refining and the production of coke, asphalt and aluminum. Of the various PAH emission sources, motor vehicles
are the most significant contributor (Tsai and Chen, 2004; Tsai et al., 2004). PAHs can be important indicators of anthropogenic
pollution because they are not found in biosynthetic processes since their concentration in the natural environment is very low. In
Brazil, interest in the use of biomonitors to detect environmental agents has increased gradually over the past four decades (Lovett
et al., 2009). Researchers have reported the testing of hundreds of species, including lichens, fungi, bryophytes, gymnosperms and
angiosperms (Ferreira et al., 2012; Leonardo et al., 2008; Li et al., 2012; Mota Filho et al., 2007).

          Air monitoring using these bioindicators is effective and inexpensive, and this can be an essential tool for the control and
verification of environmental toxicity. The industrial area in Pomerode is of great relevance in this context since it hosts various
types of industry: slaughterhouse, ceramic plant, cement plant, foundry, textile plant, mining activities and asphalt plant, among
others. Part of the SC 418 highway runs through the industrial district of Pomerode. This is important because this road truck traffic
is heavy since it plays a role in the logistics of the supply and distribution of materials for the industrial area.

        Evaluate the efficiency of strategies to control atmospheric emissions from industrial and mobile sources through
biomonitoring using lichens and bromeliads.
21
AUSTRALIAN JOURNAL OF BASIC AND APPLIED SCIENCES ARTICLES
MATERIALS AND METHODS
Study Area
Pomerode is located on the eastern side of the Itajaí Valley at a distance of 162 km from the state capital Florianópolis. It
has a total area of 216 km2 comprised of urban areas (76.5 km2) and rural areas (139.5 km2). It has a population of approximately
27,759 inhabitants. The climate is humid mesothermal with an average annual rainfall of 1.7 mm year -1. The economy is based on
the industrial area (72%). It lies in 14th place in the national ranking based on the human development index (HDI), and the
unemployment rate does not exceed 4.82% (IBGE, 2010).
Sample Collection
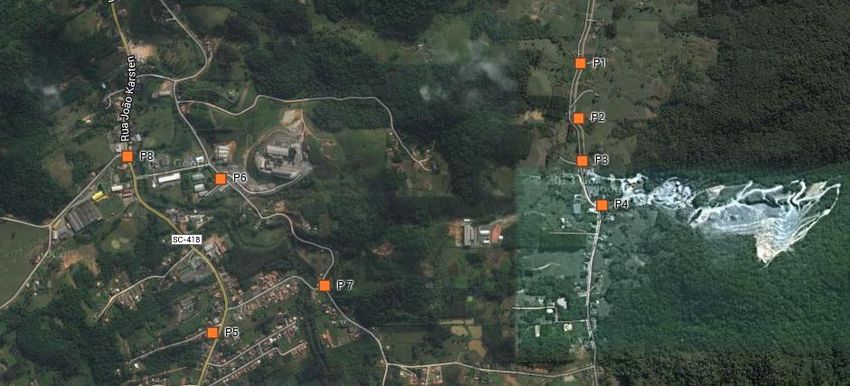
The sampling areas were defined according to maps that show that 90% of the municipality's industrial activities are located
in two industrial districts. Collections from the sample sites occurred from October 2010 to June 2011, performing one collection
per month (Figure 1).
Figure 1: Location of study sites (Google maps)
Source: Google Maps
The sampling sites were defined according to stationary and mobile sources of air pollution in industrial centers and their
surrounding neighborhoods. The sampling sites were distributed around the industrial area according to Table 1, taking into account
the predominant wind direction due to the dispersion of plumes of air pollutants from the stationary industrial pole sources, as in
other environmental studies.
Table 1: Geographic location of sites
Sites Coordinates
684644
1
7033129
684652
2
7033128
684625
3
7032126
683633
4
7031452
682919
5
7031643
682816
6
7031882
682445
7
7032472
682985
8
7032211
Source: authors (2021)
Sampling of lichens and bromeliads22
AUSTRALIAN JOURNAL OF BASIC AND APPLIED SCIENCES ARTICLES
A Garmim GPS was used to obtain details on the sites from which the samples were taken. For the collection of lichens
and bromeliads a clamp and a plastic knife were used to prevent contamination. Sterile plastic (polyethylene) containers with a
capacity of 80 mL were used to transport and store the samples. The containers were labeled with the geographical coordinates and
date of collection and stored in a freezer at -5 ºC.
Laboratory Analysis
Cleaning
All glassware used in the experiment was washed with detergent and rinsed in deionized water with hexane added and
dried in an oven at 120 oC for 1 h. The solvents and reagents used for the experiment were: acetonitrile (HPLC Grade, JT Baker)
and dichloromethane (HPLC Grade, JT Baker). The standard solution containing PAHs used in the experiments was obtained from
SUPELCO 595 North Harrison Road Lot no. 24238 Lb, catalog no. 47940-U.
Extraction
Lichen and bromeliads contain a range of organic substances. To achieve the best performance in the extraction of organic
pollutants with different polarities, it is necessary to use organic solvents with intermediate polarity. Dichloromethane and
acetonitrile are widely used as solvents in extracting these substances (Bonny et al., 2011; Pavlikova et al., 2004). We used an Anton
Paar microwave reaction system for the extraction of PAHs from the lichens and bromeliads. The Mussel Tissell technique available
for this equipment was used as the extraction mode. Samples of the dry mass (0.5 g) of the lichens and bromeliads were weighed,
crushed and placed in tubes sealed with Teflon caps and marked for identification. A mixture of 7.5 mL of acetonitrile and 2.5 mL
of dichloromethane was added to each sample. Samples were then placed in the microwave oven carousel and subjected to Mussel
Tissell extraction.
For each extraction batch a blank was included. In the microwave program, a temperature of 125 oC and a pressure of 18 bar was
applied for 50 min. After the extraction, a 1 mL aliquot of sample was removed, placed in a rotary evaporator (Rotavapor ® R II
Buchi) and subjected to a rotation of 180 rpm at 40 °C for 3 min. After evaporation, the sample was completely recovered with 1
mL of acetonitrile. The volume obtained was transferred to a vial with an automatic pipette. The flask was washed a few times with
acetonitrile for the complete removal of the sample.
Chromatographic analysis
The chromatographic separation was performed in liquid chromatography (Dionex® Ultimate 3000) equipped with an
isocratic pump (pump 3000), molecular absorption detector (3000 RP variable wavelength detector), 3000 column compartment,
analytical C-18 column (Dionex Acclaim ® 120) (250 x 4.6 mm, 5 μm), manual injection system with a fixed volume of 10 μL and
data acquisition system equipped with Chromeleon® software. In the optimized method, a wavelength of 254 nm, a flow rate of 1
mL min-1, oven temperature of 25 °C, injection volume of 10 μL, and total running time of 44 min was applied. A total of 16 PAHs
were investigated: naphthalene, acenaphthalene, acenaphthene, fluorene, phenanthrene, anthracene, fluoranthene, pyrene,
benzo[a]anthracene, chrysene, benzo[b]fluoranthene, benzo[k]fluoranthene, benzo[a]pyrene, indeno[1,2,3-cd]pyrene,
dibenzo[a,h]anthracene, benzo[g,h,i]perylene. To ensure the quality of the method used, all samples were processed in triplicate.
Calibration
A standard solution containing known concentrations of PAHs certified by Supelco™ was used as the external standard.
Calibration curves were constructed using five points with concentrations ranging from 5 to 254 ng ml-1. Under these conditions,
the characteristic peaks of the 16 PAHs in the mixture (Figure 2), with retention times ranging from 9.9 to 42.8 min, were identified.
Figure 2: Chromatogram of the calibration curve (amounts expressed in ng mL-1)
Source: authors (2021)23
AUSTRALIAN JOURNAL OF BASIC AND APPLIED SCIENCES ARTICLES
The limit of detection (LOD) was determined based on the standard deviation of the calibration curve and the slope of the
line using the following formula:
LOD = (3.3*a)/S (1)
Where a is the standard deviation of the calibration curve and S is the angle of the slope of the calibration curve. The
detection limits for the standards ranged from 0.12 mg mL-1 (acenaphthalene and anthracene) to 0.36 ng mL-1 (benzo[b]fluoranthene)
(Table 2).
Table 2: Analytical results for the reference PAH standards and their LOD and LOQ values expressed in ngmL-1)
PAH SLOPE SD LOD LOQ R2
Naphthalene 0.36040 0.01800 0.15 0.50 99.95
Acenaphthalene 0.27760 0.01100 0.12 0.40 99.97
Acenaphthene 0.16740 0.00800 0.14 0.48 99.96
Fluorene 1.60560 0.09600 0.18 0.60 99.93
Phenanthrene 4.35100 0.42300 0.29 0.97 99.82
Anthracene 9.60140 0.38700 0.12 0.40 99.97
Fluoranthene 1.10860 0.07200 0.19 0.65 99.92
Pyrene 0.96310 0.05900 0.18 0.61 99.92
Chrysene 1.97340 0.14700 0.22 0.74 99.90
Benzo[a]anthracene 1.16170 0.09900 0.26 0.85 99.86
Benzo[b]fluoranthene 2.17750 0.26300 0.36 1.21 99.73
Benzo[k]fluoranthene 1.64880 0.12400 0.23 0.75 99.89
Benzo[a]pyrene 2.57030 0.20500 0.24 0.80 99.88
Dibenzo[a,h]anthracene 0.57630 0.03700 0.19 0.64 99.92
Indeno[1,2,3-cd]pyrene 2.24420 0.20000 0.27 0.89 99.85
Benzo[g,h,i]perylene 0.68010 0.06900 0.30 1.01 99.80
Source: authors (2021)
The limit of quantification (LOQ) was determined based on the standard deviation of the calibration curve and the slope of
the line using the following formula:
LOQ = (10*a)/S (2)
The quantification limits were between 0.40 ng mL-1 (acenaphthalene and anthracene) and 1.21 ng mL-1
(benzo[b]fluoranthene) (Table 2).
Processing of data
The programming language chosen for the development was R (R Core Team, 2017). The choice was mainly due to its
architecture strongly focused on statistical computing, providing a wide range of libraries for carrying out statistical analysis routines
and having an active community of developers who implement and support new packages that expand the environment's
functionality. (Ke et al., 2015). This study's statistical techniques were principal coordinate analysis (PCoA) and multivariate
statistical methods (software R) to check the trends of the species studied in the sampled areas. To visualize the dissimilarity of the
samples in relation to the types of dispersion, a Principal Coordinate Analysis (PCoA) was performed using the vegan package's
pcoa function (Oksanen et al., 2017). This analysis tests the null hypothesis that the average dispersion within the group (distance
to the centroid) is equal between the groups of the samples and allows to analyze the variation in the composition between the
dispersion modes, using the beta function dispersed vegan package (Oksanen et al., 2017) in the R statistical software (R Core Team,
2017).24
AUSTRALIAN JOURNAL OF BASIC AND APPLIED SCIENCES ARTICLES
RESULTS AND DISCUSSION
Several PAHs were found in the lichens and bromeliads. To understand and interpret the results, we used the method of
principal coordinates analysis (PcoA) and the Bray-Curtis distance index after applying Wisconsin double processing (Bocard et
al., 2011; Oksanen et al., 2017) to the original data. To assess the PAH correlations with the scores obtained along the PCoA axes
we considered the Pearson index.
For this study, we needed to randomize the dates and places, prior to which it was necessary to calculate the mean of the
two replicas and then randomly select three dates at each site to compose a sample. Thus, we obtained an ordination (PCoA) for
samples with randomized dates and another for samples with randomized locations (Antiqueira et al., 2018). The processing of the
data was performed using the R software.
Results obtained for lichen samples
The concentration of PAHs found in the lichens represents an accumulation over time. The overall sum of the PAH
concentrations (ΣPAH) found in the lichens was 6,264.6 ng kg-1, and at each site the sums of the PAH concentrations were: site 01
– 2,000.86 ng kg-1, site 02 – 256.93 ng kg-1, site 03 – 375.15 ng kg-1, site 04 – 411.77 ng kg-1 , site 05 -1,632.30 ng kg-1, site 06 –
140.10 ng kg-1, site 07 – 1,064.,50 ng kg-1 e site 08 – 382.80 ng kg-1. The variation among the sites evaluated was 140.10 ng kg-1 to
2,000.86 ng kg-1.
The highest ΣPAH value was observed at site 01. This collection site is located in an area with little access to vehicles,
primarily serving the industrial complex (Figure 3).
Figure 3: Total monthly concentrations of PAHs in lichens for the period from October 2010 to June 2011
Source: authors (2021)
Another site with a higher ΣPAH, when compared to other locations, is site 05. This site lies near the industrial area and is
located on the edge of the SC 418 highway. At the other sites, we found contamination by PAHs from the industrial area of
Pomerode. Figure 4 shows the mean concentrations of the individual PAHs for the sampled sites. It can be observed that at site 01
acenaphthalene is predominant with concentrations above 1800 ng mL-1.25
AUSTRALIAN JOURNAL OF BASIC AND APPLIED SCIENCES ARTICLES
Figure 4: Profiles for average PAH concentrations in lichens at the 8 sampling sites
Source: authors (2021)
At site 07 this same PAH prevailed with a concentration of close to 800 ng mL-1. At site 05, the predominant PAH was
indeno[1,2,3-cd] pyrene, with attention of close to 1.400 ng kg-1. The concentrations of the other PAHs did not exceed 200 ng kg -1.
The 16 priority PAHs, according to the United States Environmental Protection Agency (USEPA), not detected at all at the eight
study sites were evaluated.
Acenaphthalene is found mainly in coal tar, tobacco smoke, as an organic contaminant in groundwater, as a combustion
product and following its release into the environment during natural fires (Fu et al., 2010; Kim et al., 2009). Emissions from
petroleum refining and the distillation of coal tar are the main contributors of acenaphthalene to the environment. This compound
is well known to have adverse effects on humans and aquatic organisms (Lederer, 1985). Indeno[1,2,3-cd)] pyrene is a chemical
component of gasoline and tobacco smoke and it is hazardous to the environment and carcinogenic to humans (Fu et al., 2010; Tsai
and Chen, 2004).
Applying the method of principal coordinates analysis (PCoA) and the Bray-Curtis distance index after using Wisconsin double
processing (Bocard et al., 2011) to the original data, with randomized dates, a recovery of 48% of the variance was observed for the
PAH concentrations in the lichen samples along the first three axes, with approximately 20% along with the first and 16% and 12%
along with the second and third, respectively (Figure 5), the influence of seasonality on air quality, (Ikram et al., 2015), as well as
on the physiological behavior of plant species (Hetem and Andrade, 2016).26
AUSTRALIAN JOURNAL OF BASIC AND APPLIED SCIENCES ARTICLES
Figure 5: Ordering of lichen samples collected at each site using principal coordinates analysis (PCoA). Vectors indicate the
correlations (r > 0.5) of PAHs with the ordination axes
Source: authors (2021)
With the randomized locations, PCoA recovered slightly less than 44% of the variance in the PAH concentrations in the
lichen samples along the first three axes, with approximately 18% along the first and 14% and 13% along the second and third,
respectively (Figure 6).
Figure 6: Ordering of lichen samples collected on each date using principal coordinates analysis PCoA). Vectors indicate the
correlations (r > 0.5) of PAHs with the ordination axes
Source: authors (2021)27
AUSTRALIAN JOURNAL OF BASIC AND APPLIED SCIENCES ARTICLES
In terms of ordination, considering the first two axes of the PCoA, the samples of the first quarter were separated from each
other due to the higher concentrations of acenaphthalene.
Results obtained for bromeliad samples
The overall ∑PAH for the bromeliads was 707.73 ng kg-1 and the following values were obtained for the sites: site 01 -
55.39 ng kg-1, site 02 - 67.21 ng kg-1, site 03 – 301.59 ng kg-1, site 04 - 27.49 ng kg-1, site 05 - 62.57 ng kg-1, site 06 – 18.58 ng kg-
1
, site 07 - 134.00 ng kg-1 and site 08 – 36.09 ng kg-1. The ∑PAH varied from 18.58 ng kg-1 to 301.59 ng kg-1.
The ΣPAH values obtained for the bromeliads were below those observed for the lichens. Some varieties of bromeliads are
excellent bioindicators for certain substances, such as heavy metals (Figueiredo et al., 2007; Figueiredo et al., 2004; Saiki et al.,
2007).
The highest ΣPAH found at site 03 (Figure 7) was expected since this sampling site is located closest to activities with the
greatest environmental impact, such as gneiss mining, an asphalt plant, and route vehicles supplying this industrial area. However,
all of the study sites were probably contaminated with PAHs originating from the industrial regions in Pomerode.
Figure 7: Total of monthly concentrations of PAHs in bromeliads for the period from October 2010 to June 2011
Source: authors (2021)
In the case of site 08 and close proximity to a major source of pollution (a cement plant), it is subjected to the environmental
impact of the route that serves the industrial area of Pomerode, that is, SC 418 highway. As can be observed, this site has an extensive
diversity of PAHs of pyrolytic and petrogenic origin (Figure 8). The site showed the presence of 07 PAHs originating from pyrolytic
sources due to this site being located directly on the edge of the SC 418 highway, at one entrance to the industrial area of Pomerode.
It was observed that the profile adopted for vehicular emissions is similar to profiles used by other simulation works in the region
(Albuquerque et al., 2018). A possible source of pyrene, which was found in high concentrations at sites 01, 03 and 5 (Figure 8), is
gasoline-powered and diesel-powered vehicles.28
AUSTRALIAN JOURNAL OF BASIC AND APPLIED SCIENCES ARTICLES
Figure 8: Individual profiles for average PAH concentrations in bromeliads at the 8 sampling sites
Source: authors (2021)
The sampling sites are close to heavy motor vehicle traffic, contributing to the concentration of this compound and others
derived from these sources, such as chrysene and benzo[a]anthracene (Vasconcelos et al., 2003). Compounds of molecular weight
228 and 276 (benzo[a]anthracene, chrysene and indeno[1,2,3-cd] pyrene) indicate contamination from the pitch used to manufacture
asphalt. Benzo[a]anthracene in higher concentrations indicates contamination by combustion (Yunker et al., 2002) and chrysene
and benzo[k]fluoranthene are indicators of the large-scale industrial burning of oil (Yang et al., 1998). With the dates randomized,
the PCoA recovered more than 53% of the variance in the samples obtained from the first three axes for the bromeliads, with
approximately 24% along the first, 16% along the second and 13% along the third. No local concentration of any hydrocarbon (or
set of hydrocarbons) in particular (Figure 9) was characterized throughout the study period. This absence may be mainly related to
the low concentration of PAHs found at the sample sites.
Figure 9: Ordination of bromeliad samples collected at each site using principal coordinates analysis (PCoA). Vectors indicate the
correlations (r> 0.5) of PAHs with the ordination axes
Source: authors (2021)29
AUSTRALIAN JOURNAL OF BASIC AND APPLIED SCIENCES ARTICLES
Values above r > 0.2 indicate that in this period, there was an isolated event involving a significant emission of these
compounds and high concentrations were not observed for the remainder of the collections. Thus, this area cannot be regarded as a
location with a strong influence on contamination. Ten of the 16 registered hydrocarbons had correlations higher than r > 0.5 with
the first two axes of the PCoA correlation. The factors justify being related to a wide distribution of these pollutants due to their
sources (Bird et al., 2019).
With the sites randomized, the PCoA recovered slightly less than 53% of the variance in the samples obtained for the
bromeliad hydrocarbons along the first three axes, with approximately 24% along with the first 16% along with the second and 13%
along with the third.
In terms of ordination, considering the first two axes of the PCoA, samples collected in June were separated from the others
due to the higher concentrations of acenaphthalene, chrysene and pyrene (Figure 10). Eight of the 16 registered PAHs had
correlations higher than r > 0.5 with the first two axes of the PCoA.
Figure 10: Ordination of bromeliad samples collected on each date using principal coordinates analysis (PCoA). Vectors indicate
the correlations (r > 0.5) of PAHs with the ordination axes.
Source: authors (2021)
Impact at sample sites
Sampling site 01 is not located near major pollution sources, but the atmospheric environment is affected by PAHs due to
their dispersion plumes. A small concentration of anthracene was present at this site because, according to Figure 05, R > 0.2, and
this value can be explained by the low molecular mass of this hydrocarbon. In general, PAHs with low molecular weight are
associated with pollution sources, specifically of petrogenic origin. In this case, the value observed may be related to the presence
of an asphalt plant and a blast furnace metal mechanical plant. The presence of indeno[1,2,3-cd]pyrene is attributable to the burning
of fuels, such as diesel and gasoline, from vehicle traffic (Vasconcelos et al., 2003).
The presence of dibenzo[a,h]anthracene and benzo[a]pyrene at sampling sites 02 and 03 can be explained by the proximity
of a gneiss processing plant and concrete processing plant. In relation to sampling sites 04 (entrance to the gneiss mine), 05 (entrance
I of the industrial district), 06 (in front of Olavo Bilac School), 07 (SC 418 after entrance II of the industrial community) and 08 (in
front of the cement plant), the presence of low concentrations of PAHs with low molecular mass may be due to the ease of their
degradation in the environment where they are generated. Besides having high volatility when handled by extraction and
fractionation methods, significant losses may occur, which could mask the true values for the areas sampled (Chen et al., 2007). The
transport sector has a marginally larger share of contribution than that represented by the industrial sector; a situation is closer to
the estimates of emissions in Brazilian urban regions (Andrade et al., 2017).
The low molecular weight PAHs indicate emissions from petrogenic sources, the presence of sewage, crude oil and
petroleum refineries (Qian et al., 2001), or cement plants' presence as essential sources of fluoranthene and phenanthrene (Yang et
al., 1998).30
AUSTRALIAN JOURNAL OF BASIC AND APPLIED SCIENCES ARTICLES
The low molecular weight PAHs found in high concentrations R > 0.2 to R > 0.5 in January-March 2011 indicates that this
was an isolated event involving high emissions of these compounds. The sources of contamination can explain the presence of PAHs
of higher molecular weight at the sample sites. However, these compounds' physicochemical characteristics also need to be taken
into account since they are more easily adsorbed onto surfaces, leading to more excellent resistance to biodegradation and better
response in procedures for the extraction and recovery of samples.
In Figure 10, values of between r > 0.2 and r > 0.4 can be observed, indicating contamination from the combustion of
petroleum products (e.g., at oil refineries and in car and truck emissions (Vasconcelos et al., 2003). Both sampling sites are close to
highways and roads which carry heavy vehicle traffic, carry supplies and serving the logistical flow of the industrial area, thus
representing important sources of PAHs to the study area.
CONCLUSIONS
This study showed that it is possible to monitor the compounds of interest in the atmosphere through biomonitoring using
lichens and bromeliads. The PAH values obtained in this study can be considered similar to those of remote regions of the globe,
which characterizes low PAH contamination in the industrial area of Pomerode, especially when compared with older industrial and
urban areas in Brazil, such as Cubatão, São Paulo State, Brazil. The most significant amounts of PAHs found in this study are
derived essentially from combustion processes which may be stationary sources, such as smokestacks, or mobile sources, such as
vehicles. This method has several advantages which makes it ideal for use in developing countries like Brazil, since the use of a
biomonitor together with an analytical technique is fast, inexpensive and versatile, and it requires only brief training, minimal use
of technical equipment and can be used in a variety of studies. Monitoring of air pollution can be performed without requiring the
use of high-cost tools with the contribution of bio-dicators (Calisto et al., 2018). This study leaves as a contribution the database of
analysis of HPA´s in the municipality of Pomerode, since the industrial area was implanted in 2009 or is recent. This database will
provide subsidies for further studies and for the control of atmospheric emissions in the region in question. What will guarantee the
environmental health of the region as well as the community installed in its surroundings.
BIBLIOGRAPHY
Albuquerque, T. T. A. et al., 2018. WRF-SMOKE-CMAQ modeling system for air quality evaluation in São Paulo megacity with
a 2008 experimental campaign data. Environmental Science and Pollution Research, 25: 36555–36569. doi:
10.1007/s11356-018-3583-9
Andrade, M. de F. et al., 2017. Air quality in the megacity of São Paulo: Evolution over the last 30 years and future perspectives.
Atmospheric Environment, 159: 66–82. doi: 10.1016/j.atmosenv.2017.03.051
Antiqueira, P. A. P., O. L. Petchey and G. Q. Romero, 2018. Warming and top predator loss drive ecosystem multifunctionality.
Ecology Letters, 21: 72–82. doi: 10.1111/ele.12873
Aslan, A., A. Cicek, K. Yazici, Y. Karagoz, M. Turan, F. Akkus, and O. S. Yildirim, 2011. The assessment of lichens as bioindicator
of heavy metal pollution from motor vehicles activites. African Journal of Agricultural Research, 6(7): 1698-1706. doi:
10.5897/AJAR10.331
Bird, M. S., M. C. Mlambo, R. J. Wasserman, T. Dalu, A. J. Holland, J. A. Day, M. H. Villet, D. T. Bilton, H. M. Barber-James and
L. Brendonck, 2019. Deeper knowledge of shallow waters: reviewing the invertebrate fauna of southern African temporary
wetlands. Hydrobiologia 827: 89–121. doi: 10.1007/s10750-018-3772-z
Bocard, D., F. Gillet, and P. Legendre, 2011. Numerical ecology with R. New York: Springer.
Bonny, S., L. Paquin, D. Carrie, J. Boustie, and S. Tomasi, 2011. Ionic liquids based microwave-assisted extraction of lichen
compounds with quantitative spectrophotodensitometry analysis. Analytica chimica acta, 707(1-2): 69-75. doi:
10.1016/j.aca.2011.09.009
Calisto, M. J. F. Gonçalvez and P. Moreno, 2019. Invertebrados aquáticos como bioindicadores. Universidade Federal de Minas
Gerais.
Cetesb. Qualidade do Ar. 2020. Disponível em: https://cetesb.sp.gov.br/ar/,
Chaparro, D. M., and T. Ticktin, 2011. Demographic effects of harvesting epiphytic bromeliads and an alternative approach to
collection. Conservation Biology, 25(4): 797-807. doi: 10.1111/j.1523-1739.2011.01691.x
Chen, Y., L. Zhu, and R. Zhou, 2007. Characterization and distribution of polycyclic aromatic hydrocarbon in surface water and
sediment from Qiantang River, China. Journal of Hazardous materials,141(1): 148-155. doi:
10.1016/j.jhazmat.2006.06.106
Citterio, S., R. Aina, M. Labra, A. Ghiani, P. Fumagalli, S. Sgorbati, and A. Santagostino, 2002. Soil genotoxicity assessment: a
new strategy based on biomolecular tools and plant bioindicators. Environmental science & technology, 36(12): 2748-
2753. doi: 10.1021/es0157550
Ferreira, A. B., M. Saiki, J. O. Santos, A. P. Ribeiro, and P. H. N. Saldiva, 2012. Elemental composition evaluation in lichens
collected in the industrial city of São Mateus Sul, Paraná, Brazil. Journal of Radioanalytical and Nuclear Chemistry, 291(1):
71-76. doi: 10.1007/s10967-011-1237-1
Figueiredo, A. M., C. A. Nogueira, M. Saiki, F. M. Milian, and M. Domingos, 2007. Assessment of atmospheric metallic pollution
in the metropolitan region of São Paulo, Brazil, employing Tillandsia usneoides L. as biomonitor. Environmental Pollution,31
AUSTRALIAN JOURNAL OF BASIC AND APPLIED SCIENCES ARTICLES
145(1): 279-292. doi: 10.1016/j.envpol.2006.03.010
Figueiredo, A. M. G., A. L. Alcala, R. B. Ticianelli, M. Domingos, and M. Saiki, 2004. The use of Tillandsia usneoides L. as
bioindicator of air pollution in São Paulo, Brazil. Journal of Radioanalytical and Nuclear Chemistry, 259(1): 59-63. doi:
10.1023/B:JRNC.0000015806.15495.89
Fu, F., B. Tian, G. Lin, Y. Chen, and J. Zhang, 2010. Chemical Characterization and Source Identification of Polycyclic Aromatic
Hydrocarbons in Aerosols Originating from Different Sources. Journal of the Air & Waste Management Association,
60(11): 1309-1314. doi: 10.3155/1047-3289.60.11.1309
Gadsdon, S. R., J. R. Dagley, P. A. Wolseley, and S. A. Power, 2010. Relationships between lichen community composition and
concentrations of NO2 and NH3. Environmental Pollution, 158(8): 2553-2560. doi: 10.1016/j.envpol.2010.05.019
García-Fernández, A. J., S. Espín, E. Martínez-López, 2013. Feathers as a biomonitoring tool of polyhalogenated compounds: a
review. Environmental science & technology, 47(7): 3028-3043. doi: 10.1021/es302758x
Garty, J., 2001. Biomonitoring atmospheric heavy metals with lichens: theory and application. Critical reviews in plant sciences,
20(4): 309-371. doi: 10.1080/20013591099254
Garty, J., T. Levin, Y. Cohen, and H. Lehr, 2002. Biomonitoring air pollution with the desert lichen Ramalina maciformis.
Physiologia Plantarum, 115(2): 267-275. doi: 10.1034/j.1399-3054.2002.1150213.x
González, C. M., M. L. Pignata, and L. Orellana, 2003. Applications of redundancy analysis for the detection of chemical response
patterns to air pollution in lichen. Science of the total environment, 312(1-3): 245-253. doi: 10.1016/S0048-
9697(03)00253-5
Gouveia, N. and W. L. Junger, 2018. Effects of air pollution on infant and children respiratory mortality in four large Latin-American
cities. Environmental Pollution, 232: 1-7. doi: 10.1016/j.envpol.2017.08.125
Hetem, I. G. and M. de A. Fatima, 2016. Characterization of Fine Particulate Matter Emitted from the Resuspension of Road and
Pavement Dust in the Metropolitan Area of Sao Paulo, Brazil. Atmosphere, 7(2): 1-10. doi: 10.3390/atmos7030031
IBGE, 2010. Pomerode - Political and Regional Industrial Zoning Map. Brazilian Institute of Geography and Statistics.
Ikram, A., N. B. Zahra, Z. K. Shinwari and M. Qaiser, 2015. Ethnomedicinal Review of Folklore Medicinal Plants Belonging to
Family Apiaceae of Pakistan. Pakistan Journal of Botany 47(3):1007-1014.
Ke, Y., J. Im, J. Lee, H. Gong and Y. Ryu, 2015. Characteristics of landsat 8 oli -derived NDVI by comparison with multiple satellite
sensors and in-situ observations. Remote Sensing of Environment, 164: 298 –313. Doi: 10.1016/j.rse.2015.04.004
Kim, D., B. M. Kumfer, C. Anastasio, I. M. Kennedy, and T. M. Young, 2009. Environmental aging of polycyclic aromatic
hydrocarbons on soot and its effect on source identification. Chemosphere, 76(8): 1075-1081. doi:
10.1016/j.chemosphere.2009.04.031
Lang, P., and K. J. Murphy, 2012. Environmental drivers, life strategies and bioindicator capacity of bryophyte communities in
high-latitude headwater streams. Hydrobiologia, 679(1): 1-17. doi: 10.1007/s10750-011-0838-6
Lederer, W. H., 1985. Acenaphthylene: Regulatory chemicals of health and environmental concern. New York: Van Nostrand
Reinhold Company.
Lehndorff, E., and L. Schwark, 2010. Biomonitoring of air quality in the Cologne Conurbation using pine needles as a passive
sampler–Part III: Major and trace elements. Atmospheric Environment, 44(24): 2822-2829. doi:
10.1016/j.atmosenv.2010.04.052
Leonardo, L., S. R. Damatto, B. P. Mazzilli, and M. Saiki, 2008. The use of lichen (Canoparmelia texana) as biomonitor of
atmospheric deposition of natural radionuclides from U‐238 and Th‐232 series. In the AIP Conference Proceedings.
American Institute of Physics, College Park, Maryland, pp. 494-497.
Li, P., G. L. Zheng, X. Chen, and R. Pemberton, 2012. Potential of monitoring nuclides with the epiphyte Tillandsia usneoides:
uptake and localization of 133Cs. Ecotoxicology and environmental safety, 86: 60-65. doi: 10.1016/j.ecoenv.2012.08.002
Lovett, G. M. et al., 2009. Effects of air pollution on ecosystems and biological diversity in the eastern United States. Annals of the
New York Academy of Sciences, 1162(1): 99-135. doi: 10.1111/j.1749-6632.2009.04153.x
Lu, R. et al., 2005. Naphthalene distributions and human exposure in Southern California. Atmospheric Environment, 39(3): 489-
507. doi: 10.1016/j.atmosenv.2004.09.045
Markert, B., 2008. From biomonitoring to integrated observation of the environment-The Multi-Markered Bioindication Concept.
Ecological Chemistry and Engineering, 15(3): 315-333.
Markert, B., S. Wunschmann, and E. Baltrenaite, 2012. Innovative observation of the environment. Bioindicators and biomonitors:
definitions, strategies and applications. Journal of Environmental Engineering and Landscape Management, 20(3): 221-
239. doi: 10.3846/16486897.2011.633338
Martins, L. D. et al., 2017. Extreme value analysis of air pollution data and theircomparison between two large urban regions of
South America. Weather and Climate Extremes journal, 18: 44–54. doi: 10.1016/j.wace.2017.10.004
Mota Filho, F. de O. et al., 2007. Influence of atmospheric pollutants in Belo Jardim (PE) using Cladonia verticillaris (lichen) as
biomonitor. Química Nova, 30(5): 1072-1076. doi: 10.1590/S0100-40422007000500004
Oguntimehin, I., F. Eissa, and H. Sakugawa, 2010a. Simultaneous ozone fumigation and fluoranthene sprayed as mists negatively
affected cherry tomato (Lycopersicon esculentum Mill). Ecotoxicology and environmental safety, 73(5): 1028-1033. doi:
10.1016/j.ecoenv.2010.04.003
Oguntimehin, I., H. Kondo, and H. Sakugawa, 2010b. The use of Sunpatiens (Impatiens spp.) as a bioindicator of some simulated
air pollutants–using an ornamental plant as bioindicator. Chemosphere, 81(2): 273-281. doi:
10.1016/j.chemosphere.2010.05.05232
AUSTRALIAN JOURNAL OF BASIC AND APPLIED SCIENCES ARTICLES
Oksanen, J., F. G. Blanchet, M. Friendly, R. Kindt, P. Legendre, D. McGlinn, P. R. Minchin, R. B. O'Hara, G. L. Simpson, P.
Solymos, M. H. H. Stevens, E. Szoecs and H. Wagner, 2017. Vegan: Community Ecology Package. R package version
2.4-4.
Pavlikova, D., M. Pavlik, S. Vasickova, J. Szakova, P. Tlustos, K. Vokac, and J. Balik, 2004. Separation of organic compounds
binding trace elements in seeds of Leuzea carthamoides (Willd.) DC. Applied organometallic chemistry, 18(12): 619-625.
doi: 10.1002/aoc.654
Pedruzzi, R., 2016. Avaliação de Desempenho de Modelo Fotoquímico CMAQ Utilizando diferentes Condiçòes de Contorno em
uma Região Urbana e Industrializada. Universidade Federal do Espírito Santo, Vitória, Espírito Santo.
Petrescu-Mag, I. V., B. Păsărin, and C. F. Todoran, 2010. Metallurgical, agricultural and other industrial related chemical pollutants:
biomonitoring and best model organisms used. Metalurgia International, 15(9): 38-48.
Pruss-Ustun, A. et al., 2016. Preventing disease through healthy environments: a global assessment of the burden of disease from
environmental risks. World Health Organization, 176p.
Qian, Y., T. L. Wade, and J. L. Sericano, 2001. Sources and bioavailability of polynuclear aromatic hydrocarbons in Galveston Bay,
Texas. Estuaries, 24(6): 817-827.
Rocha-Pessoa, T. C., A. F. Nunes-Freitas, L. Cogliatti-Carvalho, and C. F. Rocha, 2008. Species composition of Bromeliaceae and
their distribution at the Massambaba restinga in Arraial do Cabo, Rio de Janeiro, Brazil. Brazilian Journal of Biology,
68(2): 251-257. doi: 10.1590/S1519-69842008000200005
Saiki, M., A. Fuga, E. R. Alves, M. B. A. Vasconcellos, and M. P. Marcelli, 2007. Biomonitoring of the atmospheric pollution using
lichens in the metropolitan area of São Paulo city, Brazil. Journal of Radioanalytical and Nuclear Chemistry, 271(1): 213-
219.
R Core Team, 2017. R: a language and environment for statistical computing. R Foundation for Statistical Computing.
Sawicka-Kapusta, K., M. Zakrzewska, and G. Bydlon, 2007. Biological monitoring; the useful method for estimation of air and
environment quality. Air Pollution XV, 1: 353-362. doi: 10.2495/AIR070351
Styers, D. M., and A. H. Chappelka, 2009. Urbanization and atmospheric deposition: use of bioindicators in determining patterns
of land-use change in west Georgia. Water, air, and soil pollution, 200(1-4): 371-386. doi: 10.1007/s11270-008-9919-1
Tsai, M. Y., and K. S. Chen, 2004. Measurements and three-dimensional modeling of air pollutant dispersion in an Urban Street
Canyon. Atmospheric Environment, 38(35): 5911-5924. doi: 10.1016/j.atmosenv.2004.07.008
Tsai, P. J., T. S. Shih, H. L. Chen, W. J. Lee, C. H. Lai, and S. H. Liou, 2004. Assessing and predicting the exposures of polycyclic
aromatic hydrocarbons (PAHs) and their carcinogenic potencies from vehicle engine exhausts to highway toll station
workers. Atmospheric Environment, 38(2): 333-343. doi: 10.1016/j.atmosenv.2003.08.038
Vasconcelos, P. C., L. R. F. Carvalho, M. A. F. Pires, D. Zacarias, and C. Pool, 2003. Measurements of polycyclic aromatic
hydrocarbons in airborne particles from the metropolitan area of Sao Paulo City, Brazil. Atmospheric Environment, 37(21):
3009-3018. doi: 10.1016/S1352-2310(03)00181-X
Who. World Health Statistics 2016: Monitoring Health for the SDGs, sustainable development goals. . [S.l: s.n.], 2016.
Yang, H. H., W. J. Lee, S. J. Chen, and S. O. Lai, 1998. PAH emission from various industrial tacks. Journal Hazard Mater, 60:
159-174. doi: 10.1016/S0304-3894(98)00089-2
Yunker, M. B., W. M. Robie, R. Vingarzan, R. H. Mitchell, D. Goyette, and S. Sylvestre, 2002. PAHs in the Fraser River basin: a
critical appraisal of PAH ratios as indicators of PAH source and composition. Organic geochemistry, 33(4): 489-515. doi:
10.1016/S0146-6380(02)00002-5
Zanella, C. M. et al., 2012. Genetics, evolution and conservation of Bromeliaceae. Genetics and molecular Biology, 35(4): 1020-
1026. doi: 10.1590/S1415-47572012000600017You can also read