Synchronized high-resolution bed-level change and biophysical data from 10 marsh-mudflat sites in northwestern Europe - ESSD
←
→
Page content transcription
If your browser does not render page correctly, please read the page content below
Earth Syst. Sci. Data, 13, 405–416, 2021
https://doi.org/10.5194/essd-13-405-2021
© Author(s) 2021. This work is distributed under
the Creative Commons Attribution 4.0 License.

            Synchronized high-resolution bed-level change and
              biophysical data from 10 marsh–mudflat sites
                         in northwestern Europe
               Zhan Hu1,2 , Pim W. J. M. Willemsen3,4 , Bas W. Borsje3 , Chen Wang5 , Heng Wang2,6 ,
        Daphne van der Wal4,7 , Zhenchang Zhu8 , Bas Oteman4 , Vincent Vuik9,10 , Ben Evans11 , Iris Möller12 ,
         Jean-Philippe Belliard13 , Alexander Van Braeckel14 , Stijn Temmerman13 , and Tjeerd J. Bouma4,15
                  1 Guangdong       Provincial Key Laboratory of Marine Resources and Coastal Engineering,
                             School of Marine Sciences, Sun Yat-sen University, Zhuhai, 519082, China
                   2 Southern Marine Science and Engineering Guangdong Laboratory, Zhuhai, 519080, China
              3 Water Engineering and Management, Faculty of Engineering Technology, University of Twente,

                                          P.O. Box 217, 7500 AE Enschede, the Netherlands
         4 Department of Estuarine and Delta Systems, NIOZ Royal Netherlands Institute for Sea Research, Utrecht

                                     University, P.O. Box 140, 4400 AC Yerseke, the Netherlands
          5 Satellite Application Center for Ecology and Environment, Ministry of Ecology and Environment, State

                Environmental Protection Key Laboratory of Satellite Remote Sensing, Beijing, 100094, China
               6 School of Marine Engineering and Technology, Sun Yat-Sen University, Zhuhai, 519082, China
                     7 Faculty of Geo-Information Science and Earth Observation (ITC), University of Twente,

                                          P.O. Box 217, 7500 AE Enschede, the Netherlands
               8 Institute of Environmental and Ecological Engineering, Guangdong University of Technology,

                                                      Guangzhou, 510030, China
                          9 Faculty of Civil Engineering and Geosciences, Delft University of Technology,

                                            P.O. Box 5048, 2600 GA Delft, the Netherlands
                               10 HKV Consultants, P.O. Box 2120, 8203 AC Lelystad, the Netherlands
                         11 Department of Geography, University of Cambridge, Cambridge, CB2 3EN, UK
                         12 Department of Geography, Trinity College Dublin, Dublin 2, D02 PN40, Ireland
                  13 Ecosystem Management Research Group, University of Antwerp, 2610 Antwerp, Belgium
                    14 Research Institute for Nature and Forest (INBO), Havenlaan 88, 1000 Brussels, Belgium
       15 Department of Physical Geography, Utrecht University, P.O. Box 80.115, 3508 TC Utrecht, the Netherlands

                             Correspondence: Heng Wang (wangheng3@mail.sysu.edu.cn)

                                   Received: 27 March 2020 – Discussion started: 4 June 2020
                     Revised: 6 December 2020 – Accepted: 8 December 2020 – Published: 12 February 2021

      Abstract. Tidal flats provide valuable ecosystem services such as flood protection and carbon sequestration.
      Erosion and accretion processes govern the ecogeomorphic evolution of intertidal ecosystems (marshes and bare
      flats) and, hence, substantially affect their valuable ecosystem services. To understand the intertidal ecosystem
      development, high-frequency bed-level change data are thus needed. However, such datasets are scarce due to
      the lack of suitable methods that do not involve excessive labour and/or costly instruments. By applying newly
      developed surface elevation dynamics (SED) sensors, we obtained unique high-resolution daily bed-level change
      datasets in the period 2013–2017 from 10 marsh–mudflat sites situated in the Netherlands, Belgium, and the
      United Kingdom in contrasting physical and biological settings. At each site, multiple sensors were deployed for
      9–20 months to ensure sufficient spatial and temporal coverage of highly variable bed-level change processes.
      The bed-level change data are provided with synchronized hydrodynamic data, i.e. water level, wave height,
      tidal current velocity, medium sediment grain size (D50 ), and chlorophyll a level at four sites. This dataset has

Published by Copernicus Publications.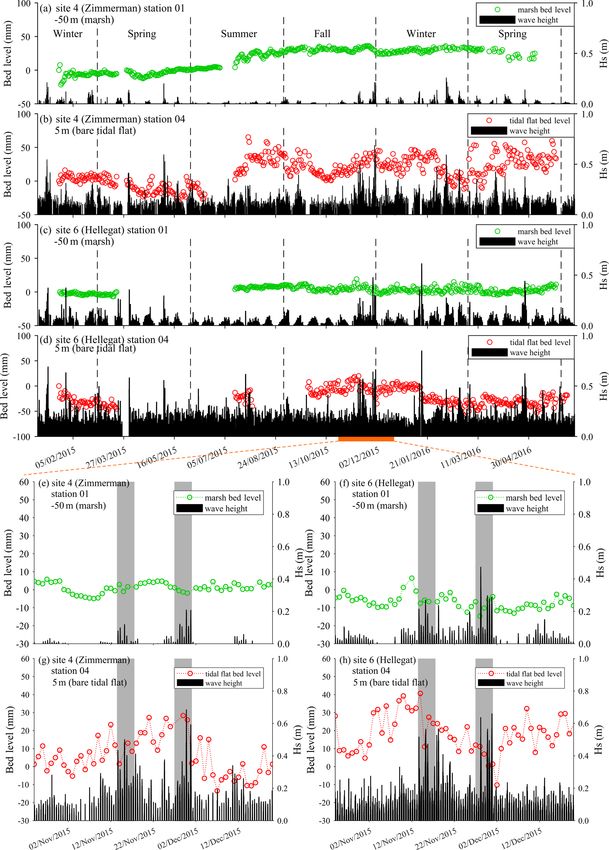
406                                                      Z. Hu et al.: High-resolution bed-level change data in intertidal areas

       revealed diverse spatial morphodynamics patterns over daily to seasonal scales, which are valuable to theoretical
       and model development. On the daily scale, this dataset is particularly instructive, as it includes a number of
       storm events, the response to which can be detected in the bed-level change observations. Such data are rare but
       useful to study tidal flat response to highly energetic conditions.
          The dataset is available from 4TU.ResearchData (https://doi.org/10.4121/12693254.v4; Hu et al., 2020),
       which is expected to expand with additional SED sensor data from ongoing and planned surveys.

1   Introduction                                                    shift. Existing measurements of intertidal bed-level dynam-
                                                                    ics typically have limited temporal (e.g. two to five tidal cy-
Salt marshes and the adjacent tidal flats are co-evolving           cles) or spatial resolution (e.g. one to two stations) (White-
coastal ecosystems of global importance (Mcowen et al.,             house and Mitchener, 1998; Shi et al., 2014; Zhu et al., 2014;
2017; Schuerch et al., 2018). They provide multiple ecosys-         Hunt et al., 2016), as high-resolution datasets require exces-
tem services such as carbon sequestration (Mcleod et al.,           sive labour or a high cost for instruments (Andersen et al.,
2011; Duarte et al., 2013), hosting migratory birds (Van            2006).
Eerden et al., 2005), and protecting coastal communities               In light of these limitations, surface elevation dynam-
and infrastructures by attenuating waves (Temmerman et al.,         ics (SED) sensors have been developed to record daily
2013; Möller et al., 2014; Vuik et al., 2016). These systems        bed-level dynamics with high accuracy while reducing the
are known as dynamic biogeomorphic systems (Knox, 1972;             unit cost and labour during deployment (Hu et al., 2015).
Friedrichs, 2011; Fagherazzi et al., 2012). Their bed form          These sensors have been applied in the field at 10 sites in
is continuously shaped by the interactions between physi-           the Netherlands (Westerschelde and Wadden Sea), Belgium
cal and biological processes, including tidal currents, wind        (Zeeschelde), and the United Kingdom (Thames and Humber
waves, and sediment delivery, as well as bioturbation and           estuaries) from a number of previous studies (Hu et al., 2017;
bioaggregation, which jointly determine the time evolution          Willemsen et al., 2018; Belliard et al., 2019). This paper
of these systems (Le Hir et al., 2000; Yang et al., 2008;           presents a comprehensive collection of the existing SED sen-
Green and Coco, 2014; Dai et al., 2016, 2018; D’Alpaos et           sor dataset. It is expected to provide an opportunity to assist
al., 2016). Evaluating the impact of changing sea level and         future studies on intertidal biogeomorphic processes as it of-
increasing storminess on these valuable coastal ecosystems          fers (i) high-temporal-resolution (daily) bed-level changes;
is of high socioeconomic importance (Mariotti and Fagher-           (ii) long temporal coverage, i.e. 9–20 months depending on
azzi, 2010; Temmerman and Kirwan, 2015; Schuerch et al.,            the site; (iii) large spatial coverage, i.e. multiple sensors de-
2018). More research is clearly needed to reveal the key bio-       ployed in both marshes and bare tidal flats across 10 sites;
geomorphic processes that control the persistence of these in-      and (iv) synchronized biophysical measurements, i.e. hydro-
tertidal ecosystems to enable an accurate assessment of their       dynamic measurements (water level, flow velocity, and sig-
resilience.                                                         nificant wave height), sediment properties (grain size, chloro-
   Recent studies have shown that short-term (daily- to             phyll a level, and organic matter content), and bathymetric–
seasonal-scale) hydrodynamic forcing and the related bed-           topographic profiles. In this paper, we present the full dataset
level changes exert a critical control on the (i) recruitment of    from 10 sites and briefly discuss the potential research ques-
marsh seedlings (Balke et al., 2014; Silinski et al., 2016; Cao     tions that can be addressed by exploring such datasets.
et al., 2018) and benthic invertebrates (Bouma et al., 2001;
Nambu et al., 2012), (ii) initiation of marsh lateral erosion       2   Site description
(Bouma et al., 2016), and (iii) position and dynamics of the
existing marsh edge (Willemsen et al., 2018; Evans et al.,          The dataset includes 10 observation sites from northwestern
2019). Large spatial (e.g. dense vegetation vs. bare) and tem-      Europe: seven sites from the Netherlands, one site from Bel-
poral (e.g. stormy vs. calm) variation in bed-level changes         gium, and two sites from the United Kingdom (Fig. 1). For all
has been observed in intertidal systems (Spencer et al., 2016;      seven Dutch sites, sites 1–6 are in the Westerschelde estuary,
Hu et al., 2017). Thus, to better understand intertidal bed-        and only site 7 is in the Wadden Sea region. Near Zuidgors in
level change and its impact on biogeomorphic evolution, bed-        the Westerschelde, there are two sites (sites 1 and 2). At site 1
level change data at a high resolution and with sufficient spa-     (Zuidgors A), only the bare tidal flat was monitored, whereas
tiotemporal coverage are needed. However, such data to sup-         at site 2 (Zuidgors B), both the bare tidal flat and marsh area
port theory and model development are scarce. For instance,         were included in the monitoring. The only Belgian site (site
we are lacking the ability to model cyclic marsh expansion–         8 at Galgeschoor) is located in the Zeeschelde estuary, which
retreat dynamics, since the existing data are insufficient to       is the upstream part of the Westerschelde estuary. Site 8 has
derive tipping points that lead to the expansion–retreat phase      two observational transects: north and south transects with

Earth Syst. Sci. Data, 13, 405–416, 2021                                              https://doi.org/10.5194/essd-13-405-2021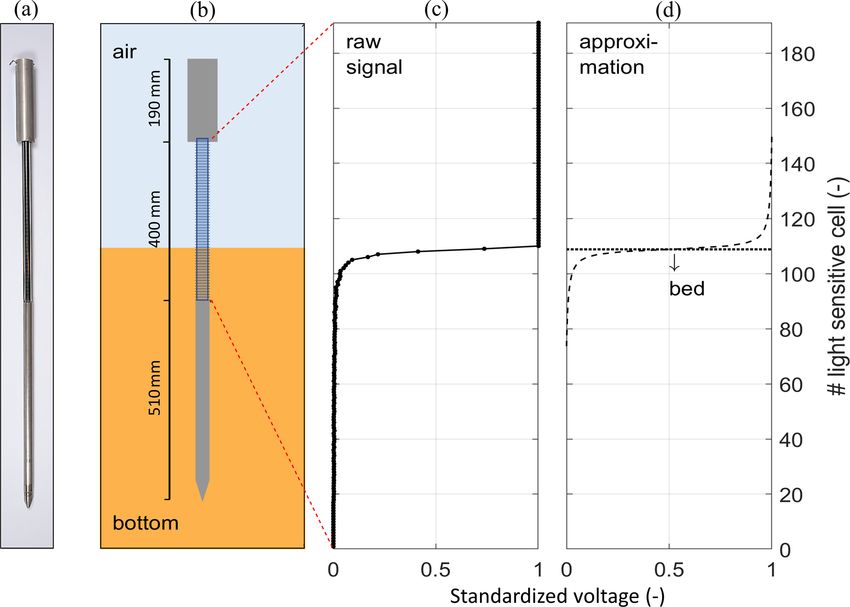
Z. Hu et al.: High-resolution bed-level change data in intertidal areas                                                       407

different bathymetries. The two British sites, site 9 (Tilling-    ice age, with values in the order of less than 1 or a few mil-
ham) and 10 (Donna Nook), are on the southeastern coast of         limetres over the considered time periods (Vink et al., 2007),
England (Fig. 1).                                                  and therefore these values are mostly much less than those of
   Overall, these 10 sites cover areas of differing tidal range,   vertical bed-level changes recorded by the SED sensors.
wave exposure, sediment grain size, and marsh vegetation              As the sensor is dependent on the presence of daylight, the
species (Table 1). Notably, site 10 (Donna Nook) has the           measuring window is daytime during low tide. Data acquired
largest tidal range (6.9 m), whereas site 9 (Tillingham) has       while the sensors were submerged or during night were ex-
highest wave exposure. The observations were conducted             cluded from the analysis. For most of the time, SED sen-
in the period 2013–2017. The duration of the observation           sors provided at least one measurement every day, i.e. daily
at each site varies from 9 to 20 months (Table 1). At all          temporal resolution. To avoid recording bed-level data when
sites, bed-level changes were monitored daily with multiple        sensors were submerged, an effective measuring window was
SED sensors. For all sites except sites 1, 4, and 8, SED sen-      set as 2 h around low tide. The tidal fluctuation of water level
sors were deployed on both bare flat and marsh areas. The co-      was recorded by pressure sensors deployed close to SED sen-
ordinates of the monitoring stations as well as the bathymetry     sors. In such a window, we used the averaged readings as a
of the measuring transects were measured by real-time kine-        bed-level observation point.
matic Global Positioning System (RTK-GPS) instruments                 The accuracy of the sensors has been compared to a pre-
with an accuracy of 15 mm in the vertical and 10 mm in the         cise manual method (i.e. sedimentation–erosion bar) (Hu
horizontal. Besides the daily bed-level observation, biophys-      et al., 2015). The manual measurements were conducted
ical measurements were available at some sites, i.e. water         weekly from 13 June to 17 July 2014 at the second most
level, wave height, current velocity, surface sediment grain       seaward measuring station of site 1 (Zuidgors A). These ob-
size, and chlorophyll a level as well as organic matter con-       servations serve as an independent quality control of our au-
tent.                                                              tomatic SED sensor measurements. Good agreement (R 2 =
                                                                   0.89) has been obtained between these two methods (detailed
                                                                   in Hu et al., 2015). The estimated operational accuracy of the
3     Method
                                                                   SED sensors is 5.0 mm with a 3.9 mm standard deviation.
3.1    Bed-level change observation
                                                                   Additionally, good agreement between the SED sensors and
                                                                   sedimentation–erosion bar measurements has been obtained
The bed-level dynamics at each site were monitored using           at site 8 (Galgeschoor) over an 18-month parallel measure-
recently developed SED sensors (Hu et al., 2015; see Fig. 2).      ment (Belliard et al., 2019).
These sensors are stand-alone instruments with all parts for
measuring and data logging and include batteries enclosed in       3.2   Hydrodynamics measurements
a transparent tube. The measuring part is an array of light-
sensitive cells that measure light intensity. When in use, a       Bed-level changes in the intertidal environment are closely
sensor is inserted vertically into the bed, leaving about half     related to the local hydrodynamic forcing. We measured hy-
of the measuring array above the bed. The cells above and be-      drodynamic parameters of water level, wave height, and tidal
low the bed receive different amount of the daylight, which        current velocity simultaneously with the bed-level measure-
will lead to different voltage outputs in the array of cells. By   ment at some of our observation sites (Table 1). To mea-
using an autonomous script, the noise in the raw signal is         sure the water level and wave height, we deployed pres-
reduced, and the bed level is determined as where the large        sure sensors 0.05–0.10 m above the bed in the vicinity of the
transition from high to low voltage occurred (Fig. 2d; see         SED sensors at some of the sites (see Table 1). At sites 1,
Willemsen et al., 2018). When bed accretion or erosion oc-         3, 4, and 6, OSSI-010-003C pressure sensors (Ocean Sensor
cur, the transition point moves up or down in the measuring        Systems, Inc.) were used to measure pressure at a frequency
array. Thus, by recording the changes of the transition point,     of 5 Hz over a period of 7 min, with a 15 min interval. The
we can measure the bed-level changes. In some cases, scour-        mean water level is determined by the mean pressure in an
ing holes occurred around some of the deployed SED sen-            interval. The significant wave height (Hs ) and peak wave pe-
sors, with the maximum depth of 5 cm. They typically result        riod (Tp ) were derived from the dynamic wave pressure sig-
in two transition points in the array, corresponding to the bot-   nals. The attenuation of pressure signals with water depth
tom and the top of the scouring holes. In such cases, the bed      was corrected using the standard calculation methods as de-
level was determined as the vertical position at the top of the    scribed in Tucker and Pitt (2001). The attenuation correction
scouring holes. Details of SED sensor data processing are          was only applied over the frequency range 0.05–0.4 Hz, and
included in Willemsen et al. (2018). We note that the SED          the maximum correction factor was set as 5 to avoid over-
technique does not include effects of deep subsoil subsidence      amplification of high-frequency signals (i.e. noise). A de-
on bed-level changes. For a typical deployment period of the       tailed description and the source of the data-processing rou-
SED sensors (10–15 months), subsidence in the study areas          tines can be found at http://neumeier.perso.ch/matlab/waves.
is mainly related to glacial isostatic adjustment after the last   html (last access: 28 January 2021). At sites 2, 5, 9, and 10,

https://doi.org/10.5194/essd-13-405-2021                                             Earth Syst. Sci. Data, 13, 405–416, 2021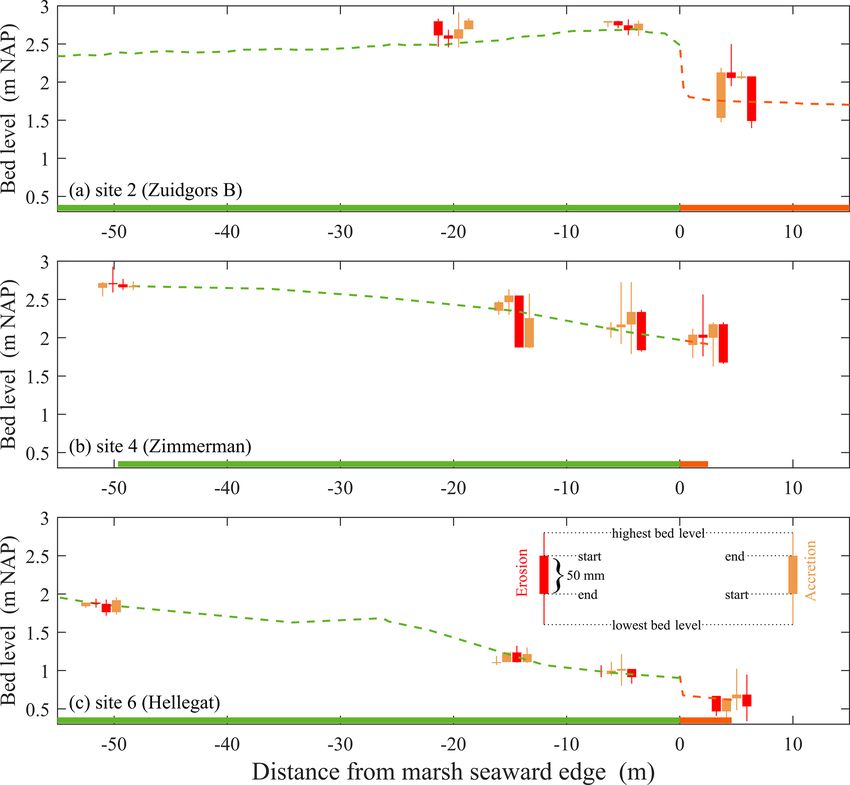
Z. Hu et al.: High-resolution bed-level change data in intertidal areas
https://doi.org/10.5194/essd-13-405-2021
Table 1. An overview of the observation sites in the Netherlands (NL), Belgium (BE), and the United Kingdom (UK). Please note that the date format in this table is year month
(yyyy.mm).
Country Site name, estuary Latitude, SED sensor D50 mean Tidal range Mean value of the SED sensor deployments Vegetation Biophysical
longitude time period [spatial variations] (m) significant wave height relative to the species measurementsb
(µm) [standard deviation] (cm) marsh edge (m)a
NL (1) Zuidgors A, Westerschelde 51◦ 230 15.6100 N, 2013.10–2015.1 72.3 [17.3–234.4] 4.3 8 [8] 15, 64, 109, 150, 233, 308, Spartina D50 , Hs , WL, Vel
3◦ 490 43.4600 E 329, 346, 379 anglica,
Salicornia
europaea
(2) Zuidgors B, Westerschelde 51◦ 230 21.9500 N, 2015.9–2016.9 39.2 [17.8–57.1] 4.3 8 [8] −20, −0.5, 5, 25, 60, 100, Spartina D50 , chl a
3◦ 500 7.5100 E 155 anglica,
Salicornia
europaea
(3) Baarland, Westerschelde 51◦ 230 49.5600 N, 2013.10–2015.1 26.8 [12.9–49.4] 4.1 1 [1] 12, 29, 38 Spartina D50 , Hs , WL, Vel
3◦ 520 51.6300 E anglica,
Salicornia
europaea
(4) Zimmerman, Westerschelde 51◦ 240 8.0500 N, 2015.1–2016.5 85.0 [66.7-96.5] 4.9 10 [7] −50, −15, −5, 5 Spartina D50 , Hs , WL
4◦ 100 32.1500 E anglica,
Salicornia
europaea
(5) Paulina, Westerschelde 51◦ 200 59.7300 N, 2014.12–2015.8 35.2 [20.9-57.5] 4.1 5 [3]c −42.5, −25.5, −17.5, Spartina D50 , chl a
3◦ 430 3.3700 −2.5, 22.5, 47.5, 127.5 anglica,
Salicornia
europaea
(6) Hellegat, Westerschelde 51◦ 210 59.3300 N, 2015.1–2016.5 123.2 [113.4–131.8] 4.2 11 [8] −50, −15, −5, 5 Spartina D50 , Hs , WL
3◦ 560 44.6700 E anglica,
Salicornia
europaea
(7) Uithuizen, Wadden Sea 53◦ 270 24.5700 N, 2015.3–2016.4 87d 4.0 7 [8] −15, −10, −5, 2.5 Salicornia WL
6◦ 390 32.0700 E europaea,
Puccinellia
maritima,
Spartina
anglica
BE (8) Galgeschoor, Zeeschelde 51◦ 190 6.4100 N, 2015.10–2017.5 57.5 [28.6–259.1] 5.2 7 [2] 10, 150 (north transect) Phragmites D50 , Hs , WL, Vel, OC
Earth Syst. Sci. Data, 13, 405–416, 2021
4◦ 160 51.2200 E (north 9, 135 (south transect) australis
transect)
51◦ 180 32.2100 N,
4◦ 160 54.8200 E
(south transect)
UK (9) Tillingham, Thames 51◦ 410 40.3700 N, 2015.7–2016.7 25.6 [7.0–70.4] 4.8 17 [8] −5, 7.5, 40, 52.5, 125, 130 Puccinellia D50 , Hs , WL, chl a
0◦ 560 32.8000 E maritima,
Spartina
anglica,
Salicornia
europaea
(10) Donna Nook, Humber 53◦ 290 28.2000 N, 2015.1–2015.10 171.4 [30.6–258.2] 6.9 6 [5] −2.5, 17.5, 35, 40, 45, 50 Puccinellia D50 , Hs , WL, chl a
0◦ 60 56.8500 E maritima,
Spartina an-
glica, Atriplex
portulacoides
a Positive or negative values mean the deploy locations are in the seaward or landward direction of the marsh edges. The exact GPS coordinates of the SED sensor deployment are included in the data file. b Biophysical measurements include: water level (WL), significant wave height (H ), tidal current
s
velocity (Vel), medium grain size (D50 ), organic carbon in sediment (OC), and chlorophyll a level (chl a ) of the surface sediment. c These data are from Callaghan et al. (2010). d These data are from Folmer et al. (2017).
408Z. Hu et al.: High-resolution bed-level change data in intertidal areas 409 Figure 1. Locations and an overview of the observation sites in the Westerschelde and Wadden Sea in the Netherlands, Zeeschelde in Belgium, and the Thames and Humber estuaries in the United Kingdom. The lower 10 panels are the deployments of the SED sensor stations (white dots) at the observation sites. The GPS coordinates of all SED sensor stations are included in the data file. In panel 8, the maps of the north and south measuring transects at site 8 (Galgeschoor) are bordered by a red dot line. Source of aerial images: © Google Earth. pressure sensors (series PDCR 1830, Druck Ltd.) were used. used. The measuring frequency was 16 Hz for the PDCR sen- Pressure was recorded at 4 Hz for 4096 readings (∼ 17 min) sors and 20 Hz for the OSSI-010-003C sensors. More details around high-tide slack water, as determined by an onboard on the sensor deployments at site 8 are included in Belliard algorithm on the data logger (Möller et al., 1999). This typi- et al. (2019). cally results in one set of wave parameters per tide. For site 8, At sites without pressure sensor measurements, the water- both OSSI-010-003C and PDCR 1830 pressure sensors were level data were obtained by nearby tidal gauge stations op- https://doi.org/10.5194/essd-13-405-2021 Earth Syst. Sci. Data, 13, 405–416, 2021
410 Z. Hu et al.: High-resolution bed-level change data in intertidal areas
Figure 2. A photo (a) and schematization (b) of an SED sensor in operation. The sensor uses an array of light-sensitive cells to determine
the position of the bed level, resulting in a transection in the raw voltage output of the array (c). The noise in the raw signal is reduced, and
the bed level is obtained by approximating the signal by an autonomous script (d). Details of SED sensor data processing are included in
Willemsen et al. (2018).
erated by Rijkswaterstaat (the Directorate-General for Pub- ing procedures that were used to determine chlorophyll a are
lic Works and Water Management, the Netherlands) or the described in Willemsen et al. (2018). Additionally, at site 8,
British Oceanographic Data Centre (BODC). These data organic matter content was determined for the upper 2 cm of
were obtained from Terneuzen (for site 2 at Zuidgors B and surface sediment samples by loss on ignition.
site 5 at Paulina) and Eemshaven (for site 7 at Uithuizen)
with 10 min interval. For site 9 (Tillingham) and site 10
(Donna Nook), water-level data were obtained at the stations 4 Data description
at Sheerness and Immingham with a 15 min interval. Tidal
4.1 Daily bed-level changes with storm events
current velocity was measured by acoustic Doppler current
profilers (ADCPs, Nortek Aquadopp) with a 5 or 10 min in- At our study sites, daily bed-level observations were con-
terval at sites 1, 3, and 8. Additionally, near-bed 3D current ducted for 9–20 months, which includes conditions with vari-
velocities were measured at site 8 using two acoustic Doppler ous hydrodynamic forcing. As an example, we show the daily
velocimeters (ADVs, Nortek Vector). All hydrodynamic data bed-level change and the accompanying wave height at site
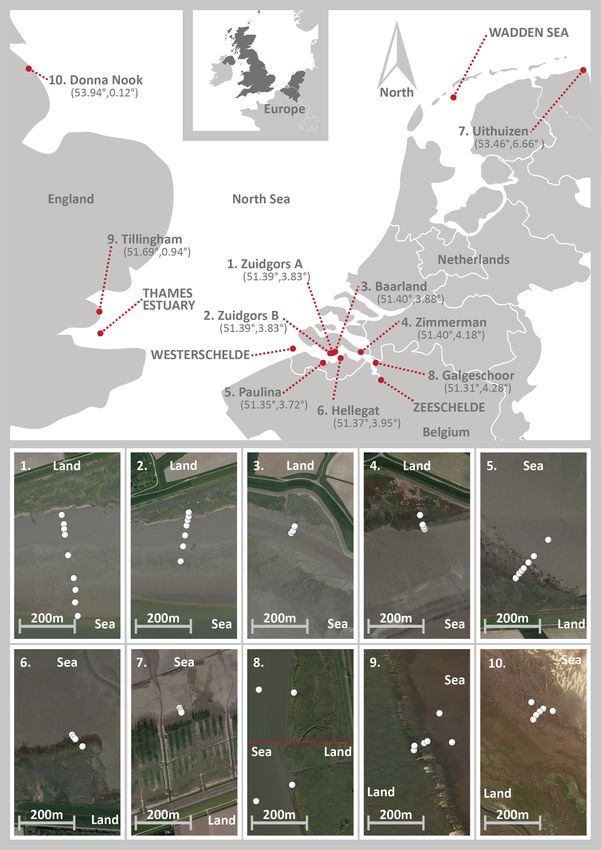
are included in the current dataset. 4 (Zimmerman) and site 6 (Hellegat) from February 2015 to
May 2016 (Fig. 3). Waves in front (5 m) of the marsh cliffs
3.3 Sediment grain size and chlorophyll a monitoring at site 4 (Zimmerman) were generally smaller than at site 6
(Hellegat) (Fig. 3b vs. 3d). Additionally, at both sites, there
To determine the median bed sediment grain size (D50 ), sur- was a strong reduction in wave height from the bare tidal
face sediment samples (upper 2–3 cm) were collected at most flats into the marshes (Fig. 3a vs. 3b and 3c vs. 3d). We ob-
of the sites (see Table 1). D50 of these samples was measured served that the bed-level fluctuation was more apparent on
by a Malvern laser particle sizer. The chlorophyll a level in the bare tidal flats than in the marshes. Over the whole obser-
the sediment is an indicator for diatom biomass. Diatoms vation period, the bed-level fluctuation on the bare tidal flat
act as bio-stabilizers on tidal flats by producing extracellular was in the order of 5 cm at both sites, whereas bed level in
polymeric substances (EPSs) and as such can affect sediment the marshes stayed stable (station 1 of site 6) or experienced
bed-level dynamics (Underwood and Paterson 1993; Austen mild accretion (station 1 of site 4).
et al., 1999; Andersen et al., 2005). At sites 2, 5, 9, and 10, Notably, a number of storm events with high incident
chlorophyll a samples were collected from the upper 1 cm waves were captured during our measurements. During the
of the sediment using a small cut-off syringe. The process- two storm events in November 2015, Hs (significant wave
Earth Syst. Sci. Data, 13, 405–416, 2021 https://doi.org/10.5194/essd-13-405-2021Z. Hu et al.: High-resolution bed-level change data in intertidal areas 411 Figure 3. Time series of the bed-level change and significant wave height (Hs ) at site 4 (Zimmerman; a, b, e, g) and site 6 (Hellegat; c, d, f, h). The top four planes (a–d) are the entire dataset of four measuring stations from these two sites. Those of station 4 are on a bare tidal flat (5 m seaward of the marsh edge), whereas those of station 1 are in the marsh (50 m landward of the marsh edge). The gaps in the bed-level time series were due to temporary sensor failures. The lower four planes are the enlarged plots of the stormy period in November– December 2015. The dark grey shaded areas indicate bed-level changes during two storm events (13–17 November and 27 November–1 December 2015). https://doi.org/10.5194/essd-13-405-2021 Earth Syst. Sci. Data, 13, 405–416, 2021
412                                                        Z. Hu et al.: High-resolution bed-level change data in intertidal areas

Figure 4. Seasonal bed-level changes at (a) site 2 (Zuidgors B), (b) site 4 (Zimmerman), and (c) site 6 (Hellegat) with bathymetry data
(dashed green line). At each SED sensor station, the four bars from left to right indicate bed-level changes in spring (March–May), summer
(June–August), autumn (September–November), and winter (December–February). The red bars indicate net erosion, and the yellow bars
indicate net accretion. The observed highest and lowest bed levels in a season are indicated by the top and bottom of the bars.

height) exceeded 0.6 m on the bare flat stations at both site 4        show complex spatiotemporal variations (Fig. 4). Our data
and site 6 (Fig. 3g and h), whereas the mean Hs at the most            show that all stations at these three sites have alternating ero-
seaward pressure sensors over the whole observation period             sion and accretion seasons. There is no consistent seasonal
was 0.104 and 0.113 m at these two stations, respectively.             erosion–accretion pattern for all stations. Winter is a typical
During the two storm events, sudden erosion of 2–3 cm                  season of bed erosion for stations on the bare flat but not for
occurred on the two bare flat stations. However, bed-level             the stations in marshes.
changes at the two marsh stations remained small (0.025 and               Spatially, bed-level variations were generally smaller at
0.05 m at sites 4 and 6, respectively). Across the 10 sites, the       the landward stations in the marshes and increased towards
most severe short-term erosion was observed at site 1 (Zuid-           the seaward stations at all three sites. We further observed
gors A) on 27 and 28 October 2013 during the St. Jude storm            that the most seaward station at site 4 (Zimmerman) experi-
(Hu et al., 2015). In that event, severe bed erosion of 10.5 cm        enced net erosion over an annual timescale, whereas stations
depth was captured by our SED sensor on one of the bare flat           at the other two sites were in equilibrium; i.e. the degree of
stations at site 1 (data not shown).                                   erosion was comparable to accretion. Profile elevation data
                                                                       show that marsh cliffs were distinct at site 2 (Zuidgors B) and
                                                                       site 6 (Hellegat), with the cliff height being 0.88 and 0.35 m,
4.2   Seasonal bed-level changes and biophysical
                                                                       respectively, whereas a cliff was absent at site 4 (Zimmer-
      changes
                                                                       man) (Fig. 4). Notably, the magnitude of bed-level changes
Our observations at most sites were longer than 12 months.             reduced from bare flat stations to the stations on the marsh
Thus, seasonal bed-level changes were captured in our                  plateaus at sites with marsh cliffs (sites 2 and 6), whereas
dataset. Examples of seasonal bed-level changes at site 2              there was no clear difference between the bare flat station
(Zuidgors B), site 4 (Zimmerman), and site 6 (Hellegat)

Earth Syst. Sci. Data, 13, 405–416, 2021                                                  https://doi.org/10.5194/essd-13-405-2021
Z. Hu et al.: High-resolution bed-level change data in intertidal areas 413
Figure 6. Spatiotemporal variation of the chlorophyll a level in sur-
face sediment (top 1 cm) at site 2 (Zuidgors B).
5 Data availability
Figure 5. Median grain size of surface sediment (D50 ) measured All data presented in this paper are available
along cross-shore transects of six study sites in the Westerschelde from 4TU.ResearchData (see Hu et al., 2020;
estuary. https://doi.org/10.4121/12693254.v4). The repository
includes data as well as instructions in readme files. Addi-
tionally, we expect that the current repository will expand
and the neighbouring marsh station at the site without cliffs with additional SED sensor data from ongoing as well as
(site 4). planned future observation programmes including mangrove
wetlands, e.g. ANCODE project (Applying nature-based
4.3 Surface sediment characteristics coastal defence to the world’s largest urban area – from
science to practice; https://www.noc.ac.uk/projects/ancode,
Out of six sites with surface sediment grain size measure-
last access: 29 January 2021).
ments, two sites (sites 4 and 6) in the Westerschelde had
the largest median sediment grain size (Fig. 5). At these two
sites, D50 of the surface sediment was in the range of 66.7– 6 Conclusions
131.8 µm, which was significantly coarser than the rest of
the shown sites (p = 0 < 0.05). Within each site, there was By applying the novel high-resolution SED sensors, we were
no apparent difference in D50 between the marsh and bare able to perform long-term (e.g. a few months to a few
flat stations around the marsh edge (50 m seaward and land- years) monitoring of the bed elevation changes at daily fre-
ward to the marsh edge). However, there was a gentle trend quency. Our observations have been carried out at 10 sites
of coarsening from the landward to the seaward stations on in three countries in western Europe for a long duration (9–
bare flats. 20 months). To our knowledge, the current dataset is the
Chlorophyll a levels in surface sediment, a proxy for the most complete and comprehensive to date on high-resolution
diatom biomass and their bio-stabilization effect, were also (daily) intertidal bed-level changes.
obtained at some of our observation sites (Table 1). The The SED sensor data have been proven to be useful in
chlorophyll a levels at site 2 (Zuidgors B) showed great tem- revealing the relations between hydrodynamic forcing and
poral variability (Fig. 6). For all stations, the chlorophyll a intertidal bed-level dynamics (Hu et al., 2018; Belliard et
levels were generally low in winter (January) but reached al., 2019) and understanding the spatial variations in bed-
their maximum at the end of the spring (May). However, level dynamics from tidal flats to salt marshes (Wang et al.,
there was no clear spatial pattern in the chlorophyll a lev- 2017; Willemsen et al., 2018; Baptist et al., 2019). The pre-
els across different stations, as the marsh stations had similar sented dataset may be of further use to the scientific com-
levels compared to the bare flat stations. munity for addressing several research questions: in partic-
ular, our dataset can be used to provide insights into storm
impacts on intertidal morphology and post-storm recovery
(Leonardi et al., 2018), as the dataset pinpoints a number of
storm events with precise pre- and post-storm bed-level ob-
https://doi.org/10.5194/essd-13-405-2021 Earth Syst. Sci. Data, 13, 405–416, 2021414 Z. Hu et al.: High-resolution bed-level change data in intertidal areas
servations, which are otherwise difficult to measure by dis- Financial support. This research has been supported by a joint
continuous manual methods. Furthermore, our dataset can research project of the National Natural Science Foundation of
be used to better understand biogeomorphic interactions in China (no. 51761135022), NWO (no. ALWSD.2016.026), and EP-
intertidal environments, which are important for marsh per- SRC (no. EP/R024537/1; Sustainable Deltas) and a project from
sistence, e.g. the control of short-term bed-level changes on the Guangdong Provincial Department of Science and Technology
(no. 2019ZT08G090). Ben Evans and Iris Möller received support
marsh seedling establishment (Bouma et al., 2016; Cao et
from the UK NERC RESIST project (grant no. NE/R01082X/1) for
al., 2018), and the influence of marsh vegetation on sedi- input into the paper preparation and writing process.
ment deposition (Yang et al., 2008; Schwarz et al., 2015;
D’Alpaos and Marani, 2016). Lastly, our dataset may sup-
port morphodynamic-model developments. Due to the lack Review statement. This paper was edited by François Schmitt
of relevant data, existing intertidal morphological models and reviewed by Edward Anthony and Alvise Finotello.
rarely deal with daily morphological changes. The presented
dataset contains high-resolution data across 10 sites with var-
ious spatially (marsh vs. bare flat) and temporally (calm vs.
stormy) varying conditions, which is valuable for model de-
References
velopment and evaluation. In addition to process-based mor-
phodynamic models (e.g. Delft3D; Lesser et al., 2004), this Andersen, T. J., Lund-Hansen, L. C., Pejrup, M., Jensen,
dataset can be of special interest to data-driven models based K. T., and Mouritsen, K. N.: Biologically induced differ-
on machine learning techniques. Recent developments of ences in erodibility and aggregation of subtidal and in-
the latter have shown great potential in resolving complex tertidal sediments: a possible cause for seasonal changes
coastal morphodynamics (see a recent review in Goldstein in sediment deposition, J. Marine Syst., 55, 123–138,
et al., 2019). Therefore, the present dataset is expected to ad- https://doi.org/10.1016/j.jmarsys.2004.09.004, 2005.
vance our understanding and prediction of tidal flat evolution Andersen, T. J., Pejrup, M., and Nielsen, A. A.: Long-term and
and resilience. high-resolution measurements of bed level changes in a tem-
perate, microtidal coastal lagoon, Mar. Geol., 226, 115–125,
https://doi.org/10.1016/j.margeo.2005.09.016, 2006.
Author contributions. ZH, DV, and TB developed the SED sen- Austen, I., Andersen, T. J., and Edelvang, K.: The Influence of Ben-
sor. ZH, PWJMW, BWB, DvdV, ZZ, BO, VV, BE, IM, JPB, AVB, thic Diatoms and Invertebrates on the Erodibility of an Intertidal
ST, and TJB collected the raw data. PWJMW and HW processed Mudflat, the Danish Wadden Sea, Estuar. Coast. Shelf S., 49, 99–
the data and graphs. ZH, CW, and HW prepared the paper with con- 111, https://doi.org/10.1006/ecss.1998.0491, 1999.
tributions from all authors. Balke, T., Herman, P. M. J., and Bouma, T. J.: Critical tran-
sitions in disturbance-driven ecosystems: Identifying win-
dows of opportunity for recovery, J. Ecol., 102, 700–708,
https://doi.org/10.1111/1365-2745.12241, 2014.
Competing interests. The authors declare that they have no con-
Baptist, M. J., Gerkema, T., van Prooijen, B. C., van Maren,
flicts of interest.
D. S., van Regteren, M., Schulz, K., Colosimo, I., Vroom, J.,
van Kessel, T., Grasmeijer, B., Willemsen, P., Elschot, K., de
Groot, A. V., Cleveringa, J., van Eekelen, E. M. M., Schuur-
Acknowledgements. The authors gratefully acknowledge finan- man, F., de Lange, H. J., and van Puijenbroek, M. E. B.: Ben-
cial support of a joint research project of the National Natural eficial use of dredged sediment to enhance salt marsh develop-
Science Foundation of China (no. 51761135022), NWO (no. AL- ment by applying a “Mud Motor,” Ecol. Eng., 127, 312–323,
WSD.2016.026), and EPSRC (no. EP/R024537/1; Sustainable https://doi.org/10.1016/j.ecoleng.2018.11.019, 2019.
Deltas) and a project from the Guangdong Provincial Department Belliard, J.-P., Silinski, A., Meire, D., Kolokythas, G., Levy, Y.,
of Science and Technology (no. 2019ZT08G090). The dataset of Van Braeckel, A., Bouma, T. J., and Temmerman, S.: High-
Zuidgors A and Baarland was obtained as a part of the STW NWO resolution bed level changes in relation to tidal and wave forc-
project (grant no. 07324). The dataset of Hellegat and Zimmer- ing on a narrow fringing macrotidal flat: Bridging intra-tidal,
man were obtained as part of the NWO-funded project BE-SAFE daily and seasonal sediment dynamics, Mar. Geol., 412, 123–
(grant no. 850.13.011). The dataset of Zuidgors B, Paulina, Till- 138, https://doi.org/10.1016/j.margeo.2019.03.001, 2019.
ingham, and Donna Nook was obtained as part of the EU FP7- Bouma, H., Duiker, J. M. C., De Vries, P. P., Herman, P. M. J.,
funded project FAST (Foreshore Assessment using Space Technol- and Wolff, W. J.: Spatial pattern of early recruitment of Macoma
ogy, grant no. 607131). Ben Evans and Iris Möller received support balthica (L.) and Cerastoderma edule (L.) in relation to sediment
from the UK NERC RESIST project (grant no. NE/R01082X/1) for dynamics on a highly dynamic intertidal sandflat, J. Sea Res., 45,
input into the paper preparation and writing process. The dataset 79–93, https://doi.org/10.1016/S1385-1101(01)00054-5, 2001.
of Galgeschoor was obtained in a project funded by Antwerp Port Bouma, T. J., van Belzen, J., Balke, T., van Dalen, J., Klaassen, P.,
Authority. Hartog, A. M., Callaghan, D. P., Hu, Z., Stive, M. J. F., Tem-
merman, S., and Herman, P. M. J.: Short-term mudflat dynamics
drive long-term cyclic salt marsh dynamics, Limnol. Oceanogr.,
61, 2261–2275, https://doi.org/10.1002/lno.10374, 2016.
Earth Syst. Sci. Data, 13, 405–416, 2021 https://doi.org/10.5194/essd-13-405-2021Z. Hu et al.: High-resolution bed-level change data in intertidal areas 415
Callaghan, D. P., Bouma, T. J., Klaassen, P., van der Wal, D., Stive, Green, M. O. and Coco, G.: Review of wave-driven sediment resus-
M. J. F., and Herman, P. M. J.: Hydrodynamic forcing on salt- pension and transport in estuaries, Rev. Geophys., 52, 77–117,
marsh development: Distinguishing the relative importance of https://doi.org/10.1002/2013RG000437, 2014.
waves and tidal flows, Estuar. Coast. Shelf Sci., 89, 73–88, 2010. Hu, Z., Lenting, W., van der Wal, D., and Bouma, T.
Cao, H., Zhu, Z., Balke, T., Zhang, L., and Bouma, T. J.: Effects J.: Continuous monitoring bed-level dynamics on an
of sediment disturbance regimes on Spartina seedling establish- intertidal flat: Introducing novel, stand-alone high-
ment: Implications for salt marsh creation and restoration, Lim- resolution SED-sensors, Geomorphology, 245, 223–230,
nol. Oceanogr., 63, 647–659, https://doi.org/10.1002/lno.10657, https://doi.org/10.1016/j.geomorph.2015.05.027, 2015.
2018. Hu, Z., van der Wal, D., Cai, H., van Belzen, J., and
Dai, Z., Fagherazzi, S., Mei, X., and Gao, J.: Decline Bouma, T. J.: Dynamic equilibrium behaviour observed
in suspended sediment concentration delivered by the on two contrasting tidal flats from daily monitoring
Changjiang (Yangtze) River into the East China Sea be- of bed-level changes, Geomorphology, 311, 114–126,
tween 1956 and 2013, Geomorphology, 268, 123–132, https://doi.org/10.1016/j.geomorph.2018.03.025, 2018.
https://doi.org/10.1016/j.geomorph.2016.06.009, 2016. Hu, Z., Willemsen, P. W. J. M., Borsje, B. W., Wang, C.,
Dai, Z., Mei, X., Darby, S. E., Lou, Y., and Li, W.: Flu- Wang, H., van der Wal, D., Zhu, Z., Oteman, B., Vuik, V.,
vial sediment transfer in the Changjiang (Yangtze) river- Evans, B., Möller, I., Belliard, J., Van Braeckel, A., Tem-
estuary depositional system, J. Hydrol., 566, 719–734, merman, S., and Bouma, T. J.: Synchronized high-resolution
https://doi.org/10.1016/j.jhydrol.2018.09.019, 2018. bed-level change and biophysical data from 10 tidal flats in
D’Alpaos, A. and Marani, M.: Reading the signa- northwestern Europe, [Data set], 4TU.Centre for Research Data
tures of biologic–geomorphic feedbacks in salt- https://doi.org/10.4121/12693254.v4, 2020.
marsh landscapes, Adv. Water Resour., 93, 265–275, Hu, Z., Yao, P., van der Wal, D., and Bouma, T. J.: Pat-
https://doi.org/10.1016/j.advwatres.2015.09.004, 2016. terns and drivers of daily bed-level dynamics on two tidal
D’Alpaos, A., Toffolon, M., and Camporeale, C.: Ecogeomorpho- flats with contrasting wave exposure, Sci. Rep.-UK, 7, 7088,
logical feedbacks of water fluxes, sediment transport and veg- https://doi.org/10.1038/s41598-017-07515-y, 2017.
etation dynamics in rivers and estuaries, Adv. Water Resour., Hunt, S., Bryan, K. R., Mullarney, J. C., and Pritchard, M.: Obser-
93, 151–155, https://doi.org/10.1016/j.advwatres.2016.05.019, vations of asymmetry in contrasting wave- and tidally-dominated
2016. environments within a mesotidal basin: implications for estuarine
Duarte, C., Losada, I. J., Hendriks, I., Mazarrasa, I., and Marba, morphological evolution, Earth Surf. Process. Landf., 41, 2207–
N.: The role of coastal plant communities for climate change 2222, https://doi.org/10.1002/esp.3985, 2016.
mitigation and adaptation, Nat. Clim. Change, 3, 961–968, Knox, J. C.: Valley Alluviation in Southwestern Wisconsin, Ann.
https://doi.org/10.1038/nclimate1970, 2013. Assoc. Am. Geogr., 62, 401–410, https://doi.org/10.1111/j.1467-
Evans, B. R., Möller, I., Spencer, T., and Smith, G.: Dynamics 8306.1972.tb00872.x, 1972.
of salt marsh margins are related to their three-dimensional Le Hir, P., Roberts, W., Cazaillet, O., Christie, M., Bassoullet, P.,
functional form, Earth Surf. Process. Landf., 44, 1816–1827, and Bacher, C.: Characterization of intertidal flat hydrodynamics,
https://doi.org/10.1002/esp.4614, 2019. Cont. Shelf Res., 20, 1433–1459, 2000.
Fagherazzi, S., Kirwan, M. L., Mudd, S. M., Guntenspergen, Leonardi, N., Camacina, I., Donatelli, C., Ganju, N. K.,
G. R., Temmerman, S., D’Alpaos, A., Van De Koppel, J., Plater, A. J., Schuerch, M., and Temmerman, S.: Dy-
Rybczyk, J. M., Reyes, E., Craft, C., and Clough, J.: Nu- namic interactions between coastal storms and salt
merical models of salt marsh evolution: Ecological, geomor- marshes: A review, Geomorphology, 301, 92–107,
phic, and climatic factors, Rev. Geophys., 50, 2011RG000359, https://doi.org/10.1016/j.geomorph.2017.11.001, 2018.
https://doi.org/10.1029/2011RG000359, 2012. Lesser, G. R., Roelvink, J. A., van Kester, J. A. T. M.,
Folmer, E., Dekinga, A., Holthuijsen, S., Van der Meer, J., Mosk, and Stelling, G. S.: Development and validation of a three-
D., Piersma, T., and van der Veer, H.: Species Distribution Mod- dimensional morphological model, Coast. Eng., 51, 883–915,
els of Intertidal Benthos: Tools for Assessing the Impact of Phys- https://doi.org/10.1016/j.coastaleng.2004.07.014, 2004.
ical and Morphological Drivers on Benthos and Birds in the Mariotti, G. and Fagherazzi, S.: A numerical model for
Wadden Sea, NIOZ, Texel, The Netherlands, available at: http: the coupled long-term evolution of salt marshes and
//www.vliz.be/imisdocs/publications/77/307577.pdf (last access: tidal flats, J. Geophys. Res.-Earth Surf., 115, F01004,
29 January 2021), 2017. https://doi.org/10.1029/2009JF001326, 2010.
Friedrichs, C. T.: Tidal Flat Morphodynamics: A Synthesis, Mcleod, E., Chmura, G. L., Bouillon, S., Salm, R., Bjork, M.,
in Treatise on Estuarine and Coastal Science, edited by Duarte, C. M., Lovelock, C. E., Schlesinger, W. H., and Sil-
Wolanski, E. and McLusky, D., Academic Press, Waltham, liman, B. R.: A blueprint for blue carbon: toward an im-
https://doi.org/10.1016/B978-0-12-374711-2.00307-7, 137–170, proved understanding of the role of vegetated coastal habi-
2011. tats in sequestering CO2 , Front. Ecol. Environ., 9, 552–560,
Goldstein, E. B., Coco, G., and Plant, N. G.: A review https://doi.org/10.1890/110004, 2011.
of machine learning applications to coastal sediment trans- Mcowen, C. J., Weatherdon, L. V., Van Bochove, J.-W., Sulli-
port and morphodynamics, Earth-Sci. Rev., 194, 97–108, van, E., Blyth, S., Zockler, C., Stanwell-Smith, D., Kingston,
https://doi.org/10.1016/j.earscirev.2019.04.022, 2019. N., Martin, C. S., Spalding, M., and Fletcher, S.: A
global map of saltmarshes, Biodivers. Data J., 5, e11764,
https://doi.org/10.3897/BDJ.5.e11764, 2017.
https://doi.org/10.5194/essd-13-405-2021 Earth Syst. Sci. Data, 13, 405–416, 2021416 Z. Hu et al.: High-resolution bed-level change data in intertidal areas Möller, I., Spencer, T., French, J. R., Leggett, D. J., and Dixon, Tucker, M. J. and Pitt, E. G.: Waves in Ocean Engineering, 1st Edn., M.: Wave transformation over salt marshes: A field and numeri- Elsevier Science, Amsterdam, New York, 2001. cal modelling study from north Norfolk, England, Estuar. Coast. Underwood, G. J. C. and Paterson, D. M.: Recovery of in- Shelf Sci., 49, 411–426, https://doi.org/10.1006/ecss.1999.0509, tertidal benthic diatoms after biocide treatment and associ- 1999. ated sediment dynamics, J. Mar. Biol. Assoc. UK, 73, 25, Möller, I., Kudella, M., Rupprecht, F., Spencer, T., Paul, M., van https://doi.org/10.1017/s002531540003263x, 1993. Wesenbeeck, B. K., Wolters, G., Jensen, K., Bouma, T. J., Van Eerden, M. R., Drent, R. H., Stahl, J., and Bakker, J. P.: Miranda-Lange, M., and Schimmels, S.: Wave attenuation over Connecting seas: western Palaearctic continental flyway for wa- coastal salt marshes under storm surge conditions, Nat. Geosci., ter birds in the perspective of changing land use and climate, 7, 727–731, https://doi.org/10.1038/ngeo2251, 2014. Glob. Change Biol., 11, 894–908, https://doi.org/10.1111/j.1365- Nambu, R., Saito, H., Tanaka, Y., Higano, J., and Kuwahara, H.: 2486.2005.00940.x, 2005. Wave actions and topography determine the small-scale spa- Vink, A., Steffen, H., Reinhardt, L., and Kaufmann, G.: tial distribution of newly settled Asari clams Ruditapes philip- Holocene relative sea-level change, isostatic subsidence and pinarum on a tidal flat, Estuar. Coast. Shelf Sci., 99, 1–9, 2012. the radial viscosity structure of the mantle of north- Schuerch, M., Spencer, T., Temmerman, S., Kirwan, M. L., Wolff, west Europe (Belgium, the Netherlands, Germany, south- C., Lincke, D., McOwen, C. J., Pickering, M. D., Reef, R., Vafei- ern North Sea), Quaternary Sci. Rev., 26, 3249–3275, dis, A. T., Hinkel, J., Nicholls, R. J., and Brown, S.: Future re- https://doi.org/10.1016/j.quascirev.2007.07.014, 2007. sponse of global coastal wetlands to sea-level rise, Nature, 561, Vuik, V., Jonkman, S. N., Borsje, B. W., and Suzuki, T.: Nature- 231–234, https://doi.org/10.1038/s41586-018-0476-5, 2018. based flood protection: The efficiency of vegetated foreshores for Schwarz, C., Bouma, T. J., Zhang, L. Q., Temmerman, reducing wave loads on coastal dikes, Coast. Eng., 116, 42–56, S., Ysebaert, T., and Herman, P. M. J.: Interactions be- https://doi.org/10.1016/j.coastaleng.2016.06.001, 2016. tween plant traits and sediment characteristics influenc- Wang, H., van der Wal, D., Li, X., Belzen, J. V., Herman, P. M. J., ing species establishment and scale-dependent feedbacks Hu, Z., Ge, Z., Zhang, L., and Bouma, T. J.: Zooming in and out: in salt marsh ecosystems, Geomorphology, 250, 298–307, scale-dependence of extrinsic and intrinsic factors affecting salt https://doi.org/10.1016/j.geomorph.2015.09.013, 2015. marsh erosion, J. Geophys. Res.-Earth Surf., 122, 1455–1470, Shi, B. W., Yang, S. L., Wang, Y. P., Yu, Q., and Li, https://doi.org/10.1002/2016JF004193, 2017. M. L.: Intratidal erosion and deposition rates inferred from Whitehouse, R. J. S. and Mitchener, H. J.: Observations of the field observations of hydrodynamic and sedimentary pro- morphodynamic behaviour of an intertidal mudflat at differ- cesses: A case study of a mudflat-saltmarsh transition at ent timescales, Geol. Soc. Lond. Spec. Publ., 139, 255–271, the Yangtze delta front, Cont. Shelf Res., 90, 109–116, https://doi.org/10.1144/GSL.SP.1998.139.01.21, 1998. https://doi.org/10.1016/j.csr.2014.01.019, 2014. Willemsen, P. W. J. M., Borsje, B. W., Hulscher, S. J. M. H., Van der Silinski, A., van, B., Fransen, E., Bouma, T. J., Troch, P., Wal, D., Zhu, Z., Oteman, B., Evans, B., Moller, I., and Bouma, Meire, P., and Temmerman, S.: Quantifying critical condi- T. J.: Quantifying Bed Level Change at the Transition of Tidal tions for seaward expansion of tidal marshes: A transplan- Flat and Salt Marsh: Can We Understand the Lateral Location of tation experiment, Estuar. Coast. Shelf Sci., 169, 227–237, the Marsh Edge?, J. Geophys. Res.-Earth Surf., 123, 2509–2524, https://doi.org/10.1016/j.ecss.2015.12.012, 2016. https://doi.org/10.1029/2018JF004742, 2018. Spencer, T., Möller, I., Rupprecht, F., Bouma, T. J., Wesenbeeck, B. Yang, S. L., Li, H., Ysebaert, T., Bouma, T. J., Zhang, W. X., Wang, K. van, Kudella, M., Paul, M., Jensen, K., Wolters, G., Miranda- Y. Y., Li, P., Li, M., and Ding, P. X.: Spatial and temporal varia- Lange, M., and Schimmels, S.: Salt marsh surface survives true- tions in sediment grain size in tidal wetlands, Yangtze Delta: On to-scale simulated storm surges, Earth Surf. Process. Landf., 41, the role of physical and biotic controls, Estuar. Coast. Shelf Sci., 543–552, https://doi.org/10.1002/esp.3867, 2016. 77, 657–671, 2008. Temmerman, S. and Kirwan, M. L.: Building land with a rising sea, Zhu, Q., Yang, S., and Ma, Y.: Intra-tidal sedimentary Science, 349, 588–589, https://doi.org/10.1126/science.aac8312, processes associated with combined wave–current ac- 2015. tion on an exposed, erosional mudflat, southeastern Temmerman, S., Meire, P., Bouma, T. J., Herman, P. M. J., Yangtze River Delta, China, Mar. Geol., 347, 95–106, Ysebaert, T., and De Vriend, H. J.: Ecosystem-based coastal https://doi.org/10.1016/j.margeo.2013.11.005, 2014. defence in the face of global change, Nature, 504, 79–83, https://doi.org/10.1038/nature12859, 2013. Earth Syst. Sci. Data, 13, 405–416, 2021 https://doi.org/10.5194/essd-13-405-2021
You can also read