Changing global cropping patterns to minimize national blue water scarcity - Articles
←
→
Page content transcription
If your browser does not render page correctly, please read the page content below
Hydrol. Earth Syst. Sci., 24, 3015–3031, 2020
https://doi.org/10.5194/hess-24-3015-2020
© Author(s) 2020. This work is distributed under
the Creative Commons Attribution 4.0 License.

Changing global cropping patterns to minimize
national blue water scarcity
Hatem Chouchane1 , Maarten S. Krol1 , and Arjen Y. Hoekstra1,2,
1 Twente Water Centre, University of Twente, Enschede, the Netherlands
2 Institute
         of Water Policy, Lee Kuan Yew School of Public Policy, National University of Singapore, Singapore
 deceased, 18 November 2019

Correspondence: Hatem Chouchane (hatemchouchane1@gmail.com)

Received: 4 September 2019 – Discussion started: 28 October 2019
Revised: 16 April 2020 – Accepted: 10 May 2020 – Published: 9 June 2020

Abstract. Feeding a growing population with global natural-      1   Introduction
resource constraints becomes an increasingly challenging
task. Changing spatial cropping patterns could contribute
                                                                 Water scarcity poses a major societal and economic risk
to sustaining crop production and mitigating water scarcity.
                                                                 (WEF, 2019) and threat to biodiversity and environmental
Previous studies on water saving through international food
                                                                 sustainability (Vörösmarty et al., 2010). Population growth
trade focussed either on comparing water productivities
                                                                 and climate change are expected to worsen the situation and
among food-trading countries or on analysing food trade in
                                                                 impose more pressure on freshwater resources everywhere
relation to national water endowments. Here, we consider,
                                                                 (Vörösmarty et al., 2000; Parry et al., 2004). Since water con-
for the first time, how both differences in national average
                                                                 sumption already exceeds the maximum sustainable level in
water productivities and water endowments can be consid-
                                                                 many parts of the world (Hoekstra et al., 2012) and popu-
ered to analyse comparative advantages of countries for dif-
                                                                 lation growth in water-scarce countries alone could enforce
ferent types of crop production. A linear-optimization algo-
                                                                 global international trade in staple crops to increase by a fac-
rithm is used to find modifications in global cropping pat-
                                                                 tor of 1.4 to 18 by 2050 (Chouchane et al., 2018), solutions
terns that reduce national blue water scarcity in the world’s
                                                                 are urgently needed for a more sustainable allocation of the
most severely water-scarce countries, while keeping global
                                                                 world’s limited freshwater resources (Hoekstra, 2014; Konar
production of each crop unchanged and preventing any in-
                                                                 et al., 2016).
crease in total irrigated or rainfed harvested areas in each
                                                                    Considerable debate has arisen over the last few decades
country. The results are used to assess national comparative
                                                                 on the pathways to overcome the problem of water scarcity
advantages and disadvantages for different crops. Even when
                                                                 and its implications (Gleick, 2003), especially for agricul-
allowing a maximum expansion of the irrigated or rainfed
                                                                 ture, the largest consumer of freshwater, accounting for 92 %
harvested area per crop per country of only 10 %, the blue
                                                                 of water consumption globally (Hoekstra and Mekonnen,
water scarcity in the world’s most water-scarce countries can
                                                                 2012). A growing number of studies addresses the question
be greatly reduced. In this case, we could achieve a reduction
                                                                 of how to mitigate problems related to blue water scarcity
of the global blue water footprint of crop production of 21 %
                                                                 (Wada et al., 2014; Kummu et al., 2016). Some proposed
and a decrease of the global total harvested and irrigated ar-
                                                                 solutions focus on better water management in agriculture
eas of 2 % and 10 % respectively. Shifts in rainfed areas have
                                                                 (Evans and Sadler, 2008), for instance, by improving irriga-
a dominant share in reducing the blue water footprint of crop
                                                                 tion efficiency and precision irrigation (Sadler et al., 2005;
production.
                                                                 Greenwood et al., 2010), using better agricultural practices
                                                                 like mulching and drip irrigation (Mukherjee et al., 2010;
                                                                 Chukalla et al., 2015; Nouri et al., 2019), improving irri-
                                                                 gation scheduling (Jones, 2004) and enhancing water pro-

Published by Copernicus Publications on behalf of the European Geosciences Union.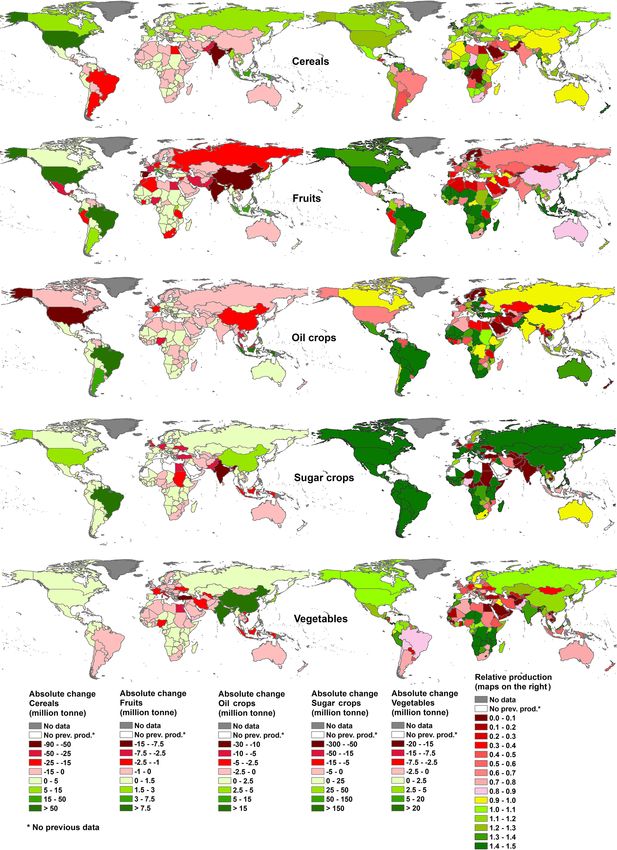
3016                   H. Chouchane et al.: Changing global cropping patterns to minimize national blue water scarcity

ductivity (Bouman, 2007; Molden et al., 2010; Pereira et          production or agricultural value, without the requirement of
al., 2012). Other suggested solutions focus on changing di-       fulfilling overall crop demand. Osama et al. (2017), for ex-
ets (Vanham et al., 2013; Jalava et al., 2014; Gephart et al.,    ample, employ a linear-optimization model for some regions
2016) and reducing food losses (Munesue et al., 2015; Jalava      in Egypt to maximize the net annual return by changing the
et al., 2016) to diminish water consumption. Yet another cat-     cropping pattern, given water and land constraints, and con-
egory of studies focusses on spatial cropping patterns (Davis     clude that some crops are to be expanded, while others are
et al., 2017a, b) and the role of international trade in saving   to be reduced. Another example of a regional study is Ye et
water and in bridging the gap between national water demand       al. (2018), who used a multi-objective-optimization model,
and supply in water-short countries (Chapagain et al., 2006;      considering the trade-offs between economic benefits and the
Hoekstra and Hung, 2005). The volume of fresh water used          environmental impact of water use when changing the crop-
to produce a traded product, measured at the place where it       ping pattern in a case study for Beijing.
was produced, also known as virtual water trade, is the hid-         In a study for the US, Davis et al. (2017b) investigated al-
den flow of water if food or other commodities are traded         ternative crop distribution that saves water and improves pro-
from one place to another (Allan, 1998). According to inter-      ductivity while maintaining crop diversity, protein produc-
national trade theory, countries can profit from trade by fo-     tion and income. The only global study on changing crop-
cussing on the production and export of goods for which they      ping patterns in order to reduce water use, to our knowl-
have a comparative advantage. What precisely constitutes a        edge, is Davis et al. (2017a), who combine data on water use
comparative advantage is still subject to debate. Whereas Ri-     and productivity for 14 major crops and show that chang-
cardo’s theory of comparative advantage says that a country       ing the distribution of these crops across the world’s cur-
can best focus on producing goods for which they have rel-        rently cultivated lands could decrease blue water use by 12 %
atively high productivity, the Heckscher–Ohlin (H–O) the-         and feed an additional 825 million people. However, the cur-
ory states that a country can best specialize in producing        rent study has a number of differences compared with Davis
and exporting products that use production factors that are       et al. (2017a). First, we are only changing cropping pat-
comparatively most abundant. When focussing on the role of        terns while maintaining the same global production per crop,
water in trade, the first theory would consider relative water    whereas Davis et al. (2017a) aim for a higher caloric and pro-
productivity (crop per drop), while the second theory would       tein production while reducing water use; that also results in
look at relative water abundance (Hoekstra, 2013). Part of        a different global consumption pattern, which hampers the
the literature on water saving through international food trade   identification of potential water-saving effects of just produc-
has focussed on comparing water productivities among food-        tion shifts amongst countries. Second, we consider a larger
trading countries (Chapagain et al., 2006; Yang et al., 2006;     number of crops (125 crops including vegetables, fruits and
Oki et al., 2017), while other studies have concentrated on       pulses which were not considered in Davis et al., 2017a).
analysing food trade in relation to water endowments (Yang           Although it has been widely acknowledged that the spatial
et al., 2003; Oki and Kanae, 2004; Chouchane et al., 2018).       water scarcity pattern in the world can be explained by where
In a study for China, Zhao et al. (2019), evaluated spatiotem-    crops are grown and how much they are irrigated (Wada et
poral differences in the regional water, land and labour pro-     al., 2011; Mekonnen and Hoekstra, 2016), it has not yet been
ductivity of agricultural and non-agricultural sectors across     studied how differences between countries in water and land
Chinese provinces and defined comparative advantage on            productivities and endowments can be used to derive com-
that basis. These comparative advantages were used to track       parative advantages of countries for specific crops and how
the driving force of the virtual water regional trade. Their      a change in the global cropping pattern can reduce water
findings suggest that differences in land productivity were       scarcity in the most water-scarce places. Here, we explore
the main forces shaping the pattern of virtual water flows        how we can stepwise minimize the highest national water
across Chinese regions, while neither labour nor water pro-       scarcity in the world by changing cropping patterns and the
ductivity had a significant influence.                            related blue water allocation to crops. The spatial resolution
   In the current study, we consider, for the first time, how     of the country level reflects the coarse resolution at which
both differences in water productivity and water endow-           the Food and Agriculture Organization of the United Nations
ment can be considered to analyse comparative advantages of       (FAO) monitors and reports water stress in the Sustainable
countries for different types of crop production. While doing     Development Goal (SDG) framework (FAO, 2018); subna-
so, we also consider differences between countries in land        tional heterogeneity in water scarcity, which is significant in
productivities (crop yields) and land endowments (available       countries like the US or China, is not covered at this resolu-
cropland areas).                                                  tion. With cropping pattern we mean the allocation of crops
   Studies on the spatial allocation of crop production, given    to rainfed and irrigated land in all countries of the world,
differences in land and water productivity and endowments,        where both rainfed and irrigated areas of each crop in each
are sparse, particularly large-scale studies. In local or re-     country are allowed to expand up to a modest maximum rate
gional studies that study best crop choices given land and        (factor α), while respecting the bounds of current total rain-
water constraints, the focus is generally to maximize food        fed and total irrigated area per country as well as the global

Hydrol. Earth Syst. Sci., 24, 3015–3031, 2020                                      https://doi.org/10.5194/hess-24-3015-2020
H. Chouchane et al.: Changing global cropping patterns to minimize national blue water scarcity                                       3017

production per crop. For this purpose, we develop and apply
a linear-programming-optimization algorithm considering a
                                                                     ∀i, j : Prf (i, j ) = Arf (i, j ) × Yrf (i, j )
number of constraints. First, total rainfed and irrigated har-
vested areas in each country should not grow beyond their            ∀i, j : Pir (i, j ) = Air (i, j ) × Yir (i, j )
extent in the reference period of 1996–2005. Second, the har-        ∀i, j : P (i, j ) = Prf (i, j ) + Pir (i, j ) ,                    (1)
vested area per country per crop can only expand by a limited
rate (which will be varied), both for the rainfed and irrigated      whereby Prf (i, j ), Pir (i, j ) and P (i, j ) are the rainfed, irri-
area. Third, the global production of each crop must remain          gated and total production in country i of crop j ; Arf (i, j )
the same as in the reference period. The optimization takes          and Air (i, j ) are the rainfed and irrigated harvested area in
into account both factor endowments (blue water availabil-           country i for crop j ; and Yrf (i, j ) and Yir (i, j ) are the rainfed
ity, rainfed land availability and irrigated land availability)      and irrigated crop yield in country i for crop j .
in each country and factor productivities (blue water produc-           Blue water scarcity (BWS) is defined per country i as the
tivity in irrigation and land productivities in rainfed and irri-    total blue water footprint divided by the blue water availabil-
gated lands) for each crop in each country. In order to focus        ity in the country (Hoekstra et al., 2012). The blue water foot-
on aspects of natural-resource endowment and productivity            print (BWF) refers to the volume of consumptive freshwater
in relation to water scarcity, other important aspects such as       use for irrigation that comes from surface water and ground-
socioeconomic or national food self-sufficiency goals were           water. Blue water availability is taken from FAO (2015) and
not considered.                                                      refers to the total renewable amount (internal and external re-
                                                                     sources), which is the long-term average annual flow of rivers
                                                                     (surface water) and sustainably available groundwater (FAO,
2   Methods and data                                                 2003).
                                                                                  P
We developed a linear-optimization algorithm in MATLAB.                               Pir (i, j ) × BWF(i, j )
In the optimization we allow the global cropping pattern to                             j
                                                                     BWS(i) =                                     ,                     (2)
change, that is to grow crops in countries other than in the                                  BWA(i)
reference situation. In the optimization, the cropping areas         where Pir (i, j ) is the irrigated production in country i of crop
by crop, country and production system are the independent           j , BWF(i, j ) is the blue water footprint per unit of crop j
variables, and the following constraints are considered. First,      in country i, and BWA(i) is the blue water availability in
both total rainfed and total irrigated harvested areas per coun-     country i. A country is considered to be under low, moderate,
try are not allowed to expand. Second, both crop-specific            significant or severe water scarcity when BWS (expressed as
rainfed and irrigated harvested area per country are allowed         a percentage) is lower than 20 %, in the range of 20 %–30 %,
to expand but not beyond a factor α (whereby we stepwise             in the range of 30 %–40 % and larger than 40 % respectively
increase α from 1.1 to 2.0 in a number of subsequent ex-             (Hoekstra et al., 2012).
periments). Third, the global production of each crop should             The optimization can be presented as follows:
remain equal to the global production of the crop in the refer-
ence situation. For any cropping pattern, the water scarcity in
                                                                      min max(BWS(i)) ,                                              (3)
each country is computed, and the country with the highest           Arf ,Air       i
water scarcity is identified. The objective of the optimization
is to minimize the highest water scarcity. The algorithm con-        subject to
tinuously tries to reduce the blue water scarcity in the coun-            X                X
                                                                     ∀i :    Arf (i, j ) ≤   Arf,ref (i, j )
tries with the highest blue water scarcity while disallowing
                                                                            j                     j
blue water scarcity in any country to increase. The algorithm             X              X
will thus tend to reduce and equalize blue water scarcity in         ∀i :  Air (i, j ) ≤  Air,ref (i, j )
the most water-scarce countries.                                            j                 j
   We considered 125 crops of the main crops groups (cere-           ∀i, j : Arf (i, j ) ≤ α × Arf,ref (i, j )
als, fibres, fruits, nuts, oil crops, pulses, roots, spices, stim-   ∀i, j : Air (i, j ) ≤ α × Air,ref (i, j )
ulants, sugar crops and vegetables; for an extensive list of              X                X
crops used, see Chouchane et al., 2020); the optimization was        ∀j :     P (i, j ) =     Pref (i, j )
                                                                                i             i
performed using the linear-optimization routine from the Op-
timization Toolbox of MATLAB.                                        ∀i : BWS(i) ≤ BWSref (i),
   Given the cropping pattern, production is computed per
                                                                     where Arf (i, j ) and Air (i, j ) are the rainfed and irrigated har-
country and crop, both for rainfed and irrigated lands based
                                                                     vested areas in country i of crop j in the cropping pattern that
on the harvested area and crop yields:
                                                                     is varied in order to minimize the highest national blue water
                                                                     scarcity, Arf,ref (i, j ) and Air,ref (i, j ) are the rainfed and irri-
                                                                     gated harvested areas in the reference situation, P (i, j ) is the

https://doi.org/10.5194/hess-24-3015-2020                                               Hydrol. Earth Syst. Sci., 24, 3015–3031, 2020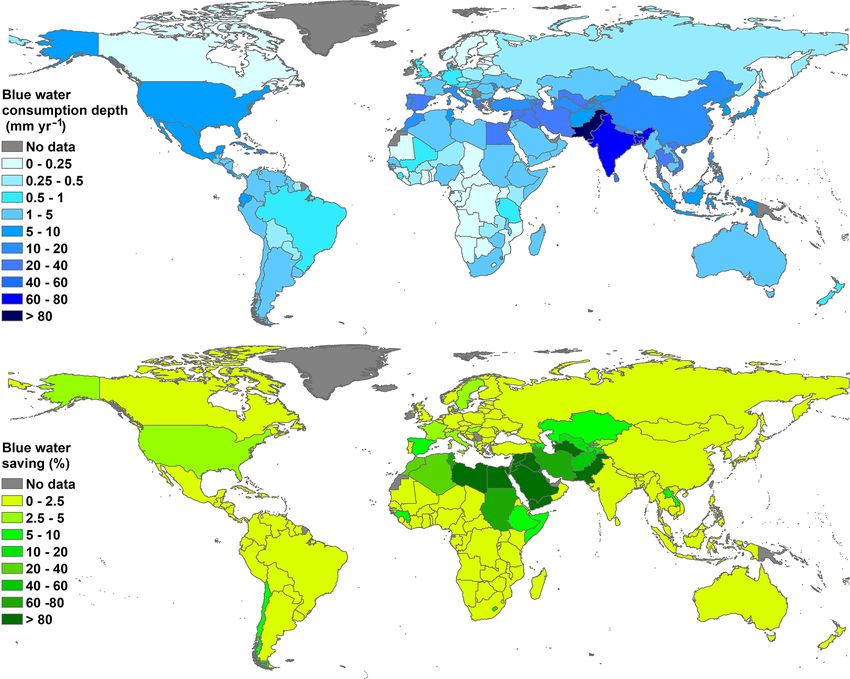
3018 H. Chouchane et al.: Changing global cropping patterns to minimize national blue water scarcity
total (rainfed plus irrigated) production in country i of crop national blue water scarcity is further reduced to 6 %, 4 %
j in the new cropping pattern, Pref (i, j ) is the total (rainfed and 2 % respectively. In these scenarios, global blue water
plus irrigated) production in country i of crop j in the ref- consumption gets reduced by 38 %, 48 % and 60 % respec-
erence situation, and BWSref (i) is the blue water scarcity in tively; the total global harvested area gets reduced by 6 %,
country i in the reference situation. Parameter α is the fac- 7 % and 9 % respectively, and the total global irrigated area
tor of the maximally allowed expansion of the harvested area gets reduced by 23 %, 27 % and 37 % respectively.
per crop and country and production system (rainfed or ir- Most countries with severe water scarcity (BWS > 40 %)
rigated), which is varied in the optimization experiments be- in the reference situation show a moderate (BWS in the range
tween 1.1 and 2. Note that total national croplands (both rain- of 20 %–30 %) to low water scarcity (BWS < 20 %) in the
fed and irrigated) are not allowed to expand but that reduc- optimized situation with α = 1.1 (Fig. 1). However, not all
tions in land use are always allowed. countries would benefit similarly in the optimized situation.
A country is considered to have a comparative advantage China and India, major crops producers in the reference sit-
for producing a certain crop or crop group when the follow- uation, only start to have a decrease in their BWS when
ing criteria are met: (1) the relative change (production in α ≥ 1.3.
the optimized cropping pattern divided by the production in In the case of α = 1.1, Pakistan, the third-largest consumer
the reference situation) of that crop or crop group continues of blue water in the reference situation, has the largest re-
to increase in that country when we gradually increase the duction in its blue water consumption in absolute terms, viz.
maximally allowed expansion of harvested area per crop per 60 000 m3 yr−1 , which represents 80 % of its current BWC
country (the factor α) and (2) the share of the country in the and 35 % of the global blue water saving. Other countries
global production of the crop or crop group exceeds 5 % (in that have a significant reduction in their BWC in absolute
the optimized cropping pattern at α = 1.1). terms include Iran, Egypt, Iraq, Syria, Saudi Arabia, Sudan
In order to test the sensitivity of the optimization results and Turkmenistan (Fig. 2). However, not all countries would
to the allowed changes in irrigation, we run the optimization benefit similarly in the optimized set. India and China, the
without allowing any expansion of the irrigated area. In this first- and second-largest consumers of blue water in the refer-
case, the factor α will be only applied to the rainfed area, ence situation, will only start to have a decrease in their blue
while the irrigated area per country per crop will be below water scarcity when the allowed expansion rate α is larger
or equal to the irrigated area of the same crop in the same than 1.2; this is due to the optimization of water scarcity at
country in the reference situation. The optimization objective the level of countries, where India and China have modest
and constraints remain the same except that the following national water scarcity.
constraint was added:
3.2 The changing global cropping pattern for the case
∀i, j : Air (i, j ) ≤ Air,ref (i, j ). (4) of α = 1.1
The sources of the data used to perform the optimization are The reduction of global blue water consumption is achieved
summarized in Table 1. by reallocating the most resource-intensive crops from coun-
tries that have lower productivity in terms of land and water
3 Results to countries with significantly higher productivities, both for
rainfed and irrigated production, thus reducing irrigation in
3.1 Changes in blue water scarcity and blue water countries that initially have a high BWS value. In the opti-
consumption mized cropping pattern, cereal production is reduced most
significantly in Africa, relative to the reference situation, and
When α is 1.1, that means when we allow a maximum of South America and expanded in North America and Europe
10 % expansion of the reference harvested areas for each in- (Table 3). Irrigated cereal production is reduced in most of
dividual crop, in every country, both for rainfed and irrigated the world’s regions (except for a small expansion in Europe
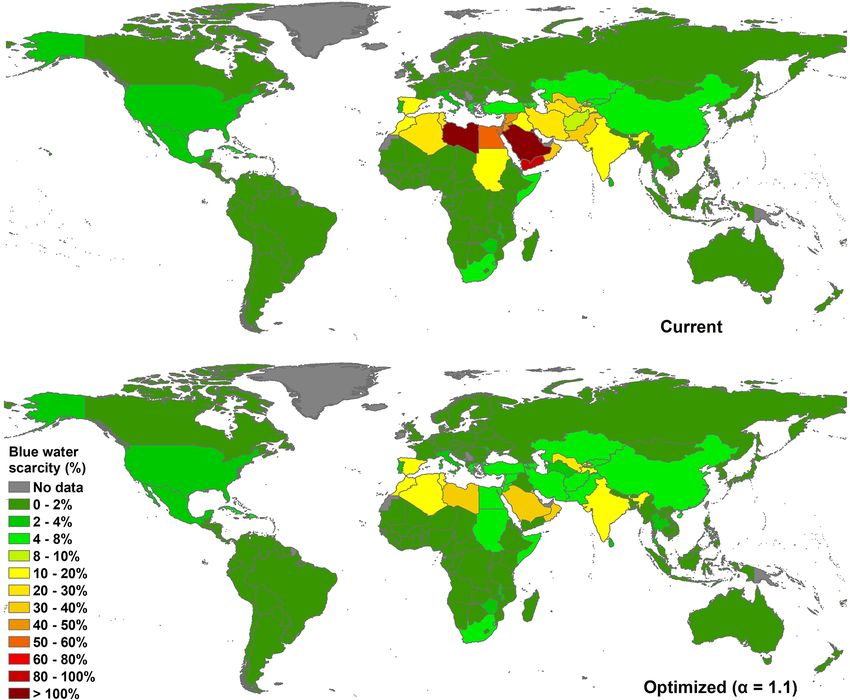
production, blue water scarcity in the world’s seven most and South America), whereas global rainfed production in-
water-scarce countries, Libya, Saudi Arabia, Kuwait, Yemen, creases. For individual countries, Pakistan and Egypt have
Qatar, Egypt and Israel (with current scarcities ranging from the largest decrease in total cereal production. The most sig-
54 % to 270 %), is reduced to a scarcity of 39 % or less (Ta- nificant expansions in cereal production are found in the US
ble 2). In this scenario, the aggregated blue water footprint of and China for maize; in China, India, the Russian Federation
crop production in the world is reduced by 21 %, while the and France for wheat production; and in India, Indonesia and
total global harvested and irrigated areas are reduced by 2 % Vietnam for rice production. In terms of harvested area, the
and 10 % respectively. largest areal decrease in cereals is found in Asia, with a re-
When α is equal to 1.3, 1.5 and 2.0 (i.e. when the maxi- duction of 8 × 10⁶ ha in total (Table S1 in the Supplement),
mally allowed expansion of harvested area per crop per coun- which represents 3 % of the current harvested area of cere-
try is equal to 30 %, 50 % and 100 %), the world’s maximum als in Asia. The irrigated area of cereals in Asia is reduced
Hydrol. Earth Syst. Sci., 24, 3015–3031, 2020 https://doi.org/10.5194/hess-24-3015-2020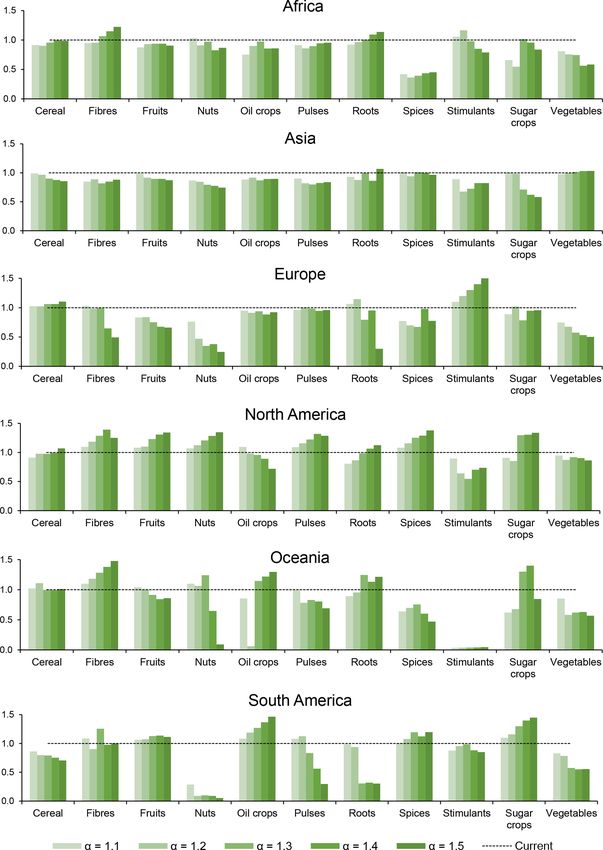
H. Chouchane et al.: Changing global cropping patterns to minimize national blue water scarcity                                          3019

Table 1. Overview of data used.

          Variable                            Spatial resolution               Temporal resolution        Source
          Blue water availability             Country (internal and exter-     Average for 1961–1990      FAO (2015)
                                              nal
                                              renewable water resources)
          Harvested irrigated and rainfed     Country                          Average for 1996–2005      Mekonnen and Hoekstra
          land per crop in the reference                                                                  (2011), FAO (2015)
          situation
          Rainfed and irrigated produc-       Country                          Average for 1996–2005      Mekonnen and Hoekstra
          tion per crop in the reference                                                                  (2011), FAO (2015)
          situation
          BWF per unit of crop in             Country                          Average for 1996–2005      Mekonnen and Hoekstra
          irrigated production per crop                                                                   (2011)
          Yield in rainfed and irrigated      Country                          Average for 1996–2005      Mekonnen and Hoekstra
          production per crop                                                                             (2011)

Table 2. Current versus optimized blue water consumption (BWC) and blue water scarcity (BWS) for countries currently having a water
scarcity value higher than 15 %.

 Countries               Current             Optimized (α = 1.1)     Optimized (α = 1.3)      Optimized (α = 1.5)       Optimized (α = 2.0)
                         BWC        BWS             BWC      BWS            BWC       BWS            BWC       BWS             BWC      BWS
                 (106 m3 yr−1 )      (%)    (106 m3 yr−1 )    (%)   (106 m3 yr−1 )     (%)   (106 m3 yr−1 )     (%)    (106 m3 yr−1 )    (%)
 Libya                   1900       270 %             210    30 %                41    6%                25     4%                16     2%
 Saudi Arabia            6200       260 %             940    39 %               140    6%                87     4%                54     2%
 Kuwait                     48      240 %                8   39 %                 1    6%                 1     4%                 0     2%
 Yemen                   2100        98 %              2.8    0%                  3    0%                76     4%                48     2%
 Qatar                      51       88 %              23    39 %                 3    6%                 2     4%                 1     2%
 Egypt                  34 000       57 %           3800      7%              3400     6%              2100     4%              1300     2%
 Israel                    960       54 %             340    19 %               100    6%                65     4%                40     2%
 Jordan                    410       43 %              70     8%                 55    6%                34     4%                21     2%
 Syria                   7000        42 %             690     4%                990    6%               610     4%               380     2%
 Oman                      550       39 %             550    39 %                82    6%                51     4%                32     2%
 Uzbekistan             15 000       31 %          13 000    26 %               890    2%              1800     4%              1100     2%
 Cyprus                    240       31 %              59     8%                 46    6%                28     4%                18     2%
 Pakistan               74 000       30 %          15 000     6%             14 000    6%              9000     4%              5600     2%
 Iran                   40 000       29 %           8400      6%              8000     6%              5000     4%              3100     2%
 Tunisia                 1300        29 %             530    11 %               270    6%               170     4%               100     2%
 Algeria                 2700        23 %           1900     16 %               690    6%               430     4%               260     2%
 Turkmenistan            5300        21 %             520     2%                620    3%               900     4%               560     2%
 Morocco                 5100        18 %           3100     11 %             1700     6%              1100     4%               660     2%
 Malta                       9       17 %                8   15 %                 3    6%                 2     4%                 1     2%
 Lebanon                   770       17 %             730    16 %               260    6%               160     4%               100     2%
 Sudan                   6100        16 %           2100      6%              2200     6%              1400     4%               860     2%
 Global                820 000                    650 000                 510 000                    430 000                 330 000

by 6 % compared to the reference situation, while the rainfed               Fruit production is reduced most significantly in Asia and
area has an increase of 1 %. Africa has the second-largest de-           Africa and expanded in the Americas (Table 3). Major fruit
crease of the irrigated area of cereals with 3 × 10⁶ ha and the          production reductions include the decrease of apple produc-
largest increase of rainfed area of cereals with 2.6 × 10⁶ ha.           tion in Iran; banana production in Thailand; orange produc-
Changes in the global pattern of cereal production for the               tion in Egypt, Iran and Pakistan; and grape production in
case of α = 1.1 contribute 50 % to the total global reduction            France. In North America, the most significant expansion in
in the blue water footprint and 46 % to the total global reduc-          fruit production is the increase in orange, grape and apple
tion in the irrigated area.                                              production in the US; in South America, the largest fruit pro-

https://doi.org/10.5194/hess-24-3015-2020                                               Hydrol. Earth Syst. Sci., 24, 3015–3031, 2020
3020 H. Chouchane et al.: Changing global cropping patterns to minimize national blue water scarcity Figure 1. Current and optimized (α = 1.1) blue water scarcity. Figure 2. Current blue water consumption depth (in mm yr−1 ) and blue water saving as a percentage of current BWC in the case of an optimized cropping pattern (α = 1.1). Hydrol. Earth Syst. Sci., 24, 3015–3031, 2020 https://doi.org/10.5194/hess-24-3015-2020
H. Chouchane et al.: Changing global cropping patterns to minimize national blue water scarcity                                       3021

Table 3. Change in production per product group per continent in absolute terms (106 t yr−1 ) when shifting from the cropping pattern in the
reference period (1996–2005) to the optimized cropping pattern (with α = 1.1).

                          Cereal    Fibres    Fruits    Nuts       Oil    Pulses   Roots    Spices    Stimulants     Sugar    Vegetables
                                                                 crops                                               crops
  Africa      Rainfed       3.2       0.3       3.5      0.1     −8.9       0.4      7.0       0.0            0.4     3.2            0.7
              Irrigated   −17.2      −0.7      −5.8      0.0     −1.3      −0.3     −4.0      −0.1            0.0   −21.8           −9.5
              Total       −14.0      −0.3      −2.3      0.1    −10.2       0.1      2.9      −0.1            0.4   −18.6           −8.9
  Asia        Rainfed      16.1       1.3      11.0     0.1       4.6      −0.2      6.9       0.3           0.0     10.6          34.0
              Irrigated   −14.5      −2.6     −19.2    −0.2      −8.3      −0.2     −4.9      −0.2          −0.2    −61.4         −13.8
              Total         1.6      −1.3      −8.2    −0.1      −3.7      −0.4      1.9       0.1          −0.2    −50.8          20.1
  Europe      Rainfed        6.4       0.0     −0.1      0.0       0.7     −0.1     −0.6        0.0           0.0       0.1         −7.0
              Irrigated      0.8       0.2      1.3      0.0       0.5      0.1      1.8        0.0           0.0       3.1         −2.4
              Total          7.2       0.1      1.2      0.0       1.2     −0.1      1.3        0.0           0.0       3.3         −9.5
  North       Rainfed      11.6        0.6       1.2     0.0       5.1       0.5    −0.9        0.0         −0.2       8.9          −1.0
  America     Irrigated    −0.7        0.5       3.5     0.1       0.4       0.1     1.7        0.0          0.0       8.2          −0.7
              Total        10.9        1.1       4.7     0.1       5.5       0.6     0.9        0.0         −0.2      17.1          −1.7
  Oceania     Rainfed       0.4        0.0      0.1      0.0       0.1     −0.3     −0.1        0.0           0.0       1.1         −0.1
              Irrigated    −0.3        0.1     −0.1      0.0       0.0      0.0      0.1        0.0           0.0       2.9          0.1
              Total         0.1        0.1     −0.1      0.0       0.1     −0.3      0.1        0.0           0.0       4.0          0.0
  South       Rainfed      −6.3        0.3       4.1    0.0        6.9       0.0    −7.2        0.0           0.0     35.4          −0.3
  America     Irrigated     0.6        0.0       0.6    0.0        0.1       0.0     0.2        0.0           0.0      9.6           0.3
              Total        −5.7        0.3       4.7   −0.1        7.0       0.1    −7.0        0.0           0.0     45.0           0.0

duction increases are for oranges in Brazil and bananas in               the harvested area of roots is reduced by 4 % (11 % for irri-
Ecuador. Although the reduction in fruit production in Asia              gated and 3 % for rainfed croplands).
and Africa mainly concerns irrigation, the irrigated produc-                Sugar crop production is reduced most significantly in
tion of fruits increases in North America and Europe. The                Asia and Africa and expanded in the Americas. Sugar cane
largest share of increase in the irrigated production in North           production is mainly reduced in Pakistan, India and Egypt
America comes from the increase in irrigated production of               and expanded in Brazil. The global irrigated harvested area
oranges, apples and grapes in the US. The world’s harvested              of sugar crops is reduced in total by 10 %, while the global
area of fruits reduces by 2 %. The irrigated area reduces by             rainfed area increases by 8 %. Changes in sugar crop produc-
19 %, while the rainfed area increases by 4 %. Changes in                tion contribute 10 % to the total blue water savings globally.
fruit production contributed 12 % to global blue water sav-                 Vegetable production is reduced most significantly in Eu-
ings and 9 % to total global reductions in irrigated area.               rope and Africa and expanded in Asia. Major reductions in
   The production of oil crops is reduced most significantly in          vegetable production are for tomato production in Iran and
Africa (e.g. oil palm in Nigeria) and expanded in the Ameri-             Egypt. The most significant expansions are the increases in
cas (e.g. soybeans in the US, Brazil and Argentina). The har-            tomato and watermelon production in China. The global har-
vested area shrinks globally by 3 % in total. The irrigated              vested area of vegetables is reduced by 4 %, with a reduc-
area reduces by 30 %, although the global rainfed area re-               tion of 17 % for irrigated croplands, while the rainfed area
mains the same as the reference situation. Asia and Africa               remains the same as reference situation. Reallocating veg-
have the most significant shrinkage in harvested areas of oil            etables contributed 5 % to global reductions in the blue water
crops. Reallocating oil crops contributed 7 % to global reduc-           footprint and 7 % to global reductions in the total irrigated
tions in blue water footprint and 19 % to total global reduc-            harvested area globally.
tions in irrigated area.                                                    Although the cereal rainfed harvested area is reduced in
   Root production partly moves from South America to                    North America when α = 1.1, for example (Table S1), rain-
Africa, Asia and Europe. At the country level, the most sig-             fed cereal production will increase by 11.6 × 10⁶ t yr−1 . This
nificant reduction is due to the decrease of potato production           illustrates that by allocating production to more productive
in Poland and Iran and cassava production in Brazil, China               countries, we can reduce water and land use and increase
and Vietnam. The largest expansions are sweet potato pro-                production at the same time.
duction in China, potato production in the Russian Federa-
tion and cassava and yam production in Nigeria. Globally,

https://doi.org/10.5194/hess-24-3015-2020                                             Hydrol. Earth Syst. Sci., 24, 3015–3031, 2020
3022 H. Chouchane et al.: Changing global cropping patterns to minimize national blue water scarcity
3.3 Comparative advantages US, Indonesia and France will increase by 30 %, 26 % and
23 % respectively compared to the reference situation. India
We explore the comparative advantages of countries to con- has a comparative disadvantage in cereals and will reduce its
tribute to the goal of relieving global water scarcity. In the production by 40 % in the optimized cropping pattern with
following, we use the term “comparative advantage” to indi- α = 1.5. Looking at the main cereal crops separately (wheat,
cate a comparative advantage for this specific goal, as that is barley, maize and rice) and combining information on rela-
where results from the study provide insight in; comparative tive and absolute changes, we find that France and the Rus-
advantages to e.g. contribute to increasing agroeconomic rev- sian Federation have a comparative advantage in wheat pro-
enue or reducing the agricultural carbon footprint could re- duction, with large absolute increases when we optimize the
sult in different conclusions. Our exploration of comparative global cropping pattern (Fig. S1). India and China, contribut-
advantage is considering which crops in a country are ex- ing 12 % and 17 % respectively of global wheat production
panding when we gradually move from α = 1.1 to α = 1.5. in the reference period, have a comparative disadvantage and
As a summary, Fig. 3 shows at the level of continents and shrink their wheat production by 41 % (for China) and 26 %
crop groups, the relative change in total production when we (for India) when α = 1.5. For barley, we find Canada, France,
move from the reference cropping pattern (1996–2005) along Spain and Turkey to have a comparative advantage. Germany
the optimized cropping pattern, considering a stepwise in- and the Russian Federation, contributing 9 % and 11 % re-
crease in the maximally allowed expansion rate in harvested spectively to the global barley production in the reference
area per crop per country from α = 1.1 to α = 1.5. Most of period, have a comparative disadvantage and will decrease
the changes in production that already occur for the modest their barley production respectively by 28 % and 88 % when
areal-expansion rate per crop of 10 % (Table 3) will continue α = 1.5. For maize, the US is found to have a comparative
under larger expansion rates, with some exceptions. This is, advantage, while, Brazil, contributing 6 % to global maize
for example, the case for fibres in Europe and oil crops in production in the reference period, has a comparative disad-
North America. Fibre production expands for the case of vantage and will reduce its maize production with 64 % in the
α = 1.1, 1.2 and 1.3 in Europe but again reduces for higher optimized situation (α = 1.5). For rice, China, Indonesia and
expansion rates. This can be explained by the fact that even Vietnam have a comparative advantage, with shares in global
more suitable regions, namely Oceania, North America and rice production raising from 32 %, 9 % and 5 % respectively
to a lesser extent Africa, continue expanding fibre produc- in the reference situation to 22 %, 29 % and 27 % in the opti-
tion, allowing Europe to rather focus on cereal, sugar crop mized situation (when α = 1.5). India, contributing 22 % to
and stimulant production (Fig. 3). North America expands global rice production in the reference period, has a compar-
oil crop production when α = 1.1 (Table 3) but decreases oil ative disadvantage and will decrease its rice production by
crop production when α = 1.2 and has the largest reduction 43 % when α = 1.5 compared to the reference situation.
in oil crop production for α = 1.5 (Table S1). The reason be-
hind this is that for the smallest expansion rate, the US still 3.3.2 Fruit production
needs to produce oil crops, and the global production could
not be reached without the expansion of oil crops in the US, Comparative advantages for fruit production are found for
which limits the allocation of harvested areas to more suit- Brazil and the US, which will increase their respective shares
able crops in the US such as maize and sugar crops. From in global fruit production from 7 % and 6 % in the reference
α = 1.2, the US will focus on producing maize in which they situation to 11 % and 9 % in the optimized cropping pattern
have a comparative advantage and give up a part of oil crop (when α = 1.5). China and India, contributing 14 % and 10 %
production. This example for North America shows that it respectively to global fruit production in the reference period,
is hard to have a robust conclusion on comparative advan- appear to have a comparative disadvantage and will reduce
tages by looking at the level of continents. In order to ex- their fruit production by 13 % and 31 % respectively in the
plore comparative advantages, we will need to look at the optimized situation (when α = 1.5). Zooming in to the top
country level. Figures 4 and 5 show the absolute and relative four produced fruits – apples, bananas, grapes and oranges –
changes in production per crop group per country when we we find the following. For apples, the US has a comparative
move from the cropping pattern in the reference situation to advantage; the country will increase its share in global ap-
the optimized cropping pattern with α = 1.5. ple production from 8 % (reference) to 12 % (when α = 1.5).
China, contributing 35 % to the global apple production in
3.3.1 Cereal production the reference period, has a comparative disadvantage and will
decrease its apple production by 12 % in the optimized crop-
The US and to a lesser extent Indonesia and France have large ping patterns (when α = 1.5). For bananas, Ecuador, Brazil
absolute and relative changes (Fig. 4) for cereals and thus a and the Philippines have a comparative advantage. India,
comparative advantage (given the combination of their wa- contributing 22 % to global banana production in the ref-
ter endowments and water productivities compared to other erence period, has a comparative disadvantage. For grapes,
countries). In the case of α = 1.5, the cereal production of the Italy, the US and China have a comparative advantage, with
Hydrol. Earth Syst. Sci., 24, 3015–3031, 2020 https://doi.org/10.5194/hess-24-3015-2020H. Chouchane et al.: Changing global cropping patterns to minimize national blue water scarcity 3023
Figure 3. Ratio of total production in the optimized cropping pattern to total production in the reference cropping pattern (1996–2005), per
crop group and per continent, for α = 1.1 to α = 1.5.
shares in global grape production rising from 15 %, 9 % and 3.3.3 Oil crops
7 % (reference) to 22 %, 13 % and 10 % (α = 1.5). France
and Spain, contributing 13 % and 9 % respectively to global For oil crops, we find Indonesia, Brazil and Argentina to
grape production in the reference situation, have a compar- have a comparative advantage. Their shares in global oil
ative disadvantage and will entirely abandon grape produc- crop production will raise from 13, 9 % and 6 % respectively
tion when α = 1.5. For oranges, Brazil and the US have a (reference) to 16 %, 13 % and 9 % (α = 1.5). The US and
comparative advantage, while Mexico, Spain and Iran have a Malaysia, contributing 17 % and 12 % respectively to global
comparative disadvantage (Fig. S2). oil crop production in the reference situation, have a com-
parative disadvantage and will reduce their oil crop produc-
tion by 32 % and 14 % respectively in the optimized cropping
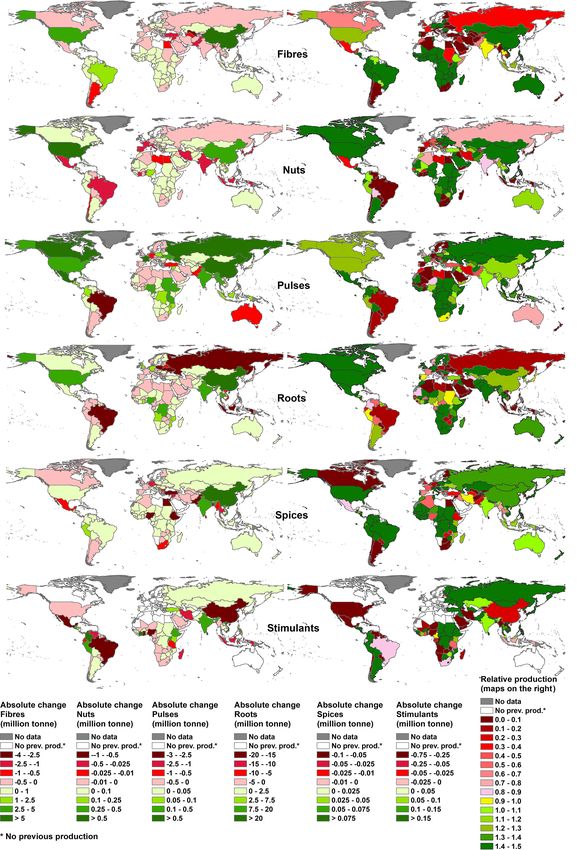
https://doi.org/10.5194/hess-24-3015-2020 Hydrol. Earth Syst. Sci., 24, 3015–3031, 20203024 H. Chouchane et al.: Changing global cropping patterns to minimize national blue water scarcity Figure 4. Absolute change in production for cereals, fruits, oil crops, sugar crops and vegetables per country (in 106 t yr−1 ; maps on the left) and relative production (ratio of production in optimized and reference situation) for the same crops groups for the case of an optimized cropping pattern with α = 1.5 (maps on the right), all compared to the reference cropping period (1996–2005). Relative production = 1: no change; relative production < 1: national production is reduced; relative production > 1: national production is expanded. Hydrol. Earth Syst. Sci., 24, 3015–3031, 2020 https://doi.org/10.5194/hess-24-3015-2020
H. Chouchane et al.: Changing global cropping patterns to minimize national blue water scarcity                                            3025

Figure 5. Absolute change in production for fibres, nuts, pulses, roots, spices and stimulants per country (in 106 t yr−1 ; maps on the left) and
relative production (ratio of production in optimized and reference situation) for the same crops groups for the case of an optimized cropping
pattern with α = 1.5 (maps on the right), all compared to the reference cropping period (1996–2005). Relative production = 1: no change;
relative production < 1: national production is reduced; relative production > 1: national production is expanded.

https://doi.org/10.5194/hess-24-3015-2020                                                 Hydrol. Earth Syst. Sci., 24, 3015–3031, 2020
3026                    H. Chouchane et al.: Changing global cropping patterns to minimize national blue water scarcity

pattern (when α = 1.5). Focussing on soybean, which con-           and will stop their production almost entirely in the opti-
tributes 36 % to the global oil crop production, we find the       mized situation.
comparative advantage for Argentina and Brazil. The share
of Argentina and Brazil in global soybean production will          3.4    Sensitivity to restricting expansion to rainfed areas
rise from 14 % and 22 % respectively (reference) to 21 % and
33 % (α = 1.5). China and the US have a comparative disad-         By allowing only rainfed areas per crop to expand up to 10 %
vantage in soybean production. While the US, contributing          and the irrigated area per crop only to shrink, global blue
43 % to the global soybean production in the reference pe-         water consumption of crop production is reduced by 16 %.
riod, will reduce its production by 31 %, China, contributing      When α is equal to 1.3, 1.5 and 2.0 (i.e. when harvested
9 % in the reference period, will entirely stop its soybean pro-   area per crop per country can expand by up to 30 %, 50 %
duction in the optimized pattern (when α = 1.5; Fig. S3).          and 100 %), global blue water consumption gets reduced by
                                                                   31 %, 41 % and 54 % respectively. The maximum blue water
3.3.4   Sugar crops                                                scarcity is reduced to a scarcity of 62 %, 14 %, 5 % and 3 %
                                                                   when α is equal to 1.1, 1.3, 1.5 and 2.0 respectively (Table 4).
                                                                      The shifts in only the rainfed area give a dominant contri-
Brazil and China have a comparative advantage in sugar crop        bution to the reduction of the maximum BWS value when
production, with shares in global sugar crop production ris-       allowing both rainfed and irrigated areas to expand. Con-
ing from 23 % and 6 % respectively (reference) to 35 % and         tributions from only rainfed areas shifts amount to 90 % of
9 % (optimized cropping pattern with α = 1.5). India, cur-         the total reduction when α is equal to 1.1 to 97 %, 99 % and
rently contributing 18 % to the global sugar crop production,      99.6 % when α is equal to 1.3, 1.5 and 2.0 respectively. The
has a comparative disadvantage and will quit sugar crop pro-       dominance effect of shifts in rainfed areas proves that the op-
duction almost entirely. Considering sugar beet and sugar          timization results are not very sensitive to modestly allowed
cane separately, we find that France, Poland, the Russian          expansion in irrigated areas per crop.
Federation and the US have a comparative advantage in sugar
beet production. Germany, Turkey and Ukraine, contributing
11 %, 7 % and 6 % to the global sugar beet production (ref-
                                                                   4     Discussion
erence), have a comparative disadvantage and will decrease
their sugar beet production by 72 %, 100 % and 94 % respec-
                                                                   Our study has some limitations that need careful consider-
tively (when α = 1.5). For sugar cane, Brazil and China have
                                                                   ation when interpreting results. Limited by the availability
a comparative advantage; their shares in global sugar cane
                                                                   of some of the required data and operational computational
production will increase from 28 % and 6 % respectively (ref-
                                                                   limitations of optimization software, we analyse the global
erence) to 42 % and 10 % (optimized cropping pattern with
                                                                   cropping pattern at the country scale rather than at subna-
α = 1.5). India, contributing 22 % to global sugar cane pro-
                                                                   tional or grid scale. However, having a high average yield
duction in the reference period, has a comparative disadvan-
                                                                   for a specific crop in a certain country does not necessarily
tage and will decrease its sugar cane production by almost
                                                                   mean that everywhere in that country the same performance
100 % (Fig. S3).
                                                                   in terms of land and water productivity is achieved, due to
                                                                   spatial differences in crop suitability. This could result in re-
3.3.5   Vegetables                                                 allocating crops to countries that have a very limited suitable
                                                                   production area but are productive in terms of water and land
China and India have a comparative advantage in vegetable          in the reference situation. To constrain this effect, we do not
production. Their shares in global vegetable production will       allow total cropland per country to expand so that areal ex-
rise from 45 % and 9 % respectively (reference) to 52 and          pansion for one crop replaces the land use of another crop
12 % respectively (optimized cropping pattern with α = 1.5).       with a shrinking area; also, we limit the expansion in crop-
Turkey, contributing 4 % to global vegetable production in         land by a certain maximum rate for each crop per country
the reference, has a comparative disadvantage and will re-         (the factor α). The analysis at the country level also has im-
duce its vegetable production by 83 % in the optimized pat-        plications for the interpretability of water scarcity indicators.
tern (when α = 1.5) compared to the reference situation.           Assessing water scarcity at the country level for an average
Looking at the most produced vegetable crop, tomato, which         year hides the water scarcity that manifests itself in particular
contributes 15 % to global vegetable production, we find that      places within countries or in particular periods (Mekonnen
China and the US have a comparative advantage (Fig. S3).           and Hoekstra, 2016). We minimize average water scarcity in
The share of China and the US in the global production of          countries; within countries scarcity differences will still ap-
tomatoes will increase from 21 % and 11 % respectively (ref-       pear, both in the reference situation and in the case of the
erence) to 30 % and 16 % respectively (when α = 1.5). Egypt        optimized cropping patterns. Still, water scarcity indicators
and Turkey, contributing 6 % and 8 % to global tomato pro-         at national levels provide insight; within the framework of
duction in the reference, have a comparative disadvantage          the Sustainable Development Goals, indicator 6.4.2 (“Level

Hydrol. Earth Syst. Sci., 24, 3015–3031, 2020                                         https://doi.org/10.5194/hess-24-3015-2020
H. Chouchane et al.: Changing global cropping patterns to minimize national blue water scarcity 3027
Table 4. Current versus optimized maximum BWS when allowing both irrigated and rainfed areas to expand and when allowing only rainfed
areas to expand and the share of rainfed areas shifts in reducing maximum BWS for the case when α is equal to 1.1, 1.3, 1.5 and 2.0
respectively.
Factor α Maximum BWS Reduction in maximum BWS Share of rainfed
Current∗ Optimized compared to reference situation shifts in reducing
Expansion in both Expansion only Expansion in both Expansion only maximum BWS
irrigated and in rainfed areas irrigated and in rainfed areas
rainfed areas rainfed areas
α = 1.1 272 % 39 % 62 % −86 % −77 % 90 %
α = 1.3 272 % 6% 14 % −98 % −95 % 97 %
α = 1.5 272 % 4% 5% −99 % −98 % 99 %
α = 2.0 272 % 2% 3% −99 % −99 % 99.6 %
∗ Independent of α .
of water stress”) is used to monitor Goal 6 (“Ensure avail- cropping patterns found here are better than the reference
ability and sustainable management of water and sanitation pattern, because what is best depends on many more fac-
for all”). It is defined similar to water scarcity in our study, tors than are included here, including political preferences.
also at the resolution of countries, but based on water extrac- Rather, our results are instrumental in illustrating directions
tions rather than consumptive water use. While lowering the of change if we would put emphasis on the factors of land and
water stress level is a goal for each country, from a global water endowment and productivity and put particular value
equity perspective lowering stress in countries with the high- on reducing water scarcity in the most water-scarce places.
est water scarcity is prioritized. This is operationalized by The scope of the current study is restricted to the ex-
choosing the maximum national water scarcity as an objec- ploration of alternative cropping patterns to reduce water
tive function in the optimization. Relieving water scarcity scarcity in the reference situation; we therefore use reference
in specific hotspots within countries by changing cropping resource efficiencies. We do not take into consideration the
patterns could be studied using the current approach but is future increase in food demand due to population growth,
beyond the scope of this paper. The sensitivity analysis did agronomic developments that may increase resource use ef-
show that by far the largest impact on water scarcity relief ficiencies or climate change that will affect the future ability
emerges from shifts in cropping patterns of rainfed crops, of countries to produce crops. The current study supports the
not depending on the heterogeneity of blue water availabil- findings of Davis et al. (2017a) on the benefits of crop redis-
ity; therefore water scarcity reduction in countries with the tribution on water saving which could be a potential strategy
highest scarcity at the national level in the current study does for sustainable crop production and an alternative to the large
not rely on worsening water scarcity in countries with het- investments that are usually needed to close up the techno-
erogeneous conditions. logical and yield gaps in developing nations. Besides reduc-
Another limitation of this study is the focus on water and ing water and land use, changing cropping patterns will also
land endowments and productivities and on global water have an impact on reducing greenhouse gas emission that re-
scarcity reduction as a shared goal, while other production sults from extensive energy activities in irrigation, such as
factors such as labour, knowledge, technology and capital groundwater pumping, which accounted for around 61 % of
can be limiting factors to expanding the production of cer- total irrigation emissions in China (Zou et al., 2015).
tain crops in some countries, and certainly, agroeconomic as- The results suggest that Asia, for example, could con-
pects may play a role in considering comparative advantages tribute to global water scarcity mitigation by reducing its
as well. Other factors could be included in a future study production of fruits and sugar crops while increasing its ce-
by refining the optimization model; other objective functions real and vegetable production. This implies that Asia will
could emphasize trade-offs between economic and environ- move to economically less attractive crops. This illustrates
mental goals. Moreover, agricultural, trade and food security the possible trade-off between the goal of reducing water
policies could be other factors that drive cropping patterns scarcity in the most water-scarce countries and the goal of
rather than water and land availability (Davis et al., 2018). economic profit by producing cash crops by individual coun-
Here, we purposely limited our analysis to considering com- tries or regions. The optimization results do not pretend that
parative advantages from a perspective of land and water re- the changes in production patterns are likely to occur but
source use to understand the specific role of these two partic- merely that these changes reduce water scarcity most; na-
ular factors. By no means do we suggest that the optimized tional and international policies would be required to pro-
https://doi.org/10.5194/hess-24-3015-2020 Hydrol. Earth Syst. Sci., 24, 3015–3031, 20203028 H. Chouchane et al.: Changing global cropping patterns to minimize national blue water scarcity mote such water-saving changes to be implemented (Klasen tries, with modest rainfed agricultural areas, will rely more et al., 2016). heavily on imports and thus become highly dependent on Changing cropping patterns could reduce the global blue other countries. Most of these countries already have a high water footprint by 21 % and global irrigated area by 10 %. dependency on crop imports in the reference situation. This These findings prove that current high scarcity levels in a reflects a trade-off between reducing water scarcity and in- serious number of countries are shown to be caused by the creasing food security on the one hand and shows the im- current crop allocation pattern rather than by an inevitability portant role of food trade in relieving water scarcity in many of those scarcities to occur; that suggests that water endow- places in the world on the other. ment is insufficiently driving crop allocation to avoid wa- ter scarcity. This in consistent with Zhao et al. (2019) who find in their study for China that comparative advantages 5 Conclusion with respect to labour and water were not reflected in the re- gional distribution of agricultural production. However, not When allowing a 10 % maximum expansion of harvested all countries would benefit similarly in the optimized set. In- area per crop and per country, while not allowing an increase dia and China, the main crop producers in the reference sit- in the total rainfed or irrigated cropland per country, a global uation, will only start to have a decrease in their blue water blue water saving of 17 × 1010 m3 yr−1 is achievable, which scarcity when the allowed expansion rate is larger than 20 %. is 21 % of the current global blue water footprint. Changes in This is in line with the findings of Davis et al. (2017a), who the cropping pattern of rainfed production have a dominant find in their simulations that water scarcity persists in many effect, relieving irrigated areas to contribute to production; important agricultural areas (the US Midwest, northern India the total global harvested area would decrease by 2 %, and and Australia’s Murray–Darling basin, for example), indicat- the total global irrigated area would decrease by 10 %. The ing that extensive crop production in these places prohibits blue water scarcity in the seven countries with highest na- water sustainability, regardless of crop choice (Davis et al., tional water scarcity, Libya, Saudi Arabia, Kuwait, Yemen, 2017a). Qatar, Egypt and Israel (with current scarcities ranging from Findings suggest that China, one of the world’s main pro- 54 % to 270 %), can be reduced to a scarcity of 39 % or less. ducers of the major crop, will abandon soybean production Optimizing the global cropping pattern to reduce the highest and halve wheat irrigation area. This will relieve some of the national water scarcity comes with trade-offs, where severely pressure on the northern part of China, where water scarcity water-scarce countries reduce water scarcity at the expense of is the most severe (Ma et al., 2020). China will increase the decreased food self-sufficiency. harvested area of rice and rapeseed, the crops with the most When considering how to change the global cropping pat- significant comparative advantage in terms of land and wa- tern in order to reduce water scarcity in the world’s most ter. Similarly, our results suggest that the US, another major severely water-scarce countries, we specifically find the fol- crop producer, would restrict soybean production to rainfed lowing major shifts. Cereal production is reduced in Africa systems, abandoning irrigation, in the optimized set in the and South America and increased in North America and Eu- US. The US focuses on producing maize, mainly rainfed, for rope. Fruit production is reduced most significantly in Asia which the US has a comparative advantage in terms of water and Africa and expanded in the Americas. Oil crop produc- and land productivities. This may be a great relief to the US tion is reduced most significantly in Africa and expanded in Corn Belt, where most of the irrigated soybean and maize the Americas. Sugar crop production is reduced most sig- crops are located (Zhong et al., 2016), and could be a rem- nificantly in Asia and Africa and expanded in the Americas. edy to the projected water shortage of that region resulting Vegetable production is reduced most significantly in Europe from population growth and climate change (Brown et al., and Africa and expanded in Asia. Reallocating cereal crops is 2019). We also find that India, another of the world’s major the main contributor to global blue water saving with a con- producers of crops, will move away from sorghum produc- tribution of 50 % for the case of α = 1.1, followed by fruit, tion and shift a large share of its rice and wheat production sugar crops and fibres with 12 %, 10 % and 9 % respectively. to rainfed conditions. Moving to rainfed production in In- From a water and land perspective and aiming for global dia could mitigate the effect of the intensive use of irrigation water scarcity reduction, comparative advantages for cereal from groundwater and surface water which caused ground- production are found for the US and to a lesser extent In- water degradation in many districts of Haryana and Punjab, donesia and France, whereas India has a comparative dis- the largest contributing states to rice and wheat production in advantage. A comparative advantage exists for the US for India (Singh, 2000). maize, for France for wheat and barley and for Indonesia For some of the most water-scarce countries, results show for rice. India has a comparative disadvantage in cereal pro- that blue water consumption in crop production is reduced by duction, particularly for wheat and rice. For fruit production, more than 70 % compared to the reference situation: Cyprus, Brazil and the US are found to have a comparative advan- Egypt, Iran, Jordan, Kuwait, Libya, Pakistan, Saudi Arabia, tage, whereas China and India have a comparative disad- Syria, Turkmenistan and Yemen. This means that these coun- vantage. More specifically, the US has a comparative advan- Hydrol. Earth Syst. Sci., 24, 3015–3031, 2020 https://doi.org/10.5194/hess-24-3015-2020
H. Chouchane et al.: Changing global cropping patterns to minimize national blue water scarcity                                           3029

tage for apples, grapes and oranges, and Ecuador and Brazil              Financial support. The work by Maarten S. Krol and Ar-
have one for bananas, while China has a comparative dis-                 jen Y. Hoekstra was partially funded by the European Research
advantage for apples and India for bananas. For oil crops,               Council (ECR) under the European Union’s Horizon 2020 research
Indonesia, Brazil and Argentina have a comparative advan-                and innovation programme through the project “Moving Towards
tage, and the US and Malaysia have a comparative disadvan-               Adaptive Governance in Complexity: Informing Nexus Security”
                                                                         (MAGIC; EU H2020 grant no. 689669) and Earth @lternatives
tage. Argentina and Brazil have a comparative advantage for
                                                                         (grant agreement no. 834716).
soybean, while the US and China have a comparative dis-
advantage. For sugar crop production, Brazil and China are
found to have a comparative advantage, while India has com-
                                                                         Review statement. This paper was edited by Gerrit H. de Rooij and
parative disadvantage. Brazil and China have a comparative               reviewed by three anonymous referees.
advantage for sugar cane, while India has a comparative dis-
advantage. For vegetables, we find China and India to have
a comparative advantage and Turkey to have a comparative
disadvantage. China has a comparative advantage for toma-
toes, and Turkey has a comparative disadvantage.
                                                                         References
   By considering differences in national water and land en-
dowments, following the Heckscher–Ohlin theory of com-                   Allan, J. A.: Virtual Water: A strategic resource global so-
parative advantage, as well as differences in national water               lutions to regional deficits, Ground Water, 36, 545–546,
and land productivities, following Ricardo’s theory of com-                https://doi.org/10.1111/j.1745-6584.1998.tb02825.x, 1998.
parative advantage, we combine two rationales that are both              Bouman, B. A. M.: A conceptual framework for the improvement
relevant. With the optimization exercises carried out in this              of crop water productivity at different spatial scales, Agr. Syst.,
study, we show that blue water scarcity can be reduced to rea-             93, 43–60, https://doi.org/10.1016/j.agsy.2006.04.004, 2007.
sonable levels throughout the world by changing the global               Brown, T. C., Mahat, V., and Ramirez, J. A.: Adaptation to Fu-
cropping pattern while maintaining current levels of global                ture Water Shortages in the United States Caused by Popula-
production and reducing land use. Future research could re-                tion Growth and Climate Change, Earth’s Future, 7, 219–234,
fine the current study by taking the subnational heterogeneity             https://doi.org/10.1029/2018ef001091, 2019.
                                                                         Chapagain, A. K., Hoekstra, A. Y., and Savenije, H. H. G.: Water
of water scarcity into account and by interpreting resulting
                                                                           saving through international trade of agricultural products, Hy-
changes in international trade patterns.
                                                                           drol. Earth Syst. Sci., 10, 455–468, https://doi.org/10.5194/hess-
                                                                           10-455-2006, 2006.
                                                                         Chouchane, H., Krol, M. S., and Hoekstra, A. Y.: Expected increase
Data availability. The datasets generated and/or analysed                  in staple crop imports in water-scarce countries in 2050, Wa-
during the current study are available in the Supplement                   ter Res., 1, 100001, https://doi.org/10.1016/j.wroa.2018.09.001,
and the 4TU.ResearchData repository (CC-BY-NC-ND)                          2018.
at         https://doi.org/10.4121/uuid:64e7f59a-03f3-4e25-83c8-         Chouchane, H., Krol, M. S., and Hoekstra, A. Y.: Dataset
06745e9216d2 (Chouchane et al., 2020).                                     for: Changing global cropping patterns to minimize na-
                                                                           tional blue water scarcity, Dataset, 4TU.Centre for Re-
                                                                           search Data, https://doi.org/10.4121/uuid:64e7f59a-03f3-4e25-
Supplement. The supplement related to this article is available on-        83c8-06745e9216d2, 2020.
line at: https://doi.org/10.5194/hess-24-3015-2020-supplement.           Chukalla, A. D., Krol, M. S., and Hoekstra, A. Y.: Green and blue
                                                                           water footprint reduction in irrigated agriculture: effect of irriga-
                                                                           tion techniques, irrigation strategies and mulching, Hydrol. Earth
Author contributions. The three authors designed the research,             Syst. Sci., 19, 4877–4891, https://doi.org/10.5194/hess-19-4877-
analysed the data and wrote the paper. HC carried out the calcu-           2015, 2015.
lations.                                                                 Davis, K. F., Rulli, M. C., Seveso, A., and D’Odorico, P.:
                                                                           Increased food production and reduced water use through
                                                                           optimized crop distribution, Nat. Geosci., 10, 919–924,
Competing interests. The authors declare that they have no conflict        https://doi.org/10.1038/s41561-017-0004-5, 2017a.
of interest.                                                             Davis, K. F., Seveso, A., Rulli, M. C., and D’Odorico, P.: Water
                                                                           savings of crop redistribution in the united states, Water, 9, 83,
                                                                           https://doi.org/10.3390/w9020083, 2017b.
                                                                         Davis, K. F., Chiarelli, D. D., Rulli, M. C., Chhatre, A., Richter,
Acknowledgements. Hatem Chouchane and Maarten S. Krol ded-
                                                                           B., Singh, D., and DeFries, R.: Alternative cereals can improve
icate this work to their co-author, Arjen Y. Hoekstra, who passed
                                                                           water use and nutrient supply in India, Sci. Adv. 4, eaao1108,
away unexpectedly just before the revision of this paper and whose
                                                                           https://doi.org/10.1126/sciadv.aao1108, 2018.
ideas and ideals greatly influenced and will still influence a genera-
                                                                         Evans, R. G. and Sadler, E. J.: Methods and technologies to im-
tion of scientists.
                                                                           prove efficiency of water use, Water Resour. Res., 44, W00E04,
                                                                           https://doi.org/10.1029/2007WR006200, 2008.

https://doi.org/10.5194/hess-24-3015-2020                                              Hydrol. Earth Syst. Sci., 24, 3015–3031, 2020
You can also read