Predicting chromosome damage in astronauts participating in international space station missions
←
→
Page content transcription
If your browser does not render page correctly, please read the page content below
www.nature.com/scientificreports
OPEN Predicting chromosome damage
in astronauts participating
in international space station
missions
Alan Feiveson1, Kerry George2, Mark Shavers2, Maria Moreno‑Villanueva1,3, Ye Zhang4,
Adriana Babiak‑Vazquez2, Brian Crucian1, Edward Semones1 & Honglu Wu1*
Space radiation consists of energetic protons and other heavier ions. During the International Space
Station program, chromosome aberrations in lymphocytes of astronauts have been analyzed to
estimate received biological doses of space radiation. More specifically, pre-flight blood samples
were exposed ex vivo to varying doses of gamma rays, while post-flight blood samples were collected
shortly and several months after landing. Here, in a study of 43 crew-missions, we investigated
whether individual radiosensitivity, as determined by the ex vivo dose–response of the pre-flight
chromosome aberration rate (CAR), contributes to the prediction of the post-flight CAR incurred from
the radiation exposure during missions. Random-effects Poisson regression was used to estimate
subject-specific radiosensitivities from the preflight dose–response data, which were in turn used to
predict post-flight CAR and subject-specific relative biological effectiveness (RBEs) between space
radiation and gamma radiation. Covariates age, gender were also considered. Results indicate that
there is predictive value in background CAR as well as radiosensitivity determined preflight for
explaining individual differences in post-flight CAR over and above that which could be explained by
BFO dose alone. The in vivo RBE for space radiation was estimated to be approximately 3 relative
to the ex vivo dose response to gamma irradiation. In addition, pre-flight radiosensitivity tended to
be higher for individuals having a higher background CAR, suggesting that individuals with greater
radiosensitivity can be more sensitive to other environmental stressors encountered in daily life. We
also noted that both background CAR and radiosensitivity tend to increase with age, although both
are highly variable. Finally, we observed no significant difference between the observed CAR shortly
after mission and at > 6 months post-mission.
Space radiation consists of high energy protons and heavy charged particles1. For spacecraft in low Earth orbits
such as the International Space Station (ISS), protons trapped in the van Allen belt, high energy ions from galactic
cosmic radiation (GCR) that are not deflected by the geomagnetic field and particles released from solar particle
events (SPE) are three of the major sources of radiation. Inside the ISS, secondary particles including neutrons
are also generated as the primary particles penetrate through the shielding materials of the spacecraft. High
energy charged particles, which possess high linear energy transfer (LET) are known to cause more damage in
comparison to gamma or X-rays1, Health risks from exposure to cosmic radiation have been a major concern for
astronauts since the early days of the manned space program2. Exposure to space radiation may result in cancer
and other health consequences, and can potentially impact the success of future exploration missions to M ars3.
Assessing the health risks associated with space-radiation is challenging due the complexity of the space radiation
environment and other confounding spaceflight-associated factors such as microgravity and c onfinement4–6.
One measurable effect of exposure to space radiation is an increase in chromosome aberrations (CA) in
astronauts’ peripheral blood lymphocytes. CA yields are a reliable biodosimetry tool for estimating an individual’s
radiation dose after accidental exposure scenarios7,8. NASA’s analysis of chromosome aberrations in blood sam-
ples collected from crewmembers before and after space missions started when US astronauts flew on the Russian
Mir Station for extended p eriods9,10. After a 9-day Space Shuttle mission, biodosimetry analyses were performed
1
NASA Johnson Space Center, Houston, TX 77058, USA. 2KBR, Houston, TX 77058, USA. 3Human
Performance Research Centre, Department of Sport Science, University of Konstanz, Box 30, 78457 Konstanz,
Germany. 4Kennedy Space Center, Cape Canaveral, Florida, USA. *email: honglu.wu-1@nasa.gov
Scientific Reports | (2021) 11:5293 | https://doi.org/10.1038/s41598-021-84242-5 1
Vol.:(0123456789)www.nature.com/scientificreports/
on 2 crewmembers; however no change in chromosome aberration frequency was detected in this short-duration
mission9,11. Since the beginning of the International Space Station (ISS) program, biodosimetry analysis has also
been performed on US ISS a stronauts12,13. Increases in CA in the blood lymphocytes from Russian cosmonauts
and other European astronauts have also been r eported14–16. Recent efforts undertaken by other space agencies
for conducting similar studies are also underway17. Although molecular markers, such as gene expression or
protein induction have been used to reconstruct radiation doses in humans, chromosomal damage assessed in
lymphocytes remains the most reliable biomarker for biodosimetry p urposes18,19.
In this paper, we present an analysis of CA data collected from astronauts` blood cells before and after ISS
missions. Blood samples were obtained from 38 astronauts who participated in ISS missions from 2001 to
2013. Durations of these missions ranged between 2 and 7 months. Five of these astronauts participated in two
space missions, thus creating the opportunity to investigate the effect of repeat missions and at the same time
to increase the number of crew-missions from 38 to a total of 43. Two main data analyses were performed. The
first analysis was intended to assess the degree to which prediction of post-flight chromosome aberration rates
could be improved by incorporating information from subject-specific ex vivo pre-flight dose–response models
as opposed to prediction based exclusively on BFO doses. In the second analysis, we estimated subject-specific
dose-equivalent ratios (analogous to the RBE) by comparing the preflight effect of ex vivo laboratory gamma
irradiation with the in vivo effect of real space radiation as manifested in post-flight data. In addition, spin-off
analyses were conducted in order to investigate post-flight recovery patterns as well as the effects of mission
duration, repeat ISS missions, and the solar cycle. All data analyses were performed using a random-effects ver-
sion of Poisson regression with age and gender as covariates (Statistical Methods).
Materials and methods
Subjects and samples. Blood samples were collected from 38 crew members participating in long-dura-
tion ISS missions. Because five of these crewmembers participated in two separate missions (ranging from 3
to 9 years apart), a total of 43 crew-missions was potentially available for data analysis. The age of these crew-
members was between 37 and 57 at the time of their ISS mission, and 10 of the crew-members were female. The
shortest duration of the ISS missions studied was 67 days and the longest 215 days, resulting in an average BFO
dose of 0.028 Gy. For each of the crewmembers, samples were initially collected 1 month before launch. Imme-
diately after blood draw, samples were exposed to an acute dose of 0.1, 0.2, 0.3, 0.4, 0.8 or 2 Gy of gamma rays at
the NASA Johnson Space Center at a high dose rate. Since the average dose received during the ISS missions is
28 mGy, gamma-ray dose points above 0.5 Gy were not used in this study. Even though 0.5 Gy is more than 10
times higher than the dose received in space, it is necessary to retain this dose point to allow enough points (4 in
this case) to enable reasonably accurate estimation of subject-specific dose–response models and radiosensitivi-
ties (see Statistical Methods).
In order to assess the chromosomal damage due to space flight and compare with pre-flight dose–response
outcomes, post-flight blood samples from 39 of the 43 crew-missions were collected between 2 and 4 weeks after
landing. Furthermore, in order to investigate long-term effects, blood samples from most crewmembers were
additionally collected 6 months (or longer) after landing. Our study follows an IRB protocol approved by the
NASA Johnson Space Center Institutional Review Board. All methods were carried in accordance with relevant
guidelines and regulations. The informed consent was obtained from all crewmembers participating in this study.
Analysis of similar pre-flight and post-flight chromosome aberration data collected from 19 of the ISS crew
members studied here has been published previously12. Also, pre-flight dose–response CA data has been pub-
lished for 34 of the crewmembers studied h ere13, but post-flight data for 29 of them has not yet been published.
Chromosome aberration analysis. Detailed methods for collection of blood samples and chromosome
analysis have been reported previously9. Briefly, astronauts’ venous blood samples were collected in vacutainer
tubes containing sodium heparin, at various times before and after flight. Preflight blood samples were exposed
to Cs-137 gamma rays at a high dose rate at NASA Johnson Space Center. Immediately after gamma irradiation,
cells were cultured in growth medium and chromosomes were subsequently collected following the standard
escribed9. Post-spaceflight blood samples were cultured in growth medium for chromosome collec-
protocol as d
tion without ex vivo gamma irradiation. Chromosomes harvested were within the first cell cycle after stimula-
tion.
Chromosome spreads were hybridized in situ with three fluorescence-labeled chromosome specific paint-
ing DNA probes in different colors; red, green, and yellow (i.e. a 1:1 combination of green and red probes that
fluoresces yellow under a triple band pass filter set)12. In most cases, chromosomes 1, 2, and 4 were analyzed.
However, some of the earlier data was obtained using chromosomes 1, 2, and 5. For a direct comparison of data
using different probe combinations, the frequencies of exchanges in individual chromosomes were extrapolated
to whole genome e quivalents12. On average around 8000 cells were analyzed from each unirradiated pre-flight
and all post-flight blood sample. The numbers of the cells analyzed were fewer in gamma-irradiated samples, for
which higher aberration counts were expected. See the Appendix for tables of average number of samples and
average aberration counts for both pre- and post-flight samples.
Two bicolor chromosomes each containing a centromere were classified as an apparent reciprocal transloca-
tion, and recorded as a single exchange event. Reciprocal translocations were classified as stable type aberrations12.
A dicentric was identified by one bicolor exchange containing two centromeres and a corresponding fragment
with no centromere. We assumed visibly incomplete translocations and dicentrics (or one-way exchanges) con-
reviously20), and therefore pooled
tained reciprocal fragments that were below the level of detection (as indicated p
this data with complete exchanges. Complex exchanges were scored when it was determined that an exchange
involved a minimum of three breaks in two or more chromosomes. Total exchanges were calculated by adding
Scientific Reports | (2021) 11:5293 | https://doi.org/10.1038/s41598-021-84242-5 2
Vol:.(1234567890)www.nature.com/scientificreports/
the number of apparently simple translocations, dicentrics, incomplete translocations, incomplete dicentrics,
and complex exchanges. All data were screened carefully for clonal exchanges. If a clone was identified it was
counted as a single e xchange12. Here, we report results from data analysis of total exchanges, however we also
made a parallel analysis of stable translocations (see Appendix).
Physical dosimetry and BFO dose and BFO dose equivalent calculation. Various radiation
dosimeters were used on the ISS to assess the radiation environment and to measure the dose received by the
crewmembers, including tissue equivalent proportional counters (TEPC) and crew passive dosimeters (CPD)21.
Because a CPD measures the dose received at the surface of the crewmember´s chest, the degree of exposure to
internal organs was estimated using the computer codes that calculate the dose by modeling the transporting of
particles in the environment to the organ of interest22. These codes include BRYTRN and HZETRN for trapped
protons and GCR particles, respectively22. Standard male and female sizes of astronauts were first assumed when
computing the dose, which was then normalized to the CPD measurement for individual crewmembers. The
body shield distribution for individual organs was provided by computerized anatomical models represent-
ing the 50th percentile US Air Force male and female23,24. In the model, 32 locations throughout the body are
selected to represent the BFO, and the overall body shielding distribution is derived from the average of the 32
locations23,24. It has been estimated that the errors in organ dose estimates are about 15%25.
Statistical methods. For each blood sample, let k be the number of chromosome aberrations (either total
exchanges or stable translocations) observed in n lymphocytes. Under assumptions that a) aberrations occur
independently, b) λ, the probability of an aberration in a given cell is small while the number of cells sampled
is large, and c) the probability of more than one aberration in a cell is negligible, k is approximately Poisson
distributed with mean nλ. The Poisson approximation is appropriate here where observed CARs are less than
0.04 and n ranges from 88 to over 16,000. In Poisson regression, log λ is represented as a function of explanatory
variables (see below). For a discussion of Poisson regression for dose–response modeling, s ee26. Separate Pois-
son regression models were fitted with a) pre-flight data only (excluding the baseline observations) b) post-flight
plus baseline data, and c) all data, pre- and post-flight.
Pre‑flight model. Let xij be the gamma-ray dose in Gy for the j-th exposure of cells from the i-th subject, and let
kij be the corresponding observed total aberration count in nij cells. Then we used the following random-effects
version of a Poisson regression model for kij:
kij ∼ Poisson nij ij (1)
log ij = β0 + W0i + (β 1 + W1i )xij + β2 A50i + β3 Fi (2)
where A50i is the subject’s age centered at 50 years, and Fi is an indicator variable for gender (0 = male, 1 = female).
The random effects W0i and W1i are subject-specific perturbations to the intercept (β0) and slope with respect to
dose (β1 ). For purposes of describing this model and the post-flight and RBE models (see below), “subject” or
“crewmember” refers to each of the 43 crew-mission participants. When referring to actual individuals, some of
whom participated in two missions, we will use the term “astronaut”. In this model, it is assumed that W0i and
W1i (i = 1, 2.., 43) follow a bivariate normal distribution. Incorporation of random effects into the model are
necessary because it cannot be assumed that the parameters β0 and β1 of the dose response model are the same
for subjects with varying sensitivities. This model was fitted in Stata Statistical S oftware27 by maximizing the
unconditional Poisson likelihood. Standard errors of all parameter estimates were obtained from the inverse of
the information matrix obtained after likelihood maximization. For further study of radiosensitivity as a function
of age, we calculated Bi the average slope of the fitted dose response function for the i-th individual by
iJ −
i0
Bi = (3)
xiJ − xi0
where ij is the predicted value of ij after fitting the model (Eq. 2), where J is the value of j corresponding to
the maximum dose xiJ and j = 0 denotes the baseline dose ( xi0 = 0). Note that because of nonlinearity Bi is only
approximately equal to the predicted value of β1 + w1i . First, we fit this model with all pre-flight observations
to obtain the best possible characterization of the ex vivo dose–response model; however in order to preserve
independence of results between pre- and post-flight analyses, baseline observations ( xij = 0) were excluded
from a second fitting of this model and were instead used in the post-flight model (see Eq. 4). In addition, w0i
and w1i , predicted values of W0i and W1i respectively were obtained as empirical-Bayes posterior means28,29 for
later use in the post-flight model.
Post‑flight model. The post-flight Poisson regression model resembled Eqs. (1) and (2) in form, but with the
following differences:
• ki0 denotes the baseline (pre-flight, no irradiation) aberration count for the i-the subject
• kij denotes the aberration count for the j-th post-mission sample of cells from the i-th subject (j = 1, 2, . . .)
• For j > 0, xij = BFOi , where BFOi is the BFO mission dose received by the i-th subject.
• For j = 0, there is no irradiation, so xi0 = 0.
• w0i and w1i xij are included as additional explanatory variables along with age and gender.
Scientific Reports | (2021) 11:5293 | https://doi.org/10.1038/s41598-021-84242-5 3
Vol.:(0123456789)www.nature.com/scientificreports/
With the incorporation of the above, Eq. (2) is replaced by Eq. (3) for the post-flight prediction model:
log ij = β0 + U0i + β 1 xij + β2 A50i + β3 Fi + β4 w0i + β5 w1i xij (4)
In this model, U0i , is an error term representing post-flight subject-specific perturbation to the intercept not
explained by other terms in the model. Here, β5 w1i can be interpreted as the degree to which β1, the post-flight
sensitivity to BFO dose is modified by subject-specific perturbations to sensitivity (w1i ) to gamma radiation in
the preflight ex-vivo series of exposures.
RBE estimation model. For purposes of estimating subject-specific and average RBE, all data is used in
one analysis. More specifically, kij now denotes the aberration count for the j-th sample of cells from the i-th
subject, including all pre-and post-flight samples. In this model, the index j runs from 1 to Ji , where Ji is the total
number samples obtained from the i-th subject (both pre- and post-flight).
The model now becomes
log ij = β0 + U0i + (β 1,pre + U1i )xpre,ij + β1,post xpost,ij + β2 A50i + β3 Fi , (5)
where xpre,ij is the gamma-radiation dose applied to the j-th sample of cells if that sample was obtained pre-flight;
otherwise xpre,ij = 0. Conversely, xpost,ij = Bi if the sample is post-flight; otherwise xpost,ij = 0. The terms U0i and
U1i are random perturbations to β0 and β1,pre,as in the pre-flight model.
Let x ∗ be the amount of gamma radiation needed to produce the same expected aberration count as an inflight
BFO dose x. Then the RBE is defined as the ratio x ∗ /x . From Eq. (4), it can be seen that for the i-th subject
(β1,pre + U1i )x ∗ = β1,post x , thus the RBE for the subject would be
β1,post
RBE i = (6)
(β1,pre + U1i )
For an average subject (U1i = 0), the RBE is simply
RBE = β1,post /β1,pre (7)
Note: There was not enough range of post-flight dose values to estimate subject-specific perturbations U2i to
β +U2i
β1,post . If values of U2i were available, the subject-specific RBE-values would be (β1,post
1,pre +U1i )
instead of Eq. (5). Thus,
it is likely that the range of RBE values given by Eq. (5) is conservative because their estimated variation is reduced
by not including U2i.
Repeat fliers. Five of the 38 astronauts in this study participated in two missions. To investigate whether
the pre-flight baseline or dose–response sensitivity for those astronauts had changed between missions we fit
an additional pre-flight mixed-effects Poisson regression model with age and mission number included as an
explanatory variables. The inclusion of age as a predictor accounts for age differences between missions, thus
allowing unbiased estimation of the mission effect on baseline and/or dose sensitivity This model estimated
random effects for each of the 38 distinct astronauts as opposed to the previous models that estimated random
effects for each of the 43 total crew-missions.
Results
Chromosome aberration rates (CARs). Pre-flight observations at doses greater than 0.5 Gy were dis-
carded because we were primarily interested in the low-dose response. For all remaining observations (both
pre- and post-flight), Fig. 1 shows the CAR for total aberrations plotted against radiation dose, where "Dose" is
the gamma- ray dose in Gy (preflight samples) or the estimated BFO dose in Gy as received during flight (post-
flight samples). The tendency of the post-flight observations of CAR to lie above the pre-flight dose response line
is reflecting an RBE of about 3.1.
Pre‑flight dose–response model. After discarding high-dose data, the mixed-effects Poisson regression
model (Eqs. 1–2) was applied to all remaining pre-flight observations, resulting in individual dose–response
models reflecting differences in W0i and W1i , as well as age and gender. Examples of these subject-specific dose–
response models are shown in Fig. 2 for 6 subjects whose average slopes varied between 0.014 (minimum) and
0.060 (maximum). Parameter estimates and standard errors for the overall mixed-effects model are shown in
Table 1. This table shows that the predicted baseline CAR for a male subject at age 50, would be exp(− 5.72) = 0.0033;
however, for some subjects this value could be expected to be as high as exp(− 5.72 + 0.46) = 0.0052 or as low as
exp(− 5.72 − 0.46) = 0.0021 where the value 0.46 is the estimated SD of W0i . Also, for an average subject, we
would expect the CAR to increase by a factor of exp(4.15/10) = 1.51 (51%) for each 0.1 Gy of gamma radiation
exposure, however for particular subjects this factor could be as high as exp((4.15 + 0.88)/10) = 1.65 (65%), or as
low as exp((4.15 − 0.88)/10) = 1.39 (39%), where the increment 0.88 is 1 SD of W1i . In addition, we estimated that
on average, baseline CAR would increase by a factor of exp(0.029) = 1.03 (2.9%) for each year of age. The effect
of age was also manifested in the radiosensitivies Bi , obtained from Eq. (3), which were weakly correlated with
age (r = 0.34; 95% conf = (+ 0.05, + 0.58). Similarly, estimates of background CAR (exp(β0 + W0i ) also appeared
weakly correlated with age (r = 0.24, 95% conf (− 0.06, + 0.50). See Figures A1 and A2 (Appendix) for illustrations
of these effects. For an average female subject (Woi = 0) at age 50 years, the baseline CAR was estimated to be
Scientific Reports | (2021) 11:5293 | https://doi.org/10.1038/s41598-021-84242-5 4
Vol:.(1234567890)www.nature.com/scientificreports/
Pre-flight post-flight
.015
.04
Pre-flight post-flight
.01
.04
.03
.005
.03
0
CAR
0 .02 .04 .06
.02
CAR
.02
.01
.01
0
0 .1 .2 .3 .4 .5
0
0 .1 .2 .3 .4 .5
Dose (Gy)
Figure 1. Observed chromosome aberration rate (CAR) in lymphocytes collected from the ISS crewmembers
pre-flight (blue circles) and post-flight (red triangles), plotted against dose where "dose" is either the ex-vivo
gamma-ray dose in Gy (pre-flight) or the estimated BFO dose in Gy, received during flight. The solid
curve shows the mean dose–response function estimated from Poisson regression on the pre-flight samples. The
average BFO dose received during ISS missions was 0.028 Gy, and the average CAR post-mission was 0.0049
(insert), reflecting an average RBE of about 3.1 (see RBE Estimation Model). Results presented in this and other
figures were generated using Stata Statistical S oftware27.
about exp(− 5.717 + 0.168) = 0.0038 as opposed to exp(− 5.717) = 0.0033 for an average male subject. However,
there was not enough evidence in support of an actual gender effect (p = 0.15).
Post‑flight dose–response model. The pre-flight Poisson regression model (Eqs. 1–2) was refitted, this
time without observations with xij = 0, to obtain predicted values (w0i , w1i ) of the random effects W0i and W1i ,
which were used in turn as predictors themselves in the post-flight model (Eq. 4). In fitting the post-flight model
the pre-flight observations with xij = 0 as well as all post-flight observations were used. After re-fitting the pre-
flight model, we obtained values of w0i and w1i for each of the 43 subjects. By definition, means of the random
effects are zero; standard deviations and the ranges of w0i and w1i are given in Table 2.
After fitting the post-flight model (Eqs. 1, 4) we obtained the parameter estimates in Table 3. As shown in
Table 3, the post-flight CAR for an average subject would be about 16% higher (exp(14.746/100) = 1.16) for every
increase in BFO dose of 0.01 Gy. However the CAR for subjects with “large” w1i (e.g. w1i = 1.5) would increase by
27% (exp((14.746 + 6.268 × 1.5)/100) = 1.27 ) for each increase of 0.01 Gy BFO dose. The significance of the term
“w1x” in Table 3 (coeff. est. = 6.268, SE = 1.611, p < 0.001) is that pre-flight in vivo sensitivity to gamma radiation
(manifested through w1i × xij) also contributes to the prediction of post-flight CAR over and above BFO dose
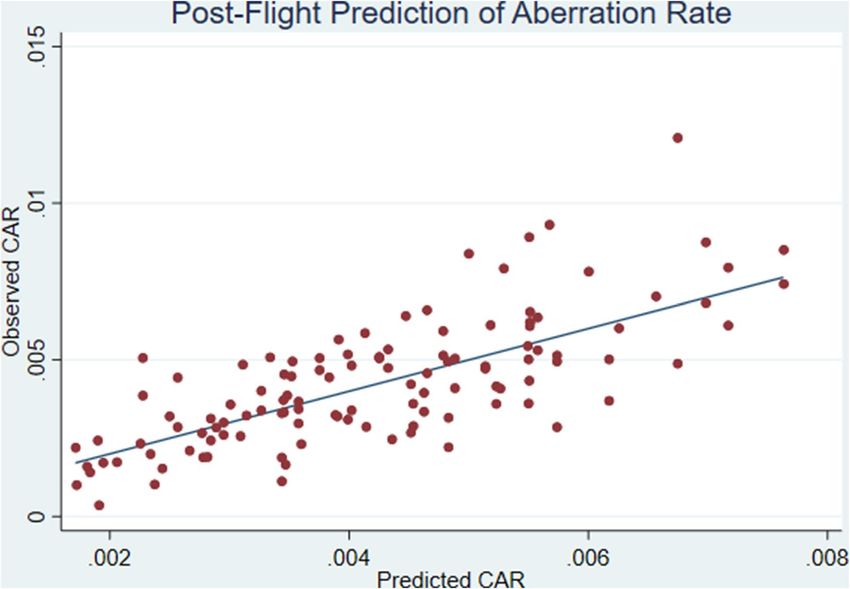
alone. Figure 3 shows actual vs. predicted values of post-flight CAR’s, where the predicted values were obtained
using the model parameters in Table 3. Not surprisingly, individual baseline differences, reflected in w0i, were
also predictive of the post-flight CAR (coeff. est. = 0.704, SE = 0.087, p < 0.001).
Figure 4 illustrates the sensitivity of the model and its uncertainty by plotting point estimates of post-flight
CAR along with 95% confidence intervals for 9 particular combinations of BFO dose, age, gender, and w1i
(Table 4). These combinations were chosen to encompass the range of observed values of these variables. This
figure suggests that the largest source of uncertainty in the prediction of CAR from the post-flight model is the
relatively unclear effect of age (combination C7) when relatively distant from the mean of 46.9 years. Combina-
tion C7 is the same as C3 (medium dose rate, male, with random effects w0i and w1i at their means of zero), except
that age = 60 years in C7 and 50 years in C3. The effect of female vs male gender can also be seen comparing C2
with C1, C4 with C3, and C6 with C5. The larger confidence regions for combinations with female indicators (C2,
C4, and C6) reflect the small number of females in the study. Finally, comparing C8 and C9 with C1 illustrates
the expected effect of preflight radiosensitivity on CAR, where C8 represents a subject with w1i = − 0.77 (1 SD
below the mean of zero), and where C9 represents a subject with w1i = + 0.77 (1 SD above the mean of zero). The
difference in expected CAR between C8 and C9 illustrates how differences in values of w1i can contribute to the
prediction of CAR over and above BFO dose alone.
Recovery of CAR after landing. Average observed CAR measured 6–12 months after landing for 31 crew-
missions with at least two post-flight time points was not noticeably different than the average CAR on the first
post-flight time point measured about 2 weeks after landing (first mean CAR = 0.00490, 2nd mean CAR = 0.00477,
p = 0.70, paired t-test).
RBE estimation. After fitting the RBE model (Eqs. 1, 4) to all data (pre- and post-flight), we obtained the
parameter estimates as indicated in Table 5. Estimated standard deviations of the random effects U0i and U1i
are in Table 6. Applying Eq. (7) to these estimated results, we calculated that the RBE for a subject with average
Scientific Reports | (2021) 11:5293 | https://doi.org/10.1038/s41598-021-84242-5 5
Vol.:(0123456789)www.nature.com/scientificreports/
Figure 2. Poisson regression predictions of pre-flight dose response (solid lines) for 6 crewmembers covering
the observed range of pre-flight average slopes (values at the top of each section are in the units of CAR per Gy
of dose). Observed CARs are plotted as red circles.
Pre-flight model parameter Equation 2 predictor variable Est SE Z-value p
β1 xij (γ-ray dose) 4.151 0.168 24.72 0
β2 A50i 0.029 0.012 2.42 0.016
β3 Fi 0.168 0.118 1.43 0.153
β4 1 − 5.717 0.084 − 68.2 0
Table 1. Pre-flight Ex Vivo poisson regression parameter estimates (“Est.”) and standard errors (“SE”) based
on all pre-flight observations with dose ≤ 0.5 Gy. The “Z”-value is the signal-to-noise ratio (Est/SE), while “p”
is the p value for the test of the null hypothesis that the parameter is zero. In the fitted model, mean log CAR
increases by about 0.0415 (4.151/100) per cGy of gamma radiation, corresponding to about a 4% increase in
median CAR per cGy of increased radiation. Similarly, all other things being equal, median background CAR
increases by about 3% per year of age. There could also be a gender effect, but there were not enough female
subjects to accurately estimate it. Results presented in this and the other tables were generated using Stata
Statistical Software27.
Random effect Obs SD Min Max
w0i = pred(W0i) 43 .472 − .839 1.077
w1i = pred(W1i) 43 .771 − 1.303 1.973
Table 2. Descriptive statistics for predicted random effects (no baseline obs.)
sensitivity (U1i = 0) would be 3.09 ± 0.24. Taking into account the different subject sensitivities, we obtained
subject-specific values of RBE ranging from 2.4 to 4.7. However, as pointed out earlier, this range is probably
an underestimate of the true range of RBE’s. Figure 5 shows values of individual RBE’s plotted against subject
number. Values of the estimated parameters for the RBE model are shown in Table 5.
Scientific Reports | (2021) 11:5293 | https://doi.org/10.1038/s41598-021-84242-5 6
Vol:.(1234567890)www.nature.com/scientificreports/
Post-flight model parameter Equation 4 predictor variable Est SE Z-value p
β1 xij (BFO dose) 14.746 1.202 12.27 < 0.001
β2 A50i 0.025 0.009 2.83 0.005
β3 Fi 0.162 0.083 1.94 0.052
β4 w0i 0.704 0.087 8.13 < 0.001
β5 w1ixij 6.268 1.611 3.89 < 0.001
β0 _cons − 5.751 0.048 − 119.08 < 0.001
Table 3. Post-flight in-vivo poisson regression parameter estimates (“Est.”) and standard errors (“SE”) based
on all post-flight observations with BFO doses ranging from 0.01 to 0.04 Gy as well as baseline pre-flight
observations. Besides age and gender, predictors in this model included predicted values of baseline random
subject-specific perturbations to CAR (w0i) as well as predicted values of subject-specific perturbations to
radiosensitivity (w1ixij).
Figure 3. Post-flight prediction of chromosomal aberration rates (CAR). Subject-specific random intercepts
(w0i) and sensitivities (w1i) obtained from the pre-flight model were used in this prediction model given by
Eq. (4).
Multiple missions. A refitting of the pre-flight Poisson regression model with mission number (1 or 2) and
age as explanatory variables for each of the distinct 38 astronauts resulted in an estimated increase of about 50%
for the average pre-flight baseline aberration rate for a second mission as compared with a first mission even
after adjusting for age increase between missions. However, the small number of multi-mission fliers (5) was
reflected in a large uncertainty in the estimated increase; 95% confidence limits = (15%, 92%) (p = 0.003). On the
other hand, no substantial evidence of a mission effect on the pre-flight dose–response average slope was found;
estimated average increase = 23%; 95% confidence limits = (− 8%, + 55%) (p = 0.15). Point estimates of intercepts
and average slopes are plotted for the 5 astronauts with two missions in Fig. 6.
Discussion. Both pre- and post-flight chromosome damage was classified in terms total aberrations and
stable translocations. Although here we report only the results of analysis of total aberrations, a parallel analysis
of stable translocation data showed a similar outcome (see Appendix).
In the biodosimetry study, blood samples collected pre-flight were exposed to gamma rays ex vivo to deter-
mine individual dose response curves. After fitting the mixed-effects Poisson regression model (Eq. 2) to the
preflight dose–response data, we obtained estimates of the average slope of the dose–response function (log
CAR per Gy dose) as well as the background CAR for each subject. Although both of these parameters varied
greatly between individuals, they were positively correlated and tended to increase with age (RESULTS—Pre-
Flight Dose–Response Model).
Scientific Reports | (2021) 11:5293 | https://doi.org/10.1038/s41598-021-84242-5 7
Vol.:(0123456789)www.nature.com/scientificreports/
Figure 4. Predicted CAR and 95% confidence limits for 9 predictor combinations.
Combination BFO dose Age (years) Female W1i CAR (%)
C1 0.011 50 0 0.00 0.37
C2 0.011 50 1 0.00 0.44
C3 0.028 50 0 0.00 0.48
C4 0.028 50 1 0.00 0.56
C5 0.041 50 0 0.00 0.58
C6 0.041 50 1 0.00 0.69
C7 0.028 60 0 0.00 0.61
C8 0.028 50 0 − 0.77 0.42
C9 0.028 50 0 0.77 0.55
Table 4. Combinations of predictors used in Fig. 4 and model-based estimates of % CAR. For ease of
readability, CAR is expressed here as a percent (100 × CAR).
RBE model parameter Equation (5) predictor variable Est SE Z-value p
β1,pre xpre,ij 4.031 0.14 28.7 < 0.001
β1,post xpost,ij 12.475 1.058 11.8 < 0.001
β2 A50i 0.027 0.011 2.4 0.018
β3 Fi 0.153 0.11 1.4 0.164
β0 1 − 5.679 0.064 − 89.3 < 0.001
Table 5. Estimates of parameters in RBE model (Eq. 5) based on Poisson regression that includes all observed
data, both pre- and post-flight with separate terms for sensitivity to gamma radiation (β1,pre ) and BFO dose
(β1,post ) as well as overall age and gender effects.
Radiation is only one of the environmental stressors that causes chromosome damage in the lymphocytes of
umans30. It has been reported that CA levels can be affected by smoking31. Elevated CA are also associated with
h
exposure to toxins ranging from formaldehyde to electronics w aste32,33. The pre-flight background CAs in the
astronauts were partly caused by radiation from prior Space Shuttle and ISS missions, and from aircraft flights
and medical procedures. The whole-body dose equivalent received during Space Shuttle missions is typically a
Scientific Reports | (2021) 11:5293 | https://doi.org/10.1038/s41598-021-84242-5 8
Vol:.(1234567890)www.nature.com/scientificreports/
Effect Estimate
sd(U1i)) .680
sd(U0i) .320
Table 6. Estimated standard deviations of RBE model random effects.
Figure 5. Individual RBE estimates. The RBE for an average subject is represented by the horizontal line with
95% confidence limits (dashed lines). Subject numbers were assigned randomly to preserve sensitive personal
information.
fraction of one cSv12; however, some of the background CA could have been induced by environmental factors.
The positive correlation between the pre-flight slope and background CA suggests that individuals with greater
radiosensitivity are also likely to be more susceptible to other environmental stressors.
Association between ex‑vivo dose response and spaceflight‑induced CAR. The primary goal of
the present study was to determine whether ISS crewmembers´ individual radiosensitivities would contribute
to the prediction of their spaceflight-induced CAR over and above BFO dose. A number of methodological
strategies for quantifying individual radiosensitivities have been proposed in the past34,35. These approaches
include the “G2- assay” in which human lymphocytes are stimulated to divide before being exposed to ex vivo
radiation, and ex vivo exposure of human resting (G0 phase) lymphocytes to known doses of radiation36,37.
Using the Poisson regression model, we assessed the degree to which CAR background, and preflight-estimated
radiosensitivity were predictive of post-flight CAR in a joint model with BFO dose age and gender. Our analysis
revealed that not only did the preflight background and radiosensitivity vary considerably between individuals
(Table 2), but that both were found to contribute to the prediction of post-flight CAR over and above what could
be explained by BFO dose and demographic factors alone (Table 3). In particular, these results suggest that all
other things being equal, individuals with higher radiosensitivities will experience greater chromosomal dam-
age during spaceflight. Similarly, whether radiosensitivity determined from ex vivo exposure predicts in vivo
response of tumors to radiotherapy has been widely investigated. A similar regression analysis was performed on
a group of healthy retired workers from the British Nuclear Fuels plc facility at Sellafield38. It was concluded that
only cumulative occupational radiation dose, but neither radiosensitivity nor age, have an influence on chromo-
some translocation frequencies in vivo. A study on a larger cohort of retired Sellafield workers has also reported
no association between polymorphisms in genes involved in the base excision and double strand break repairs
and in vivo chromosome aberrations associated with occupational e xposure39.
Dose and dose rate effects. The Poisson regression analysis in the present study was performed with the
accumulated radiation dose of the BFO dose as an independent variable. The same analysis was also performed
using the dose rate as an independent variable, which was calculated by dividing the accumulated BFO dose by
the mission duration. Among the crewmembers, the dose rate at the BFO ranged from 0.012 to 0.024 cGy/day.
Scientific Reports | (2021) 11:5293 | https://doi.org/10.1038/s41598-021-84242-5 9
Vol.:(0123456789)www.nature.com/scientificreports/
Figure 6. Background CAR (top panel) and average dose–response slope (Eq. 6) (bottom panel) prior to the
first (blue circle) and second (red triangle) ISS missions for 5 repeated flyers. The background was about the
same or higher prior to the second mission for all 5 of these astronauts, whereas the average slopes were higher
prior to the second mission for 4 of these 5 astronauts.
Such a difference is caused primarily by the solar cycle, as the dose rate during solar minimum activity is known
to be about twice that during solar maximum activity. Interestingly, the prediction was slightly better when tak-
ing the dose rate into account rather than the accumulated dose. Among the crewmembers the dose rate varied
depending mostly on the solar cycle and the location of the crewmember inside the ISS. Generally, CAR is higher
for higher dose rate, and this is particularly true for low-LET r adiation40. In low Earth orbits (LEO), the radiation
environment is a mixture of protons in the trapped radiation belt, and a fraction of high-LET galactic cosmic
radiation (GCR). While high-energy protons produce similar CAR and similar dose-rate dependence as gamma
rays, low dose rates of low energy (high-LET) protons and high-LET heavy ions may produce damage that is
independent of the dose, particularly taking into account the non-targeted radiation effects. The dependency
of dose rate may also be a reflection of the solar cycle, in which the dose rate is greater during solar minimum
activities (NCRP 1989). As a result, the fraction of high-LET components may be higher during solar minimum
activities, and likely responsible for the dependency of dose rate and post-flight CAR.
Bone marrow cells vs. circulating peripheral blood mononuclear cells (PBMC). We observed that
on average, CAR detected 2 weeks after landing did not noticeably differ from the CAR detected 6–12 months
after landing. In humans, the life span of human lymphocytes varies significantly depending on the subtypes of
the cells41. In this study, chromosome spreads analyzed for aberrations were mostly from T cells with a small per-
centage of other cell t ypes42. While the estimates of the life span are 164 and 157 days for CD4 + and CD8 + cells,
respectively43, some of the naïve T cells can take 3 years to divide44. The estimated life span may be even longer as
suggested by different mathematical models43. Chromosome damage analyzed shortly after radiation exposure
in vivo represents the damage in mostly circulating T cells. However, if blood is collected years after radiation
exposure, as it was in the case of Japanese atomic bomb s urvivors45, chromosome damage reflects the damage
induced in the bone marrow precursor cells at the time of radiation. In our study, blood samples were collected
at two time points; 2 weeks and again 6–12 months after flight. Taking mission duration into account, the second
post-flight collection of blood samples was performed from 12–18 months after launch to the ISS. Based on the
present analysis that CAR between and first and second post-flight collections were similar, and that the average
life span of T cells is ~ 160 days, we argue that a significant portion of the damage detected in our biodosimetry
Scientific Reports | (2021) 11:5293 | https://doi.org/10.1038/s41598-021-84242-5 10
Vol:.(1234567890)www.nature.com/scientificreports/
analysis was a result of the damage caused in bone marrow cells. In fact, chromosome aberrations of clonal ori-
gin have been reported in some of the astronauts’ post-flight blood s amples46.
Age and gender effects. The present analysis suggests an age effect in the background of chromosome
aberration frequencies (Table 1), in the average slope of the dose response in ex vivo gamma exposures, and in
post-flight CAR. In general, estimates of age effects had relatively high uncertainty (for example, see Fig. 4.) due
to the narrow age range in the ISS astronauts in comparison to the general population. Age dependence in the
radiation effects has been reported previously in the literature. Studies of background chromosome aberration
rates in healthy adults have indicated that stable aberrations accumulate with time30. The dependence of translo-
cation frequencies with age was found to be linear at younger ages, but increases with upward curvature at older
ages30. Around age 50, the translation frequency increases by 0.24 per 100 cells in 10 years30. Increased levels of
chromosome structural abnormalities as a function of age have also been shown in s permatozoa47,48, an in der-
mal fibroblasts in individuals49. In addition to the background CAR, sensitivities to radiation exposure would be
expected to vary with the age of the individual due in part to the decreased efficiency in repairing DNA strand
breaks for older individuals49. Radiosensitivity was investigated in breast cancer patients and healthy individuals
of different age groups by exposing their blood samples ex vivo to radiation, similar to the present study with
the pre-flight blood samples50. Results of that study showed that the cancer patients were distinctly more radio-
sensitive compared to healthy controls; but that while radiosensitivity appeared age dependent for the control
subjects there was no evidence of a similar relation for the cancer patients. Similarly, a more comprehensive
study involving patients with a variety of cancers51concluded that radiosensitivity increased with age for healthy
patients, but did not appear to change with age in the cancer patients, probably because of a large variation in the
patient group. While these two studies50,51 used blood samples exposed ex vivo to radiation, analysis of cancer
mortality in workers at Oak Ridge National Laboratory indicated that cumulative radiation doses were associ-
ated with increases in all-cancer mortality, and that sensitivity to the carcinogenic effects of ionizing radiation
may increase with older ages at e xposure52. The present study shows an increased CAR background as a function
of age, which is comparable to the published results.
Gender differences in the effects of space radiation are also a concern for assessing the associated risks53. In a
study aimed at investigating the effects of smoking on chromosome sensitivity to gamma radiation, human lym-
phocytes collected from healthy subjects were stimulated to grow before exposure54, an approach that differs from
the present study where unstimulated lymphocytes were exposed. Results of the previous s tudy54 showed that
the mean frequency of radiation-induced breaks was significantly higher in men than in women. In the present
study, although results suggest a possible differential gender role on some aspects of radiosensitivity, the number
of female crewmembers (10) was too small to draw any definite conclusions from the available data. Although
it is known that smoking also affects chromosome aberration frequencies31, astronauts are mostly non-smokers.
RBE. In the present analysis, individual RBE estimates were found to range between 2.4 and 4.7 with a mean
value of 3.09 ± 0.24 (Fig. 5). These values are similar to those estimated previously12. In the ISS orbit, space radia-
tion that the crewmembers are exposed to consists of mostly protons and a small fraction of high-LET heavier
ions1. Except for the Bragg peak region, RBE values of protons are known to be close to 1 for chromosome dam-
age and for other biological e ndpoints55. The effect of high-LET radiation is traditionally weighted by the quality
factor, which is defined to be 1 for low LET, and have a peak value of 20 at LET = 100 keV/μm56. Applying the
quality factor recommended by the International Commission on Radiological Protection (ICRP 60)56 to the
radiation environment in the ISS orbit, we estimated the RBE at the depth representing the BFO locations to be
about 1.4, which is lower than the average RBE of about 3 that we obtained for in-chromosome aberrations. A
number of factors can contribute to this discrepancy. Firstly, the RBE value in the present analysis was derived
by comparing the in-vivo exposure of a mixture of bone marrow cells and PBMCs to ex-vivo exposure of PBMCs.
The sensitivities between these bone-marrow cells to in-vivo and PBMCs to ex-vivo radiation exposure can be
different. In addition, in-vivo exposure to space radiation occurred under microgravity and other environmental
stress conditions associated with the ISS, whereas ex vivo exposure took place on the ground. It has been sug-
gested that the stress factors experienced by the crewmembers in space may affect DNA damage response, result-
ing in a higher r adiosensitivity6. Furthermore, the high-LET component of space radiation, even in LEO, may
induce the non-target e ffect57. As such, the damage from very low doses of high-LET radiation may be greater
than expected58,59. As shown in Fig. 1, the RBE in the present analysis was derived based on dose response in the
range of BFO dose between 0.01 and 0.04 Gy, which is approximately linear. We argue that the RBE for chronic
exposure would be close to the value of 3.1 even though the gamma dose response curve was obtained under
the acute exposure scenario. Of course, RBE values for different types of chromosome aberrations can be differ-
ent, particularly for complex type of aberrations60. However, the yield of complex type damage observed in the
crewmembers’ samples is so low that RBE values for them could not be determined.
Repeat fliers. Of the 38 astronauts flown on long-duration ISS mission, 5 participated in two separate long-
duration missions. The time between their first and second missions varied from 3 to 9 years13. Analysis was
carried out to determine whether the first mission affected the radiosensitivity of the crewmembers in the sub-
sequent missions, as determined by changes in the pre-flight dose response in lymphocytes after ex-vivo gamma
irradiation. As shown in Fig. 6, point estimates of the intercept of the dose–response function were higher for
the second missions for all 5 astronauts. Formal analysis taking age and uncertainty into account corroborated a
definite mission effect (p = 0.002). It is therefore plausible to conclude that the consistent increases are the result
of space radiation exposure during the astronauts’ first mission. The average slope of the dose response was
higher for the second mission for 4 of the 5 astronauts, but the increase was not statistically significant.
Scientific Reports | (2021) 11:5293 | https://doi.org/10.1038/s41598-021-84242-5 11
Vol.:(0123456789)www.nature.com/scientificreports/
Limitations. The ability of the post-flight model to predict CAR is limited by errors in the predictors; in
particular the estimates of W0i and W1i were based on limited ex-vivo dose–response data. Of necessity, the
control baseline data was withheld in fitting the pre-flight model so that these observations could be used in
estimating the post-flight model without duplication. Assumptions of independence and no more than one
chromosome aberration per cell may not exactly hold, in which case aberration counts may not have a Poisson
distribution. Also, the log-linear form of all our Poisson regression models is at best only an approximation to
how the explanatory variables relate to CAR response. Despite these limitations, the root-mean-square error in
the post-flight prediction (as illustrated in Fig. 4) is about 0.0015—only slightly higher than the repeatability
standard deviation of 0.0013 observed in 73 post-flight observations of CAR. A validation study re-estimating
the post-flight model with one subject left out resulted in predictions that were virtually as accurate as the full-
sample predictions from Table 3.
Summary. Our present analysis of biodosimetry data indicates that the background chromosome aberra-
tion rate, as well as radiosensitivity as defined by the ex-vivo dose response to gamma irradiation vary consid-
erably among individuals. Radiosensitivities tend to be higher for those having a higher CA background, and
both parameters were generally higher in older crewmembers. Post ISS missions, the chromosome aberration
rate observed in the crewmembers can be fairly well predicted by the radiosensitivity determined preflight, in
combination with the dose received during the mission and the background CAR. Taken together, our analysis
suggests that crewmembers with greater radiosensitivity can be more sensitive to not only radiation exposure
in space, but also to other environmental stressors experienced prior to the ISS missions. It has been commonly
believed that older astronauts would have lower radiation risks, due in part to their shorter remaining life span.
However, the present finding that older crewmembers may be more sensitive to space radiation exposure will
potentially impact the age dependence in the risk assessment, particularly as humans continuously live longer.
Received: 19 March 2020; Accepted: 12 February 2021
References
1. National Council on Radiation Protection and Measurements, Guidance on Radiation Received in Space Activities. NCRP Report
No.98 (Bethesda, MD, 1989).
2. Fry, R. J. Approaches to radiation guidelines for space travel. Adv. Space Res. 4, 121–130 (1984).
3. Durante, M. & Cucinotta, F. A. Heavy ion carcinogenesis and human space exploration. Nat. Rev. Cancer 8, 465–472. https://doi.
org/10.1038/nrc2391 (2008).
4. Chancellor, J. C. et al. Limitations in predicting the space radiation health risk for exploration astronauts. NPJ. Microgravity 4, 8.
https://doi.org/10.1038/s41526-018-0043-2 (2018).
5. Moreno-Villanueva, M. W., H. Radiation and microgravity—associated stress factors and carcinogenesis. REACH—Rev. Hum.
Space Explor. 13, 100027 (2019).
6. Moreno-Villanueva, M., Wong, M., Lu, T., Zhang, Y. & Wu, H. Interplay of space radiation and microgravity in DNA damage and
DNA damage response. NPJ. Microgravity 3, 14. https://doi.org/10.1038/s41526-017-0019-7 (2017).
7. Liu, Q. J. et al. Assessment of retrospective dose estimation, with fluorescence in situ hybridization (FISH), of six victims previously
exposed to accidental ionizing radiation. Mutat Res. Genet. Toxicol. Environ. Mutagen. 759, 1–8. https://doi.org/10.1016/j.mrgen
tox.2013.07.016 (2014).
8. Yao, B. et al. Estimation of the biological dose received by five victims of a radiation accident using three different cytogenetic
tools. Mutat. Res. 751, 66–72. https://doi.org/10.1016/j.mrgentox.2012.11.005 (2013).
9. George, K. et al. Chromosome aberrations in the blood lymphocytes of astronauts after space flight. Radiat. Res. 156, 731–738.
https://doi.org/10.1667/0033-7587(2001)156[0731:caitbl]2.0.co;2 (2001).
10. Yang, T. C., George, K., Johnson, A. S., Durante, M. & Fedorenko, B. S. Biodosimetry results from space flight Mir-18. Radiat. Res.
148, S17-23 (1997).
11. Wu, H., George, K., Willingham, V. & Cucinotta, F. A. Comparison of chromosome aberration frequencies in pre- and post-flight
astronaut lymphocytes irradiated in vitro with gamma rays. Phys. Med. 17(Suppl 1), 229–231 (2001).
12. Cucinotta, F. A., Kim, M. H., Willingham, V. & George, K. A. Physical and biological organ dosimetry analysis for international
space station astronauts. Radiat. Res. 170, 127–138. https://doi.org/10.1667/RR1330.1 (2008).
13. George, K., Rhone, J., Beitman, A. & Cucinotta, F. A. Cytogenetic damage in the blood lymphocytes of astronauts: effects of repeat
long-duration space missions. Mutat. Res. 756, 165–169. https://doi.org/10.1016/j.mrgentox.2013.04.007 (2013).
14. Durante, M. et al. Chromosome aberration dosimetry in cosmonauts after single or multiple space flights. Cytogenet. Genome Res.
103, 40–46. https://doi.org/10.1159/000076288 (2003).
15. Fedorenko, B. et al. Cytogenetic studies of blood lymphocytes from cosmonauts after long-term space flights on Mir station. Adv.
Space Res. 27, 355–359. https://doi.org/10.1016/s0273-1177(01)00011-4 (2001).
16. Greco, O. et al. Biological dosimetry in Russian and Italian astronauts. Adv. Space Res. 31, 1495–1503. https://doi.org/10.1016/
s0273-1177(03)00087-5 (2003).
17. Beaton-Green, L. A., Lachapelle, S., Straube, U. & Wilkins, R. C. Evolution of the Health Canada astronaut biodosimetry pro-
gram with a view toward international harmonization. Mutat. Res. Genet. Toxicol. Environ. Mutagen. 793, 101–106. https://doi.
org/10.1016/j.mrgentox.2015.07.013 (2015).
18. Johnston, M. L., Young, E. F. & Shepard, K. L. Whole-blood immunoassay for gammaH2AX as a radiation biodosimetry assay
with minimal sample preparation. Radiat. Environ. Biophys. 54, 365–372. https://doi.org/10.1007/s00411-015-0595-4 (2015).
19. Sproull, M. & Camphausen, K. State-of-the-art advances in radiation biodosimetry for mass casualty events involving radiation
exposure. Radiat. Res. 186, 423–435. https://doi.org/10.1667/RR14452.1 (2016).
20. Wu, H. et al. Truly incomplete and complex exchanges in prematurely condensed chromosomes of human fibroblasts exposed
in vitro to energetic heavy ions. Radiat. Res. 160, 418–424. https://doi.org/10.1667/rr3061 (2003).
21. Benton, E. R. & Benton, E. V. Space radiation dosimetry in low-earth orbit and beyond. Nucl. Instrum. Methods Phys. Res. B.
184(1–2), 255–294. https://doi.org/10.1016/s0168-583x(01)00748-0 (2001).
Scientific Reports | (2021) 11:5293 | https://doi.org/10.1038/s41598-021-84242-5 12
Vol:.(1234567890)www.nature.com/scientificreports/
22. Hoff, J. L., Townsend, L. W. & Zapp, E. N. Interplanetary crew doses and dose equivalents: variations among different bone marrow
and skin sites. Adv. Space Res. 34(6), 1347–1352. https://doi.org/10.1016/j.asr.2003.08.056 (2004).
23. Yucker, W. R. Computerized Anatomical Female Body Self-Shielding Distributions (McDonnell Douglas Space Systems Company,
Huntington Beach, CA, 1992).
24. Billings, M. & Yucker, W. R. Summary of Final Report: The Computerized Anatomical Man (CAM) Model (McDonnell Douglas
Astronautics Company, Huntington Beach, 1973).
25. Cucinotta, F. A. et al. Uncertainties in estimates of the risks of late effects from space radiation. Adv. Space Res. 34, 1383–1389.
https://doi.org/10.1016/j.asr.2003.10.053 (2004).
26. Frome, E. L. & DuFrain, R. J. Maximum likelihood estimation for cytogenetic dose-response curves. Biometrics 42, 73–84 (1986).
27. StataCorp. ,. Stata Statistical Software: Release 16 (StataCorp LLC, College Station, TX, 2019).
28. Skrondal, A. & Rabe-Hesketh, S. Generalized Latent Variable Modeling (Chapman and Hall CRC, Boca Raton, 2004).
29. Skrondal, A. & Rabe-Hesketh, S. Prediction in multilevel generalized linear models. J. Roy. Stat. Soc. 172, 659–687 (2009).
30. Sigurdson, A. J. et al. International study of factors affecting human chromosome translocations. Mutat. Res. 652, 112–121. https
://doi.org/10.1016/j.mrgentox.2008.01.005 (2008).
31. Sierra-Torres, M. S., Arboleda-Moreno, Y. Y., Hoyos, L. S. & Sierra-Torres, C. H. Chromosome aberrations among cigarette smokers
in Colombia. Mutat. Res. 562, 67–75. https://doi.org/10.1016/j.mrgentox.2004.05.006 (2004).
32. Costa, S. et al. Increased levels of chromosomal aberrations and DNA damage in a group of workers exposed to formaldehyde.
Mutagenesis 30, 463–473. https://doi.org/10.1093/mutage/gev002 (2015).
33. Liu, Q. et al. Chromosomal aberrations and DNA damage in human populations exposed to the processing of electronics waste.
Environ. Sci. Pollut. Res. Int. 16, 329–338. https://doi.org/10.1007/s11356-008-0087-z (2009).
34. Petcu, I., Savu, D., Thierens, H., Nagels, G. & Vral, A. In vitro radiosensitivity of peripheral blood lymphocytes in multiple sclerosis
patients. Int. J. Radiat. Biol. 82, 793–803. https://doi.org/10.1080/09553000600932976 (2006).
35. Komova, O. et al. Relationship between radioadaptive response and individual radiosensitivity to low doses of gamma radia-
tion: an extended study of chromosome damage in blood lymphocytes of three donors. Int. J. Radiat. Biol. 94, 54–61. https://doi.
org/10.1080/09553002.2018.1399226 (2018).
36. Bryant, P. E. et al. The G2 chromosomal radiosensitivity assay. Int. J. Radiat. Biol. 78, 863–866. https: //doi.org/10.1080/095530 0021
0144484 (2002).
37. Huber, R. et al. Chromosomal radiosensitivity and acute radiation side effects after radiotherapy in tumour patients–a follow-up
study. Radiat. Oncol. 6, 32. https://doi.org/10.1186/1748-717X-6-32 (2011).
38. Cadwell, K. K., Whitehouse, C. A., Tarone, R. E. & Janet Tawn, E. Comparison of in vivo translocation frequencies with in vitro
G2 radiosensitivity in radiation workers occupationally exposed to external radiation. J. Radiol. Prot. 28, 101–106. https://doi.
org/10.1088/0952-4746/28/1/N01 (2008).
39. Tawn, E. J., Whitehouse, C. A. & Tarone, R. E. FISH chromosome aberration analysis on retired radiation workers from the Sellafield
nuclear facility. Radiat. Res. 162, 249–256. https://doi.org/10.1667/rr3214 (2004).
40. Furusawa, Y., Matsumoto, Y., Hirayama, R., Ohsawa, D. & Konishi, T. Dose-rate and cell-killing sensitivity of high-linear energy
transfer ion beam. Radiat. Prot. Dosim. 183, 219–222. https://doi.org/10.1093/rpd/ncy267 (2019).
41. IAEA International Atomic Energy Agency, Cytogenetic Dosimetry: applications in Preparedness for and Response to Radiation
Emergencies (Vienna, 2011).
42. Knuutila, S. & Kovanen, P. E. Relative proportions of mitotic T and B cells in PHA-stimulated lymphocyte cultures. Cancer Genet.
Cytogenet. 29, 151–154. https://doi.org/10.1016/0165-4608(87)90042-2 (1987).
43. Westera, L. et al. Closing the gap between T-cell life span estimates from stable isotope-labeling studies in mice and humans. Blood
122, 2205–2212. https://doi.org/10.1182/blood-2013-03-488411 (2013).
44. McLean, A. R. & Michie, C. A. In vivo estimates of division and death rates of human T lymphocytes. Proc. Natl. Acad. Sci. U.S.A.
92, 3707–3711. https://doi.org/10.1073/pnas.92.9.3707 (1995).
45. Kodama, Y. et al. The F value for chromosome aberrations in atomic bomb survivors does not provide evidence for a primary
contribution of neutrons to the dose in Hiroshima. Radiat. Res. 152, 558–562 (1999).
46. George, K., Durante, M., Willingham, V. & Cucinotta, F. A. Chromosome aberrations of clonal origin are present in astronauts’
blood lymphocytes. Cytogenet. Genome Res. 104, 245–251. https://doi.org/10.1159/000077498 (2004).
47. Sloter, E. D. et al. Frequency of human sperm carrying structural aberrations of chromosome 1 increases with advancing age.
Fertil. Steril. 87, 1077–1086. https://doi.org/10.1016/j.fertnstert.2006.08.112 (2007).
48. Templado, C., Donate, A., Giraldo, J., Bosch, M. & Estop, A. Advanced age increases chromosome structural abnormalities in
human spermatozoa. Eur. J. Hum. Genet. 19, 145–151. https://doi.org/10.1038/ejhg.2010.166 (2011).
49. Kalfalah, F. et al. Structural chromosome abnormalities, increased DNA strand breaks and DNA strand break repair deficiency in
dermal fibroblasts from old female human donors. Aging (Albany NY) 7, 110–122. https://doi.org/10.18632/aging.100723 (2015).
50. Auer, J. et al. Individual radiosensitivity in a breast cancer collective is changed with the patients’ age. Radiol. Oncol. 48, 80–86.
https://doi.org/10.2478/raon-2013-0061 (2014).
51. Schuster, B. et al. Rate of individuals with clearly increased radiosensitivity rise with age both in healthy individuals and in cancer
patients. BMC Geriatr. 18, 105. https://doi.org/10.1186/s12877-018-0799-y (2018).
52. Richardson, D. B. & Wing, S. Greater sensitivity to ionizing radiation at older age: follow-up of workers at Oak Ridge National
Laboratory through 1990. Int. J. Epidemiol. 28, 428–436. https://doi.org/10.1093/ije/28.3.428 (1999).
53. Kennedy, A. R. et al. Effects of sex and gender on adaptation to space: immune system. J. Womens Health (Larchmt) 23, 956–958.
https://doi.org/10.1089/jwh.2014.4913 (2014).
54. Wang, L. E. et al. Gender difference in smoking effect on chromosome sensitivity to gamma radiation in a healthy population.
Radiat. Res. 154, 20–27. https://doi.org/10.1667/0033-7587(2000)154[0020:gdiseo]2.0.co;2 (2000).
55. George, K. et al. Chromosome aberrations in human lymphocytes induced by 250 MeV protons: effects of dose, dose rate and
shielding. Adv. Space Res. 30, 891–899. https://doi.org/10.1016/s0273-1177(02)00406-4 (2002).
56. ICRP International Commission on Radiological Protection. Recommendations of the International Commission on Radiological
protection (Pergamon Press, Oxford, 1990).
57. Hei, T. K., Zhou, H., Chai, Y., Ponnaiya, B. & Ivanov, V. N. Radiation induced non-targeted response: mechanism and potential
clinical implications. Curr. Mol. Pharmacol. 4, 96–105. https://doi.org/10.2174/1874467211104020096 (2011).
58. Hada, M., Chappell, L. J., Wang, M., George, K. A. & Cucinotta, F. A. Induction of chromosomal aberrations at fluences of less
than one HZE particle per cell nucleus. Radiat. Res. 182, 368–379. https://doi.org/10.1667/RR13721.1 (2014).
59. Yang, H. et al. Effects of very low fluences of high-energy protons or iron ions on irradiated and bystander cells. Radiat. Res. 176,
695–705. https://doi.org/10.1667/rr2674.1 (2011).
60. George, K. et al. In vivo and in vitro measurements of complex-type chromosomal exchanges induced by heavy ions. Adv. Space
Res. 31, 1525–1535. https://doi.org/10.1016/s0273-1177(03)00088-7 (2003).
Scientific Reports | (2021) 11:5293 | https://doi.org/10.1038/s41598-021-84242-5 13
Vol.:(0123456789)You can also read