MITO: a new directional muon telescope - Journal of Space ...
←
→
Page content transcription
If your browser does not render page correctly, please read the page content below
J. Space Weather Space Clim. 2021, 11, 13
Ó S. Ayuso et al., Published by EDP Sciences 2021
https://doi.org/10.1051/swsc/2020079
                                                                                                                                     Available online at:
                                                                                                                                    www.swsc-journal.org
Topical Issue - Space Weather Instrumentation

    TECHNICAL ARTICLE                                                                                                            OPEN          ACCESS

MITO: a new directional muon telescope
Sindulfo Ayuso1,2,*, Juan José Blanco1,2, Juan Ignacio García Tejedor1,3, Raúl Gómez Herrero1,2,
Iván Vrublevskyy1, Óscar García Población1,3, and José Medina2
1
    Castilla-La Mancha Neutron Monitor, Space Research Group, Parque Científico y Tecnológico de Castilla-La Mancha,
    Avda. Buendía, 11, 19005 Guadalajara, Spain
2
    Department of Physics and Mathematics, Space Research Group, Universidad de Alcalá, Ctra. Madrid-Barcelona km 33,6,
    28871 Alcalá de Henares, Spain
3
    Department of Computing Engineering, Space Research Group, Universidad de Alcalá, Ctra. Madrid-Barcelona km 33,6,
    28871 Alcalá de Henares, Spain

              Received 1 June 2020 / Accepted 24 December 2020

              Abstract – Muon telescopes are instruments devoted to the observation of muons. They are produced in the
              atmosphere by means of the interaction of cosmic ray and solar energetic particles with atmospheric nuclei.
              Muons, as cosmic rays that produce them, present non uniform arrival directions and temporal variations at
              ground level and, along certain observation directions, could forecast the arrival of interplanetary coronal
              mass ejections (ICMEs) at the Earth, even earlier than neutron monitors. However, multidirectional muon
              telescopes are not easily affordable because of their complexity, size and cost. In this work, we present the
              muon impact tracer and observer (MITO) design concept. It is composed of only two stacked scintillators
              (1 m2) with an optional lead layer that allows the filtering of unwanted particles depending on the type of
              application. In the case presented here, a 10 cm lead layer corresponding to the lead of a 3NM64 neutron
              monitor around which MITO has been built. Eight photomultipliers (PMTs) gather the light emerging from
              the four lateral sides of the scintillators. MITO has been conceived not only to achieve muon flux
              registering, but also to register muon arrival directions through the capture and analysis of multiple
              PMT pulse height data. The number of scintillators and electronic components is reduced, simplifying
              its design and construction and reducing complexity, volume, weight, power consumption and cost, and
              thus, achieving a reasonable performance-cost ratio in comparison to other directional telescopes based
              on two-layer matrices. The first prototype was shipped from Spain to Antarctica where it is now recording
              data. Some preliminary results are also presented.

              Keywords: cosmic ray / instrumentation / muon telesope

1 Introduction                                                                    have traveled beyond a mean free path. Thirdly, the
                                                                                  Larmor radii of cosmic rays in the interplanetary magnetic field
    Cosmic rays (CR) are energetic particles that constantly hit                  (IMF) are larger than the size of Earth’s magnetosphere, but
the Earth’s atmosphere, being source of a background ionizing                     smaller than the typical scale size of disturbances. The energy
radiation. As these particles travel the heliosphere, they are                    of cosmic rays at which ground based muon telescopes
modulated by different disturbances generated at the Sun, like                    have significant response is from approximately 10 GeV to
coronal mass ejections (CMEs) and shock waves (Cane et al.,                       several hundred GeV, being the highest about 50 GeV. This
2000; Blanco et al., 2013a). CR are of great interest from a                      range of 10–100 GeV corresponds to a Larmor radii of 0.04–
space-weather perspective for several reasons. First, they travel                 0.44 AU when assuming an interplanetary magnetic field of
at nearly the speed of light, much faster than solar disturbances                 5 nT. This is significant because it implies that the kinetic
like shocks or CMEs, making it possible to provide advance                        anisotropy and gradient of arriving secondary muons mainly
warning of a disturbance approaching Earth. Second, they have                     reflect the structure of the disturbance of this scale range
large mean free paths of the pitch-angle scattering. This is                      (da Silva et al., 2004).
important because precursory signatures of an approaching                             Most of the CR energy reaches the Earth’s surface in the form
disturbance are wiped out by the scattering after the particles                   of kinetic energy of relativistic muons, which are secondary
                                                                                  products of interactions between highly energetic CR and
*
    Corresponding author: sindulfo.ayuso@edu.uah.es                               nuclei of atmospheric particles (Cecchini & Spurio, 2012).

     This is an Open Access article distributed under the terms of the Creative Commons Attribution License (https://creativecommons.org/licenses/by/4.0),
                  which permits unrestricted use, distribution, and reproduction in any medium, provided the original work is properly cited.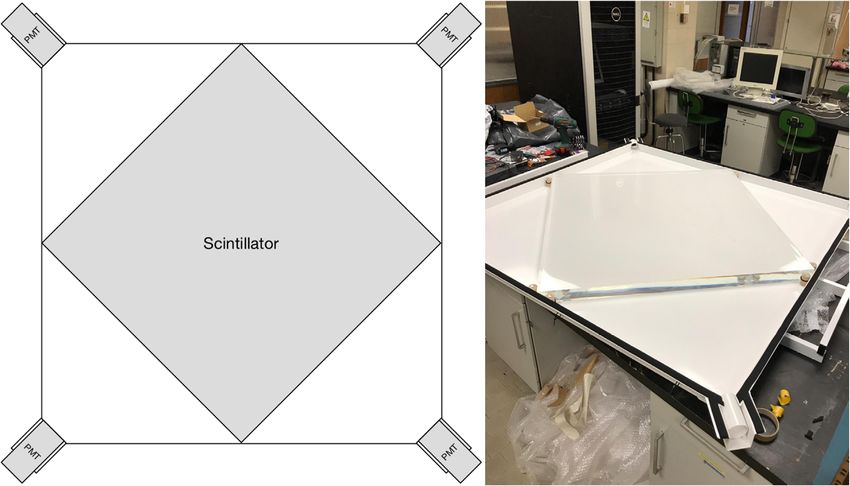
S. Ayuso et al.: J. Space Weather Space Clim. 2021, 11, 13

Muons (l and l+) are particles belonging to the lepton family       of a particle can be determined. Due to simple geometric
and they have the same charge (negative and positive,                reasons, the angular resolution depends on the size of each
respectively) as that of an electron and 207 times its mass. Due     individual detector and the distance between layers. Thus, the
to its electric charge, muons can be easily detected by means        angular resolution increases as the size of detectors decreases
of scintillators, being the most numerous charged particles at       and/or the distance between layers increases. On the other hand,
sea level. The mean energy of muons at ground is 4 GeV              traditional muon telescopes have large sizes in order to obtain
and their overall angular distribution (muons m2 sr1) as a         high statistics allowing the recording of small variations in
function of zenith angle h is cos2h for those with energy           muon flux. Table 1 shows a comparison between MITO and
El  3 GeV (Tanabashi et al., 2018).                                 other directional muon telescopes in terms of main elements
     Both neutron monitors and muon telescopes are very useful       used: volume, angle of view, detection area and counting rate.
in the space weather forecasting, either by analyzing the count           Regarding the techniques used for the detection of coinci-
rate or by studying anisotropies obtained with directional muon      dences in most of multidirectional telescopes, both hardware
telescopes. Therefore, the data provided by the Neutron Monitor      and software approaches (Ayuso et al., 2016) are widely used
Data Base (NMDB) and the Global Muon Detector Network                with different purposes such as reducing noise; getting
(GMDN) are really helpful in space weather forecasts                 directional information (Karapetyan et al., 2013); reducing the
(Mavromichalaki et al., 2004; Rockenbach et al., 2014). Muon         probability of a measurement being triggered by independent,
observations are complementary to neutron monitor studies.           unrelated particles; lessening the probability of independent
Neutron monitor observations extend from the lowest energies,        random background events or identifying energetic particles
accessible to ground based observation, up to approximately          in multi-element particle telescopes (Müller-Mellin et al., 1995).
50 GeV, while muon observations have significant responses                 Traditional particle detection systems make use of dedicated
from approximately 10 GeV to several hundred GeV (Duldig,            hardware to process data and get instant information. When
2000).                                                               real-time operation is not required, alternative approaches based
     Variations, both in the neutron monitors and muon               on the analysis of recorded pulse information can be used
telescopes counting rates, can be proxies of changes in the          (Havelka et al., 2002). These systems are based on the registra-
propagation conditions of cosmic rays through the heliosphere.       tion of pulse properties (e.g. amplitude voltages) and their
For instance, the depth and duration of decreases in counting        corresponding accurate timestamps. The recorded data are then
rates known as Forbush decreases can be related to the velocity      processed by software in order to obtain the coincidence count-
of ICMEs and driven shocks, the intensity of their magnetic          ing rates, particles trajectory and any other relevant information.
field and deceleration of ICME (Blanco et al., 2013a, b).                  In this work, we present MITO (muon impact and trace
     An important aspect of space weather prediction is the deter-   observer), an affordable directional muon telescope, made up
mination of whether or not an interplanetary shock is headed         of two 1 m2 scintillators, which is able to provide counting rates.
toward the Earth and at approximately what time its impact is        Furthermore, it uses coincidence techniques to identify the
expected. While the relationship between coronal mass ejections      passage of each muon through the scintillators, pulse height
(CMEs) and Forbush decreases in Galactic cosmic rays is now          comparison techniques to determine the point of impact in each
well established (Cane, 2000), it is less generally recognized       scintillator and, from them, the particle trajectory. This muon
that cosmic-ray decreases are often accompanied by strong            telescope is a complement to neutron monitors, being able to
enhancements of the cosmic-ray anisotropy. On the other hand,        obtain anisotropies of muon flux and, therefore, anticipating
ground-based observations of cosmic rays by neutron monitors         the arrival of certain solar events on Earth. The main purpose
and muon detectors have found precursory anisotropies, loss          of this paper is to illustrate the instrument concept and its capa-
cone precursors (Munakata et al., 2005), before the arrival of       bilities. We are currently working in the characterization of the
an interplanetary shock and subsequent Forbush decrease,             instrument response for different incident directions in order to
possibly providing an advance warning of space weather effects       derive quantitative anisotropy data, although this goes beyond
on shock impact at the Earth’s magnetosphere. Surprisingly,          the scope of the present paper.
muon detectors observe precursors earlier than neutron monitors
(Leerungnavarat et al., 2003). This is due to the fact that muon
detectors respond to higher energy cosmic rays (greater than
50 GeV) than neutron monitors (about 10 GeV) (Munakata               2 Telescope implementation
et al., 2000).
     Muon tracking has traditionally been performed using                MITO is part of ORCA (“Observatorio de Rayos Cósmicos
coincidence in multiple detectors laid out in a two layer matrix     Antártico”, in English it would be “Antarctic Cosmic Ray
with a lead layer between them to filter out lower energy parti-      Observatory”), which has been recently deployed by the
cles. For instance, the Nagoya (Japan), Hobart (Australia) and       University of Alcalá at the Juan Carlos I Antarctic Spanish Base
Sao Martinho da Serra (Brasil) multi-directional muon tele-          in Livingston Island (Antarctic Peninsula) in January 2019
scopes are similar (with layers separated 1.73 m) except for         (Ayuso et al., 2019; Blanco et al., 2019). ORCA is a combina-
the number of individual detectors (1 m2 scintillators) on each      tion of a NEutron MOnitor (NEMO), which is a direct heritage
horizontal layer. There are 6  6 in the first, 4  4 in the second   of CaLMa (CAstilla-La MAncha Neutron Monitor) (Medina
and 4  9 individual detectors in the third. On the other hand,      et al., 2013) and MITO, a muon telescope which shares with
the Kuwait telescope is composed of four 5  5 m layers              NEMO the same stack and housing. ORCA’s main objectives
(0.8 m apart) of cylindrical proportional counter tubes below        are to measure the flux of CRs in a region not covered by the
a lead layer (Mendonça et al., 2019). When a coincidence is reg-     NMDB and to study solar activity, which can be inferred from
istered between two detectors, one at each layer, the trajectory     CR flux temporal variations.

                                                             Page 2 of 16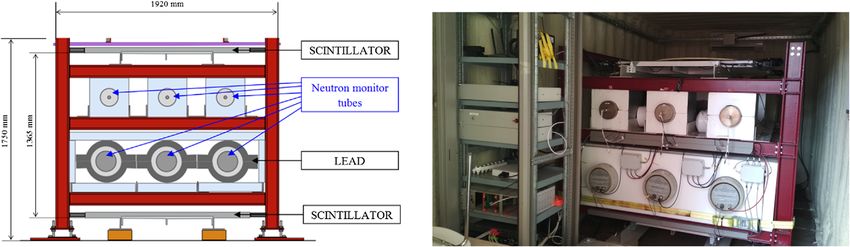
S. Ayuso et al.: J. Space Weather Space Clim. 2021, 11, 13

Table 1. Comparison between MITO and other directional muon telescopes. In Kuwait, a different approach is used, using four layers of
proportional counter tubes (PCT) instead of scintillators. The viewing angle and maximum zenith angle have not been taken from the official
specifications of each telescope, but they are approximate values obtained by calculation from each telescope dimensions in order to make a
rough comparison between MITO and other telescopes. The value of the maximum zenith angle corresponds to the vertical plane of the
diagonal. Detection areas and counting rates have been taken from (Munakata et al., 2018).

Muon telescope                         Nagoya               Hobart               S. Martinho                 Kuwait                  Mito
Scintillators/PCT                         72                   32                    72                   4 PCT layers                 2
Photomultipliers                          72                   32                    72                     186 PCT                    8
Min volume (m3)                           88                   40                    88                        20                     2.8
Viewing solid angle (sr)                 4.63                 3.99                  4.5                       5.4                    1.42
Max zenith angle (deg)                    79                   73                    80                        84                     46
Detection area (m2)                       36                   16                    32                       18.5                     1
Counting rate (103 min1)                47.8                 23.7                  42.3                      24.2                    1.7

Fig. 1. On the left, scintillator, PMTs and pyramidal light guides configuration in each MITO device. On the right, scintillator inside the
enclosure, which also serves as a light guide.

    ORCA has been implemented inside a 20 feet standard                surface that scatters incident illumination equally in all direc-
marine cargo container whose interior walls have been covered          tions. It is a reasonable approximation to many real-world
with 10 cm of polyurethane foam to insulate the electronic             surfaces such as matte paint (Pharr et al., 2017).
devices inside from external temperature variations. MITO is               Both MITO devices, MITO-Top and MITO-Bottom, have
composed of two identical devices (MITO-Top and MITO-                  been mounted in the ORCA structure (Fig. 2) with a 10 cm
Bottom), one stacked above the other 136.5 cm apart, each              thick lead layer between them belonging to the neutron monitor.
consisting of a BC-400 organic scintillator (100 cm                   This lead layer works as a filter, avoiding the passage of charged
100 cm  5 cm, poly-vinyl-toluene with 65% anthracene) and             particles below 200 MeV in the case of muons, 160 MeV for
four PMTs (Hamamatsu R2154-02) laid out around the four                protons and more than 5 GeV for electrons acording to our
narrow sides of the scintillator, pointing inwards at a distance       simulations based on GEANT4 (see Sect. 2).
of 50 cm. All those elements have been installed inside an
aluminum housing, which includes four triangular prism-shaped          2.1 Viewing angle
light guides closed in such a way that prevents the passage of
light from the outside (Fig. 1). The surface of the guide walls            A viewing angle given by the expression a = 2 arctan (d/h)
has been painted in matte white in order to get Lambertian             is obtained based on the dimensions of the scintillators and the
reflection. Lambertian reflectance models a perfect diffuse              separation between them (Fig. 3). According to this, the viewing

                                                              Page 3 of 16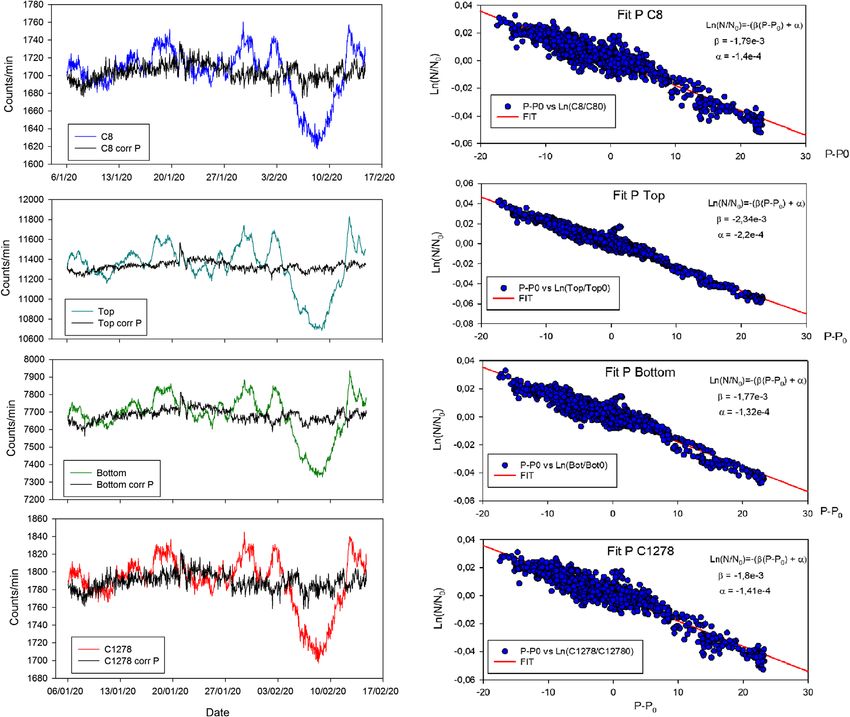
S. Ayuso et al.: J. Space Weather Space Clim. 2021, 11, 13

Fig. 2. Layout of the final setup and its installation into the ORCA marine container.

                                                                          generates a pulse whose amplitude carries information, both
                                                                          about the deposited energy and the distance between the impact
                                                                          point and the corresponding lateral surface nearest to the PMT.
                                                                          The impact point coordinates in every scintillator can be deter-
                                                                          mined by comparing the signal level of the pulses generated by
                                                                          opposite PMTs.
                                                                              Once the two impact points are determined, the muon
                                                                          incident direction can be computed (left picture in Fig. 5).

                                                                          3.1 GEANT4 simulation.

                                                                              The purpose of this simulation is to build a software model
                                                                          of the telescope with identical characteristics to the real one
                                                                          using the GEANT4 tool developed by CERN, which is a toolkit
                                                                          for the simulation of the passage of particles through matter.
                                                                          The objective is to reproduce a flux of particles (mainly muons)
                                                                          in an isotropic and random way. When generating the trajecto-
                                                                          ries, the impact coordinates in MITO-Top and the direction of
                                                                          the trajectory of each particle are known. The rest of the data
                                                                          (such as the number of photons generated in the scintillator,
                                                                          the energy losses when passing through them and through the
                                                                          lead, or the number of photons that leave the scintillator through
                                                                          each lateral face) are obtained as a result of the simulation. Since
Fig. 3. Illustrative diagram of the viewing angle (a = 2 arctan (d/h)),   the current generated by a PMT due to the passage of each
where h = 1.365 m in MITO. Therefore, a varies between 72.4° for          particle is a function of the number of photons that reach the
the vertical plane parallel to the lateral sides of the scintillator      PMT (cathode luminous sensitivity in lA/lm), a pulse whose
(d = p1 ffiffim)
          ffi and 92° for the vertical plane containing the diagonals
                                                                          amplitude is proportional to the number of photons hitting the
(d = 2 m). The solid angle for the whole set equals 1.42 sr.              cathode is generated by the PMT.
                                                                          3.1.1 Simulation characteristics

angle varies between 72.4° when the direction from side to side                The simulation geometry is composed of two identical
of each scintillator is considered (d = 1 m, h = 1.365 m), and            scintillators and the 10 cm lead layer between them, which
92° in the diagonal direction, from corner to corner                      allows us to simulate impact on the primary particle passage
(d = 1.41 m, h = 1.365 m). This gives a solid angle of                    (Fig. 5 right plot). The GEANT4 version of MITO is built of
1.42 sr. This value is lower than those for conventional                  a hollow box, which corresponds to the aluminum container
Nagoya-type telescopes, as can be seen in Table 1.                        with the scintillator placed inside. The corners of the box were
                                                                          cut off to allow photons to pass to the PMT zone, where each
                                                                          photon is registered and analyzed at the end of the event. More-
3 Theory of operation                                                     over, four sensitive detectors were placed near the scintillator to
                                                                          analyze how many photons go out through each face of the scin-
    The light generated by a charged particle passing through             tillator and compare it with the amount of them which are
the scintillator comes out through the four narrow lateral                absorbed inside the box. Along with a sensitive detector for
faces of the prism, and is led by the light guides towards the            photons, there is one detector inside the lead layer and another
four photomultipliers (Fig. 4). Each one collects the light and           one inside each scintillator, whose purpose is to measure energy

                                                                  Page 4 of 16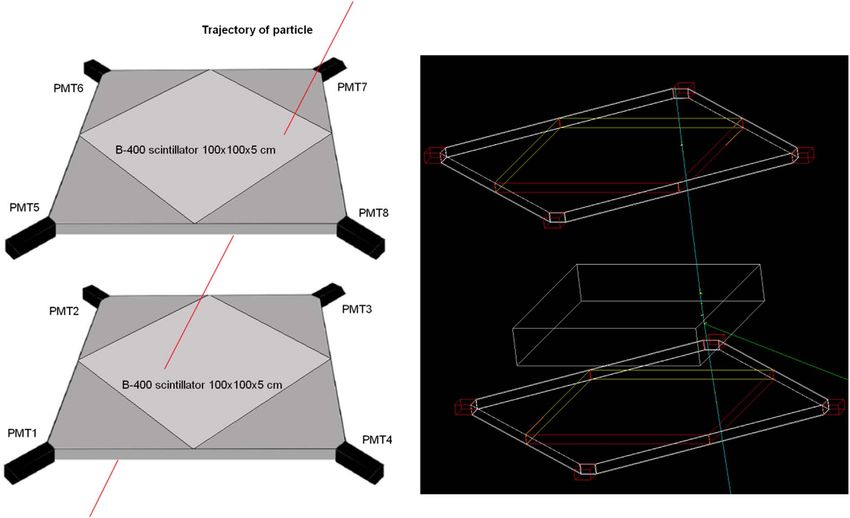
S. Ayuso et al.: J. Space Weather Space Clim. 2021, 11, 13

Fig. 4. On the left, axis and coordinates of a point. On the right, pulses captured by the PMTs in coincidence. The x coordinate is calculated
applying an algorithm from the pulse height of PMT1 and PMT3. In the same way, the y coordinate is obtained from PMT4 and PMT2 signals.

Fig. 5. On the left, cartoon showing the muon trajectory throughout MITO. On the right, GEANT 4 image representing the MITO elements
included in the simulation: Aluminum hollow box with light guides, scintillators and lead layer.

loss of the primary particle inside each volume and record track         rest of NEMO materials have a negligible influence on muon
information which is analyzed at the end of the event. With the          trajectories (Aguayo Navarrete et al., 2011) and they have not
exception of the lead layer, which has been taken into account           been taken into account in the simulation.
not only because it works as a shield for low energetic particles,            In order to identify muon impact points on the scintillator,
but also because it slightly deflects the trajectory of muons, the        we set a reference Cartesian coordinate system centred at the

                                                                Page 5 of 16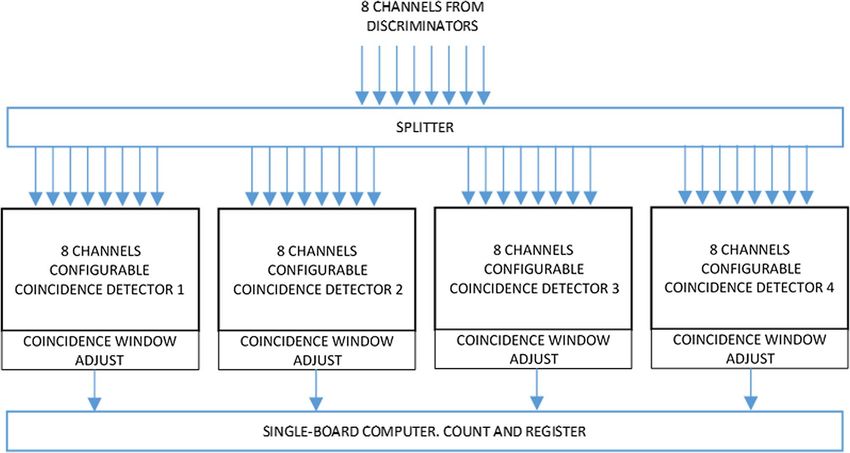
S. Ayuso et al.: J. Space Weather Space Clim. 2021, 11, 13

Fig. 6. Scatter plots showing the relationship between the simulated coordinate and the logarithm of the ratio between the total light emitted by
opposite faces on the corresponding axis.

scintillator centre, the x-axis aligned with the axes of symmetry         The distribution may be fitted by linear regression resulting in
of PMT1 and PMT3, and the y-axis aligned with the axes of                 the following expressions for coordinates in MITO-Top
symmetry of PMT2 and PMT4 (Fig. 4).                                       (xT, yT) and MITO-Bottom (xB, yB):
    The following physics processes were enabled for this
                                                                                                               N3
simulation among others: reflection, refraction and absorption                                 xT ¼ 805:3 ln        0:0066                   ð1Þ
for photons and ionization, bremsstrahlung, scattering and pair                                                N1
production for muons, besides other processes for secondary
particles.                                                                                                      N4
                                                                                             y T ¼ 805:2 ln        0:023                   ð2Þ
    The GEANT4 unified model with “groundfrontpainted”                                                           N2
surface finish has been activated for the scintillator container
aluminum surface to control Lambertian reflection and absorp-                                                   N7
                                                                                              xB ¼ 754:9 ln        0:1363                   ð3Þ
tion processes because of a matte white paint has been applied                                                 N5
to the light guides.
                                                                                                                N8
3.1.2 Impact points coordinates                                                              y B ¼ 754:5 ln       þ 0:0478                  ð4Þ
                                                                                                                N6
    A Monte Carlo simulation of 20,000 muons has been                     where Nx is the number of photons emitted through the scin-
carried out in order to obtain an algorithm that calculates the           tillator face towards the PMTx light guide.
coordinates of the muon impact point in the scintillator based                 Therefore, assuming that the four PMTs gather a propor-
on the pulse levels (number of photons) gathered by the PMTs.             tional amount of photons emerging through their respective
    The scatter plots in Figure 6 show, for each coordinate, the          scintillator side, both x and y coordinates can be directly calcu-
relationship between the impact point coordinate and the ratio            lated in both scintillators from equations (1)–(4).
between the total light emitted by the lateral sides of the scintil-           Once the coordinates of the point of impact on both scintil-
lator that are perpendicular to the corresponding coordinate axis.        lators have been determined, the azimuth and zenith angles for

                                                                 Page 6 of 16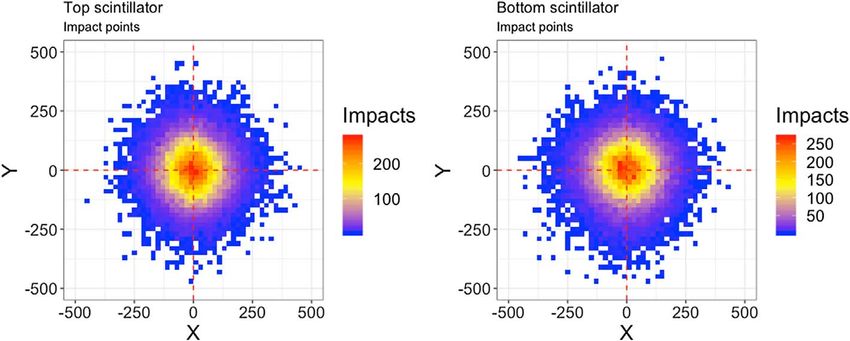
S. Ayuso et al.: J. Space Weather Space Clim. 2021, 11, 13

Fig. 7. Histograms with the difference between simulated coordinates and calculated coordinates (including lead layer deviation effect) fitted to
a Gaussian distribution. The error e in 99,7% of all calculated coordinates is lower than e = ±3r = ±55.8 mm.

every incident particle are computed by means of the two rela-                               determination of the accuracy of MITO requires the use under
tionships given in the following equations:                                                  controlled conditions of suitable radioactive sources but this
                             y         y  yB                                                has not been possible before its implementation. However, it
                / ¼ arctan ¼ arctan T                     ð5Þ                                is possible to use the simulation described in Section 3.1 to give
                             x         xT  xB
                                                                                             an estimate of the precision in determining the point of impact
                                        qffiffiffiffiffiffiffiffiffiffiffiffiffiffiffiffiffiffiffiffiffiffiffiffiffiffiffiffiffiffiffiffiffiffiffiffiffiffiffiffiffiffiffiffiffiffiffi     and the direction of incidence. The simulated impact points has
             pffiffiffiffiffiffiffiffiffiffiffiffiffiffi
                                         ðxT  xB Þ þ ðy T  y B Þ
                                                           2                         2
              x2 þ y 2                                                                       been compared to the calculated impact points inferred from
  h ¼ arctan                 ¼ arctan                                                        equations (1)–(4) to fulfill this goal. Applying these formulas
                  z                                            z
                                                                                             to calculate the x and y coordinates for all impact points and
                                                                                      ð6Þ
                                                                                             then obtaining the difference between calculated and simulated
being / the azimuth angle, h the zenith angle, xT and xB the                                 values, it is possible to determine the error e for the calculated
x coordinates on top and bottom respectively, yT and yB                                      impact point coordinates. Figure 7 shows the histograms of this
the y coordinates on top and bottom respectively and z the                                   error defined as the difference between simulated and calculated
distance between MITO-Top and MITO-Bottom.                                                   values.
                                                                                                 The histograms in Figure 7 are fitted to a Gaussian distribu-
3.1.3 Impact point precision and angular resolution                                          tion, being the standard deviation r = 18.6 mm in the worst
                                                                                             case (y coordinate in the top scintillator). Therefore, 99.7% of
    The accuracy in the determination of the impact point                                    the calculated coordinates will have an error e  ±3r  e
depends on many factors, such as the proportionality between                                 ±55.8 mm. The muon deviation passing through the lead layer
the conversion of the received light and the height of the pulse,                            has also been taken into account. According to the previous
the number of reflections of the photons before reaching the                                  results, it can be considered that the particle has passed through
photomultiplier and the uncertainty of the processes involved                                some region into a 11.16 cm diameter circular area centered at
in the production of light and its measurement. The correct                                  the calculated point of impact.

                                                                                     Page 7 of 16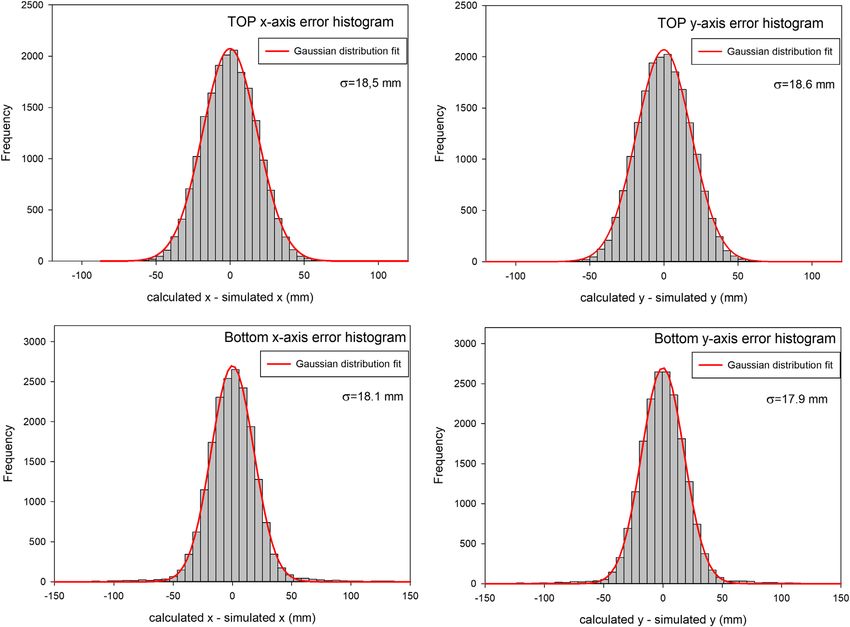
S. Ayuso et al.: J. Space Weather Space Clim. 2021, 11, 13

     Once the error e is computed, the angular resolution can be
obtained by means of a geometric analysis. A drawing of the
applied geometrical considerations is outlined in Figure 8.
It is clear from the figure that there is a dependence between
the zenith angle and the angular resolution resulting the latter
increasing as the zenith angle increases. For vertical trajectories,
h = 0, the angular resolution is equal to 4.7°. It is possible make
a rough comparison between MITO and Nagoya telescope
applying the same geometrical considerations and taking into
account Nagoya dimensions (1.73 m between matrix layers).
The Nagoya zenith angular resolution will be ranged between
30 (arctan (1/1.73)) and 39 (arctan (1.41/1.73)) degrees, depend-
ing on the considered direction, scintillator edge (1 m) or
scintillator diagonal (1.41 m). Applying the same calculation
process for Kuwait telescope, with PCT of 10 cm diameter
and 0.8 m between layers, it would give an angular resolution
between 7° and 10° for vertical trajectories.                          Fig. 8. Diagram of the method used for the estimation of the zenith
     To check the validity of the geometrical approach and the         angle resolution using a geometrical approach. e is the worst case
comparison between MITO and Nagoya Telescope, the MITO                 error estimation, h is the zenith angle, a and b are the angular
angular resolution has also been estimated using the GEANT4            resolution for the two extreme cases.
simulation and applying equations (5) and (6) to compute the
estimated zenith and azimuth angles. The accuracy of the angle
estimations is defined as the difference between the simulated          (Aguayo Navarrete et al., 2011). The result is summarized in
and the calculated zenith and azimuth angles. Figure 9 shows           Figure 10. Top panel shows the deposited energy on MITO-Top
the histograms of these errors fitted to the Gaussian distribution      and Bottom panel shows MITO-Bottom. The 0–1 MeV bar in
function. The error yielded in 99.7% of the trajectories is lower      the bottom panel represents stopped particles at the lead layer
than ±3r, that is, ±3.9° in the zenith angle and ±16.2° in the         between MITO-Top and MITO-Bottom. None of the simulated
azimuth angle. It should be pointed out that although the              electrons were able to impact on MITO-Bottom. Taking into
geometrical approach overestimates the error when comparing            account the expected energy spectra for these particles at MITO
it to the error calculated in the simulation, (±4.7° vs. ±3.9°) it     location as it is inferred from PARMA model (Sato et al., 2008),
is still valid to perform the comparison between MITO and              the amount of electrons crossing MITO is negligible while the
Nagoya telescope.                                                      number of muons is about 100 times more numerous than
     As a last comment, regarding the angular resolution and the       protons.
precision in the impact points, it should be noted that the main
goal of MITO is not to achieve high performance in both
angular and impact point precision, but rather, to detect varia-
tions in time of muon trajectories and, therefore, anisotropies        4 Electronic modules
in the cosmic ray flux to forecast ICMEs.
                                                                           The telescope has been equipped with two data acquisition
3.1.4 Particle energy loss                                             modules that carry out similar functions using different
                                                                       technologies, SAS (analog processing module) and ARACNE
    The energy threshold for MITO to detect a charged particle         (digital processing module). Thus, the eight analog signals from
in its current configuration, i.e. with NEMO polyethylene and           the PMTs are first amplified and then fed to both systems in
lead between MITO-Top and MITO-Bottom, depends on the                  parallel by means of an analog splitter system (Fig. 11), so that
energy that a particle deposits along its path through MITO.           results from both systems can be compared and validated
    The performed simulation allowed us to calculate the energy        against each other.
losses of muons, electrons and protons while passing through
MITO, in order to evaluate the effect of the lead layer as a filter     4.1 Analog processing module (SAS)
to suppress unwanted effects such as false coincidences, or the
relative weight of electrons, protons and muons in the overall             The SAS module performs analog processing on the pulses
MITO counting rate. Secondary particles such as muons,                 coming from each PMT, discriminating pulses above and below
electrons and protons uniformly distributed from 1 MeV to              certain threshold levels and, therefore, limiting the energetic
10 GeV were generated and fired above MITO-Top at random                particle range to process. These threshold levels are adjustable
coordinates and vertical incidence.                                    for each channel, and coincidence detection can also be config-
    The MITO coincidence channel can detect charged particles          ured for any arbitrary combination of channels among the eight
coming throughout both scintillators. The kinetic energy losses        available.
for crossing MITO are, on average, 200 MeV, 160 MeV and                    The SAS module has a triple mission:
more than 5 GeV for muons, protons and electrons respectively.             Firstly, the adaptation of the input signal level to the allowed
It has to be pointed out that polyethylene has not been included       dynamic operating range, which is between 0 and 5 V peak
in the simulation because the expected effect on the secondary         (Fig. 12). For this, it has two adjustments: on the one hand,
particle flux is negligible in comparison with lead effect              an attenuator and, on the other hand, a variable gain operational

                                                               Page 8 of 16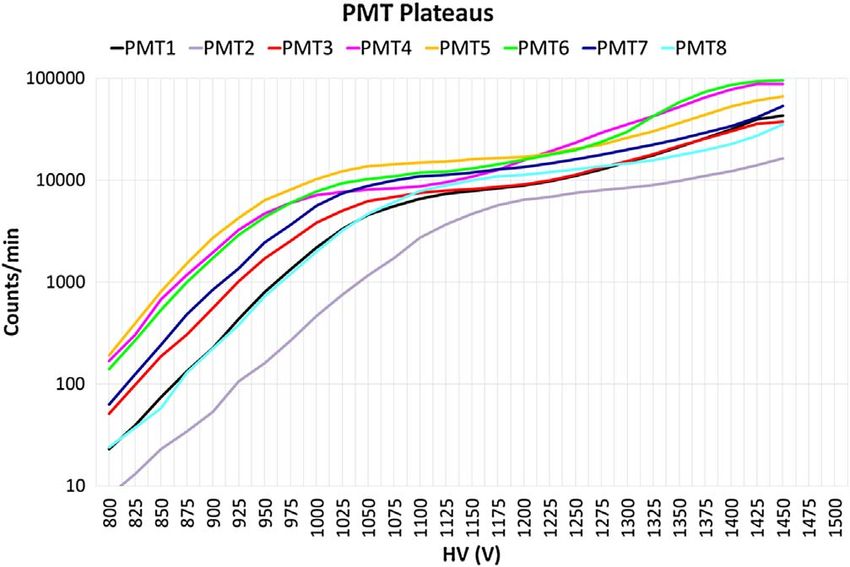
S. Ayuso et al.: J. Space Weather Space Clim. 2021, 11, 13
Fig. 9. Gaussian distribution fit of zenith (on the left) and azimuth (on the right) angles errors. The error in 99.7% of all calculated angles is
lower than ±3.9° (±3r) in zenith angles and lower than ±16.2° in azimuth angles.
In our case the time windows are set to 300 ns. Bearing in mind
that the accidental rate Duldig (2000), NA, is simply:
N A ¼ 2N 1 N 2 s ð7Þ
where N1 and N2 are the background rate in each tray and s is
the coincidence resolving time. In our case, after adjusting the
system at its current location, mean N1 = 188.8 counts/s, mean
N2 = 128 counts/s, mean in the coincidence mode Coin8:
28.4 counts/s and s = 300 ns. Thus, the value of the accidental
rate NA, is 14.4 103 counts/s, which is 0.05% with all
PMTs working in coincidence.
The output pulses generated by the four coincidence
detectors are counted and registered along with a time-stamp
by means of a low cost Beaglebone Black single-board
computer (SBC) running a specific software. In addition, this
SBC provides other capabilities such as data transmission and
Fig. 10. Energy losses for electrons, protons and muons on MITO- remote monitoring and control, which is useful if it is located
Top (upper panel) and on MITO-Bottom (lower panel). in regions difficult to reach, such as Antarctica in this case.
Taking into account the processing and recording times of the
SBC according to the laboratory tests carried out with a pulse
generator, MITO is able to detect and record a count rate of
amplifier that can be adjusted to increase the level of the pulses up to 100,000 pulses per minute, ten times more than the
if necessary. expected maximum of 10,000 pulses per minute in the upper
Secondly, the discrimination of pulses by means of a level scintillator.
discriminator that allows rejecting pulses exceeding a certain
threshold (ULD) and therefore energy levels outside our inter- 4.2 Digital processing module (ARACNE)
est, or those below a certain threshold (LLD) that correspond
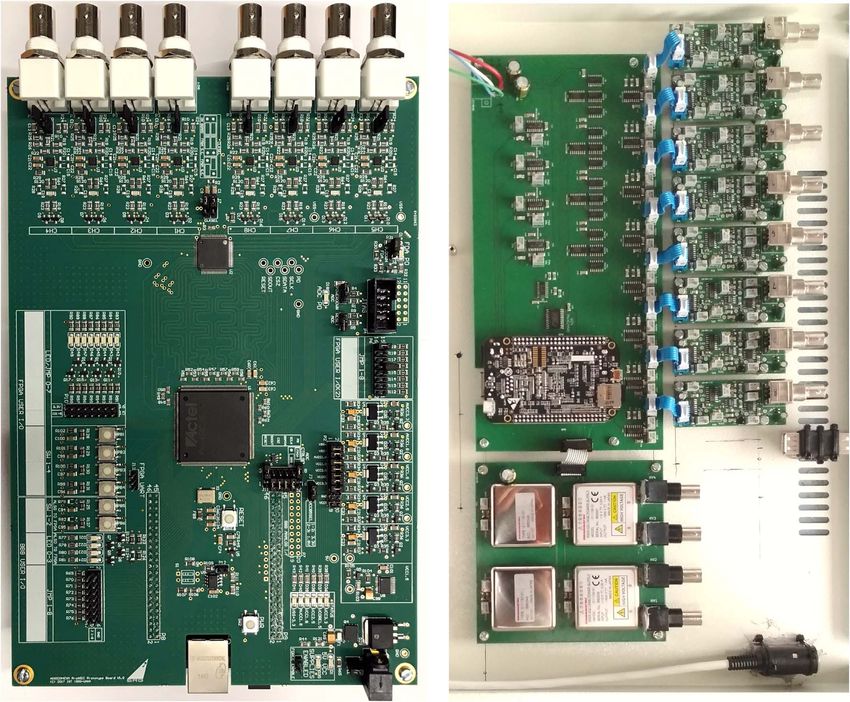
to noise or low energy particles. The ARACNE module (Fig. 14) works by doing all the
Thirdly, the coincidence detection, by means of a module discrimination, pulse detection and pulse height analysis digi-
with four coincidence detectors which can be individually tally. After a simple analog conditioning stage, all eight signals
configured to detect a coincidence between any combination from the PMTs are sampled in parallel using a high-speed and
of the eight PMT channels (Fig. 13). high-resolution ADC, and a FPGA device monitors all channels
In order to obtain a faster temporal response, software simultaneously to detect a pulse on any channel (trigger level
coincidence (Ayuso et al., 2016) is not implemented, but and trigger channel(s), among other things, are software
hardware coincidence. Each coincidence detector is basically configurable).
an AND gate, which allows the adjustment of a coincidence When a pulse is detected, a window of samples of all eight
resolving time window per channel. This time window is neces- channels, before and after the pulse, is captured and transferred
sary to compensate for the different propagation delays of the to a SBC (also a Beaglebone Black), where coincidence and
pulses since they are generated by each PMT until they are height of pulses on all channels is determined and stored to
compared in the coincidence detector. The smaller this window calculate points of impact on each scintillator as well as muon
is, the lower the probability of false coincidence detection. trajectories. By operating this way, the ARACNE module
Page 9 of 16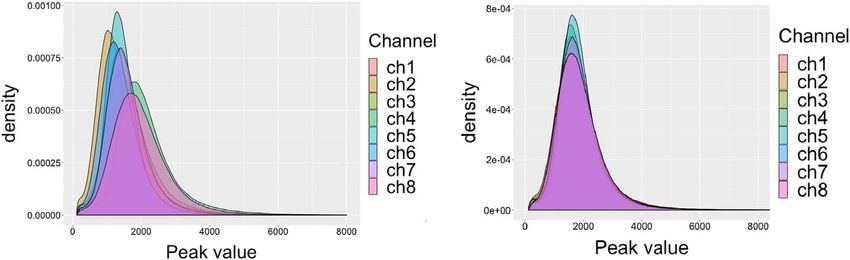
S. Ayuso et al.: J. Space Weather Space Clim. 2021, 11, 13

Fig. 11. MITO block diagram. The same analog signals detected by PMTs reach both process modules (analogue and digital). In this way, both
results can be compared.

Fig. 12. Block diagram of signal analogue processing for each of the 8 input channels.

Fig. 13. Coincidence module. There are 4 identical configurable coincidence detectors. Any combination of the eight channels can be selected
by software on each detector independently.

allows pulse counting as well as pulse height (or even shape)          4.3 Calibration and adjustment
analysis, and other kinds of digital processing on the FPGA
deemed necessary could be implemented.                                     The size of MITO makes any direct calibration by position-
    A more detailed description of the ARACNE platform is              ing a radioactive source over the detector difficult. An alterna-
foreseen in a future paper.                                            tive for impact point calibration could be to use cosmic rays,

                                                              Page 10 of 16
S. Ayuso et al.: J. Space Weather Space Clim. 2021, 11, 13
Fig. 14. ARACNE module on the left and SAS module with the HV power supply card on the right.
selecting a narrow beam by using an additional small area and different high voltage (HV) bias values (Wright, 2017).
sensor, positioning it at specific points of the detector and using Therefore, counting tests were carried out with identical gains
coincidence between MITO and this additional detector. Both in each channel, varying the HV bias voltage and writing down
techniques are currently under evaluation. Additionally, a novel the counts of each PMT. The results are presented in Figure 15.
self-organizative map technique which corrects slight misalign- As the system has 4 voltage sources for the 8 PMTs, they were
ments during operation has been recently presented as an biased in pairs with plateaus at similar voltage levels as indicated
alternative method to a traditional calibration of MITO, but it in Table 2. As it can be seen, the HV bias level was adjusted
should still be checked with a traditional calibration (Regadío slightly above the plateau. In this way, it is also possible to detect
et al., 2020). muons with the lowest energy losses (mixed with other noise
Finally, the adopted calibration method is based on the particles) when passing through the scintillator. Thus, MITO
signals registered by the instrument itself, adjusting the eight detects more noise pulses, but they are later removed by the
signal processing chains so that the level of gain and pulse coincidence detector, leaving a more complete muon histogram.
discrimination results in identical pulse heights when the Each of these voltages can be remotely monitored or recorded in
passage of particles through the scintillators happens at the same order to verify the proper system operation.
distance with respect to each pair of PMTs facing each other.
The calibration procedure consists of two steps. First, setting 4.3.2 Gain and level discriminator adjustment
the bias of each PMT, and second, setting each PMT signal
level to be equal to the others by means of its statistical response Gain, upper level discriminator (ULD) and lower level dis-
after evaluation of a few thousand pulses. criminator (LLD) adjustments have to be carried out in both
analog and digital electronic modules (SAS and ARACNE).
4.3.1 PMTs bias adjustment
– Analog processing module adjustment
Due to the delicate manufacturing process of PMTs, each
unit differs in their characteristics, especially regarding their In the analog module there are dedicated circuits for LLD,
cathode and anode sensitivity, which implies different gains ULD and gain signal adjustments. SAS gain adjustments were
Page 11 of 16S. Ayuso et al.: J. Space Weather Space Clim. 2021, 11, 13
obtained for each channel is then used in equations (1)–(4) to
calculate the coordinates as follows:
N 1 ¼ LK 1 V 1 : ð8Þ
Resulting equation (1) as follows:
LK 3 V 3
xT ¼ 805:3 ln 0:0066 )
LK 1 V 1
K 3V 3
xT ¼ 805:3 ln 0:0066 ð9Þ
K 1V 1
where L is the relationship between the number of photons
and the pulse height. K1 and K3 are the correction factor for
channel 1 and 3. V1 and V3 the height pulses from PMT1
and PMT3 respectively.
Fig. 15. PMT plateaus. The bias HV voltages were adjusted slightly The same gain correction process is applied to calculate the
above the flat section of the curves to obtain a more complete muon remaining coordinates. The correction factors obtained for this
histogram. first MITO prototype are showed in Table 3.
Afterwards, ULD and LLD adjustments are carried out by
filtering each channel data, taking only those that are below
Table 2. Pairings of PMTs and assigned bias voltage.
(ULD) and above (LLD) the appropriate thresholds, just as it
was done with the analog module adjustment.
Photomultipliers PMT1– PMT2– PMT4– PMT6–
PMT3 PMT8 PMT5 PMT7
Voltage 1300 V 1400 V 1200 V 1300 V 5 Preliminary data
MITO is currently operating at the Spanish Juan Carlos I
Base at Livingston Island in Antarctica. Although it was
accomplished after telescope assembly by taking samples and installed in January 2019, more usable data have been produced
generating histograms for each channel by means of a multi since December 2019 when some calibration works were
channel analizer (MCA). Then, the maximum of the histogram performed. Some examples of this preliminary data collected
was brought to the same common value adjusting the gain con- during January and February 2020 are presented below.
trols placed in the printed circuit board for all the eight channels Four coincidence modes are activated during the normal
(Fig. 16). operation time of MITO. Mode 1 (Coin8): coincidence of the
As it is shown in the histogram on the right panel of eight PMTs. This mode implies that the detected particle
Figure 16, hardly any pulses are received above level 4000. crossed both scintillators, i. e. MITO-Top and MITO-Bottom.
For this reason, the ULD has been adjusted to level 6000 for Mode 2 (Top): coincidence of the four PMTs of MITO-Top.
all channels, rejecting high-level pulses which could saturate Mode 3 (Bottom): coincidence of the four PMTs of MITO-
amplifier steps and generate false coincidences without interest Bottom and mode 4 (Diagonal): coincidence in PMTs number 1,
in our application. 2, 7 and 8. This Diagonal mode serves as a test for other
Eventually, the LLD adjustment was done by increasing the coincidence modes.
threshold of each channel until the number of counts was Data collected by MITO need some atmospheric corrections
similar in all channels and slightly above the expected muon before being used for scientific purposes. Pressure and temper-
flux. In this way, particle detection is limited to those with ature effect on the measured counting rate must be corrected.
the energy level in the expected range corresponding to that It is generally accepted by many authors as (De Mendonça
of muons. et al., 2013; Paschalis et al., 2013) among others, that the
barometric effect can be experimentally determined by the
– Digital processing module adjustment following equation:
I
As mentioned in Section 4.2, ARACNE doesn’t need ¼ b P ð10Þ
I P
adjustments. All eight signals from the PMTs are sampled
and recorded when a pulse is detected at any of the channels, where (DI/I)P is the normalized deviation of the cosmic ray
and most of the LLD, ULD, coincidence selection and gain intensity in relation to atmospheric pressure, DP is the atmo-
adjustments are performed later during data processing. Only spheric pressure deviation and b is the barometric coefficient,
a programmable trigger level needs to be programmed in the which depends on many factors, such as the nature of the
module. secondary component and the altitude where the observation
Gain adjustment is performed by producing histograms with is performed (Dorman, 2004).
the recorded pulse height data for each channel, and aligning On the other hand, temperature corrections are more difficult
them through a correction (gain) factor, in the same way as it although methods developed to describe and correct the effect
was done with the analog module (Fig. 16). The correction factor of atmospheric temperature do exist. For instance, one of them
Page 12 of 16S. Ayuso et al.: J. Space Weather Space Clim. 2021, 11, 13
Fig. 16. Histograms with the 8 PMTs in coincidence, before and after the gain adjustment, but with LLD adjusted. They have the peak in the
same value. After applying coincidence detection, noise disappears on the left of the histograms.
Table 3. Correction factors obtained for the gain adjustment of each channel.
Channel/PMT 1 2 3 4 5 6 7 8
Correction factor K1 K2 K3 K4 K5 K6 K7 K8
Value 1.3 1.81 1.41 1 1.38 1.59 1.38 1.18
Fig. 17. On the left panel, the hourly count rate for data taken from January 6th to February 14th, 2020 for the four coincidence channels.
Original signals (in color) and corrected pressure signals (in black). On the right, the four fitting plots to obtain the pressure adjusting
parameters.
Page 13 of 16S. Ayuso et al.: J. Space Weather Space Clim. 2021, 11, 13
Fig. 18. On the left MITO (Coin8) and NEMO (3NM64 and 3BMN) fluxes with atmospheric pressure corrected from January 6th to February
14th, 2020. On the right panel the same normalized data. As can be seen, both MITO and NEMO fluxes present a clear correlation without great
variations, which could be indicative of the absence of solar eruptive phenomena such as major solar flares or large CMEs.
Fig. 19. Scatter plot of impact points in top and bottom scintillators with the eight PMTs in coincidence, corresponding to 34,783 data taken on
January 31, 2019.
is the integral method which defines the normalized variation of Figure 17 represents the muon flux registered from January
muon flux dependence on temperature variation as: 6th to February 14th. Pressure corrected (black lines) and
Z h0 uncorrected (coloured lines) data are shown at the left column
I of the figure. Otherwise, the determination of the pressure coef-
¼ aðhÞ dT ðhÞ dh ð11Þ ficients for the four coincidence channel are presented at the
I T 0
right column of the figure. It is clear that the correction removes
where a(h) is the temperature coefficient density and dT is the the main part of the atmospheric effect on MITO measurement.
temperature variation calculated as dT = T TB, where T is A similar procedure to produce NEMO pressure-corrected
the actual temperature and TB is the base temperature value data has been performed. MITO (muons) and NEMO (neutrons)
(Berkova et al., 2012). can be directly compared. This is shown in Figure 18. As it can
The correction of the effect of temperature according the inte- be seen, the flux is stable without great variations and very
gral method (11) requires a complete information about the atmo- similar in both instruments, which could be in agreement with
spheric temperature profile for a given geographical location and the fact that, in this period, there were no solar eruptive
the temperature coefficient density function. Temperature profile phenomena such as major flares and large CMEs.
measurements are often not available, as for Juan Carlos I Furthermore, from a technical point of view (main scope of
Antarctic Base, and meteorological models have to be used this work), the flux is stable and the number of particles detected
instead (Berkova et al., 2012; Savic et al., 2016) have proven that is within the expected margins. MITO-Top detects more
meteorological models such as GFS (Global Forecast System) impacts (11,330 min1) than MITO-Bottom (7680 min1), as
are able to provide temperatures for 25 isobaric levels for a it is expected due to the action of the intermediate lead layer.
given geographical location with latitude/longitude precision of This behaviour is reproduced by the performed simulations.
0.5° what is suitable to replace the necessary temperature profile A stable flux is observed in all the coincidence channels with
measurements for the estimation of the correction of the temper- similar variations, which is indicative that the instrument is
ature effect on the MITO measurements. working properly.
Page 14 of 16S. Ayuso et al.: J. Space Weather Space Clim. 2021, 11, 13
As it has been commented in previous sections, MITO can Ayuso S, García Tejedor JI, Blanco JJ, Gómez Herrero R, García
estimate the impact point of an incoming particle on the detector Población O, Medina J, Prieto M, López Comazzi A. 2019. MITO,
volume from the signal recorded by the photomultipliers. A set a new directional muon telescope design. First observations. PoS
of 34,783 samples recorded along one hour on January 31st ICRC2019: 180. https://doi.org/10.22323/1.358.0180, URL
2020 has been used to check this MITO capability. The https://pos.sissa.it/358/180/.
computed impact points for MITO-Top (left) and MITO-bottom Berkova M, Belov A, Eroshenko E, Yanke V. 2012. Temperature
(right) are shown in Figure 19. Impact points have been effect of muon component and practical questions of how to take
computed using equations (1)–(4). Most of the impacts are in into account in real time. Astrophys Space Sci Trans 8(1): 41–44.
https://doi.org/10.5194/astra-8-41-2012, URL http://www.astro-
the central area of the scintillators as expected according to
phys-space-sci-trans.net/8/41/2012/.
the telescope geometric factor and the muon angular distribution
Blanco JJ, Catalán E, Hidalgo MA, Medina J, García O, Rodríguez-
at sea level (Cecchini & Spurio, 2012). Pacheco J. 2013a. Observable effects of interplanetary coronal mass
ejections on ground level neutron monitor count rates. Sol Phys
284(1): 167–178. https://doi.org/10.1007/s11207-013-0256-1, URL
6 Conclusions https://link.springer.com/article/10.1007/s11207-013-0256-1.
Blanco JJ, Hidalgo MA, Gómez-Herrero R, Rodríguez-Pacheco J,
A new concept of directional muon telescope has been Heber B, Wimmer-Schweingruber RF, Martín C. 2013b. Ener-
getic-particle-flux decreases related to magnetic cloud passages as
implemented and the first prototype is being tested at the
observed by the Helios 1 and 2 spacecraft. A&A 556: A146.
Spanish Antarctic Base Juan Carlos I. Some of its functionali-
https://doi.org/10.1051/0004-6361/201321739.
ties, like muon flux counting and cosmic rays anisotropies Blanco JJ, García Población O, García Tejedor JI, Medina J, Prieto
determination, make it ideal to supply additional meaningful M, López-Comazzi A, Ayuso S, Gómez-Herrero R, Steigies C.
information to that provided by neutron monitors in Space 2019. A new neutron monitor at the Juan Carlos I Spanish
Weather applications, anticipating the forecasts of ICMEs Antarctic Station (Livingston Island-Antarctic Peninsula). PoS
arriving on Earth and adding the ability to study additional ICRC2019: 1060. https://doi.org/10.22323/1.358.1060, URL
characteristics of future incoming solar events. https://pos.sissa.it/358/1060/.
The telescope has been equipped with two data acquisition Cane HV. 2000. Coronal mass ejections and forbush decreases. Space
modules that carry out similar functions using different tech- Sci Rev 93: 55–77. https://doi.org/10.1023/A:1026532125747.
nologies. Thus, the results from both systems can be compared Cane HV, Richardson IG, St. Cyr OC. 2000. Coronal mass ejections,
and validated against each other. In addition, having a general interplanetary ejecta and geomagnetic storms. Geophys Res Lett
purpose, yet powerful, single-board computer with networking 27(21): 3591–3594. https://doi.org/10.1029/2000GL000111, URL
capabilities, opens the possibility of making data available in https://agupubs.onlinelibrary.wiley.com/doi/abs/10.1029/
real-time to the scientific community. 2000GL000111.
Compared to other large telescopes, MITO greatly reduces Cecchini S, Spurio M. 2012. Atmospheric muons: experimental
weight, volume and cost, achieving a good performance-cost aspects. Geosci Instrum Methods Data Syst 1(2): 185–196.
ratio and therefore making it affordable. Although the point of https://doi.org/10.5194/gi-1-185-2012, URL https://www.geosci-
impact calculation algorithms and some electronics may still instrum-method-data-syst.net/1/185/2012/.
be added to improve its performance and response in real-time, da Silva MR, Contreira DB, Monteiro S, Trivedi NB, Munakata K,
preliminary results seem to be reasonably in line with Kuwabara T, Schuch NJ. 2004. Cosmic ray muon observation
at southern space observatory – SSO (29S, 53W). Astrophys
expectations.
Space Sci 290(3): 389–397. https://doi.org/10.1023/B:ASTR.
0000032537.23712.22, URL https://ui.adsabs.harvard.edu/abs/
Acknowledgements. We thank the following two projects: 2004Ap&SS.290.389D.
CTM2016-77325-C2-1-P, funded by Ministerio de Economía De Mendonça RRS, Raulin JP, Echer E, Makhmutov VS, Fernandez
y Competitividad and by the European Regional Development G. 2013. Analysis of atmospheric pressure and temperature effects
on cosmic ray measurements. J Geophys Res: Space Phys 118(4):
Fund and PID2019-107806GB-I00, funded by Ministerio de
1403–1409. https://doi.org/10.1029/2012JA018026, URL https://
Ciencia e Innovación. The editor thanks three anonymous
agupubs.onlinelibrary.wiley.com/doi/abs/10.1029/2012JA018026.
reviewers for their assistance in evaluating this paper. Dorman L. 2004. Cosmic rays in the Earth’s atmosphere and
underground, Vol. 303. https://doi.org/10.1007/978-1-4020-2113-8,
URL https://link.springer.com/book/10.1007%2F978-1-4020-2113-8.
Duldig M. 2000. Muon observations. Space Sci Rev 93:
References 207–226. https://doi.org/10.1023/A:1026596529381, URL https://
link.springer.com/article/10.1023%2FA%3A1026596529381.
Aguayo Navarrete E, Kouzes RT, Ankney AS, Orrell JL, Havelka M, Auerbach P, Sochorová J. 2002. Software coincidence
Berguson TJ, Troy MD. 2011. Cosmic ray interactions in shielding counting. Appl Radiat Isot 56(1): 265–268. Proceedings of the
materials. https://doi.org/10.2172/1025678, https://www.pnnl.gov/ Conference on Radionuclide Metrology and its Applications,
main/491publications/external/technical_reports/PNNL-20693.pdf. ICRM’01. https://doi.org/10.1016/S0969-8043(01)00198-1, URL
Ayuso S, Blanco JJ, Medina J, Gómez-Herrero R, García-Población O, http://www.sciencedirect.com/science/article/pii/S096980430100
García Tejedor I. 2016. A coincidence detection system based on 1981.
real-time software. Geosci Instrum Methods Data Syst 5(2): Karapetyan Grigori, Ganeva Marina, Hippler Rainer. 2013. Direc-
437–449. https://doi.org/10.5194/gi-5-437-2016, URL https://gi. tional sensitivity of MuSTAnG muon telescope. J Space Weather
copernicus.org/articles/5/437/2016/. Space Clim 3: A16. https://doi.org/10.1051/swsc/2013040.
Page 15 of 16S. Ayuso et al.: J. Space Weather Space Clim. 2021, 11, 13
Leerungnavarat K, Ruffolo D, Bieber JW. 2003. Loss cone precursors Munakata K, Kozai M, Evenson P, Kuwabara T, Kato C, et al. 2018.
to forbush decreases and advance warning of space weather effects. Cosmic-ray short burst observed with the Global Muon Detector
Astrophys J 593(1): 587–596. https://doi.org/10.1086/376408, Network (GMDN) on 2015 June 22. Astrophys J 862(2): 170.
https://iopscience.iop.org/article/10.1086/376408. https://doi.org/10.3847/1538-4357/aacdfe, URL https://doi.org/
Mavromichalaki H, Yanke V, Dorman L, Iucci N, Chilingaryan A, 10.3847%2F1538-4357%2Faacdfe.
Kryakunova O. 2004. Neutron Monitor Network In Real Time And Paschalis P, Mavromichalaki H, Yanke V, Belov A, Eroshenko E,
Space Weather. In: Effects of Space Weather on Technology Gerontidou M, Koutroumpi I. 2013. Online application for the
Infrastructure, Daglis IA (Ed.), Springer, Netherlands, Dordrecht, barometric coefficient calculation of the NMDB stations. New Astron
pp. 301–317. ISBN 978-1-4020-2754-3. https://doi.org/10.1007/ 19: 10–18. https://doi.org/10.1016/j.newast.2012.08.003, URL http://
1-4020-2754-0_16, http://fzk.aragats.am/files/Publication/Neutron_ www.sciencedirect.com/science/article/pii/S1384107612000759.
Monitor_Network_in_Real_Time_and_Space_Wea.pdf, URL https:// Pharr M, Jakob W, Humphreys G. 2017. 08 – Reflection models. In:
link.springer.com/chapter/10.1007%2F1-4020-2754-0_16. Physically based rendering (third edition), Pharr M, Jakob W,
Medina J, Blanco JJ, García O, Gómez-Herrero R, Catalán EJ, et al. Humphreys G (Eds.), third edn, Morgan Kaufmann, Boston,
2013. Castilla-La Mancha neutron monitor. Nucl Instrum Methods pp. 507–568. ISBN 978-0-12-800645-0. https://doi.org/10.1016/
Phys Res Sect A: Accel Spectr Detect Assoc Equip 727: 97–103. B978-0-12-800645-0.50008-7, URL http://www.sciencedirect.com/
https://doi.org/10.1016/j.nima.2013.06.028, http://www.sciencedirect. science/article/pii/B9780128006450500087.
com/science/article/pii/S0168900213008486. Regadío A, Tejedor JIG, Ayuso S, Población Óscar García, Blanco
Mendonça RRS, Wang C, Braga CR, Echer E, Dal Lago A, et al. 2019. JJ, Sánchez-Prieto S, Polo Óscar Rodriguez. 2020. Trajectory
Analysis of cosmic rays’ atmospheric effects and their relationships determination of muons using scintillators and a novel self-
to cutoff rigidity and zenith angle using global muon detector organizative map. Nucl Instrum Methods Phys Res Sect A: Accel
network Data. J Geophys Res: Space Phys 124(12): 9791–9813. Spectr Detect Assoc Equip 973: 164–166. https://doi.org/10.1016/
https://doi.org/10.1029/2019JA026651, https://agupubs.onlinelibrary. j.nima.2020.164166, URL http://www.sciencedirect.com/science/
wiley.com/doi/pdf/10.1029/2019JA026651, https://agupubs. article/pii/S0168900220305623.
onlinelibrary.wiley.com/doi/abs/10.1029/2019JA026651. Rockenbach M, Dal Lago A, Schuch N, Munakata K, Kuwabara T,
Müller-Mellin R, Kunow H, Fleißner V, Pehlke E, Rode E, et al. 1995. et al. 2014. Global muon detector network used for space weather
COSTEP – comprehensive suprathermal and energetic particle applications. Space Sci Rev 182(1–4): 1–18. URL https://link.
analyser. Sol Phys 162(1–2): 483–504. https://doi.org/10.1007/ springer.com/article/10.1007%2Fs11214-014-0048-4.
BF00733437, http://articles.adsabs.harvard.edu/pdf/1995SoPh.162. Sato T, Yasuda H, Niita K, Endo A, Sihver L. 2008. Development of
483. PARMA: PHITS-based analytical radiation model in the atmo-
Munakata K, Bieber JW, Yasue S-I, Kato C, Koyama M, Akahane S, sphere. Radiat Res 170(2): 244–259. https://doi.org/10.1667/
Fujimoto K, Fujii Z, Humble JE, Duldig ML. 2000. Precursors of RR1094.1, URL https://meridian.allenpress.com/radiation-research/
geomagnetic storms observed by the muon detector network. article-pdf/170/2/244/2155866/rr1094_1.pdf.
J Geophys Res: Space Phys 105(A12): 27457–27468. https://doi. Savic M, Dragic A, Veselinovic N, Udovicic V, Banjanac R, Jokovic
org/10.1029/2000JA000064, https://agupubs.onlinelibrary.wiley. D, Maletic D. 2016. Effect of pressure and temperature corrections
com/doi/pdf/10.1029/2000JA000064, https://agupubs.onlinelibrary. on muon flux variability at ground level and underground. https://
wiley.com/doi/abs/10.1029/2000JA000064. arxiv.org/pdf/1701.00164.pdf.
Munakata K, Kuwabara T, Yasue S, Kato C, Akahane S, et al. 2005. Tanabashi M, Hagiwara K, Hikasa K, Nakamura K, Sumino Y, et al
A “loss cone” precursor of an approaching shock observed by a (Particle Data Group). 2018. Review of particle physics. Phys Rev D
cosmic ray muon hodoscope on October 28, 2003. Geophys Res 98: 030,001. https://doi.org/10.1103/PhysRevD.98.030001, URL
Lett 32(3): L03S04 (1–4). https://doi.org/10.1029/2004GL021469, https://link.aps.org/doi/10.1103/PhysRevD.98.030001.
https://agupubs.onlinelibrary.wiley.com/doi/pdf/10.1029/ Wright AG. 2017. The photomultiplier handbook. Oxford University
2004GL021469, https://agupubs.onlinelibrary.wiley.com/doi/abs/ Press, Oxford. https://doi.org/10.1093/oso/9780199565092.001.0001,
10.1029/2004GL021469, https://agupubs.onlinelibrary.wiley.com/ URL https://cds.cern.ch/record/2258194.
action/showCitFormats?doi=10.1029%2F2004GL021469.
Cite this article as: Ayuso S, Blanco JJ, Tejedor JIG, Herrero RG, Vrublevskyy I, et al. 2021. MITO: a new directional muon telescope.
J. Space Weather Space Clim. 11, 13. https://doi.org/10.1051/swsc/2020079.
Page 16 of 16You can also read