PHYSICAL REVIEW ACCELERATORS AND BEAMS 24, 044001 (2021)
←
→
Page content transcription
If your browser does not render page correctly, please read the page content below
PHYSICAL REVIEW ACCELERATORS AND BEAMS 24, 044001 (2021)

                             Beam intensity effects in Fermilab Booster synchrotron
                                                                                                               *
                            Jeff Eldred , Valeri Lebedev , Kiyomi Seiya, and Vladimir Shiltsev
                     Fermi National Accelerator Laboratory, P.O. Box 500, MS339, Batavia, Illinois 60510,USA

                              (Received 22 December 2020; accepted 19 March 2021; published 5 April 2021)

                   Detrimental beam dynamics effects limit the performance of high-intensity rapid cycling synchrotrons
                (RCSs) such as the 8 GeV proton Fermilab Booster. Here we report the results of comprehensive
                experimental studies of various beam intensity dependent effects in the Booster. In the first part, we report
                the dependencies of the Booster beam intensity losses on the total number of protons per pulse and on key
                operational parameters, such as the machine tunes and chromaticities. Then we cross check two methods of
                the beam emittance measurements (the MultiWires proportional chambers and the ionization profile
                monitors). Finally, we used the intensity dependent emittance growth effects to analyze the ultimate
                performance of the machine in the present configuration, with the maximum space-charge tuneshift
                parameter ΔQSC ∼ 0.6, and after its injection energy is upgraded from 0.4 to 0.8 GeV.

                DOI: 10.1103/PhysRevAccelBeams.24.044001

                      I. INTRODUCTION                                   optics optimizations, etc.—see comprehensive analyses in
                                                                        Refs. [8–12]. Advanced beam instrumentation, analytical
   High-energy, high-intensity proton beams are widely
                                                                        methods and diagnostics [13–16], and experimental beam
used for a broad spectrum of scientific research, including
                                                                        studies are critical for adequate understanding of the beam
particle colliders, muon spectroscopy, crystallography of
                                                                        dynamics.
biological molecules, neutrino physics, and neutron scat-
                                                                           Here we present results of the experimental studies of
tering. Over the past four decades, the power of such beams
                                                                        high-intensity beam dynamics in the Fermilab 8 GeV
has increased by about 3 orders of magnitude with an
                                                                        proton Booster RCS, which were carried out as part of
average doubling time of about four years [1,2]. Growing
                                                                        the Summer 2019 Booster Studies program [17]. In Sec. II
demands of the physics research call for more powerful,
                                                                        we give a brief description of the accelerator. Next, Sec. III
more productive and more sophisticated proton acceler-
                                                                        is devoted to the beam loss diagnostics and measurements
ators. For example, at present, the leading accelerators for            of the machine transmission efficiency and its dependence
neutrino research are the rapid cycling synchrotron (RCS)               on the total number of protons per pulse, tunes and
facilities J-PARC in Japan, which has reached 515 kW of                 chromaticities. The beam emittance diagnostics and mea-
the 30 GeV proton beam power, and the Fermilab Main                     surements, including analysis of the intensity dependent
Injector, which delivers up to 800 kW of 120 GeV protons,               emittance growth, are presented in Sec. IV. Finally, we
while the physics needs call for the next generation, higher-           discuss general scaling laws and the ultimate performance
power, megawatt and multi-MW-class superbeam facili-                    of the machine now and after the upcoming upgrade
ties [3].                                                               in Sec. V.
   Further progress in the proton beam power requires
improvements in the accelerator technology [4] and
                                                                                 II. FNAL BOOSTER SYNCHROTRON
addressing problems related to desired beam pulse struc-
ture, beam losses, and the lifetimes of beam targets [5–7].                The complex of Fermilab proton accelerators includes a
Particularly challenging are issues associated with the beam            750 keV H− radiofrequency quadrupole (RFQ), 400 MeV
dynamics, such as space-charge effects, instabilities, emit-            H− pulsed normal-conducting rf linac, 8 GeV proton
tance growth, halo formation and losses, collimation,                   Booster synchrotron, 8 GeV Recycler storage ring that
accumulation of secondary charges, linear and nonlinear                 shares a tunnel with the 120 GeV proton Main Injector
                                                                        synchrotron, and a 3.1 GeV muon delivery ring [18,19].
                                                                        About 16 km of beam lines connect the accelerators and
  *
      shiltsev@fnal.gov                                                 bring the beams to fixed targets and experiments for high-
                                                                        energy particle physics research at the Intensity Frontier.
Published by the American Physical Society under the terms of           There are plans to further increase the facility power from
the Creative Commons Attribution 4.0 International license.
Further distribution of this work must maintain attribution to          the current world-leading level of ∼800 kW of average
the author(s) and the published article’s title, journal citation,      120 GeV beam power on the neutrino target to over
and DOI.                                                                1.2 MW at the start of the LBNF/DUNE experiment

2469-9888=21=24(4)=044001(15)                                    044001-1               Published by the American Physical Society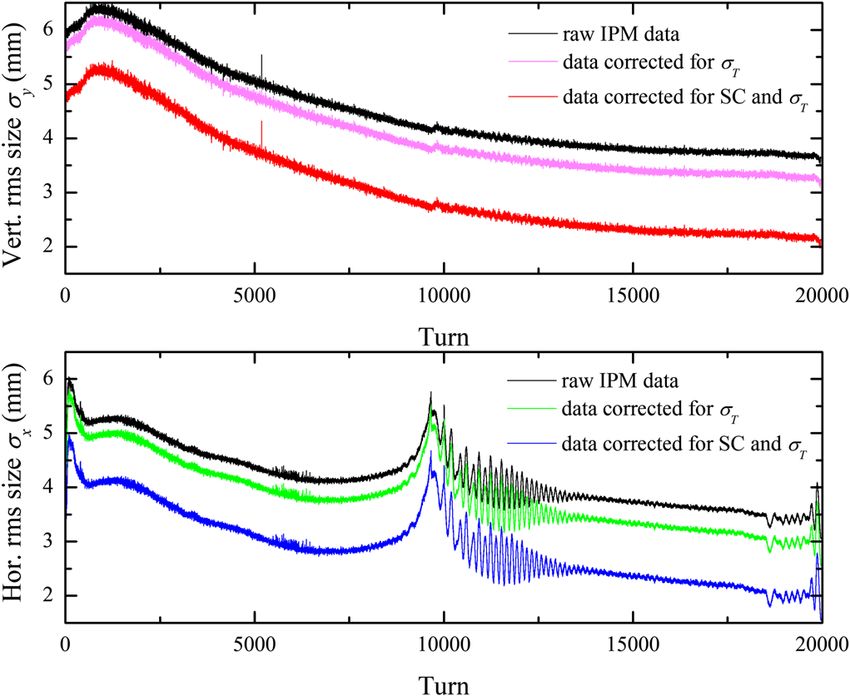
ELDRED, LEBEDEV, SEIYA, and SHILTSEV                                     PHYS. REV. ACCEL. BEAMS 24, 044001 (2021)

[20] in the second half of the 2020s via replacement of the
existing 400 MeV normal-conducting linac with a modern
cw-capable 800 MeV superconducting rf linear accelerator
(PIP-II, see [21]) and corresponding beam line for injection
into the Booster. There are also several concepts to further
double the beam power to > 2.4 MW after replacement of
the existing 8 GeV Booster synchrotron [22,23].
   The Fermilab Booster [24] is a 474.2 m circumference,
alternating-gradient, rapid-cycling synchrotron containing 96
combined-function magnets; see Fig. 1. Together with
capacitor banks, these magnets form a resonant network
(Q ¼ 40) and get excited with a 15-Hz biased sine wave.
Beam acceleration ramp from 0.4 GeVat injection to 8.0 GeV
at extraction is 33.3 ms long—half of the magnet cycle
period—and contains about 20,000 turns. Correspondingly,           FIG. 2. Booster ramp: kinetic energy (black), rf voltage (blue)
all the parameters of the machine and beam significantly vary      and frequency (red).
in the cycle from the currents in all correctors (trim dipoles,
trim quads and skew quads, sextupoles and octupoles) to rf         Correspondingly, the total injected and accelerated beam
frequency, voltage and phase (see Fig. 2), from the betatron       intensity N p scales with the linac current, which is typically
and synchrotron tunes and chromaticities to proton beam            ∼25 mA, and the total number of injection turns N turns ,
intensity, positions, sizes, emittances, bunch length and          approximately as N p ¼ 0.34 × 10¹² · N turns , e.g., about
energy spread, etc. The main parameters of the Booster are         4.8 × 10¹² for a typical 14-turn injection. The duration
given in Table I. Without going into details of the Booster        of the beam injection also scales with the number of turns
high-intensity operation and interface with other machines in      as 2.2 · N turns [μs]. The beam is injected with rf voltage
the complex, which can be found in Refs. [25–27], here we          close to zero and is then adiabatically captured over about
only briefly outline the main processes which occur at             300 μs by the rf system [30,31]. Right after injection and in
injection, transition crossing and extraction.                     the following several milliseconds, the high-intensity pro-
   The Booster receives 400 MeV H− beam of 201 MHz                 ton beam is subject to the strongest space-charge forces,
bunches from the linac while it is close to the minimum of         characterized by the space-charge parameter ΔQSC ≥ 0.5
the magnetic field ramp. H− particles are stripped of two          (see below). Transverse and longitudinal ring impedances
electrons when they pass through a thin foil, and resulting
protons are accumulated over many turns in the ring (the
                                                                   TABLE I. Main operational parameters of the Fermilab
scheme known as charge exchange injection [28,29]).                Booster. βp and γ p are relativistic Lorentz factors of protons.

                                                                   Parameter                                       Comments
                                                                   Circumference, C               474.20 m
                                                                   Injection energy               400 MeV         βp ¼ 0.701,
                                                                      (kinetic), Ei                                 γ p ¼ 1.426
                                                                   Extraction energy               8 GeV          βp ¼ 0.994,
                                                                      (kinetic), Ef                                 γ p ¼ 9.526
                                                                   Cycle time,                     1=15 s         20,000 turns
                                                                      T 0 ¼ 1=f 0
                                                                   Harmonic number                   84
                                                                   rf frequency, f rf              37.77–   injection-extraction
                                                                                                  52.81 MHz
                                                                   Maximum rf                     1.1 MV
                                                                     voltage, V rf
                                                                   Transition                     4.2 GeV       γ tr ¼ 5.478, at
                                                                     energy, Etr                                     t ¼ 17 ms
                                                                   No. of cells, magnets           24, 96      FOFDOOD, 96°/
                                                                                                                        cell
FIG. 1. Schematics of the Fermilab Booster synchrotron.            Total intensity, N p          4.5 × 10¹²    N b ¼ 81 bunches
Sectors, each consisting of four combined function magnets,        rms normalized emittance,      2.0π μm      12π μm for 95%
are numerated 1 to 24. Indicated are locations of the ionization     εx;y
profile monitors (IPMs), MultiWires (MWs) beam profile mon-        β functions, βx;y            33.7/20.5 m         maximum
itors in the 8 GeV proton transport line and the 400 MeV H−
                                                                   Dispersion function, Dx         3.2 m            maximum
beam injection line.

                                                             044001-2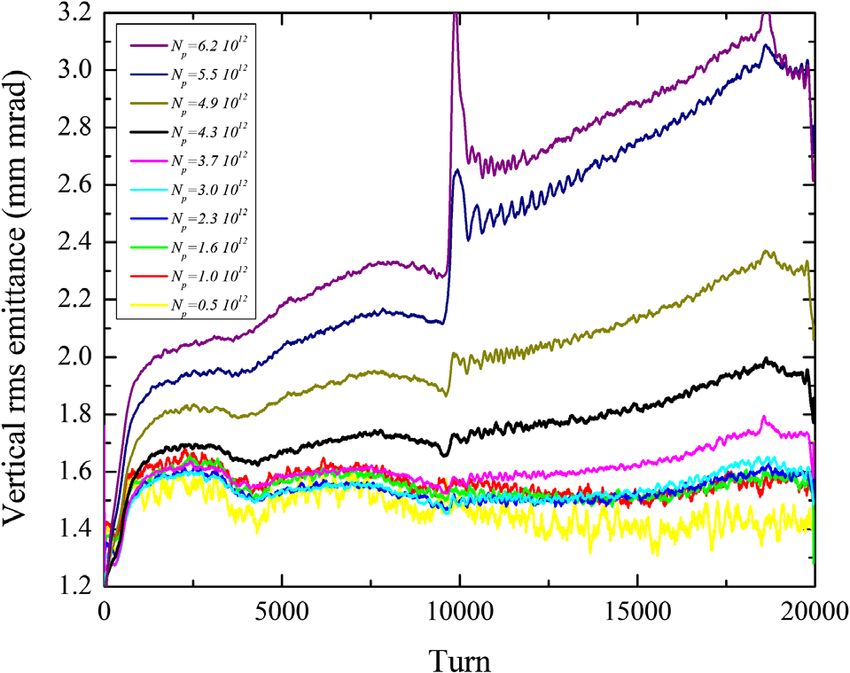
BEAM INTENSITY EFFECTS IN FERMILAB …                                       PHYS. REV. ACCEL. BEAMS 24, 044001 (2021)

FIG. 3. Measured Booster beam characteristics during the
acceleration cycle: (top) the horizontal (blue) and vertical (red)
betatron tunes Qx;y ; (bottom) the horizontal (blue) and vertical
(red) chromaticities Q0x;y .

are large [10,32,33] and the Booster operation requires
simultaneous, fast and idiosyncratic adjustment of orbits,
optical functions [34], tunes, chromaticities and many other
machine parameters on top of changing energy, rf voltage
and frequency (see Fig. 3).
   The transition occurs at about 17 ms into the Booster
                                                                     FIG. 4. Booster beam losses in the acceleration cycle: (top) the
cycle (after injection), at the beam energy of 4.2 GeV. The          BCHG0 intensity monitor signal (blue, left axis) and the S06
Booster is currently operated without a dedicated γ t -jump          beam loss monitor (BLM) readings (red, right axis) for nominal
system, though the current of trim quadrupoles, rf system            operational 14 turns injection intensity; (bottom) the same for
voltage and rf frequency curves have been tuned to                   higher intensity 19 turns injection.
minimize the losses and control the longitudinal emittance,
which grows somewhat from its initial 95% value of about
0.08 eVs [35–37].                                                    exposure and corresponds to either 13% beam loss at
   The rapid acceleration in the Booster requires large              injection energy or 1.2% at the transition, or 0.6% at
accelerating voltage. To inject the Booster beam efficiently         extraction for nominal intensity of about 4.5 × 10¹² protons
into the Recycler for slip stacking, it is desirable to rotate       per pulse. As illustrated in Fig. 4, at nominal intensity, with
the beam in longitudinal phase space so as to reduce the             14 turns injection, the losses mostly occur at injection, but
momentum spread [38]. The Booster bunch rotation is                  the loss at transition becomes dominant at higher inten-
performed via quadrupole excitation of the synchrotron               sities. In general, the beam loss induced radiation is the
oscillation as the rf voltage is modulated at twice the              most important and most challenging factor limiting the
synchrotron frequency, and this drives a longitudinal                performance of high-intensity RCSs [4].
quadrupole resonance. Once the beam energy is close to
the extraction energy, we perform snap bunch rotation - i.e.,                           III. BEAM LOSSES
at about 2 ms before the end of the cycle, the rf voltage is
increased slowly to 650 kV to increase the energy spread of                           A. Beam loss diagnostics
the bunches and then dropped down rapidly to 130 kV. This               The main diagnostic of the total circulating Booster
gives the required small energy spread for the beam for slip         beam intensity is the ACNET [39] (Fermilab global
stacking in the downstream accelerators.                             accelerator control system) channel B:CHG0, which uses
   The overall average Booster beam loss limit has been              the signal from the beam current toroid properly mixed and
administratively set to W ¼ 525 W, i.e., 35 J per cycle with         averaged with the rf waveform signal. The raw B:CHG0
15 Hz beam cycles. Such a level allows us to maintain all            toroid intensity data are quite reliable and accurate to better
elements in the Booster tunnel without excessive radiation           than a fraction of one percent at relatively stable machine

                                                               044001-3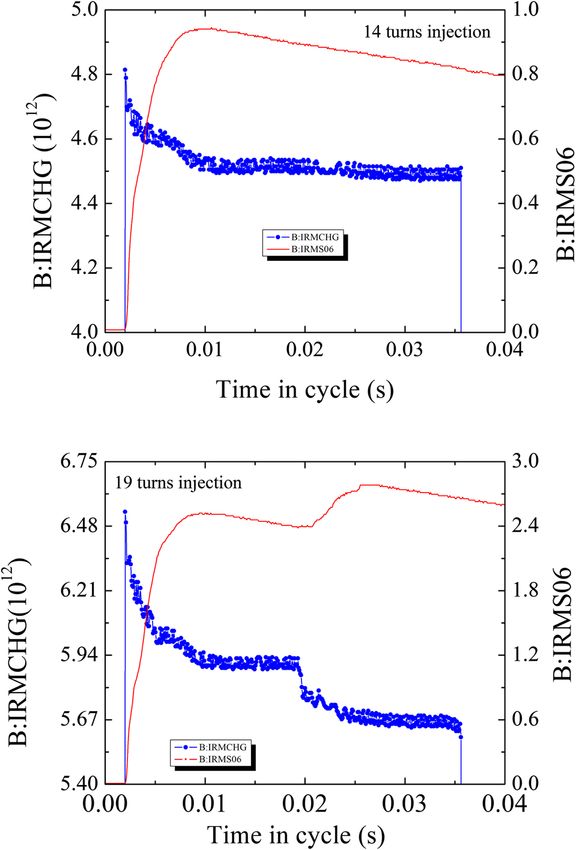
ELDRED, LEBEDEV, SEIYA, and SHILTSEV                                   PHYS. REV. ACCEL. BEAMS 24, 044001 (2021)

and beam parameters, but require correction of the sys-
tematic effects early in the cycle, when the rf frequency,
the bunch length and the bunch structure are quickly
changing in time. The required correction was established
using a cross calibration of the intensity loss ΔN p reported
by B:CHG0 and the power loss signal measured by the
most appropriate beam loss monitor BLMS06—see Fig. 4.
The BLM at S06 is located between two Booster collima-
tors, and in regular operation it registers the most signifi-
cant loss flux over the cycle. The BLM signal represents an
integral of a proportional chamber with decay time of            FIG. 5. Booster resistive wall monitor traces sampled every 1 ns
∼200 ms. This signal is reset at the beginning of each           (index j) for the bunch beam current profiles right before (dashed
cycle. As one can see, BLMS06 peaks for the first time at        blue) and 40 turns after (solid red) the extraction gap clearing.
10 ms into the cycle with the amplitude proportional to the
power loss integrated well over the initial lossy period of         The largest, and of the most operational concern,
the Booster cycle. The loss monitor signals at 10 ms were        intensity dependent losses which take place over the first
compared to the reported changes in the toroid signal B:         8 ms after the injection are presented in Fig. 6. As one can
CHG0, and it was found that the latter overestimates             see, the losses quickly grow with N p —solid line in Fig. 6 is
Oð5%Þ losses at small intensities by about 2%, but that          for the fit
difference disappears (mutual linearity gets restored) at
                                                                                                           3
higher intensities and higher fractional losses—see details                  ΔN p                     Np
in [40].                                                                          ¼ 0.01 þ 0.07 ·              :               ð1Þ
                                                                              Np                   7 × 10¹²
                 B. Fractional beam loss                         The nonzero intercept at small N p might indicate either a
   Our studies reveal three kinds of Booster beam intensity      different mechanism of constant losses at low intensity or
losses: (1) minor intensity-independent loss at injection        an insufficient measurement accuracy.
∼ð1–2Þ% due to the so-called “notch clearing”; (2) signifi-         The beam intensity losses at the transition crossing were
cant Oð5%Þ loss shortly after the injection that can be          found to be below ≲0.5% up to a threshold at about N p ¼
attributed to space-charge effects as it strongly depends on     6 × 10¹² and to then quickly reach 7% at N p ¼ 7 × 10¹²
the intensity, the working point tunes and chromaticities;       [40]. The characteristic dependence and underlying physics
and (3) thresholdlike increase of the losses Oð5%Þ during        mechanism is quite different from what is observed at the
and after the transition above N p ¼ 6 × 10¹² .                  injection. The intensity dependence at transition is most
   The notch clearing.—The Booster extraction kicker rise        likely related to the longitudinal beam loading and the
time is about 70 ns long, and to reduce the losses at            voltage induced by large longitudinal impedance of the
extraction one requires an empty gap in the beam structure.      Booster laminated vacuum chamber interior [32,36,42]. We
The beam gap is created by removing three out of 84              also have to note that, for optimal transmission efficiency,
possible bunches at the lowest feasible beam energies. First,    the transition crossing has to be retuned for higher
a recently built laser system [41] is used to create the notch
within a linac beam pulse immediately after the RFQ at
750 keV, where activation issues are absent. The beam with
such a gap is injected into the Booster. The laser notcher
system is not 100% efficient and, in addition, some
particles slip into the gap before the injection rf capture,
and as a result there is 400 MeV beam in the gap as
illustrated by Fig. 5. These particles are cleared out at
approximately 150 turns after the injection by a kicker
pulse that removes 1.4  0.4% of the total beam intensity.
The particles are directed to a special in-line beam dump
which intercepts them with an efficiency much better than
the efficiency of the collimation system, so these losses are
excluded from the following analysis of the intensity
dependent effects. Ongoing improvements to the laser
power and optical system are expected to greatly reduce          FIG. 6. Intensity-dependent fractional Booster beam intensity
the number of unwanted particles in the notch gap.               loss at injection vs total number of protons.

                                                           044001-4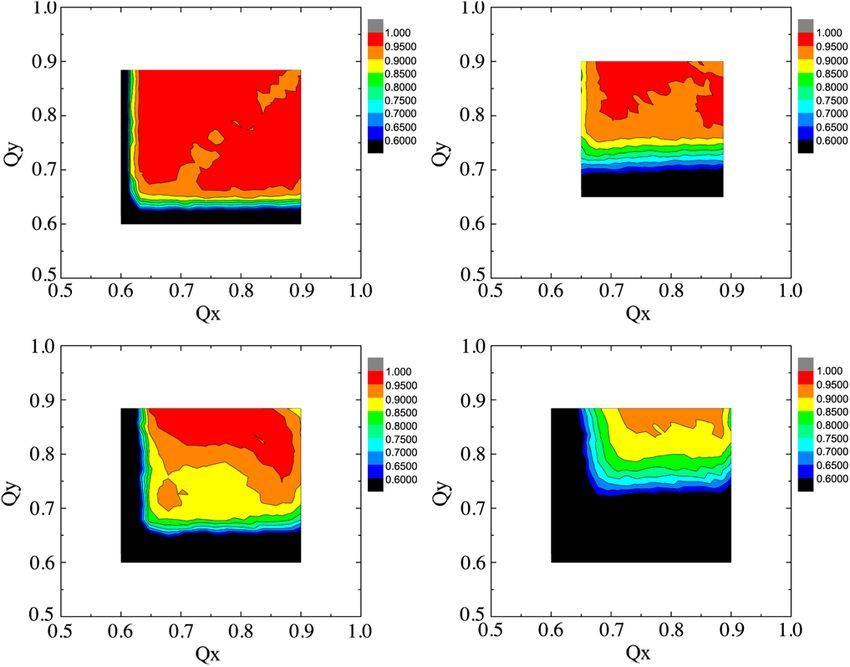
BEAM INTENSITY EFFECTS IN FERMILAB …                                      PHYS. REV. ACCEL. BEAMS 24, 044001 (2021)

intensities, while during our studies we operated with the         that depends on the intensity and is usually associated with
rf and other machine parameters at the transition optimized        the need to maintain the coherent beam stability.
for the nominal operational intensity of N p ¼ 4.5 × 10¹² .        Correspondingly, the low chromaticity operation is possible
   Altogether, in our study the fractional beam intensity          only at low intensities. Notably, the strong dependence of
losses over the entire Booster cycle are about 4.2  0.5%          the losses at injection on the chromaticity, presumably due
for the nominal intensity, while at the record high injected       to the space-charge effects, ΔN p ∝ Q02 , is similar to the
intensity N p ¼ 7 × 10¹² they are about 15%. Obviously,            incoherent beam losses due to parasitic beam-beam effects
such losses are not acceptable for routine operation within        observed in the Tevatron collider [43].
the administrative beam power loss limit.                              The tune scans were carried out under six different
                                                                   conditions: (i) low intensity and low chromaticity:
                       C. Tune scans                               N p ¼ 0.95 × 10¹² , Q0x;y ¼ −6=–6; (ii) low intensity and
   To better understand the nature of the intensity loss           high chromaticity: N p ¼ 0.95 × 10¹² , Q0x;y ¼ −20=–20;
phenomena, we have studied the Booster transmission                (iii) high intensity and medium chromaticity:
efficiency dependence on the chromaticities and tunes—             N p ¼ 4.3 × 10¹² , Q0x;y ¼ −16=–4; (iv) high intensity and
the Q0x;y and Qx;y scans. Figure 7 shows the dependence of         high chromaticity: N p ¼ 4.3 × 10¹² , Q0x;y ¼ −20=–20;
the losses over the first 1 ms of the Booster cycle (∼450          (v) medium intensity and medium chromaticity:
turns) at the nominal operational tunes Qx;y ¼ 6.78=6.88,          N p ¼ 2.6 × 10¹² , Q0x;y ¼ −12=–12; (vi) medium intensity
but at three different chromaticity settings - the nominal one     and high chromaticity: N p ¼ 2.6 × 10¹² , Q0x;y ¼ −20=–20.
Qx;y ¼ −16=–4, and then at Qx;y ¼ −12=–12, and at                  Note that vertical and horizontal tunes and chromaticities
Qx;y ¼ −20=–20. The fractional losses were calculated              varied only for the time period of 2 ms after the injection,
out of the B:CHG0 signal, corrected for the systematic             and for the rest of the Booster cycle they stayed the same as
error at lower intensities and with the extraction gap             they were for the routine operational cycles.
clearing loss subtracted, following the method presented               The results of the first four are presented in Fig. 8. One
in the preceding section.                                          can see that, in general, an increase of either the chroma-
   The results presented in Fig. 7 clearly show significant        ticity or intensity or both leads to reduction of the available
increase of the losses with the chromaticity. Taking for           tune space for low loss operation and generally lower
simplicity the same functional dependence on intensity as          optimal transmission efficiencies. Table II summarizes the
in Eq. (1), the chromatic dependence of the loss data is           findings.
consistent with                                                        The tune scan data reveal stronger sensitivity of the
                                    3  0 1.90.2               losses to the vertical tune than to the horizontal one. For
ΔN p                          Np         Qavg                      example, a 14-units increase of the chromaticity from −6 to
      ¼ 0.013 þ 0.10 ·            12
                                                      ;    ð2Þ
 Np                        7 × 10         10

with Qavg ¼ ðjQ0x j þ jQ0y jÞ=2 denoting the average chro-
maticity. There is a lower limit on operational chromaticity

                                                                   FIG. 8. Tune scans of the transmission efficiency over the first
                                                                   millisecond after injection: (a) (top left) at the N p ¼0.95×10¹² and
                                                                   Q0x;y ¼−6=–6; (b) (top right) N p ¼0.95×10¹² and Q0x;y ¼−20=–20;
FIG. 7. Transmission efficiency 1 ms after injection for differ-   (c) (bottom left) N p ¼4.3×10¹² and Q0x;y ¼−16=–4; (d) (bottom
ent chromaticities Q0x;y vs N p .                                  right) N p ¼4.3×10¹² and Q0x;y ¼−20=–20.

                                                             044001-5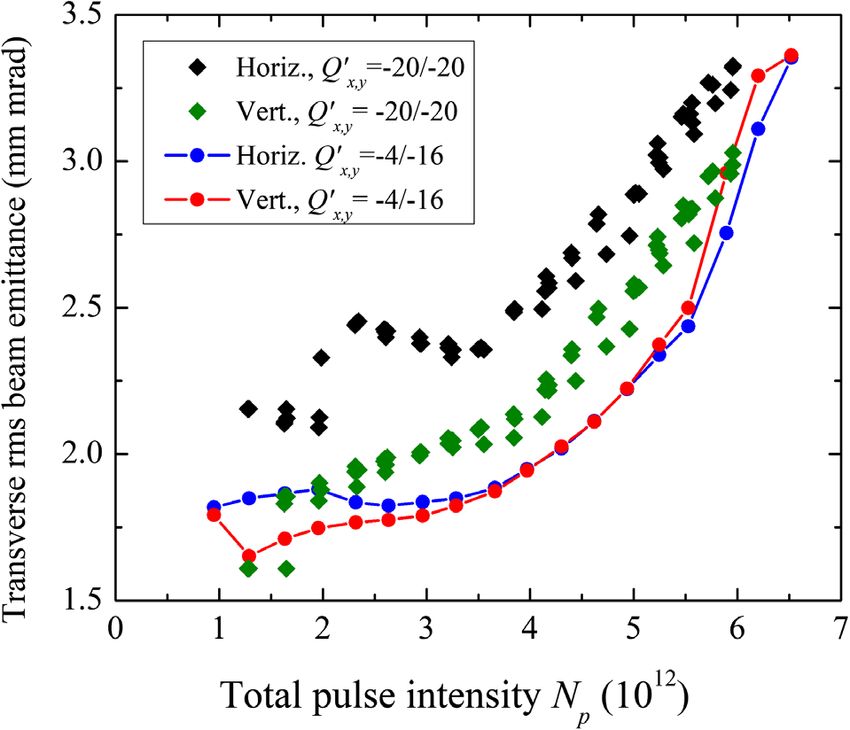
ELDRED, LEBEDEV, SEIYA, and SHILTSEV                                            PHYS. REV. ACCEL. BEAMS 24, 044001 (2021)

TABLE II. Optimal working points for various injected inten-
sities and injection chromaticities: the first line in each box is the
minimal intensity loss 1 ms after injection (raw B:CHG0 data,
uncorrected for the B:CHG0 systematic errors and the notcher
gap cleaning) and the optimal horizontal and vertical tunes
Qx =Qy ; the second line is the same for the entire Booster cycle
(at extraction).

N p ; 1012    Q0x;y ¼ −6=–6    Q0x;y ¼ −12=–12 Q0x;y ¼ −20=–20
0.95         1.5%, 0.68=0.84                   1.2%, 0.69=0.88
             3.5%, 0.82=0.81                   2.6%, 0.77=0.88
4.3                            3.0%, 0.74=0.87 7.0%, 0.77=0.88
                               7.0%, 0.80=0.90 16%, 0.77=0.88

−20 at N p ¼ 0.95 × 10¹² resulted in the reduction of the
90% transmission tune area by dQy ¼ 0.05 in the vertical
                                                                         FIG. 9. Comparison of the measured rms IPM vertical beam
plane and only dQx ¼ 0.02 in the horizontal plane; see
                                                                         sizes at extraction for different beam intensities with the rms sizes
Figs. 8(a) and 8(b). Similarly, the change of the chroma-                measured by the MWs and recalculated to the IPM location.
ticity from −12 to −20 for N p ¼ 4.3 × 10¹² led to
shrinkage of the 90% transmission tune area by dQy ¼
0.1 and dQx ¼ 0.05, as depicted in Figs. 8(c) and 8(d). That             keep the trajectories of the secondaries parallel to the
is indicative of a stronger resonance in the vertical than the           electric field.
horizontal.                                                                 Contrary to the MWs, the IPMs exhibit intrinsic depend-
                                                                         ence on the proton beam intensity as the proton space
                                                                         charge fields lead to transverse expansion of the cloud of
         IV. BEAM EMITTANCE EVOLUTION                                    ions on its way from its origin (in the proton beam) to the
                A. Beam emittance diagnostics                            IPM detector plate—see Fig. 9. A comprehensive theory of
                                                                         the IPM operation is developed in [45]. The rms size of the
   In the Booster, there are two types of instruments to
                                                                         measured profile in the IPM σ m is related to the original
measure beam sizes and, therefore, transverse emittances:
                                                                         proton beam size σ 0 as
the MultiWires (MWs) and the ionization profile moni-
tors (IPMs).
                                                                                          σ m ¼ σ 0 · hðN p ; σ 0 ; D; V; dÞ;             ð3Þ
   Vertical and horizontal MWs are installed in the extrac-
tion beam line and, therefore, can measure only the
                                                                         where the expansion factor h can be approximated as
emittances of the extracted Booster beam. There are 48
wires in each instrument, spaced by 1 mm. The focusing
                                                                                              2Γð1=4ÞUSC Dd1=2
optics functions at the MWs location are βx ¼ 16.2 m,                            h≈1þF                          ð1 þ tb =τ0 Þ:            ð4Þ
βy ¼ 25.9 m and Dx ¼ −1.65 m. Statistical rms error of                                             3Vσ 3=2
                                                                                                       0
the MWs emittance measurement is about 0.05 mm mrad.
   IPMs operate by collecting ions created after the ioniza-             Here V is the IPM extracting voltage (typically, 24 kV in
tion of residual vacuum molecules by high-energy charged                 our case) and D is its high voltage gap (103 mm), d is the
particle beams [14,16], which are then guided to a detector              distance for ions to travel from the beam orbit to the IPM
by a uniform external electric field Eext . The detector                 collection plate, the space-charge potential for the proton
consists of many thin parallel strips, whose individual                  beam with current I is USC ¼ 30½VI=βp and gamma
signals are registered to make the beam profile signal ready             function Γð1=4Þ ≈ 3.625. The numerical factor F is equal
for processing. Two IPMs vertical and horizontal are                     to 1 in the case of unbunched dc proton beam with
installed in the Booster at the location with βx ¼ 6.0 m,                Gaussian
                                                                          pffiffiffi        transverse current distribution, and F ¼
βy ¼ 20.3 m and Dx ¼ 1.8 m [44]. The electric field of                   2 2=Γð1=4Þ ≈ 0.78 for uniform distribution with radius
about 2.4 kV=cm is formed by application of V ¼ 24 kV                    a ¼ 2σ 0 . In the case of the Booster, with modest expansion
extracting voltage over a D ¼ 103 mm gap. The MCP-                       h ≤ 2, one can neglect minor corrections due to somewhat
based ion detector employs an array of parallel thin anode               unequal horizontal and vertical beam sizes, but should take
strips spaced 1.5 mm apart. IPMs are very fast and report                into account the correction factor ð1 þ tb =τ0 Þ due to the
the average rms beam sizes (determined by the Gaussian                   bunch structure of the Booster proton current. There, tb is
fits of the profiles) on every Booster turn. Note that the               the bunch spacing (about 19 ns at the end of the Booster
Booster IPMs do not employ external magnetic fields to                   cycle) and characteristic time for an ion to leave the beam

                                                                  044001-6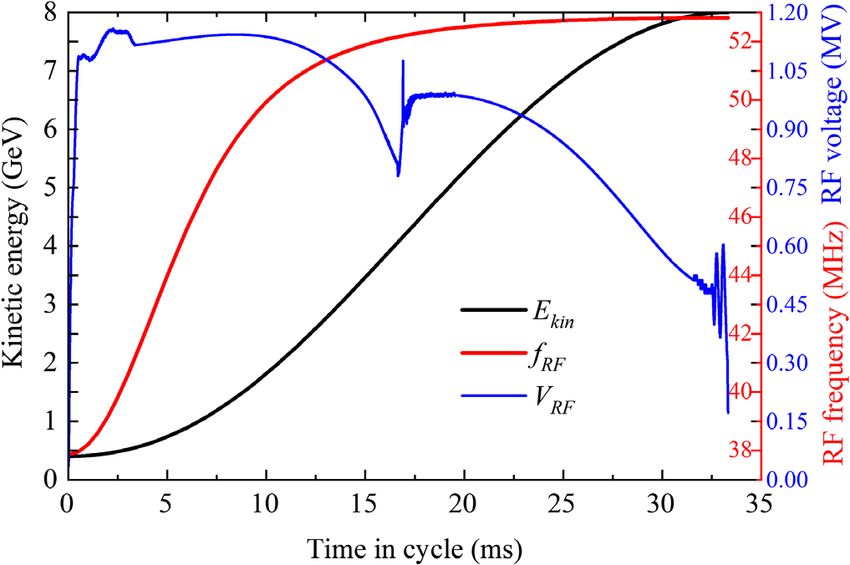
BEAM INTENSITY EFFECTS IN FERMILAB … PHYS. REV. ACCEL. BEAMS 24, 044001 (2021)
pffiffiffiffiffiffiffiffiffiffiffiffiffiffiffiffiffiffiffiffiffiffiffiffiffiffiffi
τ0 ¼ 2MDσ 0 =ZeV , where M and eZ are the ion’s mass
and charge, which is about 22 ns for typical IPM and beam
parameters at the end of the cycle.
Also very important are intensity independent effects
leading to the IPM profile smearing, such as the initial
velocities of the ions, finite separation between the indi-
vidual IPM charge collection strips, angular misalignment
of the IPM long and narrow strips with respect to the high-
energy proton beam orbit, etc. [45]. These effects are
monitor specific; they add in quadrature and can be
determined in comparison with the low intensity beam
sizes measured by the IPM and by the MWs σ 2T ¼ σ 2m;IPM −
σ 2m;MW at N p → 0. For the Booster IPMs, it was found that
such instrumental smearing is σ 2T ¼ 2.8 0.1 mm2 and
correspondingly modified Eq. (3) σ 2IPM ¼ σ 2T þ h2 σ 2MW
describes the Booster IPM data at extraction with some
5% accuracy [46].
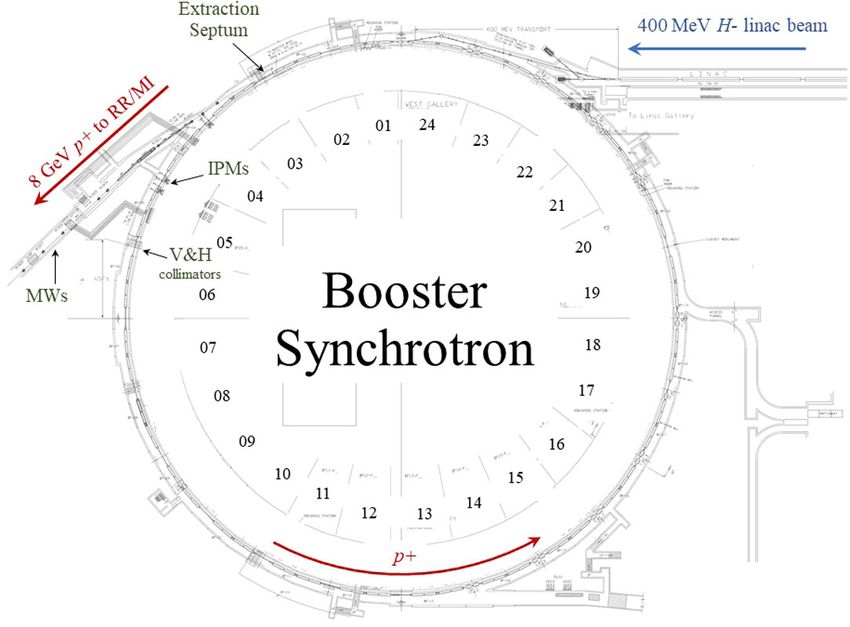
The original proton beam size σ 0 can be found from FIG. 10. An example of reconstruction of vertical (top plot) and
horizontal (bottom plot) rms proton beam sizes in the 33 ms (20
the measured and correspondingly corrected IPM value
qffiffiffiffiffiffiffiffiffiffiffiffiffiffiffiffiffiffiffiffiffiffiffi 000 turns) acceleration cycle of the Fermilab 8 GeV Booster
of σ ¼ σ 2m;IPM − σ 2T by reversing the equation σ ¼ synchrotron with the total beam intensity of N p ¼ 4.6 × 10¹² :
time dependence of the original IPM data σ 2m;IPM , the data
σ 0 ð1 þ cN p =σ 3=2
0 Þ, where c is deducted from Eqs. (3) corrected for smearing effects σ and the same data after addi-
and (4), if other parameters, such as σ T ; N p ; d and the tional correction for the space-charge expansion σ 0 with param-
IPM voltage V and gap D, are known. A simple practical eters D ¼ 103 mm, d ¼ 52 mm, V ¼ 24 kV—see text and
algorithm gives better than 5% approximation over the Eqs. (4) and (5).
entire range of the Booster beam intensities:
frequency after the transition. Such oscillations arise from
σ the mismatch between longitudinal focusing of bunch
σ0 ≈ 3=2
: ð5Þ
ð1 þ cN p =σ Þð1 þ αc2 N 2p =σ 2 Þ fields before and after transition, and the effect gets bigger
with intensity. Horizontal IPM is located at small beta
For the highest beam intensity in our studies, function and high dispersion, so, compared to the betatron
N p ¼ 6 × 10¹² , the factor cN p ¼ 2.53 mm3=2 and the size,
p the dispersive contribution is large Dx ðδp=pÞ ≥
ffiffiffiffiffiffiffiffiffiffiffiffiffiffiffiffiffiffiffiffiffiffiffiffi
fitting coefficient α ≈ 0.4 [46]. Equation (5) can now be εx βx =ðβp γ p Þ and variations in the momentum spread
used to find the proton beam size over the entire Booster ðδp=pÞ result in about 20% oscillations in σ x . The
cycle, i.e., not just for the values measured at extractions. Booster is well decoupled and, consequently, the vertical
For example, the black lines in Fig. 10 represent the raw
(uncorrected) rms vertical and horizontal beam sizes σ m;IPM
as measured by the IPM at each of 20 000 turns of the
Booster acceleration cycle. The pink and green lines
represent the beam sizes σ corrected for the intensity
independent smearing σ T . The true proton rms beam sizes
σ 0 reconstructed following the above algorithm [Eq. (5)]
are represented by the red and blue lines. One can see that
the overall beam size correction is about 10%–15% early in
the Booster acceleration cycle when the rms beam size is
about 5 mm. At the end of the cycle, with proton energy
increased from 400 MeV to 8 GeV, the proton beam size is
almost a factor of about 1.8 smaller than it appears in the
IPM and accounting for the space-charge expansion
hðN p ; D; V; dÞ is the most important. The reconstructed
beam sizes σ 0 at the end of the acceleration cycle match the
extracted beam size measured by the MWs well.
As can be seen in Fig. 10, the horizontal rms beam size FIG. 11. Booster bunching factor over the accelerator ramp
exhibits significant oscillations with twice the synchrotron (ratio of the peak to average proton beam current).
044001-7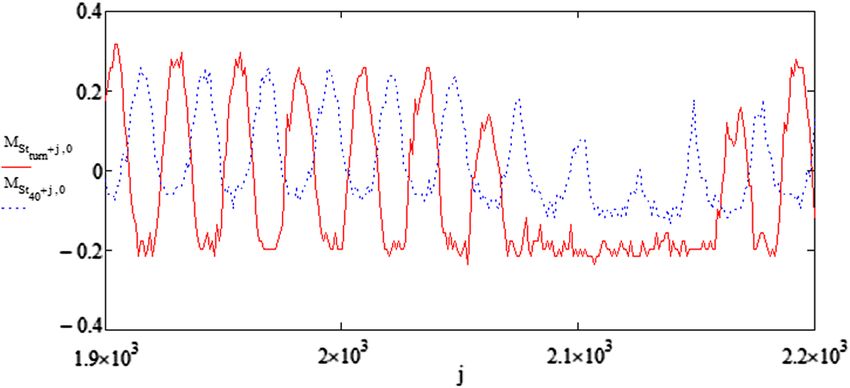
ELDRED, LEBEDEV, SEIYA, and SHILTSEV                                     PHYS. REV. ACCEL. BEAMS 24, 044001 (2021)

dispersion is small. Therefore a little perturbation observed
at transition is most probably due to reaction of the IPM
profile expansion
               pffiffiffiffiffiffi factor h to variation of the bunching
factor Bf ¼ 2π βp c=frf σ s —the ratio of the peak to
average proton beam current—which peaks at the transi-
tion—see Fig. 11. The effect is small but becomes more
pronounced at higher intensities [45].

             B. Beam emittance vs intensity
   The injected Linac H− beam comes with the rms
normalized transverse emittances ε ∼ 1  0.2π mm mrad
[47]. Due to small injection errors, optics mismatch and
multiple scattering in the foil, the initial emittance of the
proton beam circulating in the Booster gets to about
∼1.2  0.2π mm mrad. The latter effect correlates with
the total beam intensity. Indeed, in the process of multiturn
charge exchange injection, each passage of the stripping          FIG. 12. Booster beam emittance measured by MWs at
foil leads to the emittance growth of                             extraction vs the total proton intensity.

               βx;y l 13.6 MeV 2                                     The IPM rms beam sizes σ 0;x;y ðtÞ measured over the
Δεx;y ≈ βp γ p                   ½1 þ 0.0038 ln ðl=X0 Þ:
                2 X0    βp pc                                     Booster acceleration cycle from injection to extrac-
                                                            ð6Þ   tion and properly corrected following the analysis of prece-
                                                                  ding Sec. IVA and Eq. (5) can be used for the emit-
For the Booster carbon foil thickness l ¼ 380 μg=cm2 ,            tance calculations εy ¼ ðβp γ p Þσ 20;y =βy , εx ¼ ðβp γ p Þ½σ 20;y −
radiation length X0 ¼ 42.7 g=cm2 and momentum p ¼                 D2x ðδp=pÞ2 =βx , where δp=p is the rms energy spread. Of
953 MeV=c that gives 0.0032π mm mrad per turn in the              course, all the factors are now time dependant: the
horizontal plane and 0.011π mm mrad per turn in the               relativistic factors βp ðtÞ and γ p ðtÞ are well known—see,
vertical plane. During the injection, the beam moves across       e.g., Fig. 2; the beta functions βx;y at the IPM locations vary
and off the foil, so the effective number of turns is about       in the cycle within ∼10%. Calculations of Booster emit-
ðN turns þ 29Þ=2 turns [48]. Given that the total circulating     tance taking all these effects into account agree with the
beam intensity N p scales linearly with N turns , the estimated   MWs data at extraction to within 10% and exhibit no
emittance increase at the end of injection grows with the         emittance growth at the lowest intensities—see [46].
intensity and for the nominal N turns ¼ 14 turns injection
Δεy;foil ≈ 0.24π mm mrad and Δεx;foil ≈ 0.07π mm mrad.
   Measured Booster beam emittances at extraction exhibit
strong dependence on the total proton intensity N p, as
shown in Fig. 12. The MWs data taken at the nominal
operational chromaticities at injection Qx;y ¼ −16=–4
show strong dependence on the beam intensity and for
both planes can be approximated as
                                                40.3
                                        Np
     εextr ½π mm mrad ≈ 1.7 þ 2.1 ·                      : ð7Þ
                                     7 × 10¹²

   The emittance growth is strongly dependent on the
chromaticity, too, and at the nominal intensity N p ¼ 4.5 ×
1012 the emittance increases from about 2.1π mm mrad to
some 2.4π mm mrad (vertical) and 2.7π mm mrad (hori-
zontal) if the operational chromaticity at the first ms after
the injection is changed from Qx;y ¼ −16=–4 to −20=–20.           FIG. 13. Evolution of the IPM vertical emittance in the Booster
The beam emittance increase with intensity and chroma-            cycle at different intensities N p from 0.5 × 10¹² (2 turns
ticity strongly correlates with the intensity losses—see          injection) to 6.2 × 10¹² (20 turns injection). All the data are
Eqs. (1) and (2) and Figs. 6 and 7.                               smoothed by a 100 turn running window averaging.

                                                            044001-8
BEAM INTENSITY EFFECTS IN FERMILAB … PHYS. REV. ACCEL. BEAMS 24, 044001 (2021)
The resulting Booster IPM vertical beam emittance The most dominant are the first two effects. Figure 14
evolution over the acceleration cycle is shown in Fig. 13 shows how they depend on the beam intensity. The fast rms
for a wide range of intensities N p from 0.5 × 10¹² (2 turns vertical emittance growth over the first 3000 turns is most
injection) to 6.2 × 10¹² (20 turns). For example, the probably due to record strong proton space-charge effects
emittance εy ðtÞ at the operational intensity of N p ¼ 4.3 × (see below) and scales approximately as
1012 is shown in the black line in Fig. 13. Shortly after 2
injection it is about 1.3 0.1 mm mrad and evolves to Np
Δεy;3000 ½π mm mrad ≈ 0.17 þ 0.61 · : ð8Þ
1.9 0.1 mm mrad at extraction in good agreement with 7 × 10¹²
the MWs emittance data shown in Fig. 12. In general, one
can see that up to about N p ¼ 3.7 × 10¹² (12 turns
injection, pink line) the emittance is not growing much Slow emittance increase is roughly linear in time over the
in the cycle and is about 1.4–1.6 mm mrad. Above that next 16 000 turns and gets as big as 1 mm mrad, or 30% of
intensity the emittance evolution exhibits several features: the emittance, at N p ¼ 6.2 × 10¹² and can be approxi-
(i) fast growth over the first 2000–3000 turns; (ii) steady mated as
growth for the rest of the cycle; (iii) spikes at the time of 4
Np
transition and minor oscillations afterwards; and (iv) 5%– Δεy;3000–19000 ½π mm mrad ≈ 1.85 · : ð9Þ
10% variations at the end of the cycle. The last two effects 7 × 10¹²
are presumably instrumental. Significant variation of the
bunching factor at the transition shown in Fig. 11 does The nature of that effect might be related to the multi-
affect the IPM profile expansion h; see Eq. (4). At the end pacting of electrons in the beam and/or beam-induced
of the acceleration cycle, the proton beam position in the vacuum activity, but that still needs to be confirmed [49].
IPMs varies over the last 2000 turns by as much as 6 mm in
the horizontal plane, thus affecting the IPM profile expan- C. Space-charge tune shift
sion factor hy in the vertical plane that scales with the Space-charge tuneshift parameter ΔQSC is a commonly
distance from the beam orbit to the IPM collection plate as used figure of merit for beam dynamics. It is equal to [4]
d1=2
x;y —see Eq. (4), while bunch rotation in longitudinal
phase-space prior to the extraction at the very last hundreds N p rp Bf
ΔQSC ¼ R; ð10Þ
of turns results in a smaller momentum spread and longer 4πεβp γ 2p
bunches—again, leading to minor variation of the IPM
expansion factor h. where N p is the total intensity, assuming that the bunches
fill all rf buckets, rp is the classical proton radius, Bf is the
bunching factor (the ratio of the peak to average bunch
current), ε is the normalized rms beam emittance, and βp
and γ p are relativistic Lorentz factors. Factor R ≲ 1
accounts for unequal average beam size ratio around the
ring and, e.g., for the vertical plane it is equal to
h2=ð1 þ σ x =σ y Þi. The tuneshift is negative, but we omit
the minus sign for simplicity. In operational circular rapid
cycling accelerators, the space-charge parameter usually
does not exceed 0.3–0.5 to avoid beam losses [4,50,51].
Figure 15 shows the vertical SC tuneshift parameter
ΔQSC ðtÞ calculated for the Fermilab Booster acceleration
cycle on a base of measured N p ðtÞ; εy ðtÞ; Bf ðtÞ and known
βp ðtÞ and γ p ðtÞ. One can see that the calculated space-
charge parameter quickly grows after the injection due to
fast bunching early in the acceleration cycle, then falls
down due to acceleration and emittance increase, and
exhibits some temporary increase at the transition before
FIG. 14. Vertical rms emittance growth vs N p : (red circles) over
ending at ∼0.01 prior to extraction. The maximum Booster
the first 3000 turns; (black squares) from 3000 to 19000 turns.
The data points are calculated for the IPM emittance values tuneshift parameter peaks at about 1 ms after injection to
averaged over 500 turns 0–500, 3000–3500, 19000–19500. The ΔQSC ≃ 0.65 and stays above 0.3 until about 6 ms (∼3000
error bars indicate estimated statistical uncertainty. Red and black turns). Naturally, the corresponding incoherent space-
solid line are for the approximations Eqs. (8) and (9), respec- charge tune spread does not easily fit the available
tively. tune space between most dangerous resonances, such as
044001-9ELDRED, LEBEDEV, SEIYA, and SHILTSEV PHYS. REV. ACCEL. BEAMS 24, 044001 (2021)
driven vertical beam size expansion that leads to the flux of
protons on the collimator-limited machine aperture with
characteristic acceptance Ay ≃ 20–25½π mm mrad [46].
Both the fractional beam loss [Eqs. (1) and (2)] and the
emittance growth [Eq. (8)] highly nonlinearly depend on
the total circulating beam intensity N p.
Beam losses at and after the transition crossing, while
small under conditions of optimal operational tune up to the
nominal intensity N p ¼ 4.6 × 10¹², exhibit a thresholdlike
behavior above 6 × 10¹² . IPM measurements indicate small
vertical beam size at the transition while the horizontal size,
dominated by the dispersive contribution Dx ðδp=pÞ,
becomes very large, so it is natural to assume that the proton
losses at the transition end up at the horizontal aperture.
Booster is a lynch pin of the Fermilab proton accelerator
complex, and its transmission efficiency has been the
subject of continuous monitoring and several studies for
FIG. 15. Calculated vertical space-charge tuneshift parameter
for the Booster cycle with N p ¼ 4.6 × 10¹² . (The shaded area
almost four decades—see, e.g. [59,83,84]. Naturally, the
indicates 10% uncertainty, mostly due to the IPM emittance Booster performance at present significantly exceeds that
calculations.) of the past—compare current transmission of ∼95% at
N p ¼ ð4.5–5Þ × 1012 with that of ∼ð70–75Þ% at N p ¼
ð3.5 − 4Þ × 1012 in 1980s and 1990s. What makes this
half-integer ones, and that results in strong resonant
work distinct is that for the first time we have performed a
excitation of the proton dynamics and eventual particle
simultaneous comprehensive analysis of the proton loss
losses at the machine aperture. At the highest beam
dependence on the total beam intensity, machine tunes and
intensity studied, N p ¼ 6.2 × 10¹² , the maximum space- chromaticities, and, also, performed a cross calibration of
charge tuneshift parameter ΔQSC peaks at ≃0.75. the toroid intensity monitor and the beam loss monitors.
Nonlinear dependence of the extracted Booster beam
V. SUMMARY, DISCUSSION emittance on N p was reported in many previous measure-
Detrimental effects in high-intensity, high-brightness ments with MultiWires profile monitors—see, e.g.,
beams impose serious limitations on the performance of [83,85,86]. The Booster ionization profile monitors oper-
proton and ion RCSs [4,51] and were the subject of ating in the ion collection mode without external magnetic
operational optimizations and dedicated experimental stud- field are known to be extremely valuable tools for fast beam
ies at the CERN PS and PS Booster accelerators [52–57], size diagnostics of the circulating beam during acceleration
BNL’s AGS and its booster [58], Fermilab Booster [15,59], [44,87,88]. At the same time, strong space-charge forces of
ISIS at RAL [60,61], SIS18 at GSI [62], J-PARC RCS and the high-intensity proton beam might lead to significant, by
main ring [63–65], CSNS/RCS in China [66], and other a factor of 2 or more, expansion of the rms beam size
machines. Beam losses and emittance growth are usually a reported by the IPMs compared to the original proton beam
result of a complex interpla of factors which might include size [45]. To be certain that we properly account for that
space-charge effects and coherent instabilities (dipole and and other, intensity-independent, effects, we have per-
higher order ones) in transverse and longitudinal planes, formed a systematic calibration of the IPM with the
machine working points and chromaticities, focusing lattice MultiWires measurements as described in Sec. IVA. As
type, symmetry, nonlinearities and errors, type and loca- a result, we have achieved Oð10Þ% accuracy in the beam
tions of the rf accelerating systems, physical aperture and emittance reconstruction using the measured beam inten-
collimation system parameters, crossing transition energy sity N p and IPM rms beam sizes, experimentally deter-
methods and speed of acceleration, etc. Experimental mined intensity-independent instrumental dispersion σ T ,
measurements provide critical data for benchmarking and the IPM parameters such as extracting electric field
and further in-depth theoretical studies and numerical Eext ¼ V 0 =D and the distance d from the beam orbit to the
simulations, see, e.g., Refs. [12,67–82]. IPM detector.
The phenomena of the Fermilab Booster beam intensity Our data indicate the existence of two phenomena
losses, transverse emittance growth and longitudinal beam leading to the proton beam emittance growth: (i) the
excitation at the transition are found to be very much space-charge driven expansion over the first few thousand
intensity dependent and strongly interconnected. Our turns; and (ii) steady emittance increase over the rest of the
experimental studies indicate that the losses that occur acceleration cycle. Both effects grow faster than linearly
early in the cycle are most probably due to the space-charge with the proton beam intensity, resulting in the final
044001-10BEAM INTENSITY EFFECTS IN FERMILAB … PHYS. REV. ACCEL. BEAMS 24, 044001 (2021)
(extracted) beam emittance having a significant component following Eq. (1), consider the case when the space-charge
∝ N 4p —see Eq. (7), which also depends on the machine induced losses grow with the space-charge tuneshift
chromaticity at the injection energy. An attempt at a similar ΔQSC as
analysis of the Booster IPM profiles has been undertaken in
[15]. It was based on the phenomenological approxima- ΔN p
∝ αΔQκSC ; ð12Þ
tions for the IPM profile space-charge induced expansion Np
effects developed in [88], and reported space-charge driven
emittance growth early in the cycle was found to be where α is a machine dependent constant and the exponent
(a) significantly (3–4 times) bigger than reported here; κ is about 3. Though such scaling is empirical and perhaps
and (b) scaling approximately linear with intensity ∝ N p. specific to the Booster operational conditions until further
These observations also show improbably large normalized proof of its underlying beam dynamics mechanisms via
rms emittances of high-intensity beams prior to extraction theoretical analysis and numerical modeling, it can be used
∼10½π mm mrad, thus directly contradicting our Multi- for preliminary evaluation of the relative importance of the
Wire measurements and what we know about the Booster main operationally available opportunities for the machine
acceptance; this makes us suspect a systematic error in the performance improvements. From Eqs. (11) and (12) one
IPM data analysis. Notably, the steady emittance increase gets the maximum operational intensity within the loss
during the acceleration cycle was observed, too, though power limit W:
again, it was more than twice of what we report here
in Eq. (9). 1 κ 2κ−1=2
W κþ1 ε κþ1 γ pκþ1
Our experimental studies of the Booster losses and N max
p ∝ 1 : ð13Þ
1−η Bf ðαf 0 Þκþ1
emittance evolution are of great importance to predict
the machine operational conditions in the era of the
From that, one can see that there are several paths to the
upcoming new 800 MeV injector (PIP-II) and have to be
continued. These studies and the future operation of the increase of the maximum intensity [18], but none leads to
Booster with up to 50% higher beam intensities would direct one-to-one increase of N max p . Assuming κ ¼ 3,
greatly benefit from improved accuracy of the fast beam Eq. (13) anticipates that a threefold improvement in
intensity diagnostics and of the IPM emittance analysis. collimation system efficiency (e.g., from η ¼ 0.55 to
The losses at transition are believed to result from com- 0.85) [91] leads to a 31=4 increase in N maxp , or 32%. For
plicated 3D dynamics, including transverse and longi- the twofold increase in Booster injection energy Ek from
tudinal coherent instabilities. Future investigations of the 400 to 800 MeV with a new PIP-II linac [21], Eq. (13)
dependence on the rf voltage, chromaticities, tunes and predicts that one should be able to safely increase N max
p by
other machine parameters will help to better identify the 41% from the current operational value, except the increase
transition loss origin. ESME [89] and BLonD [90] simu- in cycle rate f 0 from 15 to 20 Hz under the same plan will
lations are also under way to study the impact of γ t jumps cut the expected benefit to just 31%. Equation (13)
on transition in the PIP-II era. indicates that the two aforementioned improvements com-
The strong intensity dependence of the space-charge bined should safely allow the PIP-II project goal of 44%
induced losses in the first few thousands of turns after the Booster intensity increase from 4.5 × 10¹² to 6.5 × 10¹²
injection is also of concern. Indeed, let us consider an RCS protons per pulse.
accelerator, like the Fermilab Booster, operationally limited More broadly, Eq. (13) evaluates strategies for improv-
by the uncontrolled
R radiation level in accelerator enclosures ing intensity in other high-intensity rings. Flattening the
at W ¼ f 0 Ek dN p (here f 0 is the cycle rate and Ek is the longitudinal bunch current profile, e.g., by using additional
kinetic energy of the lost particle)—typically it is about second or third harmonics rf systems, leads to reduction of
1 W per meter of machine circumference. Under such a the bunching factor, and the factor of 2 smaller Bf could
limit, the tolerable fractional beam intensity loss is lead to 1.68 times higher maximum intensity. Acceleration
of twice larger emittance beams would give about the same
ΔN p W effect, but it is usually not possible within the available
¼ ; ð11Þ
Np ð1 − ηÞN p Ek f 0 machine aperture of existing machines. At ultimate inten-
sities, significant promise in loss reduction lies in improved
where η is the efficiency of the collimation system that beam dynamics that would make α and κ smaller, for
directs the losses into dedicated beam absorbers or dumps. example by injection painting to make the space-charge
Obviously, the losses should get smaller with the increase forces more uniform, by compensation of the most detri-
of beam intensity, energy and power. Instead, many beam mental resonant driving terms (including enforcement of
physics phenomena, such as, e.g., repelling forces of the perfect periodicity in machine focusing optics), by space-
proton beam’s own space charge, lead to increase of beam charge compensation using electron lenses [92], or by
sizes and particle losses at higher beam intensities. Let us, implementation of the nonlinear integrable optics [93].
044001-11ELDRED, LEBEDEV, SEIYA, and SHILTSEV PHYS. REV. ACCEL. BEAMS 24, 044001 (2021)
For the latter two topics in particular, an R&D program is preliminary analysis of the online results, Phys. Rev. Accel.
under way at the Fermilab IOTA facility [94]. Beams 22, 123001 (2019).
Our studies of the beam intensity dependent effects in the [8] A. W. Chao, Physics of Collective Beam Instabilities in
Fermilab Booster provide a rich experimental dataset for High Energy Accelerators (Wiley, New York, 1993).
[9] N. Diskansky and D. Pestrikov, The Physics of Intense
benchmarking numerical simulation codes used to explain
Beams and Storage Rings (AIP Press, Woodbury, NY,
observed phenomena in existing high-intensity, high
USA, 1997).
brightness proton accelerators at Fermilab and to predict [10] K.-Y. Ng, Physics of Intensity Dependent Beam Instabil-
operational performance of their upgrades and future rapid ities (World Scientific, Singapore, 2006).
cycling synchrotrons. [11] M. Reiser, Theory and Design of Charged Particle Beams
(John Wiley and Sons, New York, 2008).
ACKNOWLEDGMENTS [12] I. Hofmann, Space Charge Physics for Particle Acceler-
ators (Springer, New York, 2017).
We would like to thank C. Y. Tan, C. Bhat, Yu. Alexahin, [13] M. Minty and F. Zimmermann, Measurement and Control
A. Burov, W. Pellico, R. Thurman-Keup, S. Nagaitsev and of Charged Particle Beams (Springer-Verlag, Berlin-Hei-
R. Baartman for numerous discussions on the topics of this delberg-New York, 2003).
study and S. Chaurize, V. Kapin and K. Triplett for their [14] P. Strehl, Beam Instrumentation and Diagnostics
invaluable help with experimental Booster beam studies. In (Springer, New York, 2006), Vol. 120.
[15] X. Huang, S. Lee, K. Ng, and Y. Su, Emittance measure-
addition, the Summer 2019 Booster beam study campaign
ment and modeling for the Fermilab Booster, Phys. Rev.
involved N. Eddy, C. Jensen, J. Larson, and H. Pfeffer of
ST Accel. Beams 9, 014202 (2006).
Fermilab, H. Bartosik, N. Biancacci, M. Carla, A. Saa [16] K. Wittenburg, Specific instrumentation and diagnostics
Hernandez, A. Huschauer, F. Schmidt of CERN, for high-intensity hadron beams, arXiv:1303.6767.
D. Bruhwiler, J. Edelen of the Radiasoft SBIR company [17] J. Eldred, Physics studies for high intensity proton beams at
and V. Kornilov of GSI. We greatly appreciate their fruitful the Fermilab Booster, in Proceedings of NAPAC’19,
cooperation and the spirit of international beam physics Lansing, MI, 2019 (JACoW, Geneva, Switzerland, 2019).
collaboration. We also would like to thank V. Higgins for [18] V. Shiltsev, Fermilab proton accelerator complex status and
carefully reading through the manuscript and helpful improvement plans, Mod. Phys. Lett. A 32, 1730012 (2017).
feedback. This manuscript has been authored by Fermi [19] M. Convery, M. Lindgren, S. Nagaitsev, and V. Shiltsev,
Research Alliance, LLC under Contract No. DE-AC02- Fermilab accelerator complex: Status and improvement
07CH11359 with the U.S. Department of Energy, Office of plans, Technical Report No. FERMILAB-TM-2693, Fer-
milab, 2018.
Science, Office of High Energy Physics.
[20] R. Acciarri et al., Long-baseline neutrino facility (LBNF)
and deep underground neutrino experiment (DUNE) con-
ceptual design report volume 1: The LBNF and DUNE
projects, arXiv:1601.05471.
[1] V. Shiltsev, On performance of high energy particle [21] V. Lebedev et al., The PIP-II conceptual design report,
colliders and other complex scientific systems, Mod. Phys. Report No. FERMILAB-TM-2649-AD-APC, Fermilab,
Lett. A 26, 761 (2011). Batavia, 2017.
[2] V. Shiltsev, Particle beams behind physics discoveries, [22] J. Eldred, V. Lebedev, and A. Valishev, Rapid-cycling
Phys. Today 73, 32 (2020). synchrotron for multi-megawatt proton facility at Fermilab,
[3] V. Shiltsev, Superbeams and neutrino factories - two paths J. Instrum. 14, P07021 (2019).
to intense accelerator-based neutrino beams, Mod. Phys. [23] J. Eldred et al., Versatile multi-MW proton facility
Lett. A, 2030005 (2020). with synchrotron upgrade of Fermilab proton complex,
[4] J. Wei, Synchrotrons and accumulators for high-intensity in Snowmass 2021 Letters of Interest (APS DPF, 2020),
proton beams, Rev. Mod. Phys. 75, 1383 (2003). https://www.snowmass21.org/docs/files/summaries/AF/
[5] R. Zwaska et al., Multi-MW targets for next-generation SNOWMASS21-AF2_AF0-NF0_NF9_Jeffrey_Eldred-
accelerators, in Proceedings of the International Particle 092.pdf.
Accelerator Conference (IPAC’18), Vancouver, BC, Can- [24] E. Hubbard et al., Booster synchrotron, Technical Report
ada (JACoW, Geneva, Switzerland, 2018). No. FERMILAB-TM-405, Fermilab, 1973.
[6] N. Simos, P. Hurh, E. Dooryhee, L. Snead, D. Sprouster, Z. [25] Booster rookie book, https://operations.fnal.gov/
Zhong, H. Zhong, S. Ghose, Z. Kotsina, K. Ammigan rookie_books/Booster_V4.1.pdf.
et al., 120 GeV neutrino physics graphite target damage [26] J. Eldred, Slip-stacking dynamics for high-power proton
assessment using electron microscopy and high-energy x- beams at Fermilab, Ph.D. thesis, University of Indiana
ray diffraction, Phys. Rev. Accel. Beams 22, 041001 [Technical Report No. FERMILAB-THESIS-2015-31,
(2019). 2015].
[7] E. L. Sola, M. Calviani, O. Aberle, C. Ahdida, P. Avigni, [27] K. Seiya, C. Bhat, D. Johnson, V. Kapin, W. Pellico, C.-Y.
M. Battistin, L. Bianchi, S. Burger, J. B. Descarrega, J. C. Tan, and R. Tesarek, Beam studies for the proton improve-
Espadanal et al., Beam impact tests of a prototype target for ment plan (PIP)—Reducing beam loss at the Fermilab
the beam dump facility at CERN: Experimental setup and Booster, arXiv:1511.01467.
044001-12BEAM INTENSITY EFFECTS IN FERMILAB … PHYS. REV. ACCEL. BEAMS 24, 044001 (2021)
[28] G. Budker and G. Dimov, On the charge exchange [42] A. Burov and V. Lebedev, Impedances of laminated
injection of protons into ring accelerators, Transactions vacuum chambers, arXiv:1209.2996.
of the International Conference on Accelerators, Dubna, [43] V. Shiltsev, Y. Alexahin, V. Lebedev, P. Lebrun, R. Moore,
1963 (Atomizdat, Moscow, 1964), p. 993. T. Sen, A. Tollestrup, A. Valishev, and X. Zhang, Beam-
[29] C. Hojvat, C. Ankenbrandt, B. Brown, D. Cosgrove, J. beam effects in the Tevatron, Phys. Rev. ST Accel. Beams
Garvey, R. Johnson, M. Joy, J. Lackey, K. Meisner, T. 8, 101001 (2005).
Schmitz et al., The multiturn charge exchange injection [44] J. Zagel, A. Jansson, T. Meyer, D. K. Morris, D. Slimmer,
system for the Fermilab Booster accelerator, IEEE Trans. T. Sullivan, and M. Yang, Operational use of ionization
Nucl. Sci. 26, 3149 (1979). profile monitors at Fermilab, in Proceedings of the 14th
[30] C. Bhat, A new beam injection scheme for the Fermilab Beam Instrumentation Workshop, Santa Fe, NM (LANL,
Booster, arXiv:1504.07174. Los Alamos, 2010).
[31] C. Bhat, R&D on beam injection and bunching schemes in [45] V. Shiltsev, Space-charge effects in ionization beam profile
the Fermilab Booster, arXiv:1704.08157. monitors, Nucl. Instrum. Methods Phys. Res., Sect. A 986,
[32] A. Macridin, P. Spentzouris, J. Amundson, L. Spentzouris, 164744 (2020).
and D. McCarron, Coupling impedance and wake func- [46] V. Shiltsev, J. Eldred, V. Lebedev, and K. Seiya, Studies of
tions for laminated structures with an application to the beam intensity effects in the Fermilab Booster synchrotron.
Fermilab Booster, Phys. Rev. ST Accel. Beams 14, 061003 Part II: Beam emittance evolution, Technical Report
(2011). No. FERMILAB-TM-2741, Fermilab, 2020.
[33] A. Macridin, J. Amundson, P. Spentzouris, V. Lebedev, and [47] C. Bhat, B. Chase, S. Chaurize, F. Garcia, K. Seiya, W.
T. Zolkin, Transverse impedance and transverse instabil- Pellico, T. Sullivan, and A. K. Triplett, Energy spread of
ities in Fermilab Booster, Technical Report No. FERMI- the proton beam in the Fermilab Booster at its injection
LAB-CONF-13-431, Fermilab, 2013. energy, arXiv:1504.07195.
[34] A. Valishev, Y. Alexahin, and V. Lebedev, Suppression of [48] J. Eldred, C. Bhat, S. Chaurize, V. Lebedev, S. Nagaitsev,
half-integer resonance in FNAL Booster and space charge K. Seiya, C. Tan, and R. Tesarek, Foil scattering model for
losses at injection, in Proceedings of HB2016, Malm, Fermilab Booster, arXiv:1912.02896.
Sweden (JACoW, Geneva, Switzerland, 2016), pp. 164– [49] J. Eldred, Preliminary double-notch Booster ecloud study,
168. Report No. Beams-doc-8910, 2020, Fermilab internal note.
[35] X. Yang, C. M. Ankenbrandt, J. MacLachlan, and V. A. [50] W. Chou, in ICFA Beam Dynamics Newsletter No. 20
Lebedev, A proposed transition scheme for the longitudinal (1999), Chap. 4.14, https://icfa-usa.jlab.org/archive/
emittance control in the Fermilab Booster, Technical newsletter/icfa_bd_nl_20.pdf.
Report No. FERMILAB-FN-0772, Fermilab, 2005. [51] J. Tang, Rapid cycling synchrotrons and accumulator rings
[36] V. Lebedev, J.-F. Ostiguy, and C. Bhat, Beam acceleration for high-intensity hadron beams, Rev. Accel. Sci. Techol.
and transition crossing in the Fermilab Booster, in Pro- 06, 143 (2013).
ceedings of HB2016 (Malm, Sweden) (JACoW, Geneva, [52] J. Delahaye, G. Gelato, L. Magnani, G. Nassibian, F.
Switzerland, 2016), pp. 160–163. Pedersen, K. Reich, K. Schindl, and H. Schonauer, Shap-
[37] J.-F. Ostiguy, C. Bhat, and V. Lebedev, Modeling longi- ing of proton distribution for raising the space-charge of the
tudinal dynamics in the Fermilab Booster synchrotron, in CERN PS Booster, in the 11th International Conference on
Proceedings of IPAC2016, Busan, Korea (JACoW, 2016), High-Energy Accelerators (Springer, New York, 1980),
pp. 873–876. pp. 299–304.
[38] X. Yang, A. Drozhdin, and W. Pellico, Momentum spread [53] G. Franchetti, I. Hofmann, M. Giovannozzi, M. Martini,
reduction at beam extraction from the Fermilab Booster at and E. Metral, Space charge and octupole driven resonance
slip stacking injection to the Main Injector, in Proceedings trapping observed at the CERN Proton Synchrotron, Phys.
of the 22nd Particle Accelerator Conference, PAC-2007, Rev. ST Accel. Beams 6, 124201 (2003).
Albuquerque, NM (IEEE, New York, 2007), pp. 1733– [54] M. Chanel, Space charge measurements at the PSB,
1735. Technical Report No. AB-Note-2008-006 ABP, CERN,
[39] B. Hendricks, ACNET: The undiscovered control system, 2008.
Report No. Beams-doc-7037-v2, 2019, Fermilab internal [55] S. Dawson, C. Williamson, G. Rumolo, and B. Mikulec,
note. Measurements of emittance and tune spread at linac2 and
[40] V. Shiltsev, J. Eldred, V. Lebedev, and K. Seiya, Studies of linac4 injection energies for the Proton Synchrotron
beam intensity effects in the Fermilab Booster synchrotron. Booster (PSB), Technical Report No. ATS/Note/2012/
Part I: Introduction; Tune and chromaticity scans of beam 013 PERF, CERN, 2012.
losses, Technical Report No. FERMILAB-TM-2740, Fer- [56] F. Asvesta, H. Bartosik, S. Gilardoni, A. Huschauer, S.
milab, 2020. Machida, Y. Papaphilippou, and R. Wasef, Identification
[41] D. Johnson, T. Johnson, C. Bhat, S. Chaurize, K. Duel, P. and characterization of high order incoherent space
Karns, W. Pellico, B. Schupbach, K. Seiya, and D. charge driven structure resonances in the CERN Proton
Slimmer, MEBT laser notcher (chopper) for Booster loss Synchrotron, Phys. Rev. Accel. Beams 23, 091001 (2020).
reduction, in ICFA ABDW on High-Intensity and High- [57] H. Bartosik, F. Asvesta, A. Huschauer, Y. Papaphilippou,
Brightness Hadron Beams, Daejeon, Korea, 2018 (JA- and F. Schmidt, Space charge induced losses in the CERN
COW, Geneva, Switzerland, 2018), pp. 416–421. injector complex, J. Instrum. 15, P07021 (2020).
044001-13You can also read