SUBPICOSECOND METAMAGNETIC PHASE TRANSITION IN FERH DRIVEN BY NON-EQUILIBRIUM ELECTRON DYNAMICS - NATURE
←
→
Page content transcription
If your browser does not render page correctly, please read the page content below
ARTICLE
                   https://doi.org/10.1038/s41467-021-25347-3                OPEN

                  Subpicosecond metamagnetic phase transition in
                  FeRh driven by non-equilibrium electron dynamics
                  Federico Pressacco 1,2 ✉, Davide Sangalli3,4, Vojtěch Uhlíř 5,6, Dmytro Kutnyakhov 2, Jon Ander Arregi                                                  5,

                  Steinn Ymir Agustsson 7, Günter Brenner2, Harald Redlin2, Michael Heber2, Dmitry Vasilyev7,
                  Jure Demsar 7, Gerd Schönhense 7, Matteo Gatti4,8,9, Andrea Marini 3,4, Wilfried Wurth1,2 &
                  Fausto Sirotti 9,10
1234567890():,;

                  Femtosecond light-induced phase transitions between different macroscopic orders provide
                  the possibility to tune the functional properties of condensed matter on ultrafast timescales.
                  In first-order phase transitions, transient non-equilibrium phases and inherent phase coex-
                  istence often preclude non-ambiguous detection of transition precursors and their temporal
                  onset. Here, we present a study combining time-resolved photoelectron spectroscopy and
                  ab-initio electron dynamics calculations elucidating the transient subpicosecond processes
                  governing the photoinduced generation of ferromagnetic order in antiferromagnetic FeRh.
                  The transient photoemission spectra are accounted for by assuming that not only the
                  occupation of electronic states is modified during the photoexcitation process. Instead, the
                  photo-generated non-thermal distribution of electrons modifies the electronic band structure.
                  The ferromagnetic phase of FeRh, characterized by a minority band near the Fermi energy, is
                  established 350 ± 30 fs after the laser excitation. Ab-initio calculations indicate that the
                  phase transition is initiated by a photoinduced Rh-to-Fe charge transfer.

                  1 The Hamburg Centre for Ultrafast Imaging, Hamburg University, Hamburg, Germany. 2 Deutsches Elektronen-Synchrotron DESY, Hamburg, Germany.
                  3 Istituto
                           di Struttura della Materia—Consiglio Nazionale delle Ricerche (CNR-ISM), Division of Ultrafast Processes in Materials (FLASHit), Monterotondo
                  Stazione, Italy. 4 European Theoretical Spectroscopy Facility (ETSF) https://www.etsf.eu/. 5 CEITEC BUT, Brno University of Technology, Brno, Czech
                  Republic. 6 Institute of Physical Engineering, Brno University of Technology, Brno, Czech Republic. 7 Johannes Gutenberg-Universität, Institute of Physics,
                  Mainz, Germany. 8 LSI, CNRS, CEA/DRF/IRAMIS, École Polytechnique, Institut Polytechnique de Paris, Palaiseau, France. 9 Synchrotron SOLEIL, L’Orme des
                  Merisiers, Gif-sur-Yvette, France. 10 Physique de la Matiére Condensée, CNRS and École Polytechnique, IP Paris, Palaiseau, France.
                  ✉email: federico.pressacco@desy.de

                  NATURE COMMUNICATIONS | (2021)12:5088 | https://doi.org/10.1038/s41467-021-25347-3 | www.nature.com/naturecommunications                                 1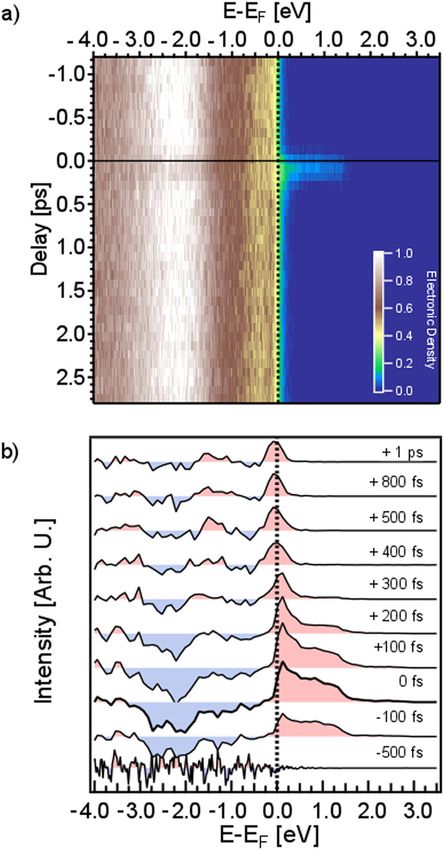
ARTICLE                                                                   NATURE COMMUNICATIONS | https://doi.org/10.1038/s41467-021-25347-3

E
      mergence of long-range ordered states in condensed matter                   In this work, we focus on FeRh, a metallic material that
      is typically a consequence of a fine interplay between the                undergoes a metamagnetic FOPT from antiferromagnetic (AFM)
      coupled spin, charge, orbital, and lattice degrees of                    to FM order at TM ~ 360 K and exhibits coupled structural,
freedom1–4. The mechanisms vary between different correlated                   magnetic and electronic order parameters27,28 (see Fig. 1a). The
oxides and metallic systems leading to specific dynamical beha-                 thermally induced, quasi-static phase transition in FeRh (depicted
vior. Excitation with ultrashort electromagnetic pulses offers the             in Fig. 1b by the green arrow) has been extensively studied by
most efficient means to control the physical properties of con-                 following the sample magnetization, lattice parameter or
densed matter systems on a femtosecond time scale5–7. Materials                resistivity29–32. Moreover, numerous works have studied the
featuring first-order phase transitions (FOPTs) with abrupt                     AFM-FM phase transition by means of time-resolved techniques,
changes in their order parameters are especially appealing for                 where photoexcitation above a threshold intensity results in a
ultrafast devices based on a functionality switch. In this regard,             nonzero net magnetization. Seminal pump-probe magneto-opti-
prominent examples are the insulator-metal transition in VO28,9                cal studies of FeRh films suggested subpicosecond generation of
or 1T–TaS210,11.                                                               FM order33,34. Bergman et al. later suggested a scenario in which
   In order to obtain a good understanding of the relevant                     FM domain nucleation occurs at ultrafast time scales, but the
mechanisms triggering the transition, it is necessary to explore               subsequent establishment of long range magnetic order is natu-
the fundamental timescale of FOPTs. However, this is often                     rally slower, a process consisting of FM domain growth, coales-
challenging with multiple coupled degrees of freedom displaying                cence, and magnetic moment alignment35. Subsequent research
complex dynamics upon laser-induced excitation. Moreover,                      efforts tracking the net magnetic moment correspondingly found
macroscopic phase coexistence at the FOPT, specifically, the                    a much slower transition on the order of several picoseconds35–37.
processes of nucleation and domain growth, complicate the dis-                 Thus, detection techniques susceptible to the magnetization
entanglement of dynamic changes in order parameters. The                       direction result in a perceived delay in the emergence of FM
fundamental question, whether the modification of electronic                    order. Besides, time-resolved x-ray diffraction experiments indi-
structure drives the transition, is extensively debated in the lit-            cated that the speed of the transition might be set by the time
erature, giving key arguments on the role of photoexcited states in            scale of the structural changes and therefore limited by the speed
double-exchange interactions12, electronic precursors closing the              of sound (~5 nm/ps), so that magnetic and structural order
insulating gap13, or the existence of intermediate transient                   emerge concurrently37,38.
phases2,9,14,15.                                                                  However, FM order can also be traced by directly exploiting the
   In the case of ferromagnetic materials, magnetization dynamics              specifics of the electronic structure, naturally manifested in terms
triggered by a laser pulse leads to ultrafast demagnetization16,               of spin unbalance and the appearance of majority and minority
associated with changes in the spin polarization17–20, which is                spin bands39–41. This is independent of spin alignment along a
impacted by the spin-dependent mobility of electrons21–23. In                  particular direction, and thus allows inspecting FM order via
contrast, disentangling the ultrafast response of coupled order                x-ray photoelectron spectroscopy (XPS)42–44. Similar to the
parameters of magnetic FOPTs has been far less investigated.                   electronic signature of the insulator-metal transition8,10, it was
Ultrafast generation of ferromagnetic (FM) order has been                      demonstrated that the modification of electronic bands might
observed so far in a relatively small group of materials such as               prove equally useful to investigate the laser-induced generation of
manganites1,24 or CuB2O425. Understanding the phenomenon of                    FM order across the magnetic FOPT in FeRh45.
laser-induced subpicosecond generation of FM order across a                       Here, utilizing time-resolved photoelectron momentum
FOPT is still a major challenge in femtomagnetism26.                           microscopy and supported by first principle calculations, we
                                                                               demonstrate that it is the light-induced modification of the

Fig. 1 Electronic properties of FeRh across the metamagnetic phase transition. a Sketch of the isostructural metamagnetic phase transition in FeRh. At
room temperature (top) the system is AFM showing atomic magnetic moments only at the Fe atom sites (mFe = ±3.3μB). Above 360 K (bottom) the
system has ferromagnetically coupled magnetic moments at the Fe (mFe = 3.1 μB) and Rh (mRh = 0.9 μB) sites. The whole unit cell expands isotropically by
about 1% in volume69. b Schematic representation of the two possible paths in the AFM to FM phase transition: direct thermally-driven transition to the
FM phase (green arrow), and two-step transition going through a transient electronic state reached during photoexcitation (red arrow) followed by
relaxation to the equilibrium FM state (blue and black arrows). c Calculated spin-resolved electronic density of states in the AFM and FM phases. The filled
areas represent the electronic occupation at thermal equilibrium, with the green area highlighting the position of the Fe minority band (see manuscript
text). d Measured x-ray photoelectron spectra of FeRh in the AFM (black dots) and FM (red dots) phase. The solid curve at the bottom of the graph is the
difference between the two spectra, which allows to appreciate the relative electron density change across the transition. The data correspond to quasi-
static thermal cycling experiments prior to the time-resolved measurements.

2                  NATURE COMMUNICATIONS | (2021)12:5088 | https://doi.org/10.1038/s41467-021-25347-3 | www.nature.com/naturecommunications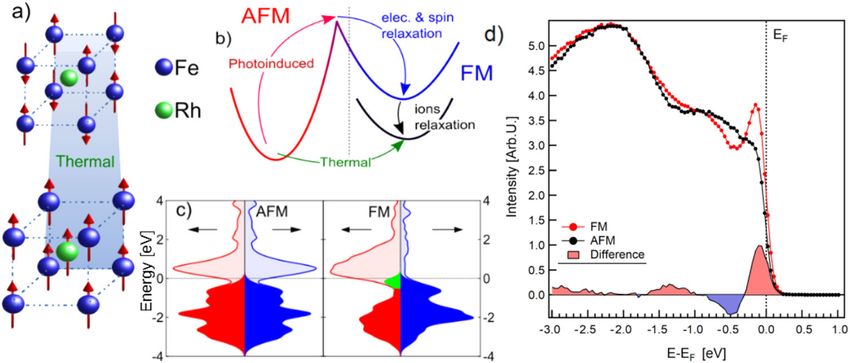
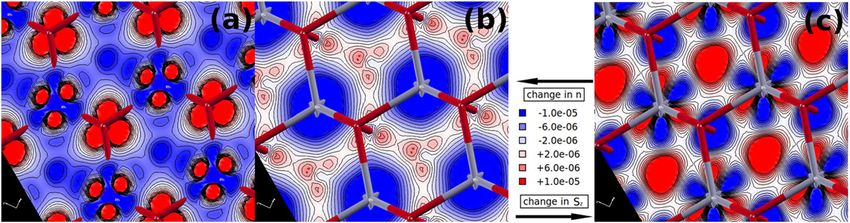
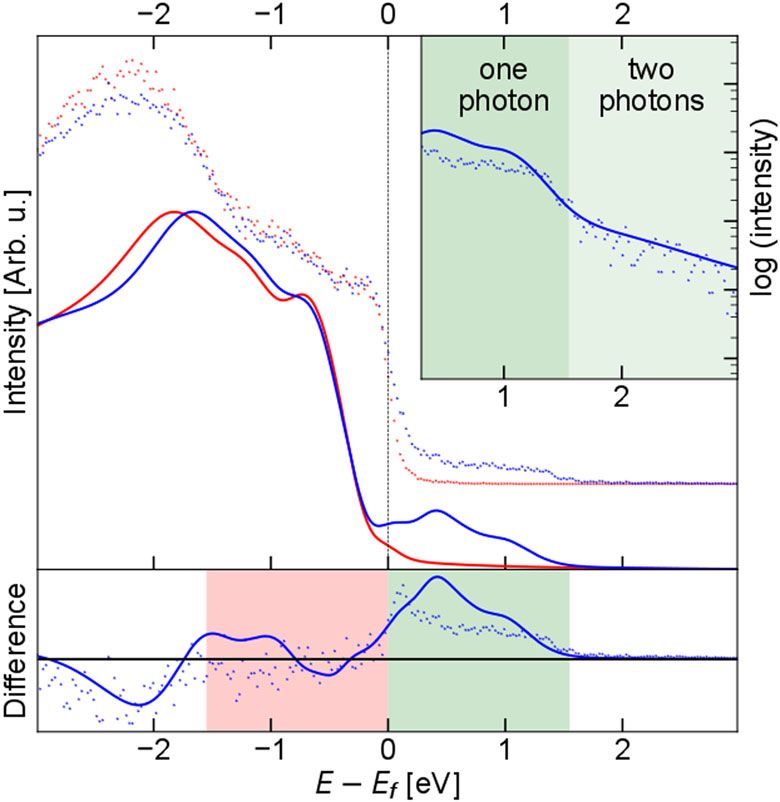
NATURE COMMUNICATIONS | https://doi.org/10.1038/s41467-021-25347-3                                                                          ARTICLE

electronic band structure that triggers the phase transition in
FeRh. In particular, we show that ultrafast laser excitation induces
a charge transfer between the Rh and Fe atoms, serving as a non-
equilibrium precursor for the formation of the FM band structure
on the subpicosecond timescale.

Results
The sample under study consists of an epitaxial 80-nm-thick
FeRh(001) film grown on a single-crystal MgO(001) substrate,
undergoing the AFM-to-FM phase transition at 377 K (see
Supplementary Fig. 1). The establishment of the FM phase in
FeRh is accompanied by the appearance of a narrow peak in the
electronic density of states, located about 150 meV below the
Fermi energy EF, as a result of the occupation of a spin-polarized
Fe band (see green highlighted area in Fig. 1c). The photoelectron
spectroscopy data shown in Fig. 1d are the momentum integrated
energy distribution curves measured at room temperature for the
AFM phase (black dots) and at 420 K for the FM phase (red dots).
We use this spectral feature to follow the emergence of the FM
phase after laser excitation. Pump-probe experiments were per-
formed at the FLASH Free Electron Laser (FEL) in Hamburg
using near-infrared (800 nm, 1.55 eV) pulses of 90 fs coupled with
130 fs soft x-ray pulses with a photon energy of ℏω = 123.5 eV
(see “Methods” for details).
   Figure 2a presents the time-resolved, k-integrated photoelec-
tron spectra measured as a function of the delay between the
optical pump and x-ray probe pulses, focusing on a 4 ps window
around time zero t0. The laser fluence in this pump-probe
experiment was 5.6 mJ/cm2, which is above the threshold value to
induce the FOPT (see Supplementary Fig. 2 for additional
experiments at different laser fluences). One can clearly identify
distinct regions in the time-dependent spectra: the temporal
overlap between the optical and x-ray pulses (about 100 fs around
t0), the relaxation of electrons toward the Fermi energy on the 100
fs timescale, and the subsequent changes in the density of states               Fig. 2 Time-resolved x-ray photoelectron spectroscopy of FeRh. a Energy-
near the Fermi level, associated with the formation of the Fe                   and delay-dependent matrix of the measured spectra. The vertical dashed
minority band. Differential energy-dependent profiles, reported                  line marks the position of the Fermi level EF, while the horizontal solid line
in Fig. 2b, provide a clearer picture. These are retrieved by                   designates the time zero, t0. The appearance of electronic density in the
averaging the measured photoelectron spectra within a ±50 fs                    unoccupied states is a fingerprint of the laser excitation. We used this
temporal region for each of the indicated time delays, and sub-                 spectral feature to identify the temporal overlap between the optical pump
tracting the average photoelectron spectra at negative time delays.             and the x-ray probe pulses. b Differential photoelectron spectra at selected
   The photoexcited electrons relax via electron-electron and                   delays. To enhance the signal to noise ratio, we average the unpumped
electron-phonon scattering, leading to the onset of a Fermi-like                spectra (between −1 ps and −0.5 ps) and subtract the average spectrum
distribution (see the red shaded areas for E − EF > 0 in Fig. 2b). A            from each row of the matrix. This allows evaluating the statistical noise at
reduction of the electron density below the Fermi level is also                 negative time delays (−500 fs) as well as accentuating the temporal
observed around t0 (blue shaded areas for E − EF < 0 in Fig. 2b).               evolution of the photoelectron spectra. Red and blue shaded areas indicate
At the same delay, the spectrum shows excitation of electrons up                an increase and a reduction of the electron density with respect to the
to 3.1 eV above EF (see also the inset in Fig. 3). Note that the                spectra at negative delays, respectively.
electron density above 1.5 eV is almost two orders of magnitude
lower. The changes in the population above the Fermi level can be
explained by one- and two-photon absorption processes, such                        To elucidate the electronic dynamics near the zero time delay,
that laser excitation (ℏωp = 1.55 eV) promotes electrons into                   we compare the experimental results with time-dependent density
states within the energy range [EF, EF + 2ℏωp]. Then, electrons                 functional theory (TD-DFT) calculations of the electronic struc-
start to relax toward the Fermi level and accumulate in an energy               ture performed on FeRh (see Fig. 3). Here, we select a laser fluence
region of a few hundred meV above EF. On the other hand, the                    which gives a good quantitative agreement with the measured
transient depletion of electronic density below the Fermi level is              photoelectron spectra (see “Methods”). The calculated one- and
concentrated between −3.1 eV and −1.55 eV [EF − 2ℏωp, EF −                      two-photon absorption intensity above the Fermi level presented
 ℏωp]. Assuming the photo-induced depletion, one would expect                   in the inset of Fig. 3 corresponds to an excitation of 0.25 electrons
to observe measurable changes in the photoelectron yield only for               per FM unit cell of FeRh (see Fig. 1a), i.e., ~1022 cm−3. This is
energies 1.55 eV below the EF (as the two-photon contribution                   close to the experimental estimate of 0.15 electrons per unit cell
should be negligible). This suggests that the laser induced changes             for a 5.6 mJ/cm2 fluence. In Fig. 3, the calculated XPS spectrum
in the electronic distribution close to the Fermi level cause severe            and its time evolution are obtained considering (i) the time evo-
modifications of the deeper lying bands, meaning that the in-fieri                lution of the electronic distribution function fnk(t), and (ii) the
FOPT involves changes in the overall electronic structure of the                time evolution of the electronic band structure ϵnk(t) (see
system.                                                                         “Methods”). The changes in fnk(t) can give a significant signal only

NATURE COMMUNICATIONS | (2021)12:5088 | https://doi.org/10.1038/s41467-021-25347-3 | www.nature.com/naturecommunications                                    3
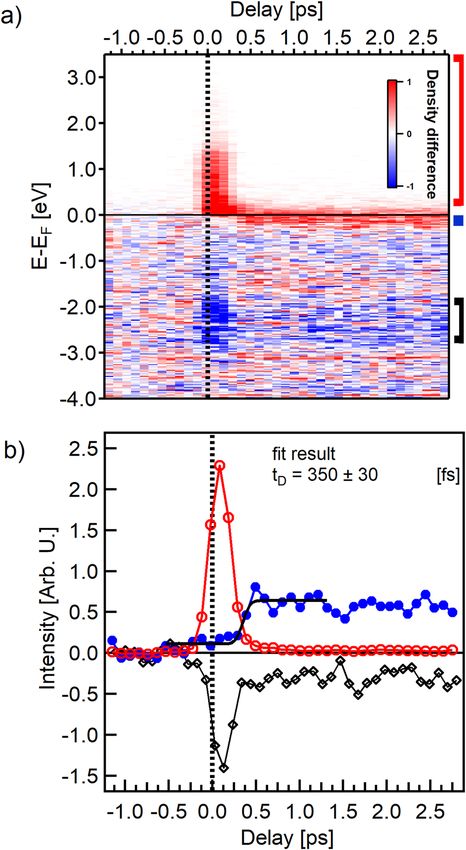
ARTICLE                                                                   NATURE COMMUNICATIONS | https://doi.org/10.1038/s41467-021-25347-3

Fig. 3 Comparison of experimental and computed photoelectron spectra
of FeRh. Experimental spectra (dots) at equilibrium (t = −0.5 ps, red) and
at the maximum of the pump pulse (t = 0 ps, blue) are compared in linear
(top panel) and logarithmic scales (inset) to the TD-DFT calculations (solid
lines) of the electronic structure of FeRh in the AFM phase (red) and at
laser excitation (blue). The bottom panel displays the difference between
the corresponding experimental and theoretical spectra in the top panel.
The green (red) region represents the energy range to (from) which
electrons are excited with one-photon (1.55 eV) processes. The light green
region in the top panel inset identifies the energy range that can be reached
by two-photon (3.1 eV) processes.

in the red and green shaded regions between −1.55 eV and
+1.55 eV, since the electron redistribution caused by two-photon
absorption process is negligible. Thus, the signal below −1.55 eV
is fully due to changes in ϵnk(t). The fact that it is negative implies
a reduction in the density of states (see the relative height dif-
ference of the red and blue solid curves in Fig. 3). On the other
hand, the changes in the region between −1.55 eV and 0 eV result
from two effects that sum up to a negligible signal. fnk(t) gives a
negative contribution due to the promotion of electrons to states
above the Fermi level. For the overall signal to be negligible, the            Fig. 4 Subpicosecond generation of the electronic FM order in FeRh. a
change in ϵnk(t) must result in an increase of the density of states           Energy- and delay-dependent differential matrix of the measured
which compensates the reduction in the occupations. Such com-                  photoelectron spectra. We subtracted the average of unpumped spectra
pensation is almost exact in the experimental data, leading to an              (between −1 ps and −0.5 ps) from each measured spectrum. The effect of
overall signal that appears as a reduction of the broad peak at ≈−2            laser excitation is evident around time zero, indicating depletion of the
eV. The same compensation is only partial in the simulation                    occupied states and the corresponding population of the empty states. In
leading to an overall signal that appears as a shift of the same peak.         addition, an increase in the electronic density close to the Fermi level is
The region above the Fermi level seems to be mainly governed by                observed at positive time delays. The red, blue, and black bars on the right
fnk(t). The overall agreement between theory and experiment is                 hand side mark the representative integration regions for tracking the
very good. The observed slight differences may be due to relaxa-               electronic dynamics in the unoccupied states, the formation of the Fe
tion processes in the experiment already active during the                     minority peak, and the modification of the deeper bands, respectively.
pumping phase, making the electron distribution more peaked                    b Temporal evolution of the electronic density in the three characteristic
toward the Fermi level.                                                        energy regions marked in (a). The population of states above the Fermi
   The relaxation of excited electrons proceeds with the formation             level shows a fast rise and a consecutive decay around t0 (empty red
of a peak above the Fermi level between 100 fs and 300 fs (see                 circles). The deeper bands (empty black diamonds) show a corresponding
Fig. 2b). At a time delay of around 400 fs, the peak crosses the               depletion and recovery which reflects the dynamics of the unoccupied
Fermi level and after 500 fs, its position stabilizes at the energy            states. However, their occupation level stabilizes 300 fs after t0 and
value which is characteristic for the Fe minority band of the FM               remains constant thereafter. The electronic density slightly below EF (filled
phase in FeRh45. We also observe a modest but perceptible                      blue circles) shows a moderate increase during the laser excitation up to
decrease (increase) of the spectral weight around −0.5 eV (−1.4                300 fs delay, followed by a pronounced increase due to the shift of Fe
eV) binding energy for t > 0.3 ps, a characteristic that matches the           minority band below EF at a delay tD of 350 fs. This value was extracted by
difference of the static AFM and FM photoelectron spectra in                   fitting the error function to the experimental results (black solid line).
Fig. 1b. Additional pump-probe experiments at a slightly lower                 Subsequently, the minority Fe band peak intensity remains constant
laser fluence of 4.5 mJ/cm2 show entirely equivalent electron                   throughout the investigated delay range.

4                  NATURE COMMUNICATIONS | (2021)12:5088 | https://doi.org/10.1038/s41467-021-25347-3 | www.nature.com/naturecommunications
NATURE COMMUNICATIONS | https://doi.org/10.1038/s41467-021-25347-3                                                                                ARTICLE

Fig. 5 Computed photoinduced changes in charge and spin density in FeRh. a, b Changes in the charge density n(r, tf) − neq(r) and (c) spin density
Sz ðr; tf Þ  Seq
               z ðrÞ at the end of the laser pulse (t = tf) with respect to the equilibrium configuration. Densities are in atomic units ([e=a0 ] and [μB =a0 ], where
                                                                                                                                             3             3
                   −11                                                                                      4
a0 = 5.29 × 10 m is the Bohr radius. 0.25 electron per unit cell corresponds to a density of 7 ´ 10 e=a0 .) on two different FeRh{111}-planes: the plane
                                                                                                                   3

just below the Fe(↑) atoms (a) and the plane containing the Rh atoms (b, c). Fe and Rh atom positions are indicated by red and gray segments of the
lattice, respectively. Charge is transferred from the occupied (bonding) orbitals of Rh atoms (panel b), to the unoccupied (anti-bonding) orbitals of Rh and
Fe (a). Since the Fe anti-bonding levels are filled in this process, the local Fe spin density is reduced. As a result, there is a redistribution of spin density
around the Rh atoms and a reduction of the local spin moment at the Fe atoms (c). The movies in the Supplementary Information show the simulated time
evolution of the charge density variations at the Fe and Rh sites as represented in (a) and (b) at the beginning and the end of the laser pulse.

dynamics in terms of the pump-induced increase in the density of                    position at 150 meV below EF. Similar differences in the behavior
states above EF, the subsequent relaxation of electrons and the                     of the electronic density at and below the Fermi level have been
subpicosecond formation of the minority band (see Supplemen-                        observed during ultrafast demagnetization process in Fe17 and
tary Fig. 2). The fingerprint of the FOPT for laser fluences above                    Co18. In the present case, this behavior shows that the FOPT in
~3 mJ/cm2 remains 20 ps after the laser pulse (see Supplementary                    FeRh is mediated by a transient electronic phase in which the
Fig. 2) and beyond (see ref. 45). Photoexcitation at fluences below                  electronic structure is different from both the AFM and FM
this threshold gives rise to transient changes in the electronic                    phases. This precursory phase exists in a delay range from time
occupation landscape, but does not cause a persistent modifica-                      zero up to 500 fs after laser excitation.
tion of the band structure (see Supplementary Fig. 2).
   Further insights into the FOPT dynamics are obtained from                        Discussion
the complete differential matrix, presented in Fig. 4a, monitoring                  The unexpected reduction of the photoelectron yield below the
the modification of the electronic density at different time delays.                 one-photon absorption range (~1.55 eV), an energy region where
We selected three energy ranges marked by the red, blue, and                        the electronic populations fnk(t) cannot be strongly affected by the
black bars placed on the right hand side of Fig. 4a. The first (red)                 laser excitation, is explained by theoretical calculations. The effect
accounts for the electronic density above 200 meV and identifies                     can only be accounted for by considering the photoinduced
the total number of electrons injected into the unoccupied states                   change in the electronic band structure (i.e., density of states).
upon photoexcitation. The second (blue) goes from −240 meV to                       Time-resolved XPS spectra are usually described and interpreted
0 meV and is used to monitor the formation of the Fe minority                       in terms of changes in the population fnk(t) only. This is clearly
peak across the phase transition. The third (black) includes the                    insufficient for the ultrafast dynamics in FeRh, since changes in
region from −2.8 eV to −1.8 eV and is used to follow the                            ϵnk(t) must be considered on the same level even before the phase
modification of deeper bands.                                                        transition is complete.
   Figure 4b shows the time evolution of the integrated signal in                      The changes in ϵnk(t) during and after photoexcitation provide
each range. The injection of electrons into the unoccupied states                   insights into why FeRh would relax toward the FM phase. The
takes place near zero delay (we recall that our system’s response                   photoexcitation process in the AFM state depletes the valence
function is 150 fs) and then rapidly decays (red empty circles), the                states, which are characterised by hybridized Fe-Rh bonding
process being finished by about 500 fs. The intensity at the                         states, and fills the unoccupied states, where empty Fe “local
position of the Fe minority peak starts to grow already during the                  minority-spin” anti-bonding states are mainly available. As a
laser excitation (filled blue circles), due to both the modification                  result two processes occur: a charge (and spin) transfer from Rh
of the electronic structure and the Fermi level smearing. More                      to Fe (Rh → Fe), and a symmetric spin transfer from Fe “local
specifically, this modest intensity growth starting at t = 0 is linked               majority” → Fe “local minority” (Fe(↑) ↔ Fe(↓)). Simulated
to the presence of an instantaneous increase in the density of                      charge and spin density changes upon photoexcitation clearly
states peaking right above the Fermi level (see Fig. 2b, t = 0 ps)                  show this, Fig. 5. Here, the blue regions around the Rh atoms
and can be considered as a precursor of the metamagnetic phase                      indicate a charge depletion, which can only partially be explained
transition. However, it is only about 300 fs after the excitation                   by a local redistribution. Most of the charge is transferred to the
that the electronic density corresponding to the minority band                      Fe atoms (see Fig. 5a), while there is a strong charge depletion
peak displays a sharp increase, associated with a persistent band                   around Rh atoms (see Fig. 5b). The Rh → Fe process also
structure modification. The characteristic time delay tD and                         increases the local spin density, along the Rh − Fe bonds, around
subsequent rise time τ of the transition are obtained by fitting the                 the Rh atoms (see Fig. 5c). On the other hand, the Fe(↑) ↔ Fe(↓)
integrated electron density at the Fe minority peak region with an                  is a pure spin transfer process, with a strong reduction (~10%) of
error function (see “Methods”) and yields values of tD = 350 ± 30                   the local momentum of the Fe atoms, which is transferred into
fs and τ = 220 ± 110 fs. In addition, the data represented by black                 the vicinity of the Rh atoms (see Fig. 5c).
diamonds in Fig. 4b, which indicate the time-dependent popu-                           In the AFM phase, the zero magnetic moment around the Rh
lation of bands in a region below EF, nearly mirror the population                  atoms is a result of a non-vanishing spin density that integrates to
of the unoccupied levels up to 300 fs, with a fast depletion and                    zero because of the hybridization with surrounding Fe atoms with
recovery. The curve stabilizes thereafter at a finite value, implying                opposite moments3,41,46. The photoexcitation alters this delicate
permanent modifications of the deeper bands already after 300 fs,                    balance. As shown for the magnetic disorder associated with the
during which the Fe minority peak is still shifting toward its final                 temperature increase, the decrease of the Fe-Fe first-neighbor

NATURE COMMUNICATIONS | (2021)12:5088 | https://doi.org/10.1038/s41467-021-25347-3 | www.nature.com/naturecommunications                                           5
ARTICLE NATURE COMMUNICATIONS | https://doi.org/10.1038/s41467-021-25347-3
AFM couplings favors the FM order of the Fe subsystem, while of the FM phase can be followed by the appearance and position
inducing magnetic fluctuations on the Rh sites3. In turn, the of the Fe minority band near the Fermi level with characteristic
induced Rh magnetic moments stabilize the FM over the AFM time of τ = 220 ± 110 fs. Photoexcited electrons relax across the
state3,33,47,48. Our simulations therefore suggest that the change of Fermi level and establish the FM electronic band structure 400 fs
Fe-Rh hybridization (Rh → Fe process) and the optically induced after the laser excitation. We thus conclude that metamagnetism
intersite spin transfer (OISTR, Fe(↑) ↔ Fe(↓) process) play a in FeRh is triggered on a subpicosecond time scale. Further
crucial role in the photo-induced transition. The OISTR process exploration of the laser-induced dynamics in ultrathin and
has been recently proposed, on the basis of TD-DFT simulations, nanoscale confined FeRh31 could lead to ultrafast devices based
as a key mechanism also in other multicomponent magnetic on magnetic order-order phase transitions at room temperature.
materials49–51. Here, it causes to weaken the AFM ordering but is
not sufficient to trigger the magnetic transition alone (just after the Methods
photoexcitation, the system is still in the AFM phase). Sample and surface preparation. The sample consists of an epitaxial 80-nm-thick
The theoretical simulation, not including dissipating effects, FeRh(001) film grown onto a MgO(001) substrate by dc magnetron sputtering
using an equiatomic target. The films were grown at 725 K and post-annealed
cannot describe the dynamics after the photoexcitation when in situ at 1070 K for 45 min in order to achieve CsCl-type chemical ordering52.
electron-electron, electron-phonon and electron-magnon inter- Upon cooling down the samples in the ultra high vacuum chamber, single-layer
actions are at play, and the actual phase transition takes place. graphene is formed on top of the FeRh surface by segregating the carbon from the
Taking into account dissipating effects, one would expect further film53. This provides oxidation protection in air and avoids the need for further
capping layers of the FeRh layer to be transported to the FEL facility without
dynamics of both fnk(t) and ϵnk(t): the formation of a Fermi
degradation. The sample surface was prepared via annealing only, in order to
distribution and its subsequent cooling (for fnk(t)), and the for- preserve the graphene layer, and tested with XPS prior to the time-resolved
mation of the FM band structure (for ϵnk(t)). Instead, our experiments as described in earlier works41,45. Examination with low-energy
experimental time resolution is fast enough to allow the identi- electron diffraction revealed the expected reconstruction pattern of the FeRh(001)
fication of a bottleneck time in this process, i.e., the metamagnetic surface.
transformation exhibiting a 350 fs delay. It is associated with a
change in the band structure, with the spin-minority Fe band Structural and magnetic characterization of FeRh films. X-ray reflectivity and
x-ray diffraction measurements confirm the smooth character and high-quality
slightly pushed below the Fermi level and getting filled by the FeRh(001) texture of the film. The existence of the magnetic phase transition was
electrons that progressively cool down. This transformation confirmed via temperature-dependent magnetization measurements using vibrat-
occurs on a subpicosecond timescale that is faster than what was ing sample magnetometry (see Supplementary Fig. 1 for sample characterization
determined by previous experiments on FeRh with a lower time and ref. 52 for additional information on FeRh films grown under equivalent
conditions).
resolution45. Most importantly, our results set a new timescale
that is faster than the lattice expansion and the establishment of
Experiment. The experiments are performed at the plane grating monochromator
the macroscopic, long-range magnetic order35–37. beamline54,55 at FLASH56,57, using the HEXTOF end-station58. The pump-probe
The process is schematically depicted in Fig. 1b. Immediately scheme is established by a near-infrared pulse of 90 fs coupled with a FEL pulse of
after the action of the pulse, a significant number of electrons is about 130 fs (both values are the full width half maximum, FWHM), which provide
excited to unoccupied states, with a non-thermal distribution of an estimated system response function58, i.e., the effective pump-probe correlation,
of ~150 fs FWHM. The optical pump and x-ray probe energies were set to 1.55 eV
electrons fnk(t) (red arrow in Fig. 1b) decaying toward the Fermi and 123.5 eV, respectively. The energy resolution of ~150 meV is extracted from
level on a time scale of about 200 fs. This initial stage can be the Fermi level fit.
considered as a precursor of the FM phase and is accompanied by The sample temperature was kept at 348 K in the experimental chamber during
the slower dynamics of the band structure ϵnk with the formation all pump-probe photoelectron spectroscopy experiments reported here. At this
temperature, the FeRh film is in the AFM phase during both the heating and
of the peak of the Fe minority band. The peak crosses the Fermi cooling cycles (see Supplementary Fig. 1), which ensures the relaxation of the FeRh
level at about 350 fs delay, and stabilizes at −150 meV binding film back to the AFM phase between consecutive laser pulses.
energy after 400 fs. During this step, the system undergoes a Photoexcited electrons near normal emission were detected using a momentum
purely electronic transition through a transient phase, where the microscope, which has an acceptance angle of 2π above the sample surface and can
image the full Brillouin zone (BZ) with up to 7 Å−1 diameter58,59. We used a
electronic band configuration evolves from ϵnk(t) to an inter-
negative extractor voltage (~40 V with respect to the sample potential). This
mediate electronic FM phase ϵeFM nk (blue arrow in Fig. 1b). Once retarding field between the sample and extractor effectively removes the slow
the electronic distribution reaches the configuration of the FM secondary electrons originating from the x-ray photons and pump-laser-induced
phase (after 400 fs), the relaxation of the lattice parameter toward slow electrons. All background electrons with energies less than ~4 eV are thus
the equilibrium value of the FM phase then follows on a longer repelled within the first 400 μm above the sample surface. This removal of space
charge comes at the expenses of k-resolution and causes a reduction of the k-field-
time scale (black arrow in Fig. 1b). of-view to 1.3 Å−1. Integrating over this k-field represents the integral of 60% of the
In conclusion, we determine the existence of a transient elec- BZ of FeRh, which was sufficient to well identify the peak associated with the FM
tronic phase needed to induce the AFM to FM phase transition of phase. We characterize the sample surface by measuring the spectra of the system
FeRh using pump-probe photoelectron spectroscopy at the in the AFM and FM phases at fixed temperatures, and obtained line-shapes
equivalent to those reported in ref. 45 (see Fig. 1d). The presence of the peak at
FLASH FEL facility. The results are supported by electronic about ~150 meV below the Fermi level is the signature of the Fe minority band
structure calculations, which explain the details of the dynamics characteristic of the FM phase. To fit the experimental data in Fig. 4b, we used an
following the laser excitation. The time-resolved photoemission error function of the following form:
experiment at a laser fluence of 5.6 mJ/cm2 is well reproduced h t t i
assuming the excitation of 0.25 electrons per unit cell of FeRh. At f ðtÞ ¼ y0 þ A 1 þ erf D
τ
these fluences, the photon absorption cannot be described simply
where y0 is a vertical offset, A is the amplitude, tD is the temporal onset of the
as promotion of electrons from filled to empty states of the cal- transition (with respect to t0), and τ is the characteristic rise time.
culated band structure, but the modified electron population
induces a modification of the band structure as well, which is Theory. We calculate from first principles the equilibrium and non–equilibrium
confirmed by the good agreement between theory and experi- properties of FeRh using the pw.x and yambo codes60–63 within Density Func-
ments. The laser excitation results in the transfer of electrons tional Theory (DFT) and its Time Dependent (TD–DFT) extension. At equilibrium
from the occupied d orbitals below the Fermi level to the unoc- both the FM and AFM phases are computed within the local density approxima-
tion (LDA) fully including spin–orbit coupling (SOC). An energy cut-off of 65 Ry
cupied d orbitals above the Fermi level, with a partial transfer of is used for the wave–functions with a 5 × 5 × 5 sampling of the BZ for the
electrons from the Rh to the Fe sites. The transient electronic self–consistent calculation. The experimental lattice parameter, 5.966 Å, is chosen
phase exists up to 500 fs after the laser excitation. The emergence for the AFM structure: an FCC unit cell containing 4 atoms (there is a factor 2
6 NATURE COMMUNICATIONS | (2021)12:5088 | https://doi.org/10.1038/s41467-021-25347-3 | www.nature.com/naturecommunicationsNATURE COMMUNICATIONS | https://doi.org/10.1038/s41467-021-25347-3 ARTICLE
compared to the parameter of the BCC unit cell with 2 atoms used in ref. 64). The 7. Singer, A. et al. Photoinduced enhancement of the charge density wave
FM ground state is then computed for the same unit cell and for a unit cell with a amplitude. Phys. Rev. Lett. 117, 056401 (2016).
1% lattice expansion. LDA gives a low negative stress using the experimental value 8. Wegkamp, D. et al. Instantaneous band gap collapse in photoexcited
of the lattice parameters in both the FM and the AFM phase. We use the monoclinic vo2 due to photocarrier doping. Phys. Rev. Lett. 113, 216401
experimental values and we verified that changes in the lattice parameters very (2014).
weakly affect the electronic density of states. 9. Shao, Z., Cao, X., Luo, H. & Jin, P. Recent progress in the phase-transition
We also verified that the Generalized Gradient Approximation (GGA) gives mechanism and modulation of vanadium dioxide materials. NPG Asia Mater.
small improvements in comparison with experimental values, which however are 10, 581–605 (2018).
not relevant to the present work. For this reason we used LDA which is more easily 10. Perfetti, L. et al. Time evolution of the electronic structure of 1t − tas2 through
handled in the non equilibrium TD–DFT simulations with SOC. Finally we verified the insulator-metal transition. Phys. Rev. Lett. 97, 067402 (2006).
that the AFM structure displays a phonon instability as reported in the 11. Stojchevska, L. et al. Ultrafast switching to a stable hidden quantum state in an
literature64–66. electronic crystal. Science 344, 177–180 (2014).
Subsequently, a non self–consistent calculation (NSCF) on a 8 × 8 × 8 sampling 12. Ono, A. & Ishihara, S. Double-exchange interaction in optically induced
of the BZ is performed. The electronic density of states (DOS) of the two structures nonequilibrium state: A conversion from ferromagnetic to antiferromagnetic
reported in Fig. 1c is computed starting from such NSCF calculation. We then structure. Phys. Rev. Lett. 119, 207202 (2017).
construct the XPS spectrum from the projection of the DOS on the atomic orbitals
13. Gray, A. X. et al. Correlation-driven insulator-metal transition in near-ideal
of Fe and Rh. The projected DOS are weighted using tabulated photoionization
vanadium dioxide films. Phys. Rev. Lett. 116, 116403 (2016).
cross sections67 for a probe of 125 eV (in practice the signal is dictated by Fe(3d)
14. Wall, S. et al. Tracking the evolution of electronic and structural properties of
orbitals). Moreover, we use energy dependent lifetimes of the form
vo2 during the ultrafast photoinduced insulator-metal transition. Phys. Rev. B
γnk ¼ A þ B dðϵnk Þ þ CðϵF ϵnk Þ2 , where the first constant contribution A = 60
87, 115126 (2013).
meV mimics the experimental resolution, the second term B, proportional to the
15. Morrison, V. R. et al. A photoinduced metal-like phase of monoclinic vo2
electronic DOS d(ϵ), mimics the electron–phonon lifetimes, and the term which
revealed by ultrafast electron diffraction. Science 346, 445–448 (2014).
grows quadratically away from the Fermi level mimics the electron–electron
16. Beaurepaire, E., Merle, J.-C., Daunois, A. & Bigot, J.-Y. Ultrafast spin
lifetimes. Finally, the effect of temperature is included in the Fermi distribution
dynamics in ferromagnetic nickel. Phys. Rev. Lett. 76, 4250–4253 (1996).
used for the electronic occupations. The resulting spectrum is shown in Fig. 1c.
The TD–DFT simulations, as implemented in the yambo code68, are then 17. Gort, R. et al. Early stages of ultrafast spin dynamics in a 3d ferromagnet. Phys.
performed propagating the Kohn–Sham density matrix in the basis–set of the Rev. Lett. 121, 087206 (2018).
equilibrium wave–functions under the action of the same pump pulse used in the 18. Eich, S. et al. Band structure evolution during the ultrafast ferromagnetic-
experiment. The NSCF DFT calculation is used as a starting point for TD–DFT. paramagnetic phase transition in cobalt. Sci. Adv. 3, e1602094 (2017).
The laser pulse parameters are equivalent to the experimental conditions. In 19. Tengdin, P. et al. Critical behavior within 20 fs drives the out-of-equilibrium laser-
particular, the fluence is chosen considering: (i) the experimental fluence, (ii) the induced magnetic phase transition in nickel. Sci. Adv. 4, eaap9744 (2018).
fact that part of the pulse is reflected by the sample, and (iii) the fact that the 20. Andres, B. & Weinelt, M. Spin-resolved electronic structure of 3d transition metals
external field is renormalized by the induced field. The effect of both (ii) and (iii) is during ultrafast demagnetization. J. Magn. Magn. Mater. 501, 166475 (2020).
estimated taking into account the dielectric function of bulk FeRh. In particular, 21. Eschenlohr, A. et al. Ultrafast spin transport as key to femtosecond
point (iii) needs to be considered since we adopt the so called transverse gauge, demagnetization. Nat. Mater. 12, 332–336 (2013).
where the macroscopic (or G = 0) component of the Hartree field is subtracted 22. Bergeard, N. et al. Hot-electron-induced ultrafast demagnetization in Co/Pt
from the microscopic TD-DFT equations. In the input file we set the pulse intensity multilayers. Phys. Rev. Lett. 117, 147203 (2016).
of 5 × 10⁷ kW/cm2 and the FWHM of the intensity profile is 100 fs. We use a 23. Carva, K., Battiato, M., Legut, D. & Oppeneer, P. M. Ab initio theory of
Gaussian envelope times a sinðωtÞ function with ℏω = 1.55 eV. The code computes electron-phonon mediated ultrafast spin relaxation of laser-excited hot
the fluence during the simulation corresponding to an absorbed fluence of 1.881 electrons in transition-metal ferromagnets. Phys. Rev. B 87, 184425 (2013).
mJ/cm2. This compares fairly well with the experimental estimate. Using 24. Matsubara, M. et al. Ultrafast photoinduced insulator-ferromagnet transition in
1 − R ≈ 0.3138 and a laser fluence of 5.6 mJ/cm2, about 0.3138 × 5.6 mJ/ the perovskite manganite gd0.55sr0.45mno3. Phys. Rev. Lett. 99, 207401 (2007).
cm2 ≈ 1.757 mJ/cm2 is absorbed by the sample. The density matrix is calculated on 25. Bossini, D. et al. Femtosecond activation of magnetoelectricity. Nat. Phys. 14,
a 8 × 8 × 8 grid of k points in the BZ including all states from −3.5 up to 5.5 eV. 370–374 (2018).
The Kohn–Sham field felt by the electrons is updated at each time step during the 26. Kirilyuk, A., Kimel, A. V. & Rasing, T. Ultrafast optical manipulation of
simulation. The non-equilibrium DOS is then computed by diagonalizing the magnetic order. Rev. Mod. Phys. 82, 2731–2784 (2010).
Hamiltonian evaluated from the photoexcited electron density after the action of 27. Fallot, M. & Hocart, R. Sur l’apparition du ferromagnétisme par élévation du
the pump pulse. The adiabatic non-equilibrium XPS spectrum is finally computed température dans des alliages de fer et de rhodium. Rev. Sci. 77, 498–501
using the same smearing used for the equilibrium spectra. The electronic (1939).
occupation is obtained from the diagonal elements of the density matrix in the 28. Kouvel, J. S. & Hartelius, C. C. Anomalous magnetic moments and
basis updated during the course of the simulation. transformations in the ordered alloy FeRh. J. Appl. Phys. 33, 1343–1344
(1962).
Code availability 29. Maat, S., Thiele, J.-U. U. & Fullerton, E. E. Temperature and field hysteresis of
The data that support the findings of this study are available from the corresponding the antiferromagnetic-to-ferromagnetic phase transition in epitaxial FeRh
author upon reasonable request. The codes used for the ab-initio electron dynamics films. Phys. Rev. B 72, 214432 (2005).
calculations are freely distributed under GPL license under the link https://github.com/ 30. Baldasseroni, C. et al. Temperature-driven nucleation of ferromagnetic
yambo-code/yambo. domains in FeRh thin films. Appl. Phys. Lett. 100, 262401 (2012).
31. Uhlíř, V., Arregi, J. A. & Fullerton, E. E. Colossal magnetic phase transition
asymmetry in mesoscale ferh stripes. Nat. Commun. 7, 13113 (2016).
Received: 18 December 2020; Accepted: 22 July 2021; 32. Keavney, D. J. et al. Phase coexistence and kinetic arrest in the
magnetostructural transition of the ordered alloy ferh. Sci. Rep. 8, 1778 (2018).
33. Ju, G. et al. Ultrafast generation of ferromagnetic order via a laser-induced
phase transformation in FeRh thin films. Phys. Rev. Lett. 93, 197403 (2004).
34. Thiele, J.-U., Buess, M. & Back, C. H. Spin dynamics of the antiferromagnetic-
to-ferromagnetic phase transition in ferh on a sub-picosecond time scale.
References Appl. Phys. Lett. 85, 2857–2859 (2004).
1. Li, T. et al. Femtosecond switching of magnetism via strongly correlated 35. Bergman, B. et al. Identifying growth mechanisms for laser-induced
spin–charge quantum excitations. Nature 496, 69–73 (2013). magnetization in ferh. Phys. Rev. B 73, 060407(R) (2006).
2. De Jong, S. et al. Speed limit of the insulator–metal transition in magnetite. 36. Radu, I. et al. Laser-induced generation and quenching of magnetization on
Nat. Mater. 12, 882–886 (2013). FeRh studied with time-resolved x-ray magnetic circular dichroism. Phys. Rev.
3. Polesya, S., Mankovsky, S., Ködderitzsch, D., Minár, J. & Ebert, H. Finite- B 81, 104415 (2010).
temperature magnetism of ferh compounds. Phys. Rev. B 93, 024423 (2016). 37. Mariager, S. O. et al. Structural and magnetic dynamics of a laser induced
4. Wollmann, L., Nayak, A. K., Parkin, S. S. & Felser, C. Heusler 4.0: tunable phase transition in ferh. Phys. Rev. Lett. 108, 087201 (2012).
materials. Annu. Rev. Mater. Res. 47, 247–270 (2017). 38. Quirin, F. et al. Structural dynamics in FeRh during a laser-induced
5. Rohwer, T. et al. Collapse of long-range charge order tracked by time-resolved metamagnetic phase transition. Phys. Rev. B 85, 020103(R) (2012).
photoemission at high momenta. Nature 471, 490–493 (2011). 39. Lee, J. S., Vescovo, E., Plucinski, L., Schneider, C. M. & Kao, C. C. Electronic
6. Fausti, D. et al. Light-induced superconductivity in a stripe-ordered cuprate. structure and magnetic properties of epitaxial FeRh(001) ultra-thin films on
Science 331, 189–191 (2011). W(100). Phys. Rev. B 82, 224410 (2010).
NATURE COMMUNICATIONS | (2021)12:5088 | https://doi.org/10.1038/s41467-021-25347-3 | www.nature.com/naturecommunications 7ARTICLE NATURE COMMUNICATIONS | https://doi.org/10.1038/s41467-021-25347-3
40. Gray, A. X. et al. Electronic structure changes across the metamagnetic transition Acknowledgements
in FeRh via hard X-ray photoemission. Phys. Rev. Lett. 108, 257208 (2012). This work is dedicated to Wilfried Wurth, who passed away on May 8, 2019. We
41. Pressacco, F. et al. Stable room-temperature ferromagnetic phase at the acknowledge support by the scientific and technical staff of FLASH, as well as Holger
FeRh(100) surface. Sci. Rep. 6, 22383 (2016). Meyer and Sven Gieschen form University of Hamburg. This work was supported by the
42. Maiti, K., Malagoli, M. C., Magnano, E., Dallmeyer, A. & Carbone, C. excellence cluster “The Hamburg Centre for Ultrafast Imaging—Structure, Dynamics
Electronic band structure of gd: A consistent description. Phys. Rev. Lett. 86, and Control of Matter at the Atomic Scale” of the Deutsche Forschungsgemeinschaft
2846–2849 (2001). (DFG EXC 1074) and through the SFB 925 “Lichtinduzierte Dynamik und Kontrolle
43. Beaulieu, N. et al. Probing ultrafast dynamics in electronic structure of korrelierter Quantensysteme” (project B2). It received funding from the EU-H2020
epitaxial gd(0001) on w(110). J. Electron Spectrosc. 189, 40–45 (2013). research and innovation program under European Union projects “MaX” Materials
44. Sirotti, F. et al. Multiphoton k-resolved photoemission from gold surface states design at the eXascale H2020-EINFRA-2015-1 (Grant Agreement No. 824143) and
with 800-nm femtosecond laser pulses. Phys. Rev. B 90, 035401 (2014). “NFFA” Nanoscience Foundries and Fine Analysis-Europe H2020-INFRAIA-2014-2015
45. Pressacco, F. et al. Laser induced phase transition in epitaxial FeRh layers studied (Grant Agreement No. 654360) having benefited from the access provided by the ISM
by pump-probe valence band photoemission. Struct. Dyn. 5, 034501 (2018). node (CNR, Italy), user-project IDs 247 and 669. We acknowlege the Deutsche For-
46. Sandratskii, L. M. & Mavropoulos, P. Magnetic excitations and femtomagnetism schungsgemeinschaft (DFG, German Research Foundation)—TRR 173—268565370
of ferh: A first-principles study. Phys. Rev. B 83, 174408 (2011). (projects A02 and A05). Access to the CEITEC Nano Research Infrastructure was sup-
47. Gruner, M. E., Hoffmann, E. & Entel, P. Instability of the rhodium magnetic ported by the Ministry of Education, Youth and Sports (MEYS) of the Czech Republic
moment as the origin of the metamagnetic phase transition in α − FeRh. Phys. under the projects CEITEC 2020 (LQ1601) and CzechNanoLab (LM2018110). We
Rev. B 67, 064415 (2003). acknowledge funding from the Italian project MIUR PRIN Grant No. 20173B72NB. This
48. Gu, R. Y. & Antropov, V. P. Dominance of the spin-wave contribution to the work has received funding from the European Union’s Horizon 2020 research and
magnetic phase transition in ferh. Phys. Rev. B 72, 012403 (2005). innovation program under the Marie Skłodowska-Curie and it is co-financed by the
49. lliott, P., Müller, T., Dewhurst, J. K., Sharma, S. & Gross, E. K. U. Ultrafast laser South Moravian Region under grant agreement No. 665860.
induced local magnetization dynamics in heusler compounds. Sci. Rep. 6, 38911
(2016).
50. Dewhurst, J. K., Elliott, P., Shallcross, S., Gross, E. K. U. & Sharma, S. Laser-
Author contributions
F.P., V.U., J.A.A., M.G., D.S., and F.S. designed the project. F.P., D.K., M.H., S.Y.A., G.B.,
induced intersite spin transfer. Nano Lett. 18, 1842–1848 (2018).
H.R., D.V., V.U., J.A.A., and F.S. performed the time-resolved XPS experiments and
51. Hofherr, M. et al. Ultrafast optically induced spin transfer in ferromagnetic
analyzed the data. M.G., D.S., and A.M. designed the theoretical approach to the pro-
alloys. Sci. Adv. 6, eaay8717 (2020).
blem. J.A.A. and V.U. prepared and characterized the samples. All authors discussed the
52. Arregi, J. A., Caha, O. & Uhlíř, V. Evolution of strain across the
results. F.P., V.U., J.A.A., D.S., M.G., and F.S. wrote the paper with contributions from all
magnetostructural phase transition in epitaxial FeRh films on different
authors and critical revision from J.D., G.S., and W.W.
substrates. Phys. Rev. B 101, 174413 (2020).
53. Uhlíř, V. et al. Single-layer graphene on epitaxial FeRh thin films. Appl. Surf.
Sci. 514, 145923 (2020). Funding
54. Martins, M. et al. Monochromator beamline for FLASH. Rev. Sci. Instr. 77, Open Access funding enabled and organized by Projekt DEAL.
115108 (2006).
55. Gerasimova, N., Dziarzhytski, S. & Feldhaus, J. The monochromator beamline at
flash: performance, capabilities and upgrade plans. J. Mod. Opt. 58, 1480–1485 Competing interests
(2011). The authors declare no competing interests.
56. Ackermann, W. et al. Operation of a free-electron laser from the extreme
ultraviolet to the water window. Nat. Photonics 1, 336–342 (2007). Additional information
57. Rossbach, J., Schneider, J. R. & Wurth, W. 10 years of pioneering x-ray science Supplementary information The online version contains supplementary material
at the free-electron laser flash at desy. Phys. Rep. 808, 1–74 (2019). available at https://doi.org/10.1038/s41467-021-25347-3.
58. Kutnyakhov, D. et al. Time-and momentum-resolved photoemission studies
using time-of-flight momentum microscopy at a free-electron laser. Rev. Sci. Correspondence and requests for materials should be addressed to F.P.
Instrum. 91, 013109 (2020).
59. Schönhense, G., Medjanik, K. & Elmers, H. J. Space-, time- and spin-resolved Peer review information Nature Communications thanks J. Kay Dewhurst and the other,
photoemission. J. Electron Spectros. Relat. Phenomena 200, 94–118 (2015). anonymous, reviewer(s) for their contribution to the peer review of this work. Peer
60. Giannozzi, P. et al. Quantum espresso: a modular and open-source software reviewer reports are available.
project for quantum simulations of materials. J. Phys.: Condens. Matter 21,
395502 (2009). Reprints and permission information is available at http://www.nature.com/reprints
61. Giannozzi, P. et al. Advanced capabilities for materials modelling with
quantum espresso. J. Phys.: Condens. Matter 29, 465901 (2017). Publisher’s note Springer Nature remains neutral with regard to jurisdictional claims in
62. Marini, A., Hogan, C., Grüning, M. & Varsano, D. yambo: An ab initio tool published maps and institutional affiliations.
for excited state calculations. Comput. Phys. Commun. 180, 1392–1403 (2009).
63. Sangalli, D. & Marini, A. Ultra-fast carriers relaxation in bulk silicon following
photo-excitation with a short and polarized laser pulse. Europhys. Lett. 110,
Open Access This article is licensed under a Creative Commons
47004 (2015).
64. Aschauer, U., Braddell, R., Brechbühl, S. A., Derlet, P. M. & Spaldin, N. A. Attribution 4.0 International License, which permits use, sharing,
Strain-induced structural instability in ferh. Phys. Rev. B 94, 014109 (2016). adaptation, distribution and reproduction in any medium or format, as long as you give
65. Wolloch, M. et al. Impact of lattice dynamics on the phase stability of appropriate credit to the original author(s) and the source, provide a link to the Creative
metamagnetic ferh: Bulk and thin films. Phys. Rev. B 94, 174435 (2016). Commons license, and indicate if changes were made. The images or other third party
66. Zarkevich, N. A. & Johnson, D. D. Ferh ground state and martensitic material in this article are included in the article’s Creative Commons license, unless
transformation. Phys. Rev. B 97, 014202 (2018). indicated otherwise in a credit line to the material. If material is not included in the
67. Yeh, J. & Lindau, I. Atomic subshell photoionization cross sections and article’s Creative Commons license and your intended use is not permitted by statutory
asymmetry parameters: 1≤ z ≤103. At. Data Nucl. Data Tables 32, 1–155 (1985). regulation or exceeds the permitted use, you will need to obtain permission directly from
68. Sangalli, D. et al. Many-body perturbation theory calculations using the the copyright holder. To view a copy of this license, visit http://creativecommons.org/
yambo code. J. Phys.: Condens. Matter 31, 325902 (2019). licenses/by/4.0/.
69. Shirane, G., Chen, C., Flinn, P. & Nathans, R. Hyperfine fields and magnetic
moments in the fe–rh system. J. Appl. Phys. 34, 1044–1045 (1963).
© The Author(s) 2021
8 NATURE COMMUNICATIONS | (2021)12:5088 | https://doi.org/10.1038/s41467-021-25347-3 | www.nature.com/naturecommunicationsYou can also read