A picture of Instagram is worth more than a thousand words: Workload characterization and application
←
→
Page content transcription
If your browser does not render page correctly, please read the page content below
A picture of Instagram is worth more than a thousand words:
            Workload characterization and application

    Thiago H. Silva⋆ , Pedro O. S. Vaz de Melo⋆ , Jussara M. Almeida⋆ , Juliana Salles†, Antonio A. F. Loureiro⋆
                     ⋆
                         Computer Science, Universidade Federal de Minas Gerais, Belo Horizonte, MG, Brazil
                                            †
                                              Microsoft Research, Redmond, WA, USA
                             {thiagohs, olmo, jussara, loureiro}@dcc.ufmg.br, jsalles@microsoft.com

    Abstract—Participatory sensing systems (PSSs) have the po-          The success of PSSs is directly connected to the populariza-
tential to become fundamental tools to support the study, in        tion of the smartphone, which became the most widely adopted
large scale, of urban social behavior and city dynamics. To that    personal computing device [5]. Smartphones have a rich set
end, this work characterizes the photo sharing system Instagram,    of built-in sensors, such as GPS, accelerometer, microphone,
considered one of the currently most popular PSS on the Internet.   camera, gyroscope and digital compass, and typically remain
Based on a dataset of approximately 2.3 million shared photos,
we characterize user’s behavior in the system showing that there
                                                                    turned on all time. However, sensing not only depends on
are several advantages and opportunities for large scale sensing,   the data generated by these sensors but also on the user’s
such as a global coverage at low cost, but also challenges, such    subjective observations. Currently, there are several examples
as a very unequal photo sharing frequency, both spatially and       of PSSs already deployed and used by smartphones, such as
temporally. We also observe that the temporal photo sharing         Waze1 to report traffic conditions in real time, and Weddar2 to
pattern is a good indicator about cultural behaviors, and also      report weather conditions. Moreover, there are photo-sharing
says a lot about certain classes of places. Moreover, we present    services, such as Instagram3, where users can send images in
an application to identify regions of interest in a city based on   real time to the system. In particular, Instagram is currently
data obtained from Instagram, which illustrates the promising       one of the most popular PSS, with nearly 100 million users
potential of PSSs for the study of city dynamics.                   and more than 1 billion photos received, having every second
                                                                    a new user registered and 58 new photos uploaded [6].
                     I.     I NTRODUCTION                               The main objective of this work is to characterize the
    Mark Weiser, in his classical article entitled “The computer    participation network of Instagram, aiming to show the chal-
for the 21st century” that appeared in the Scientific American      lenges and opportunities emerging from participatory sensing
magazine [1], popularized the concept of ubiquitous comput-         performed by users of this application. Based on a dataset of
ing, which envisions the availability of a computing environ-       approximately 2.3 million photos, we show the planetary scope
ment for anyone, anywhere, and at any time. It may involve          of the network, as well as the highly unequal frequency of
many wirelessly interconnected devices, not just traditional        photos sharing, both spatially and temporally, which is highly
computers, such as desktops or laptops, but may also include        correlated with the typical routine of people. Moreover, we also
all sorts of objects and entities such as pens, mugs, phones,       show how to design useful applications based on Instagram as
shoes, and many others. Although this is not the reality yet,       we present a technique to identify regions of interest within a
and this concept has been extended to include, for example, the     city. This application illustrates the immense potential of PSSs
Internet of Things, much has been done in this direction in the     to study the dynamics of cities. To the best of our knowledge,
past 20 years after the publication of Weiser’s seminal paper.      this is the first study to characterize the use of Instagram by
In this scenario, Wireless Sensor Networks (WSNs) [2] play an       the photos shared.
important role since they are designed to collect data about the        The rest of this paper is organized as follows. Section II
physical environment where they are inserted and provide such       presents the related work. Section III discusses the participa-
information to the end user or other entities. Moreover, there is   tion of human beings in the process of sensing, addressing
an increasing use of participatory sensing systems (PSSs) [3],      participatory sensing systems and participatory sensor net-
allowing people connected to the Internet to provide useful         works (PSNs), arising from PSSs. Section IV presents the
information about the context in which they are at any given        characterization of a PSN derived from Instagram. Section V
moment.                                                             describes an application to classify regions in a city using
    Indeed, PSSs have the potential to complement WSNs in           Instagram data. Finally, Section VI presents the conclusion
several respects. As WSNs are typically designed to sense           and future work.
areas of limited size, such as forests and volcanoes, PSSs
can reach areas of varying size and scale, such as large                                   II.     R ELATED W ORK
cities, countries or even the entire planet [4]. Furthermore, a        The process of sensing the environment may involve hu-
WSN is subject to failure, since its operation depends upon         mans as (i) the target of the process [7], or (ii) the person re-
proper coordination of actions of its sensor nodes, which have      sponsible for collecting the data [8], [9]. In this paper, we focus
severe hardware and software restrictions. On the other hand,
PSSs are formed by independent and autonomous entities, i.e.,         1 http://www.waze.com
humans, which make the task of sensing highly resilient to            2 http://www.weddar.com

individual failures.                                                  3 http://www.instagram.com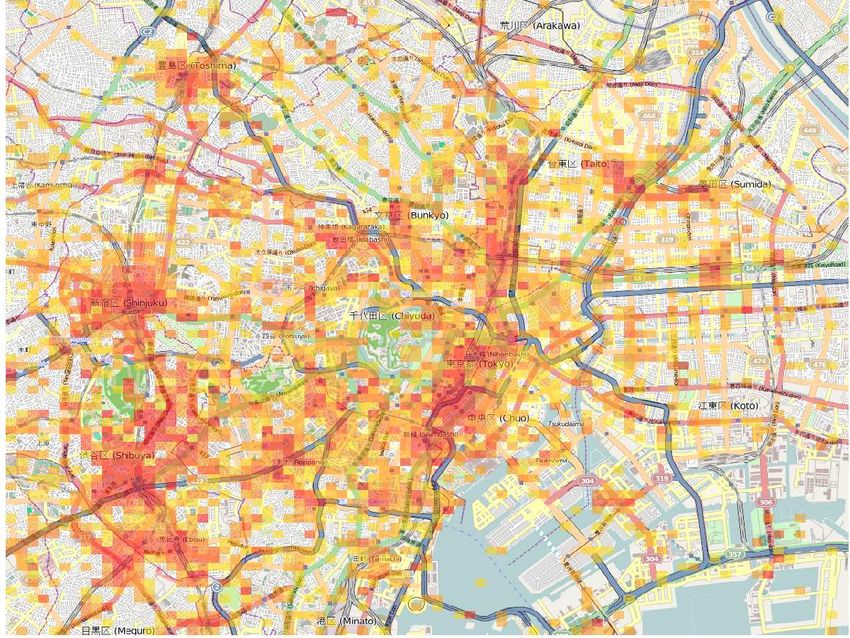
on the second case, considering systems that employ mobile            interest of users in photos collected from Flickr. That work
devices, such as smartphones, to build a participatory sensor         explores the spatial dimension to investigate the interest of
network, which is described in Section III-B. In the literature,      users by a photo, showing that the geographic distribution is
we can find several systems that consider the involvement of          more focused around a geographic location.
humans in the sensing process. Some of those participatory
sensing systems (PSSs) include, for example, traffic [10] and             Our work differs from previous ones (including ours) since
noise [11] monitoring systems.                                        it focus on a new system of great popularity nowadays – the
                                                                      Instagram. To the best of our knowledge, this is the first char-
    The success of PSSs depends mainly on the continuous              acterization of Instagram by photos shared by users. In fact, we
participation of users along the time. Reddy et al. [12] propose      specifically analyze the Instagram from a crowdsensing point
incentive mechanisms based on micro-payments, which are               of view. Moreover, continuing our recent studies [4], [22], this
small amounts of money given to the user when he/she per-             work examines the dynamics of cities across PSSs, showing
forms certain activities in the system. Besides the continuous        that photo-sharing systems, particularly the Instagram, can also
participation of a user, the system needs to ensure the quality       be used for mapping the characteristics of urban locations at
of the shared data [13]. For example, in several PSSs users can       a low cost.
fabricate false data supposedly sensed at a low cost. Therefore,
data integrity is not always guaranteed [14].
                                                                                 III.   H UMANS    IN THE   S ENSING P ROCESS
    There are several proposals devoted to the study of spe-
cific characteristics of PSSs. For example, in location sharing           The focus of this paper is on systems that rely on humans’
services like Foursquare, Cheng et al. [15] observe that users        participation in the sensing process, where they are responsible
follow a pattern of mobility simple and feasible to be repro-         for local data sharing. Such data can be obtained with the aid
duced. In this direction, Cho et al. [16] observe that humans         of sensing devices such as sensors embedded into smartphones
perform short trips that are periodic in space and time and are       (e.g., GPS) or by human sensors (e.g., vision), being subjective
not affected by a social network structure, which, in its turn,       observations produced by them [8].
influences only long distance trips.
                                                                      A. Participatory Sensing
    Scellato et al. [17] show that 40% of social relations
arising among users of three popular online location-based                Participatory sensing is the process where humans actively
services happen within [100]km. Noulas et al. [18] analyze            use mobile devices and cloud computing services to share
the dynamics of sharing in location sharing services and show,        local environmental data such as a picture [3]. It differs from
for example, that the distribution of the number of check-ins         opportunistic sensing [26] mainly by the user participation,
is highly uneven, being well modeled by a power law.                  which is minimal in the latter case. In this work, we consider
                                                                      that a fundamental point in participatory sensing is the user
    Other studies propose using data derived from PSSs in new
                                                                      desire to share data, regardless of the process applied to
applications, since this type of data helps to better understand
                                                                      generate it. In fact, we consider also manually user-generated
the physical boundaries and notions of space [19]. In this
                                                                      observations. Participatory sensing with these characteristics is
direction, Cranshaw et al. [20] present a model to classify
                                                                      usually referred to as ubiquitous crowdsourcing [13] or mobile
regions of a city based on patterns of collective activities, while
                                                                      crowdsensing [27]. The popularity of participatory sensing sys-
Noulas et al. [21] propose using categories of places registered
                                                                      tems has grown rapidly with the increasing use of cell phones
on Foursquare to classify areas and users of a city.
                                                                      embedded with sensors and the ubiquity of wireless access
    In a previous work [4], we analyze the properties of par-         to the Internet access. These devices have become a powerful
ticipatory sensor networks derived from two location sharing          platform that includes capabilities of sensing, computing and
applications: Gowalla and Brightkite. We analyze the spatial          communication.
and temporal distributions of check-ins performed by users of
these systems to collect relevant evidence so we design new               A data sensed in a participatory sensing application is
services and applications. In [22], we proposed a new way to          (i) obtained through physical sensors (e.g., GPS) or human
visualize the dynamics of cities based on habits and routines         observations (e.g., road congestion), (ii) defined in time and
of people collected from check-ins on Foursquare.                     space, (iii) obtained automatically or manually, (iv) structured
                                                                      or unstructured, and (v) voluntarily shared or not. To illustrate
    The only study about Instagram found is the one performed         this type of system, consider an application for traffic monitor-
by Rainie et al. [23], where the authors interviewed Instagram        ing, such as Waze. Users can share comments about accidents
users finding, for instance, that Instagram is more likely to         or congestion manually. It is still possible to calculate the speed
be used by young adults. There are also studies that analyze          of the car and automatically share the car’s route with the aid
similar photo sharing systems, such as Flickr, which is not           of the GPS. With speed measurements of different vehicles
a system accessed mostly by smartphones, i.e., it is not              sampled in a particular area, it is possible to infer, for example,
a conventional PSS. However, some of those studies take               congestion. In this case, users manage the application, which
into account large scale geotagged photos, what make them             was created for this purpose, and the sensed data is structured.
particularly related to this work. Crandall et al. [24] study how     But if users use a microblogging service, such as Twitter4 ,
to organize a large number of geotagged photos, combining             the sensed data is unstructured. For example, the user “John”
analysis of tag text with geospatial data of the photo. Their goal    sends a message “I am facing slow traffic near the entrance of
was to estimate the location of a photo without considering           the campus.”
the geospatial data. As result, their work reveals properties
about landmarks of a city. Van Zwol [25] characterize the               4 http://www.twitter.com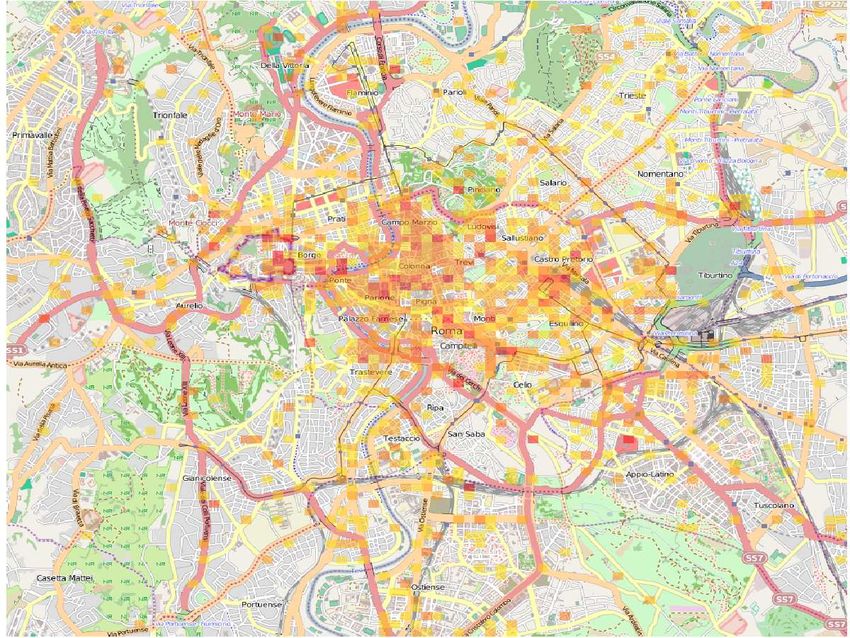
50
                                                                                                                                                             10

                                                                                  Longitude
                                                                                                      0
          (a) Time t1            (b) Time t2          (c) Time t3
                                                                                                                                                             5
                                                                                              −50

                                                                                                                                                             0
                                                                                                                     −100        0       100             φ
                                                                                                                             Latitude
                                                                                  (a) Number of photos n per pixel obtained from the
                                                                                  value of φ shown in the figure, where n = 2φ − 1.
                               (d) Overall time
                                                                                                                                         North America
Fig. 1.    Analyzed PSN: photo sharing service.                                                                                          Latin America
                                                                                                                                         Africa
                                                                                                             4                           Europe
                                                                                                            10                           Asia

                                                                                              # of photos
                                                                                                                                         Oceania
    Photo-sharing services like Instagram are examples of
participatory sensing applications. The sensed data is a picture
                                                                                                             2
of a specific place. We can extract information in many ways.                                               10
For example, we can visualize in near real time how the
situation is in a certain area of the city.
                                                                                                             0
                                                                                                            10
                                                                                                                 0          200    400         600
B. Participatory Sensor Network                                                                                              Time (hours)
    In a Participatory Sensor Network (PSN), the user’s mobile                                (b) Temporal variation of the number of photos
device is the fundamental key element to obtain sensed data.                                  shared by continent.
Individuals carrying these devices are capable of sensing the
                                                                     Fig. 2.   Coverage of the PSN of Instagram.
environment and make relevant comments about it. Thus, each
node in a PSN consists of a user with his/her mobile device.
Similar to WSNs, the sensed data is transmitted to the server,       announce photos available at Instagram, besides a plain text. In
or “sink node”. But unlike WSNs, PSNs have the following             this case, photos of Instagram announced on Twitter become
characteristics: (i) nodes are autonomous mobile entities, i.e.,     available publicly, which by default does not happen when the
a person with a mobile device; (ii) the cost of the network          picture is published solely on the Instagram system.
is distributed among the nodes, providing a global scale; (iii)
sensing depends on the willingness of people to participate              Between June 30 and July 31 of 2012, we collected
in the sensing process; (iv) nodes transmit the sensed data          2.272.556 tweets containing geotagged photos, posted by
directly to the sink; (v) nodes do not suffer from severe power      482.629 users. Each tweet consists of GPS coordinates (lat-
limitations; and (vi) the sink node only receives data and does      itude and longitude) and the time when the photo was shared.
not have direct control over the nodes.
                                                                     B. Network Coverage
    Figure 1 shows an example of a PSN comprised of photo-
sharing services, which is analyzed in the following sections.           In this section, we analyze the coverage of the PSN of
Figures 1a, 1b, and 1c represent four users at different times.      Instagram at different spatial granularities, starting around
Photos shared by users are symbolized by a dotted arrow.             the planet, then by continents and cities and ending up at
Note that not all users perform activities at all times. After a     neighborhoods. Figure 2a shows the coverage on the planet
certain interval, we can analyze the data in various ways. For       by the PSN of Instagram as a heat map of user participation:
example, Figure 1d shows a graph where the vertices represent        darker colors5 represent larger numbers of photos shared in the
the locations where the photos were shared and edges connect         particular area. Despite being a fairly comprehensive coverage
photos shared by the same user. With this graph, it is possible      on a planetary scale, it is not homogeneous. Figure 2b shows
to obtain various results of interest, considering different parts   the number of photos shared by continent along the time. Note
of the world, providing a remarkable global infrastructure at a      that the sensing activity in the Americas (North and South),
lower cost, as illustrated in Figure 2a.                             Europe and Asia is at least an order of magnitude greater than
                                                                     in Africa and Oceania. Moreover, it can be observed that the
             IV.    C HARACTERIZATION          OF I NSTAGRAM         participation of users in North America is slightly higher than
                                                                     in Latin America, Europe and Asia.
    In this section we analyze the participatory sensor network
derived from Instagram.                                                 Now we evaluate the participation of users in Insta-
                                                                     gram in eight large and populous cities in five continents:
A. Data Description                                                  New York/USA, Rio de Janeiro/Brazil, Belo Horizonte/Brazil,
                                                                     Rome/Italy, Paris/France, Sydney/Australia, Tokyo/Japan and
    The data was collected via Twitter, which offers the possi-
bility of integration with other platforms. This enables users to      5 Colors   of the heat map for all subfigures are in the same scale.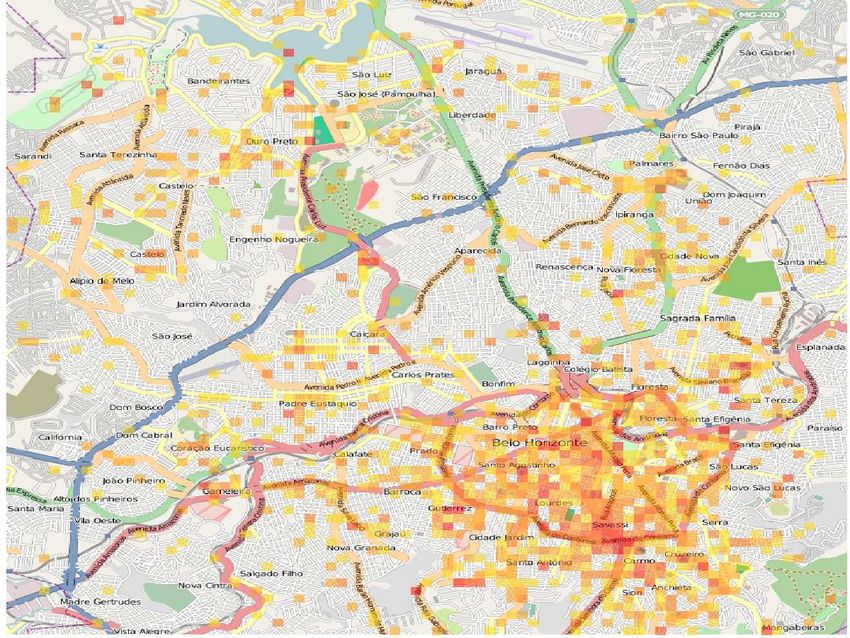
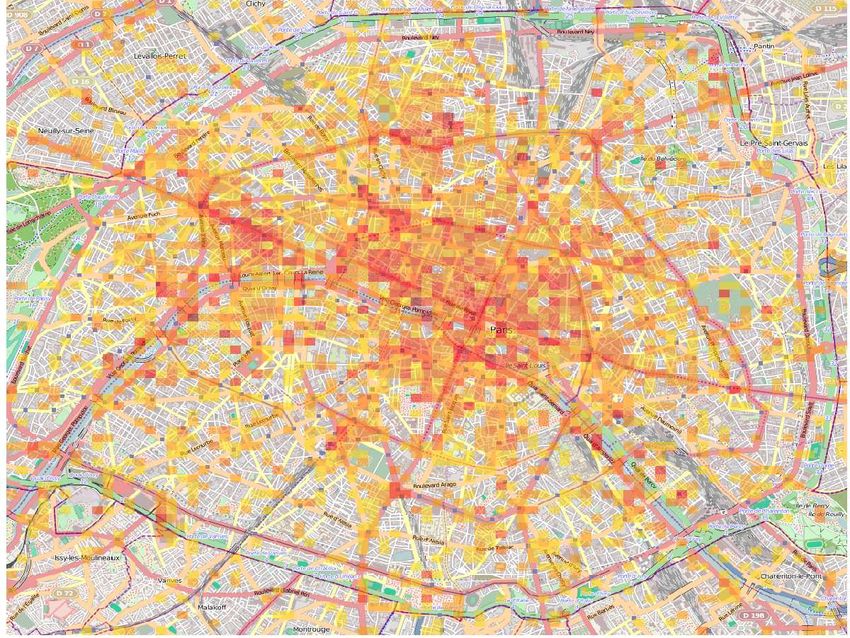
Cairo/Egypt. Figure 3 shows the heat map of the sensing                        located in the middle of the city, along with many hills that are
activity (photo sharing) in each one of these cities. Again,                   not accessible to people. These aspects limit the geographic
darker colors represent a greater number of pictures in a given                coverage of the sensing. Moreover, in both cities the points
area. We can observe a high coverage for some cities, as shown                 of public interest such as tourist spots and shopping centers
in Figures 3a (New York), 3e (Paris) and 3g (Tokyo). However,                  are unevenly distributed throughout the city. There are large
we can see in Figure 3h that the sensing in Cairo, which also                  residential areas with few points of this type, while other
has a large number of inhabitants, is significantly lower. Such                areas have large concentrations of these points. These results
difference in coverage may be explained by several factors.                    are qualitatively similar to those reported in [4], [22] for
Besides the economic aspects, differences in the culture of the                PSNs derived from three location sharing applications and for
inhabitants of this city when compared with cultures present                   different cities. This observation demonstrates the potential of
in the other cities analyzed may have a significant impact on                  Instagram as a tool for participatory sensing in large urban
the adoption and use of Instagram [28].                                        regions.

                                                                               Fig. 4.   Example of identification of a quadrant.

            (a) New York                       (b) Rio de Janeiro
                                                                                   As the users’ participation can be quite heterogeneous
                                                                               within a city, we propose to divide the area of the cities into
                                                                               smaller rectangular spaces, as in a grid. We call each rectangu-
                                                                               lar area of a quadrant within a city and, from this, we analyze
                                                                               the number of photos shared in these quadrants. In this paper,
                                                                               we consider that a quadrant has the following delimitation:
                                                                                     ◦                    ◦
                                                                               10−4 (latitude) × 10−4 (longitude). This represents an area
                                                                               of approximately 8×11 meters in New York City and 10×11
                                                                               meters in Rio de Janeiro. For other cities, the areas can also
                                                                               vary slightly, but this does not affect the analysis. We believe
          (c) Belo Horizonte                       (d) Rome                    that this is a reasonable size to represent an area of a venue,
                                                                               enabling then analysis of users’ activity at venue level in a
                                                                               city. Figure 4 illustrates the process of dividing the area of a
                                                                               city in quadrants and how it is the association of geographic
                                                                               coordinate (24.0001433; 3.000253) to a quadrant X.
                                                                                   Figure 5 presents the complementary cumulative distribu-
                                                                               tion function (CCDF) of the number of photos shared in a
                                                                               quadrant of the city of New York (Figure 5a) and all locations
                                                                               in our database (Figure 5b). First, note that in both cases, a
                                                                               power law describes well this distribution. This implies that
               (e) Paris                           (f) Sydney
                                                                               most of the quadrants have few shared photos, while there are
                                                                               few areas with hundreds. These results are consistent with the
                                                                               results presented in [4], [18], which study the participation
                                                                               of users in location sharing systems. In systems for photo
                                                                               sharing, as well as systems for location sharing, it is natural
                                                                               that some areas have more activity than others. For example, in
                                                                               tourist areas the number of shared pictures tends to be higher
                                                                               than in a supermarket, although a supermarket is usually a
                                                                               location quite popular. If a particular application requires a
              (g) Tokyo                             (h) Cairo                  more comprehensive coverage, it is necessary to encourage
                                                                               users to participate in places they normally would not. Micro-
Fig. 3. Spatial coverage of Instagram in eight cities for all shared photos.   payments or scoring systems are examples of alternatives that
The number of pictures in each area is represented by a heat map, where the    might work in this case.
scale varies from yellow to red (more intense activity).
                                                                                   As previously shown, a PSN can have planetary scale
     Furthermore, we can see that the coverage in Rio de Janeiro               coverage. However, it was also shown that such coverage can
and Sydney is more heterogeneous compared with the coverage                    be quite heterogeneous, in which large areas are practically
in Paris, Tokyo and New York. This is probably because of                      uncovered. Figure 6 shows the total network coverage con-
the geographical aspects that these cities have in common,                     sidering the temporal dimension, i.e., the number of localities
i.e., large green areas and large portions of water. Rio de                    that are active (i.e., sensed) in a given time interval considering
Janeiro, for example, has the largest urban forest in the world,               all available data. The maximum number of quadrants sensed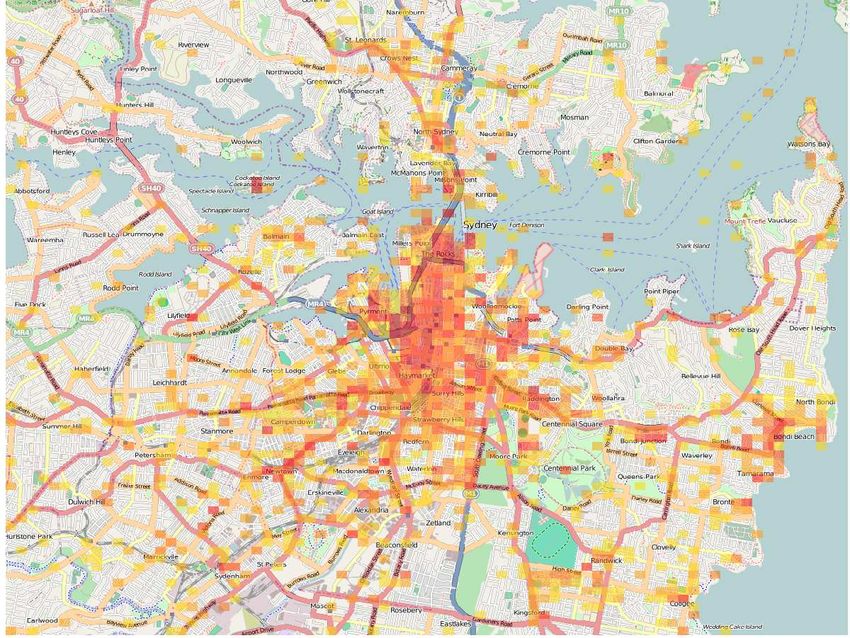
0
10 2 2
data −1 data 10 data 10 data
−1 10
10 α =2.47 α =2.8 log−logistic
ρ=1.19
Odds Ratio
P[X≥x]
P[X≥x]
# of photos
−2 −3
10 10
−3 1
10 10 0
−5
10 10
−4
10
−5 −7
10 0 1 2 3
10 0 1 2 3 0
10 10 10 10 10 10 10 10 10 0 0 2
1 2 3
# of photos # of photos 10 10 10 10 10 10
∆ (min) ∆ (min)
t t
(a) NY (b) All locations
(a) Histogram (b) Odds ratio
Fig. 5. Distribution of the number of photos in quadrants.
1
P [ x > X]
per hour corresponds to only approximately 0.2% of the total 0.5
number of areas in our dataset (1.030.558). In other words, the
instant coverage of the PSN of Instagram is very limited when
we consider all locations that could be sensed on the planet. 0 0 5
This means that the probability of a quadrant to be sensed on 10 10
∆ (min)
t
a random time is very low.
(c) CDF
Fig. 7. Distribution of the time interval between shared photos in a popular
quadrant.
# of sensed quadrants
4
10
odds ratio function (OR) of these intervals. The OR is a
cumulative function where we clearly see the distribution
10
2
behavior both in the head and in the tail. Its formula is given by
CDF (x)
OR(x) = 1− CDF (x) , where CDF(x) is the cumulative density
function, in this case, of the inter-sharing time ∆t distribution.
0
As in [30], the OR of the inter-sharing time between photos
10 also presents a power law behavior with slope ρ ≈ 1. This
0 200 400 600
Time (hours) suggests that the mechanisms behind human activities can be
simpler and more general than those proposed in the literature,
Fig. 6. Temporal variation in the number of sensed quadrants. because they depend on a lot of parameters [31]. Based on this
fact and also on Figure 7c, we can observe that a significant
portion of users performs consecutive photo sharing in a short
C. Sensing Interval time interval. About 20% of all observed sharing occurs within
Participatory sensor networks are very scalable because 10 minutes. As discussed in Section IV-E, this suggests that
their nodes are autonomous since users are responsible for their nodes tend to share more than one photo in the same area.
own operation and functioning. As the cost of infrastructure
Related to this analysis, it is interesting to verify the
is distributed among the participants, this massive scalability
feasibility of an application for near real-time visualization of
and coverage is achieved more easily. The success of such a
a certain area of a city. For that, a central question is: what
network is to have continuous participation with high quality.
is the probability to obtain one picture of an area in a given
The sensing is efficient since users are kept motivated to share
time? To address this question, we select a popular area of our
their resources and to sense data frequently.
dataset (south of Manhattan), shown in Figure 8a, and divide
Now we investigate the frequency in which users share it in eight sectors of equal size.
photos in Instagram. Figure 7a shows the histogram of the
inter-sharing time ∆t between consecutive photos in a typical Figures 8b-e show the mean probability, along with its
popular quadrant. Note that the histogram is well fitted by confidence interval of 95%, of seeing a picture in each of these
a log-logistic distribution [29] that has bursts of activity and sectors in the next 1-minute, 15-minutes, 30-minutes, and 60-
long periods of inactivity: there are times when many photos minutes. All these probabilities are calculated for four different
are shared within a few minutes and there are times when there times of the day: dawn (Figure 8b), morning (Figure 8c),
is no sharing for hours. This may indicate that the majority of afternoon (Figure 8d), and night (Figure 8e). We observe that
photo sharing, in this popular area (as in others), occurs at during the afternoon and night the difference between the
specific intervals, probably related to the time when people probability of seeing a picture in the next 15 minutes and
usually visit them. For example, sharing photos in restaurants 60 minutes are not very high in most sectors. On the other
is likely to happen during lunch and dinner times. Applications hand, during the dawn and morning this difference is more
based on this type of sensing should consider that the user expressive. This is explained by the low sharing frequency
participation can vary significantly along the time. during the dawn and morning periods, as observed in Figure 9.
Note also that even for a very popular area the probability to
Another interesting observation related to the inter-sharing obtain a picture in the next minute is very low, for all four
time ∆t can be extracted from Figure 7b, which shows the periods of the day. This means that applications that need a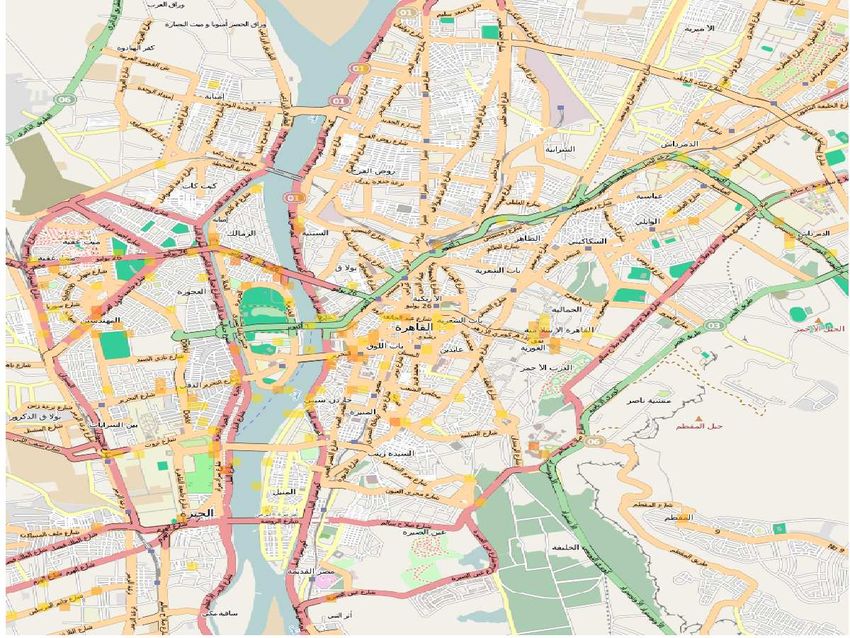
4 4
considerable amount of photos within a small interval have to x 10 4
x 10
3
Frequency of sensing
be aware that this may not be feasible. Weekday
3 Weekend
# of photos
2
The results in Figure 8 can also be used to better understand
2
those sectors. For instance, Sector 8 seems to be the least
popular among the others, despite the biggest part of water in 1
1
that sector. If we analyze the probability of a photo in the next
15-minutes, we can also see that during the dawn, Sectors 3, 0
Mon TueWed Thu Fri Sat Sun
0
2 4 6 8 10 12 14 16 18 20 22
5, and 6 are the most popular ones, which might indicate that Time (week days) Time in hours
those sectors have a more intense nightlife. This information (a) Weekly pattern (b) Aggregated - weekday and week-
could be useful, for example, in a tourist guide, being one end
feature in an algorithm to recommend areas in a city. Fig. 9. Temporal photo sharing pattern.
Considering weekdays, we can see a slight increase in
activity throughout the week, except for Tuesday, when there
is a peak of activity. Cheng et al. [15] analyze location
sharing systems and observe the same behavior. This suggests
that during the period of data collection, an unusual event
may have happened on Tuesday that resulted in an abnormal
number of shared photos. Finally, observe two peaks of activity
throughout the day, one around lunch and the other at dinner
time. Unlike the behavior observed for location sharing [15],
(a) Sectors of NY for photo sharing there is no peak of activity at breakfast time.
We also analyzed the behavioral patterns during weekdays
1
1min
15min
1 and weekends. Figure 9b shows the average number of photos
0.8 30min 0.8 shared per hour during weekdays (Monday to Friday), and also
Probability
Probability
0.6
60min
0.6 during the weekend (Saturday and Sunday). As we can see,
0.4 0.4
the peaks during weekdays happen around 13:00 (lunch) and
0.2 0.2
19:00 (dinner), but on weekends there is no peak of activity at
lunchtime. Rather, the activity remains intense throughout the
0 0
1 2 3 4 5
Sector
6 7 8 1 2 3 4 5
Sector
6 7 8 afternoon until early evening, with a slight increase at 19:00.
(b) Dawn (c) Morning 2) Selected Areas: We now turn our attention to the photo
sharing pattern throughout the day in Rio, Sao Paulo, Osaka,
1 1 Tokyo, Barcelona, Madrid, Chicago and NY during weekdays
0.8 0.8 and weekends. These results are shown in Figure 107 . It is
Probability
Probability
0.6 0.6 interesting to note that, even when we analyze separate cities,
0.4 0.4 we still do not observe, for most of the cities, a clear peak
0.2 0.2 of photo sharing around the breakfast time, as observed for
0 0
location sharing [15].
1 2 3 4 5 6 7 8 1 2 3 4 5 6 7 8
Sector Sector
Studying weekdays first, we can see that cities from Japan
(d) Afternoon (e) Night (Figure 10c), Spain (Figure 10e) and USA (Figure 10g) present
Fig. 8. Mean probability of obtain a picture in the next 1-minute, 15-minutes,
peaks of photo sharing that reflect typical lunch and dinner
30-minutes, and 60-minutes, for eight popular areas during the dawn, morning, times. On the other hand, not all peaks in the Brazilian
afternoon, and night. curves (Figure 10a) represent typical meal times. This might
indicate that Brazilians share photos in uncommon moments.
We conjecture that the peak of 6:00pm is due a “happy hour”
D. Seasonality and the peak of 9:00pm is due to a leisure activity that happens
in a pub, theater, concert, etc. Another difference is that, in
We now analyze how humans’ routines affect the data general, the Brazilian activity is more intense late at night.
sharing. First, we study all localities present in our dataset, During weekdays it is possible to observe a certain similarity
and then we study the sharing pattern for some cities from of sharing patterns between Japanese, Spanish, and American
different continents. cities.
1) All Localities: Figure 9a shows the weekly pattern of However, during the weekends these patterns are very
photo sharing in Instagram6. As expected, the network partici- distinct. The Brazilian curve still presents an unusual peak
pation presents a diurnal pattern, implying that the overnight at 5:00pm and the Spanish and American curves now present
sensing activity is quite low. more intense activity around the “brunch”/lunch time. These
6 The time of sharing was normalized according to the location where the 7 Each curve is normalized by the maximum number of photos shared in a
photo was taken. specific region representing the city.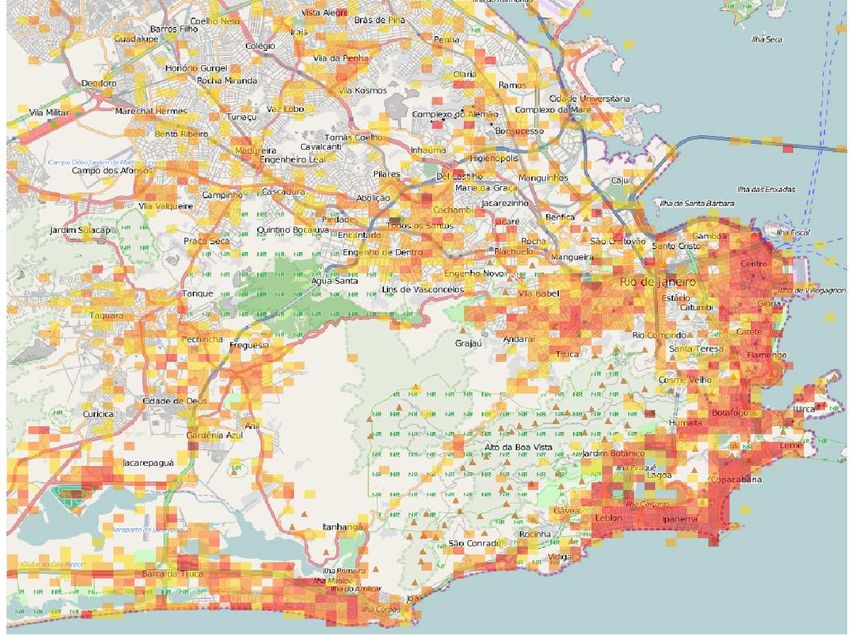
observed patterns might express cultural behaviors of inhabi- 0
10
tants of those countries, presenting somehow the signature of
a certain culture. This hypothesis is reinforced because we
−2
P[X≥x]
surprisingly see that the pattern for each city in the same 10
country is fairly similar on weekdays, and also on weekends,
at the same time, being distinct from patterns observed for −4
other countries. 10
1 1
−6
0.8 0.8
10 0 1 2 3
# of photos
# of photos
10 10 10 10
0.6 0.6 # of photos shared per user
0.4 0.4
Rio de Janeiro Rio de Janeiro
Fig. 11. Distribution of the number of photos shared by people.
0.2 0.2
Sao Paulo Sao Paulo
0 0 1 1
2 4 6 8 10 12 14 16 18 20 22 2 4 6 8 10 12 14 16 18 20 22
Hour Hour
0.8 0.8
P[x>X]
P[x>X]
(a) Brazil – Mon to Fri (b) Brazil – Sat to Sun
0.6 0.6
1 1 0.4 0.4
0.8 0.8
# of photos
# of photos
0.2 0.2
0.6 0.6
0 −5 0 5
0 −5 0 5
10 10 10 10 10 10
0.4 0.4 All inter−sharing distances (Km) Median inter−sharing dist. (Km)
Osaka Osaka
0.2 0.2 Tokyo (a) All distances (b) Median distance per user
Tokyo
0 0
2 4 6 8 10 12 14 16 18 20 22 2 4 6 8 10 12 14 16 18 20 22
Hour Hour Fig. 12. Distribution of the geographical distance between consecutive
pictures of the same person.
(c) Japan – Mon to Fri (d) Japan – Sat to Sun
1 1
0.8 0.8
geographic coordinates associated with each photo. Figure 12a
# of photos
# of photos
shows the cumulative density function of the geographic dis-
0.6 0.6
tance between each pair of consecutive photos shared by each
0.4 0.4
Barcelona
user in our dataset. It can be observed that a significant portion
Barcelona
0.2
Madrid
0.2 Madrid (about 30%) of the distances between consecutive photos are
0 0 very short (less than [1]meter). This indicates that users tend to
2 4 6 8 10 12 14 16 18 20 22 2 4 6 8 10 12 14 16 18 20 22
Hour Hour share multiple photos in the same location. This hypothesis is
(e) Spain – Mon to Fri (f) Spain – Sat to Sun reinforced by the significant portion of time intervals between
consecutive pictures of short duration shown in Figure 7c: 20%
1 1
of these intervals (∆t ) do not exceed 10 minutes. This was not
0.8 0.8 observed in the same proportion for location sharing. Noulas
# of photos
# of photos
0.6 0.6 et al. [18] observe that 20% of the shared locations happen up
0.4 0.4
to [1]km away. For shared photos, this value is approximately
Chicago
0.2
Chicago
0.2
45%. This result can be explained by the simple fact that a
New York New York
photo can contain much more information than one location.
0 0
2 4 6 8 10 12 14 16 18 20 22 2 4 6 8 10 12 14 16 18 20 22 For example, in a restaurant users could share photos of his/her
Hour Hour friends at the place, food, or a particular situation, but tend to
(g) USA - Mon to Fri (h) USA – Sat to Sun share their location only once.
Fig. 10. Photo sharing throughout the day in Rio, Sao Paulo, Osaka, Tokyo, We now analyze each user separately. Figure 12b shows
Barcelona, Madrid, Chicago and NY. the distribution of the median distance between consecutive
sharing computed for each user. Note that at least 50% of
consecutive photos of a significant portion of users (about
E. Node Behavior
20%) are taken at a very short distance (around [1]meter).
In this section we analyze the sensing activity of each indi-
Finally, we study the performance of nodes considering
vidual node (i.e., user plus smartphone) in the PSN. Figure 11
the total traveled distance, the coverage in the city of NY, and
shows that the distribution of the number of photos shared
total number of contributed photos. To analyze the coverage,
by each user of our database has a heavy tail, meaning that
we consider the area of NY (Figure 13a), which was divided
user participation may vary widely. For example, about 40%
into 27 sectors of equal size. Figure 13b shows a 3-D plot
of users contribute with only a photo during the considered
for the three dimensions considered. We are able to observe
period, while only 17% and 0.1% of users contribute more
the existence of “super nodes” in the system, indicated by
than 10 and 100 photos, respectively.
a green circle. This nodes share a lot of photos, travel long
We also analyze the geographical distance between two distances, and visit many different areas in the city (observed
consecutive photos shared by the same user, according to the by the number of unique visited sectors). The identification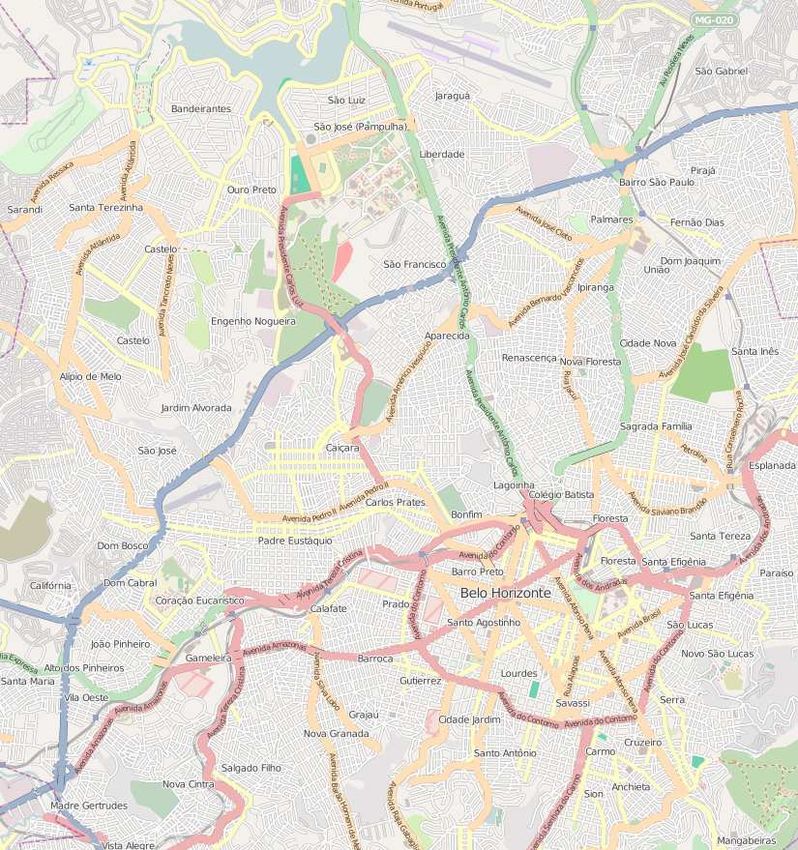
of this type of users is important for several reasons. As the                                                 from that process follows a normal distribution with
success of a PSN relies on a continuous contribution, it is                                                    mean µ and standard deviation σ. Thus, from the
interesting to award this type of user to keep them active                                                     original clusters Ck found in the previous step, we
in the network. Besides that, nodes of this type might be                                                      exclude those in which the number of photos is within
good candidates to be selected, for example, in a network for                                                  the distance 2σ from the average µ, or is in the
information dissemination a city.                                                                              range [µ − 2σ; µ + 2σ]. The idea of this step is to
                                                                                                               exclude those clusters that may have been generated
                                                                                                               by random situations, i.e., those that do not reflect
                                                                                                               the dynamics of the city.
                                   Unique sectors visited
                                                     11
                                                     10
                                                      9
                                                      8
                                                                                                          Figure 14b shows POIs obtained through this process.
                                                      7
                                                      6
                                                                                                     Observe the significant smaller number of points compared
                                                      5
                                                      4                                              with the ones shown in Figure 14a. Besides identifying POIs
                                                      3
                                                      2                                              in a city, we can also separate the sights from POIs. For this,
                                                      1
                                                      0
                                                    150
                                                                                                     first we generate a graph G(V, E), where the vertices vi ∈ V
                                                            100                                300   are all POIs and there is an edge (i, j) from the vertex vi to
                                                                                         200
                                                                    50           100                 the vertex vj if in a given time a user shared a photo on a POI
                                 # total of photos                       0 0   Total distance (Km)   vj , after having shared a photo on POI vi .
     (a) NY in 27 sectors                                         (b) Node performance                   The weight w(i, j) of an edge represents the total number
                                                                                                     of transitions performed from POI vi to POI vj considering
Fig. 13.   Contribution of nodes, distance traveled, and coverage.
                                                                                                     transitions of all users. To identify sights, we consider that
                                                                                                     most tourists follow a well-known path within the city, being
                            V.            A PPLICATION                                               guided by the main sights of it. Moreover, at each point of
                                                                                                     interest he/she takes one or more photos and goes to the next
    It is quite common to find particular areas in a city that                                       tourist spot. Thus, we consider that edges (i, j) with high
attract more attention of residents and visitors, here called                                        weights w(i, j) denote these frequent transitions from one sight
points of interest (POI). Among the most visited POIs, we can                                        to another in a city.
mention the sights of the city. However, not all POIs are sights
of a city. For example, an area of bars can be quite popular                                               After this, we exclude from G all edges (i, j) with weights
among city residents, but not among tourists. Furthermore,                                           w(i, j) smaller than a threshold t, which is given by the
POIs are dynamic, in other words, areas that are popular today                                       probability of generating w(i, j) randomly in a random graph
may not be tomorrow.                                                                                 GR (V, ER ). The identification of the value that separates edges
                                                                                                     with high weights from low weights is made as follows.
    An application that naturally emerges from analyzing In-                                         First, we create a random graph GR (V, ER ) containing the
stagram data is related to the identification of POIs in a city.                                     same nodes of G. Then, for each sequence of nu photos
This is possible because each picture represents, implicitly, an                                     fu1 , fu2 , ..., funu of each user u, we randomly assign a POI
interest of an individual at a given moment. So, when many                                           to each photo, what generates the random edges ER of GR .
users share photos in a particular location at a given moment,                                       Thus, the sequence of locations where the photos were taken
it can be inferred that this place is a POI (note Figure 5).                                         is random, but the total number of photos that were taken is
  More specifically, we formalize the process of identifying                                         preserved. The idea is to simulate random walks in a city. In
POIs by the following steps:                                                                         this random fashion, the distribution of edge weights follows
                                                                                                     a normal distribution Nw (µw , σw ) with mean µw and standard
    1)      Each pair i of coordinates (longitude, latitude) (x, y)i                                 deviation σw .
            is associated with a point pi ;
    2)      calculate the distance [32] between each pair of points                                      When the probability pw of generating an edge weight
            (pi , pj );                                                                              ≥ wt in GR (V, ER ) is, according to Nw (µw , σw ), close to
    3)      group all the points pi that have a distance smaller                                     zero, then all transitions vi → vj with w(i, j) ≥ wt are
            than [250]m into a cluster Ck . This distance threshold                                  popular, in which, according to our conjecture, are transitions
            was obtained by the method Complete-Linkage [33].                                        between sights. For our dataset, the value of wt which provides
            The result of this procedure is shown in Figure 14a,                                     a probability pw close to 0 is wt = 10. As we can see in
            in which different colors represent different clusters                                   Figure 14c, the vertices (POIs) of the resulting graph represent
            k for the city of Belo Horizonte;                                                        practically all the sights of Belo Horizonte. The areas of the
    4)      for each cluster Ck , we consider only one point                                         resulting POIs cover seven out of all the eight Landmarks
            (photo) per user. With that, the popularity of a cluster                                 recommended by TripAdvisor8 as the most important cultural
            is now based on the number of different users that                                       and leisure areas of Belo Horizonte.
            shared a photo in the cluster area. This procedure                                            Notice the difference between Figures 14b and 14c, the
            avoids considering areas visited by very few users,                                      first containing all POIs and the second only the sights of
            e.g., homes, as popular ones;                                                            the city of Belo Horizonte. This means that inhabitants could
    5)      finally, for each cluster Ck , we create an alternative                                  also use this application to explore the city. Again, this
            cluster Cr . Then, for each photo fi , we randomly                                       application is interesting because it is able to identify POIs in
            choose an alternate cluster Cr and we assign fi to
            Cr . The number of photos assigned to each cluster                                         8 www.tripadvisor.com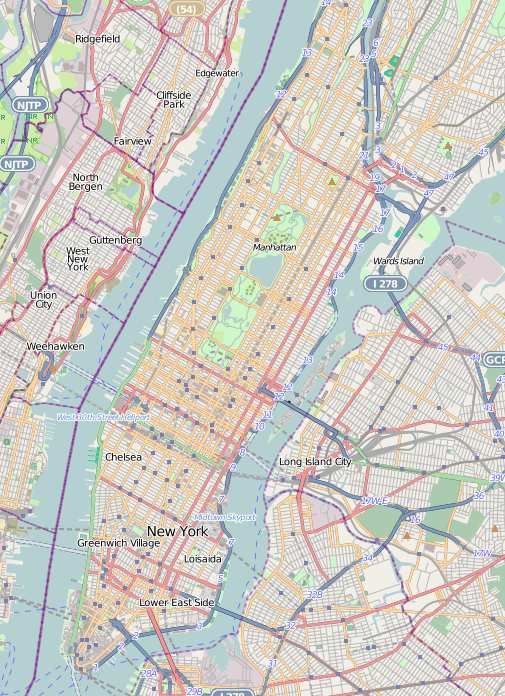
Pampulha lake

                                                                                                                              Pampulha church

                                                                                                                                                                      7 square

                                                                                                                                                 Leisure area             Palace of the arts

                                                                                                                                                 Liberty square

                                                                                                                                                                Savassi   Bandeira square

                    (a) All clusters                      (b) Points of interest                                                             (c) Sights

Fig. 14.   Points of interest of Belo Horizonte.

a spatio-temporal context, which is fundamental, since POIs            greatest peak of activity in that POI. In this case, a user could
are dynamic and change over time.                                      be aware that this event is a game of the Cruzeiro soccer team.

A. The Vibe of POIs
    Figures 14b and 14c show that a particular area (southeast)
of the city has a high concentration of POIs. This can be useful
to guide tourists in the city, for example, when choosing a hotel
location. Another interesting information for city explorers is
the time when certain POI is more popular. Intuitively, we
know that certain types of places are frequented by people
only at specific times of particular days. Figure 15 shows the
number of shared photos per hour for all days of our dataset in
different types of places. Figure 15a shows a soccer stadium.                                                          (a) Soccer stadium
In that figure, the word WD indicates that the delimitation
                                                                         # photos

                                                                                                                                # photos
                                                                                     1                                                      1
for dashed lines represents a weekend, five in total. All the                       0.5                                                    0.5
activities shown represent games that happened during the
                                                                                     0                                                      0
analyzed interval. Observe also the lack of activity between                                  Time (hour)                                                  Time (hour)
games, indicating that this is an event-oriented POI. Other                                (b) Night club 1                                           (c) Night club 2
types of POIs are also event-oriented: night clubs (Figures ref-
                                                                                                    # photos

                                                                                                                1
fig:vivePOIsb and 15c), and a convention center (Figure 15d).
Note that the activities in night clubs concentrate more during                                                0.5
weekends, on the other hand in a convention center most of                                                      0
                                                                                                                          Time (hour)
the activity happens during weekdays.
                                                                                                                     (d) Convention center
    Concerning other types of POIs, we can see in Figures 15e
                                                                         # photos

                                                                                                                                # photos

and 15f that people share photos in a mall in many different                         1                                                      1
times of the day, during weekdays and weekends. This is                             0.5                                                    0.5
expected due to the high number of different attractions that a                      0                                                      0
mall usually offers every day of the week. We also show the                                   Time (hour)                                                  Time (hour)
frequency of two of the most famous touristic attractions of                                  (e) Mall 1                                                   (f) Mall 2
Belo Horizonte in Figures 15g and 15h. The sharing pattern
                                                                         # photos

                                                                                                                                # photos

                                                                                     1                                                      1
in touristic spots are not as intense as POIs with a high                           0.5                                                    0.5
concentration of people and attractions such as malls, or as
                                                                                     0                                                      0
periodic as an event oriented POI, such as night clubs. These                                 Time (hour)                                                  Time (hour)
are powerful features for classifying POIs by their type and                               (g) Pamp. Lake                                            (h) Pamp. Church
suggesting users about the best time and day to make a visit
to it.                                                                 Fig. 15.           The temporal photo sharing pattern for different types of POIs.

    Finally, as we can see, the temporal photo sharing pattern
presents somehow a signature of POIs, meaning that may be                                   VI.    C ONCLUSION                 AND           F UTURE W ORK
possible to automatically identify anomalous events. This can
be used to capture in near real time unexpected events, such                In this work, we presented to the best of our knowledge, the
as an accident, or an event happening in an unusual place, for         first characterization of Instagram analyzing photos shared by
instance a street party or a concert on a park. After identifying      the users. We analyzed the system treating it as a participatory
those events, we could use the shared pictures to check, in near       sensing system. Thus, we discuss the spatial and temporal
real time, snapshots of those events. Figure 15a illustrates the       coverage of this network showing its global coverage. We ob-
potential of this application, showing some pictures for the           served that the frequency of photo sharing is spatio-temporal,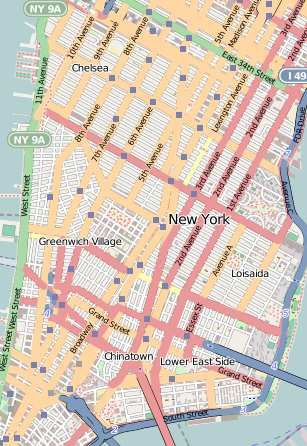
very unequal and correlated with routine human activities.                           [16]   E. Cho, S. A. Myers, and J. Leskovec, “Friendship and mobility: user
We also observed that the temporal photo sharing pattern is                                 movement in location-based social networks,” in Proc. of the 17th
surprisingly a good indicator about cultural behaviors, and also                            ACM Int. Conf. on Know. Disc. and Data Min. (KDD’11), San Diego,
                                                                                            California, USA, 2011, pp. 1082–1090.
says a lot about certain classes of places. We also discuss an
                                                                                     [17]   S. Scellato, A. Noulas, R. Lambiotte, and C. Mascolo, “Socio-spatial
application that demonstrates the potential of a PSN derived                                Properties of Online Location-based Social Networks,” in Proc. 5th
from Instagram for studying the dynamics of cities.                                         International Conference on Weblogs and Social Media (ICWSN’11),
                                                                                            Barcelona, Spain, 2011.
    As future work, we intend to analyze other PSNs and                              [18]   A. Noulas, S. Scellato, C. Mascolo, and M. Pontil, “An Empirical Study
develop new applications that exploit these networks. For                                   of Geographic User Activity Patterns in Foursquare,” in Proc. of the
example, we imagine applications that jointly consider data                                 Fifth Int’l Conf. on Weblogs and Social Media (ICWSM’11), Barcelona,
from other participatory sensing systems, such as Waze (traffic                             Spain, 2011.
conditions) and Weddar (weather), also considering different                         [19]   M. Bilandzic and M. Foth, “A review of locative media, mobile
                                                                                            and embodied spatial interaction,” International Journal of Human-
categories/interests of people.                                                             Computer Studies, vol. 70, no. 1, pp. 66–71, Jan. 2012.
                                                                                     [20]   J. Cranshaw, R. Schwartz, J. I. Hong, and N. Sadeh, “The Livehoods
                                                                                            Project: Utilizing Social Media to Understand the Dynamics of a City,”
                                                                                            in Proc. 6th International Conference on Weblogs and Social Media
                               R EFERENCES                                                  (ICWSN’11), Barcelona, Spain, 2012.
                                                                                     [21]   A. Noulas, S. Scellato, C. Mascolo, and M. Pontil, “Exploiting Semantic
 [1]   M. Weiser, “The Computer in the 21st Century,” Scientific American,                  Annotations for Clustering Geographic Areas and Users in Location-
       vol. 265, no. 3, pp. 94–104, 1991.                                                   based Social Networks,” in Proc. 5th International Conference on
 [2]   I. Akyildiz, W. Su, Y. Sankarasubramaniam, and E. Cayirci, “Wireless                 Weblogs and Social Media (ICWSM’11), Barcelona, Spain, 2011.
       sensor networks: a survey,” Computer Networks, vol. 38, no. 4, pp. 393        [22]   T. H. Silva, P. O. S. Vaz de Melo, J. M. Almeida, and A. A. F. Loureiro,
       – 422, 2002.                                                                         “Visualizing the invisible image of cities ,” in Proc. of IEEE Int. Conf.
 [3]   J. Burke, D. Estrin, M. Hansen, A. Parker, N. Ramanathan, S. Reddy,                  on Cyber, Phy. and Social Comp. (CPScom’12), Besancon, France, Nov.
       and M. B. Srivastava, “Participatory sensing,” in Workshop on World-                 2012.
       Sensor-Web (WSW’06), Boulder, Colorado, USA, 2006, pp. 117–134.               [23]   L. Rainie, J. Brenner, and K. Purcell, “Photos and Videos as Social
 [4]   T. H. Silva, P. O. S. Vaz de Melo, J. M. Almeida, and A. A. F.                       Currency Online,” Pew Research, Tech. Rep., Sep 2012.
       Loureiro, “Uncovering Properties in Participatory Sensor Networks,”           [24]   D. J. Crandall, L. Backstrom, D. Huttenlocher, and J. Kleinberg,
       in Proc. of the 4rd ACM Int. Work. on Hot Top. in Planet-scale Meas.                 “Mapping the world’s photos,” in Proceedings of the 18th international
       (HotPlanet’12), Lake District, UK, June 2012.                                        conference on World wide web, ser. WWW ’09. Madrid, Spain: ACM,
 [5]   J. Krumm, Ubiquitous Computing Fundamentals.                 Chapman &               2009, pp. 761–770.
       Hall/CRC, 1st ed., 2009.                                                      [25]   R. van Zwol, “Flickr: Who is looking?” in Proceedings of the
 [6]   K. Daniells, “Infographic: Instagram statistics 2012,” Digital Buzz Blog,            IEEE/WIC/ACM International Conference on Web Intelligence, ser. WI
       2012.                                                                                ’07. Washington, DC, USA: IEEE Computer Society, 2007, pp. 184–
 [7]   E. C. Larson, T. Lee, S. Liu, M. Rosenfeld, and S. N. Patel, “Accurate               190.
       and privacy preserving cough sensing using a low-cost microphone,”            [26]   N. D. Lane, E. Miluzzo, H. Lu, D. Peebles, T. Choudhury, and A. T.
       in Proceedings of the 13th international conference on Ubiquitous                    Campbell, “A survey of mobile phone sensing,” Comm. Mag., vol. 48,
       computing, ser. UbiComp’11. Beijing, China: ACM, 2011, pp. 375–                      no. 9, pp. 140–150, Sep. 2010.
       384.                                                                          [27]   R. Ganti, F. Ye, and H. Lei, “Mobile crowdsensing: current state and
 [8]   M. Srivastava, T. Abdelzaher, and B. Szymanski, “Human-centric                       future challenges,” Communications Magazine, IEEE, vol. 49, no. 11,
       sensing,” Philosophical Transactions of the Royal Society A:                         pp. 32 –39, november 2011.
       Mathematical, Physical and Engineering Sciences, vol. 370, no. 1958,          [28]   F. Barth, Ethnic groups and boundaries: the social organization of
       pp. 176–197, Jan. 2012. [Online]. Available: http://dx.doi.org/10.1098/              culture difference, ser. Scandinavian university books. Little, Brown,
       rsta.2011.0244                                                                       1969.
 [9]   M. Goodchild, “Citizens as sensors: The world of volunteered geogra-          [29]   P. R. Fisk, “The graduation of income distributions,” Econometrica,
       phy,” GeoJournal, vol. 69, no. 4, pp. 211–221, 2007.                                 vol. 29, no. 2, pp. 171–185, 1961.
[10]   S. B. Eisenman, E. Miluzzo, N. D. Lane, R. A. Peterson, G.-S. Ahn,            [30]   P. O. S. Vaz de Melo, C. Faloutsos, and A. A. Loureiro, “Human
       and A. T. Campbell, “Bikenet: A mobile sensing system for cyclist                    dynamics in large communication networks,” in Proc. SDM, Mesa,
       experience mapping,” ACM Transactions on Sensor Networks, vol. 6,                    Arizona, USA, 2011.
       no. 1, 2010.                                                                  [31]   R. D. Malmgren, D. B. Stouffer, A. E. Motter, and L. A. N. Amaral, “A
[11]   R. K. Rana, C. T. Chou, S. S. Kanhere, N. Bulusu, and W. Hu,                         poissonian explanation for heavy tails in e-mail communication,” Proc.
       “Ear-phone: an end-to-end participatory urban noise mapping system,”                 National Academy of Sciences, vol. 105, no. 47, pp. 18 153–18 158,
       in Proc. of the 9th ACM/IEEE Int. Conf. on Infor. Proc. in Sensor                    November 2008.
       Networks, ser. IPSN ’10. Stockholm, Sweden: ACM, 2010, pp. 105–               [32]   R. W. Sinnott, “Virtues of the Haversine,” Sky and Telescope, vol. 68,
       116.                                                                                 no. 2, pp. 159+, 1984.
[12]   S. Reddy, D. Estrin, M. Hansen, and M. Srivastava, “Examining micro-          [33]   T. Sørensen, “A method of establishing groups of equal amplitude in
       payments for participatory sensing data collections,” in Proc. of the 12th           plant sociology based on similarity of species and its application to
       ACM int. conf. on Ubiquitous computing (Ubicomp ’10). Copenhagen,                    analyses of the vegetation on Danish commons,” Biologiske Skrifter,
       Denmark: ACM, 2010, pp. 33–36.                                                       vol. 5, no. 4, 1948.
[13]   A. J. Mashhadi and L. Capra, “Quality Control for Real-time Ubiquitous
       Crowdsourcing,” in Proc. of the 2nd Int. Workshop on Ubiquitous
       Crowdsouring (UbiCrowd’11), Beijing, China, 2011, pp. 5–8.
[14]   S. Saroiu and A. Wolman, “I am a sensor, and i approve this message,”
       in Proc. of the 11th Work. on Mobile Comp. Systems and App., ser.
       HotMobile ’10. Annapolis, Maryland: ACM, 2010, pp. 37–42.
[15]   Z. Cheng, J. Caverlee, K. Lee, and D. Z. Sui, “Exploring Millions of
       Footprints in Location Sharing Services,” in Proc. of the Fifth Int’l Conf.
       on Weblogs and Social Media (ICWSM’11), Barcelona, Spain, 2011.
You can also read