Shifting attention to accuracy can reduce misinformation online
←
→
Page content transcription
If your browser does not render page correctly, please read the page content below
Article
Shifting attention to accuracy can reduce
misinformation online
https://doi.org/10.1038/s41586-021-03344-2 Gordon Pennycook1,8,9 ✉, Ziv Epstein2,3,9, Mohsen Mosleh3,4,9, Antonio A. Arechar3,5,
Dean Eckles3,6 & David G. Rand3,6,7 ✉
Received: 5 March 2020
Accepted: 8 February 2021
In recent years, there has been a great deal of concern about the proliferation of false
Published online: 17 March 2021
and misleading news on social media1–4. Academics and practitioners alike have asked
Check for updates
why people share such misinformation, and sought solutions to reduce the sharing of
misinformation5–7. Here, we attempt to address both of these questions. First, we find
that the veracity of headlines has little effect on sharing intentions, despite having a
large effect on judgments of accuracy. This dissociation suggests that sharing does not
necessarily indicate belief. Nonetheless, most participants say it is important to share
only accurate news. To shed light on this apparent contradiction, we carried out four
survey experiments and a field experiment on Twitter; the results show that subtly
shifting attention to accuracy increases the quality of news that people subsequently
share. Together with additional computational analyses, these findings indicate that
people often share misinformation because their attention is focused on factors other
than accuracy—and therefore they fail to implement a strongly held preference for
accurate sharing. Our results challenge the popular claim that people value partisanship
over accuracy8,9, and provide evidence for scalable attention-based interventions that
social media platforms could easily implement to counter misinformation online.
The sharing of misinformation on social media—including, but not lim- (for example, owing to media or digital illiteracy5,12–15 or politically
ited to, blatantly false political ‘fake news’ and misleading hyperpartisan motivated reasoning8,9,16,17). To gain initial insight into whether mis-
content—has become a major focus of public debate and academic taken beliefs are sufficient to explain the sharing of misinformation,
study in recent years1,4. Although misinformation is nothing new, the study 1 tests for a dissociation between what people deem to be accu-
topic gained prominence in 2016 after the US Presidential Election and rate and what they would share on social media. We recruited n = 1,015
the UK’s Brexit referendum, during which entirely fabricated stories American individuals using Amazon Mechanical Turk (MTurk)18, and
(presented as legitimate news) received wide distribution via social presented them with the headline, lede sentence, and image for 36
media—a problem that has gained even more attention during the actual news stories taken from social media. Half of the headlines were
COVID-19 pandemic2,7 and the Capitol Hill riot following the 2020 US entirely false and half were true; half of the headlines were chosen (via
Presidential Election10. pretest19,20) to be favourable to Democrats and the other half to be
Misinformation is problematic because it leads to inaccurate beliefs favourable to Republicans. Participants were randomly assigned to
and can exacerbate partisan disagreement over even basic facts. Merely then either judge the veracity of each headline (accuracy condition)
reading false news posts—including political posts that are extremely or indicate whether they would consider sharing each headline online
implausible and inconsistent with one’s political ideology— makes (sharing condition) (for details, see Methods). Unless noted otherwise,
them subsequently seem more true11. all P values are generated by linear regression with robust standard
In addition to being concerning, the widespread sharing of misin- errors clustered on participant and headline.
formation on social media is also surprising, given the outlandishness In the accuracy condition (Fig. 1a), true headlines were rated as
of much of this content. Here we test three competing theories of why accurate significantly more often than false headlines (55.9 percent-
people share misinformation, based respectively on (i) confusion about age point difference, F(1, 36,172) = 375.05, P < 0.0001). Although politi-
what is (in)accurate, (ii) preferences for factors such as partisanship cally concordant headlines were also rated as accurate significantly
over accuracy, and (iii) inattention to accuracy. more often than politically discordant headlines (10.1 percentage
point difference, F(1, 36,172) = 26.45, P < 0.0001), this difference based on
partisan alignment was significantly smaller than the 55.9 percent-
Disconnect between sharing and accuracy age point veracity-driven difference between true and false headlines
We begin with the confusion-based account, in which people share (F(1, 36,172) = 137.26, P < 0.0001). Turning to the sharing condition (Fig. 1b),
misinformation because they mistakenly believe that it is accurate we see the opposite pattern. Whether the headline was politically
Hill/Levene Schools of Business, University of Regina, Regina, Saskatchewan, Canada. 2Media Lab, Massachusetts Institute of Technology, Cambridge, MA, USA. 3Sloan School of
1
Management, Massachusetts Institute of Technology, Cambridge, MA, USA. 4Department of SITE (Science, Innovation, Technology, and Entrepreneurship), University of Exeter Business
School, Exeter, UK. 5Center for Research and Teaching in Economics (CIDE), Aguascalientes, Mexico. 6Institute for Data, Systems, and Society, Massachusetts Institute of Technology,
Cambridge, MA, USA. 7Department of Brain and Cognitive Sciences, Massachusetts Institute of Technology, Cambridge, MA, USA. 8Department of Psychology, University of Regina, Regina,
Saskatchewan, Canada. 9These authors contributed equally: Gordon Pennycook, Ziv Epstein, Mohsen Mosleh. ✉e-mail: gordon.pennycook@uregina.ca; drand@mit.edu
590 | Nature | Vol 592 | 22 April 2021
a Accuracy b Sharing suggest that the confusion-based account cannot fully explain the shar-
80 80 ing of misinformation: our participants were more than twice as likely
Considered for sharing (%)
70 70 to consider sharing false but politically concordant headlines (37.4%)
Rated accurate (%)
60 60 as they were to rate such headlines as accurate (18.2%; F(1, 36,172) = 19.73,
50 50 P < 0.0001).
40 40 False
One possible explanation for this dissociation between accuracy
30 30 True
judgments and sharing intentions is offered by the preference-based
20 20
account of misinformation sharing. By this account, people care about
10 10
accuracy much less than other factors (such as partisanship), and there-
0 0
Discordant Concordant Discordant Concordant fore knowingly share misinformation. The fact that participants in
Political alignment Political alignment study 1 were willing to share ideologically consistent but false headlines
c 70 could thus be reasonably construed as revealing their preference for
“When deciding whether to share a piece of content on
60 social media, how important is it to you that the content is...” weighting non-accuracy dimensions (such as ideology) over accu-
racy. Yet when asked at the end of the study whether it is important to
50
share only content that is accurate on social media, the modal response
Percentage
40
was “extremely important” (Extended Data Fig. 1). A similar pattern
30 was observed in a more nationally representative sample of n = 401
20 American individuals from Lucid22 in study 2, who rated accuracy as
10 substantially more important for social media sharing than any of the
other dimensions that we asked about (paired t-tests, P < 0.001 for all
0
Surprising Politically Funny Interesting Accurate comparisons) (Fig. 1c; for design details, see Methods).
aligned
Why, then, were the participants in study 1—along with millions of
Not at all Slightly Moderately Very Extremely other American people in recent years—willing to share misinforma-
Fig. 1 | Sharing intentions are much less discerning than accuracy
tion? In answer, we advance the inattention-based account, in which (i)
judgements—despite an overall desire to share only accurate content. In study people do care more about accuracy than other content dimensions,
1, n = 1,002 American individuals from Amazon MTurk were presented with a set of but accuracy nonetheless often has little effect on sharing, because (ii)
36 headlines and asked to indicate whether they thought the headlines were the social media context focuses their attention on other factors such
accurate or whether they would consider sharing them on social media. a, The as the desire to attract and please followers/friends or to signal one’s
fraction of headlines rated as accurate in the ‘accuracy’ condition, by the veracity group membership23–25. In the language of utility theory, we argue that
of the headline and political alignment between the headline and the participant. an ‘attentional spotlight’ is shone upon certain terms in the decider’s
Participants were significantly more likely to rate true headlines as accurate utility function, such that only those terms are weighed when making
compared to false headlines (55.9 percentage point difference, F(1, 36,172) = 375.05, a decision (for a mathematical formalization of this limited-attention
P < 0.0001), whereas the partisan alignment of the headlines had a significantly utility model, see Supplementary Information section 3).
smaller effect (10.1 percentage point difference, F(1, 36,172) = 26.45, P < 0.0001;
interaction, F(1, 36,172) = 137.26, P < 0.0001). b, The fraction of headlines that
participants said they would consider sharing in the ‘sharing’ condition, by the Priming accuracy improves sharing
veracity of the headline and political alignment between the headline and the
participant. In contrast to the accuracy condition, the effect of headline veracity
We differentiate between these theories by subtly inducing people to
was significantly smaller in the sharing condition, F(1, 36,172) = 260.68, P < 0.0001, think about accuracy, which the preference-based account predicts
whereas the effect of political concordance was significantly larger, F(1, 36,172) = 17.24, should have no effect whereas the inattention-based account predicts
P < 0.0001. Error bars indicate 95% confidence intervals based on robust standard should increase the accuracy of content that is shared (see Supplemen-
errors clustered on participant and headline, and all P values were generated using tary Information section 3.2). We first test these competing predictions
linear regression with robust standard errors clustered on participant and by performing a series of survey experiments with similar designs. In
headline. c, Participants nonetheless overwhelmingly said that they thought that the control condition of each experiment, participants were shown 24
accuracy was more important on average than partisanship (and all other content news headlines (balanced on veracity and partisanship, as in study 1)
dimensions that we asked about) when making decisions about what to share on and asked how likely they would be to share each headline on Facebook.
social media (data shown from study 2; for study 1 see Extended Data Fig. 1). In the treatment condition, participants were asked to rate the accu-
racy of a single non-partisan news headline at the outset of the study
(ostensibly as part of a pretest for stimuli for another study). They then
concordant or discordant had a significantly larger effect on sharing went on to complete the same sharing intentions task as in the control
intentions (19.3 percentage points) than whether the headline was true condition, but with the concept of accuracy more likely to be salient
or false (5.9 percentage points; F(1, 36,172) = 19.73, P < 0.0001). Accordingly, in their minds. For details of the experimental design, see Methods.
the effect of headline veracity was significantly larger in the accuracy In two experiments using American individuals recruited from MTurk
condition than in the sharing condition (F(1, 36,172) = 260.68, P < 0.0001), (study 3, n = 727; study 4, n = 780), we find that the treatment condi-
whereas the effect of concordance was significantly larger in the sharing tion significantly increased sharing discernment (interaction between
condition than in the accuracy condition (F(1, 36,172) = 17.24, P < 0.0001; headline veracity and treatment: study 3, b = 0.053, 95% confidence
for the full regression table and robustness checks, see Supplementary interval [0.032, 0.074], F(1, 17,413) = 24.21, P < 0.0001; study 4, b = 0.065,
Information section 2). Notably, the pattern of sharing intentions that 95% confidence interval [0.036, 0.094], F(1, 18,673) = 19.53, P < 0.0001)
we observe here matches the pattern of actual sharing observed in a (Fig. 2a, b). Specifically, participants in the treatment group were sig-
large-scale analysis of Twitter users, in which partisan alignment was nificantly less likely to consider sharing false headlines compared to
found to be a much stronger predictor of sharing than veracity21. those in the control group (study 3, b = −0.055, 95% confidence interval
To illustrate the disconnect between accuracy judgments and shar- [−0.083, −0.026], F(1, 17,413) = 14.08, P = 0.0002; study 4, b = −0.058, 95%
ing intentions, consider, for example, the following headline: ‘Over confidence interval [−0.091, −0.025], F(1, 18,673) = 11.99, P = 0.0005), but
500 ‘Migrant Caravaners’ Arrested With Suicide Vests’. This was rated equally likely to consider sharing true headlines (study 3, b = −0.002,
as accurate by 15.7% of Republicans in our study, but 51.1% of Republi- 95% confidence interval [−0.031, 0.028], F(1, 17,413) = 0.01, P = 0.92;
cans said they would consider sharing it. Thus, the results from study 1 study 4, b = 0.007, 95% confidence interval [−0.020, 0.033],
Nature | Vol 592 | 22 April 2021 | 591Article
a Study 3 b Study 4 P = 0.57, 95% confidence interval [−0.205, 0.113] points on a 1–5 scale;
45 45
Bayesian independent samples t-test with Cauchy prior distribution
40 40
with interquartile range of 0.707: BF10 = 0.095, providing strong evi-
Likely to share (%)
35 35
Likely to share (%)
30 30 dence for the null).
25 25 Our next survey experiment (study 5, n = 1,268) tested whether the
20 20 Control previous results generalize to a more representative sample by recruit-
15 15 Treatment ing participants from Lucid22 that were quota-sampled to match the
10 10 distribution of American residents on age, gender, ethnicity and geo-
5 5
graphical region. Study 5 also included an active control condition in
0 0
False True False True which participants were asked to rate the humorousness (rather than
Headline veracity Headline veracity accuracy) of a single non-partisan news headline at the outset of the
c
study, and an importance treatment condition that tested another
Study 5
60 approach for making accuracy salient by having participants begin the
50
study by indicating the importance they place on sharing only accu-
rate content (instead of rating the accuracy of a neutral headline). The
Likely to share (%)
40
Control results (Fig. 2c) successfully replicated studies 3 and 4. As expected,
30 Active control there were no significant differences in sharing intentions between the
20 Treatment control and the active control conditions (interaction between verac-
Importance treatment ity and condition, b = 0.015, 95% confidence interval [−0.043, 0.059],
10
F(1, 6,772) = 0.04, P = 0.84); and both treatments significantly increased
0 sharing discernment relative to the controls (interaction between
False True
veracity and condition: treatment, b = 0.054, 95% confidence interval
Headline veracity
[0.023, 0.085], F = 11.98, P = 0.0005; importance treatment, b = 0.038,
Fig. 2 | Inducing survey respondents to think about accuracy increases 95% confidence interval [0.014, 0.061], F = 9.76, P = 0.0018). See Sup-
the veracity of headlines they are willing to share. a–c, Participants in plementary Information section 2 for the full regression table.
study 3 (a; n = 727 American individuals from MTurk), study 4 (b; n = 780
American individuals from MTurk) and study 5 (c; n = 1,268 American individuals
from Lucid, quota-matched to the national distribution on age, gender, ethnicity Attending to accuracy as the mechanism
and geographical region) indicated how likely they would be to consider sharing
Next, we provide evidence that shifting attention to accuracy is the
a series of actual headlines from social media. Participants in the ‘treatment’
condition rated the accuracy of a single non-political headline at the outset of the
mechanism behind this effect by showing that the treatment condition
study, thus increasing the likelihood that they would think about accuracy when leads to the largest reduction in the sharing of headlines that partici-
indicating sharing intentions relative to the ‘control’ condition. In study 5, we pants are likely to deem to be the most inaccurate (and vice versa for
added an ‘active control’ (in which participants rated the humorousness of a the most plainly accurate headlines). A headline-level analysis finds
single headline at the outset of the study) and an ‘importance treatment’ (in a positive correlation between the effect of the treatment on sharing
which participants were asked at the study outset how important they thought it and the headline’s perceived accuracy (as measured in pre-tests, see
was to share only accurate content). For interpretability, shown here is the Supplementary Information section 1) (study 3, r(22) = 0.71, P = 0.0001;
fraction of ‘likely’ responses (responses above the midpoint of the six-point study 4, r(22) = 0.67, P = 0.0003; study 5, r(18) = 0.61, P = 0.005) (Fig. 3a–c).
Likert scale) by condition and headline veracity; the full distributions of That is, the most obviously inaccurate headlines are the ones that the
responses are shown in Extended Data Figs. 2, 3. As per our preregistered accuracy salience treatment most effectively discourages people from
analysis plans, these analyses focus only on participants who indicated that they
sharing.
sometimes consider sharing political content on social media; for analysis
Furthermore, fitting our formal limited-attention utility model to
including all participants, see Supplementary Information section 2. Error bars
the experimental data provides quantitative evidence against the
indicate 95% confidence intervals based on robust standard errors clustered on
preference-based account (participants value accuracy as much as or
participant and headline.
more than partisanship) and for the inattention-based account (par-
ticipants often do not consider accuracy) (Extended Data Table 1, Sup-
F(1, 18,673) = 0.23, P = 0.63). As a result, sharing discernment (the plementary Information sections 3.5, 3.6).
difference in sharing intentions for true versus false headlines) was 2.0 In study 6, we carried out a final survey experiment (n = 710 Ameri-
times larger in the treatment relative to the control group in study 3, can individuals from MTurk) that quantifies the relative contribution of
and 2.4 times larger in study 4. Furthermore, there was no evidence the confusion-based, preference-based and inattention-based accounts
of a backfire effect, as the treatment effect was actually significantly to the willingness to share false headlines on social media. To do so,
larger for politically concordant headlines than for politically dis- we compare the control condition to a ‘full attention’ treatment, in
cordant headlines (b = 0.022, 95% confidence interval [0.012, 0.033], which participants are asked to assess the accuracy of each headline
F(1, 36,078) = 18.09, P < 0.0001), and significantly increased discernment immediately before deciding whether they would share it (for details,
for both Democrats (b = 0.069, 95% confidence interval [0.048, 0.091], see Methods). As illustrated in Fig. 3d, the results show that, of the
F(1, 24,636) = 40.38, P < 0.0001) and Republicans (b = 0.035, 95% confidence sharing intentions for false headlines, the inattention-based account
interval [0.007, 0.063], F(1, 11,394) = 5.93, P = 0.015). See Supplementary explains 51.2% (95% confidence interval [38.4%, 62.0%]) of sharing,
Information section 2 for the full regression table. the confusion-based account explains 33.1% (95% confidence interval
Notably, there was no significant difference between conditions in [25.1%, 42.4%]) of sharing, and the preference-based account explains
responses to a post-experimental question about the importance of 15.8% (95% confidence interval [11.1%, 21.5%]) of sharing. Thus, inatten-
sharing only accurate content (t-test: t(1498) = 0.42, P = 0.68, 95% confi- tion does not merely operate on the margin, but instead has a central
dence interval [−0.075, 0.115] points on a 1–5 scale; Bayesian independ- role in the sharing of misinformation in our experimental paradigm.
ent samples t-test with Cauchy prior distribution with interquartile Furthermore, the preference-based account’s low level of explanatory
range of 0.707: BF10 = 0.063, providing strong evidence for the null), power relative to the inattention-based account in study 6 is consist-
or regarding participants’ perceptions of the importance that their ent with the model fitting results in Extended Data Table 1 and Sup-
friends place on sharing only accurate content (t-test: t(768) = −0.57, plementary Information section 3.6 described above—thus providing
592 | Nature | Vol 592 | 22 April 2021a b a b
0.10 Study 3 0.10 Study 4 80
r = 0.71 r = 0.67
0.05 0.05 70
Number of analyses
Treatment effect
Treatment effect
60
0 0 50
40
–0.05 –0.05
30
–0.10 True –0.10 True 20
False False 10
–0.15 –0.15 0
1 3 5 7 1 3 5 7 0 0.05 0.10 0.15 0.20 0.25 0.30
Perceived accuracy Perceived accuracy P value
c 0.10 Study 5 d Study 6
45 Control c
0.05 40 Treatment - rated accurate 0.02
r = 0.61
Treatment effect
Treatment - rated inaccurate NYTimes
Likely to share (%)
35
0 CNN
Change in relative
30 0.01
Confusion Inattention
tweet frequency
25 FoxNews
–0.05 Infowars
20 WashPo
0
–0.10 True 15 DailyMail
DailyWire WSJ
Preference
False 10 Western
Journal NYPost
–0.15 5 –0.01
1 3 5 7 Breitbart
0
Perceived accuracy False True DailyCaller
–0.02
0 0.25 0.50 0.75 1.00
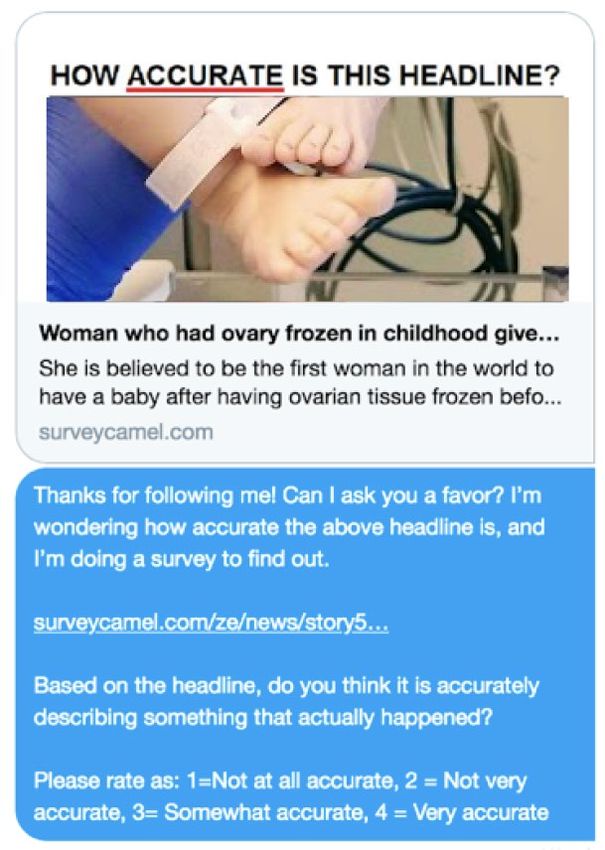
Fig. 3 | Inattention has an important role in the sharing of misinformation.
Fact-checker trustworthiness rating
a–c, There is a significant positive correlation across headlines between perceived
accuracy (on the basis of pre-tests) and the effect of the treatment on sharing in Fig. 4 | Sending Twitter users a message asking for their opinion about the
study 3 (a, r(22) = 0.71, P = 0.0001), study 4 (b, r(22) = 0.67, P = 0.0003), and study 5 accuracy of a single non-political headline increases the quality of the news
(c, r(18) = 0.61, P = 0.005). The accuracy reminder caused a larger decrease in that they subsequently share. In Study 7, we conducted an experiment on the
sharing intentions for items that were deemed to be more unlikely. This Twitter platform involving n = 5,379 users who had recently shared links to
observation supports our argument that the treatment intervention operated via websites that regularly produce misleading and hyperpartisan content. We
focusing attention on accuracy, and that many people do not want to share randomized the date on which users were sent an unsolicited message asking
content that they think is inaccurate. As shown in Extended Data Fig. 4, in study 5 a them to rate the accuracy of a single non-political headline. We then compared
similar pattern was found for the ‘important treatment’, and no such effect existed the quality of the news sites shared in the 24 h after receiving the message to
for the ‘active control’. d, In study 6, participants rated the accuracy of each the sites shared by participants who had not yet received the message. a, The
headline (a full-attention treatment) before making a judgment about sharing. private message sent to the users is shown here. We did not expect most users
This allows us to distinguish between false items that: (i) participants share to respond to the message, or even read it in its entirety. Thus, we designed it
despite believing to be inaccurate (that is, a preference-based rejection of truth); such that reading only the top line should be sufficient to shift attention to the
(ii) participants share and also believe to be accurate (that is, confusion-based); concept of accuracy. b, To test the robustness of our results, we conducted 192
and (iii) participants no longer shared once they considered accuracy (that is, analyses that differed in their dependent variable, inclusion criteria and model
inattention-based). Results indicate that, among the false headlines that are specifications. Shown here is the distribution of P values resulting from each of
shared in the control group, most are shared owing to inattention (51.2%), fewer these analyses. More than 80% of approaches yield P < 0.05. c, A domain-level
are shared because of confusion (33.1%), and a small minority are shared because analysis provides a more detailed picture of the effect of the intervention. The
of a preference to share false content (15.8%). Bootstrapping simulations (10,000 x axis indicates the trust score given to each outlet by professional
repetitions) showed that inattention explains significantly more sharing than fact-checkers27. The y axis indicates the fraction of rated links to each outlet in
purposeful sharing (b = 0.354 [0.178, 0.502], P = 0.0004); that confusion explains the 24 h after the intervention minus the fraction of links to each outlet among
significantly more sharing than purposeful sharing (b = 0.173 [0.098, 0.256], not-yet-treated users. The size of each dot is proportional to the number of
P < 0.0001); and that although inattention explained directionally more pre-treatment posts with links to that outlet. Domains with more than 500
misinformation sharing than confusion, this difference was not statistically pre-treatment posts are labelled. NYPost, New York Post; NYTimes, New York
significant (b = 0.181 [−0.036, 0.365], P = 0.098). Times; WashPo, Washington Post; WSJ, Wall Street Journal.
convergent evidence against the preference-based account being a our intervention message. For details of the experimental design,
central driver of misinformation sharing. see Methods.
Examining baseline (pre-treatment) sharing behaviour shows that
we were successful in identifying users with relatively low-quality
Deploying the intervention on Twitter news-sharing habits. The average quality score of news sources from
Finally, to test whether our findings generalize to natural social media pre-treatment posts was 0.34. (For comparison, the fact-checker-based
use settings (rather than laboratory experiments), actual (rather than quality score was 0.02 for Infowars; 0.16 for Breitbart; 0.39 for Fox News,
hypothetical) sharing decisions, and misinformation more broadly and 0.93 for the New York Times.) Moreover, 46.6% of shared news sites
(rather than just blatant ‘fake news’), in study 7 we conducted a digital were sites that publish false or misleading content (0.9% fake news
field experiment on social media26. To do so, we selected n = 5,379 Twit- sites, 45.7% hyperpartisan sites).
ter users who had previously shared links to two particularly well-known Consistent with our survey experiments, we find that the single
right-leaning sites that professional fact-checkers have rated as highly accuracy message made users more discerning in their subsequent
untrustworthy27: www.Breitbart.com and www.Infowars.com. We then sharing decisions (using Fisherian randomization inference28 to cal-
sent these users private messages asking them to rate the accuracy culate exact P values, PFRI, based on the distribution of the t statistic
of a single non-political headline (Fig. 4a). We used a stepped-wedge under the null hypothesis). Relative to baseline, the accuracy message
design to observe the causal effect of the message on the quality of increased the average quality of the news sources shared (b = 0.007,
the news content (on the basis of domain-level ratings of professional t(5375) = 2.91, 95% null acceptance region of t [−0.44, 2.59], PFRI = 0.009)
fact-checkers27) that the users shared in the 24 hours after receiving and the total quality of shared sources summed over all posts (b = 0.014,
Nature | Vol 592 | 22 April 2021 | 593Article
t(5375) = 3.12, 95% null acceptance region of t [−0.08, 2.90], PFRI = 0.011). effective, if not more so, for users with larger numbers of followers
This translates into increases of 4.8% and 9.0%, respectively, when (see Supplementary Information section 5); and that our treatment
estimating the treatment effect for user-days on which tweets would effect size estimates in study 7 are conservative because we do not know
occur in treatment (that is, excluding user-days in the ‘never-taker’ when (or if) users actually saw our intervention message.
principal stratum29,30, because the treatment cannot have an effect
when no tweets would occur in either treatment or control); including
user-days with no tweets yields an increase of 2.1% and 4.0% in aver- Conclusion
age and total quality, respectively. Furthermore, the level of sharing Together, these studies suggest that when deciding what to share on
discernment (that is, the difference in number of mainstream versus social media, people are often distracted from considering the accuracy
fake or hyperpartisan links shared per user-day; interaction between of the content. Therefore, shifting attention to the concept of accuracy
post-treatment dummy and link type) was 2.8 times higher after receiv- can cause people to improve the quality of the news that they share.
ing the accuracy message (b = 0.059, t(5371) = 3.27, 95% null acceptance Furthermore, we found a dissociation between accuracy judgments
region of t [−0.31, 2.67], PFRI = 0.003). and sharing intentions that suggests that people may share news that
To provide further support for the inattention-based account, they do not necessarily have a firm belief in. As a consequence, peo-
we contrast lower-engagement sharing (in which the user simply ple’s beliefs may not be as partisan as their social media feeds seem
re-shares content posted by another user: that is, retweets without to indicate. Future work is needed to more precisely identify people’s
comment) with higher-engagement sharing (in which the poster state of belief when not reflecting on accuracy. Is it that people hold
invests some time and effort to craft their own post or add a com- no particular belief one way or the other, or that they tend to assume
ment when sharing another post). Lower-engagement sharing, which content is true by default31?
accounts for 72.4% of our dataset, presumably involves less attention A substantial limitation of our studies is that they are focused on
than higher-engagement sharing—therefore the inattention-based the sharing of political news among American individuals. In a recent
account of misinformation sharing predicts that our manipulation set of follow-up survey experiments, our findings of a disconnect
should primarily affect lower-engagement sharing. Consistent with between accuracy and sharing judgments in study 1 and our treatment
this prediction, we observe a significant positive interaction (b = 0.008, increasing sharing discernment in studies 3, 4 and 5 were successfully
t(5371) = 2.78, 95% null acceptance region of t [−0.80, 2.24], PFRI = 0.004), replicated using headlines about COVID-19 with quota-matched Ameri-
such that the treatment increases average quality of lower-engagement can samples7. Future work should examine applications to other con-
sharing but not higher-engagement sharing. Furthermore, we found tent domains, including organized misinformation campaigns from
no significant treatment effect on the number of posts without links to political elites (such as about climate change32 or fraud in the 2020 US
any of the news sites used in our main analyses (b = 0.266, t(5375) = 0.50, Presidential Election10), and explore cross-cultural generalizability.
95% null acceptance region of t [−1.11, 1.64], PFRI = 0.505). Extending the Twitter field experiment design used in study 7 is also a
Notably, the significant effects that we observed are not unique to promising direction for future work, including using a more continuous
one particular set of analytic choices. Figure 4b shows the distribution shock-based model of how (and when) the treatment affects individu-
of P values observed in 192 different analyses assessing the overall als rather than the conservative intent-to-treat approach used here,
treatment effect on average quality, summed quality, or discernment examining more than 24 hours after the intervention, generalizing
under a variety of analytic choices. Of these analyses, 82.3% indicate a beyond users who follow-back experimenter accounts, testing an
significant positive treatment effect (and none of 32 analyses of posts active control, and using article-level quality rather than domain-level
without links to a news site—in which we would not expect a treatment quality scores.
effect—find a significant difference). For details, see Extended Data Our results suggest that the current design of social media plat-
Table 4 and Supplementary Information section 5. forms—in which users scroll quickly through a mixture of serious news
Finally, we examine the data at the level of the domain (Fig. 4c). We and emotionally engaging content, and receive instantaneous quanti-
see that the treatment effect is driven by increasing the fraction of fied social feedback on their sharing—may discourage people from
rated-site posts with links to mainstream new sites with strong editorial reflecting on accuracy. But this need not be the case. Our treatment
standards such as the New York Times, and decreasing the fraction of translates easily into interventions that social media platforms could
rated-site posts that linked to relatively untrustworthy hyperpartisan use to increase users’ focus on accuracy. For example, platforms could
sites such as Breitbart. Indeed, a domain-level pairwise correlation periodically ask users to rate the accuracy of randomly selected head-
between fact-checker rating and change in sharing due to the inter- lines, thus reminding them about accuracy in a subtle way that should
vention shows a very strong positive relationship (domains weighted avoid reactance33 (and simultaneously generating useful crowd ratings
by number of pre-treatment posts; r(44) = 0.74, P < 0.0001), replicating that can help to identify misinformation27,34). Such an approach could
the pattern observed in the survey experiments (Fig. 3a–c). In sum- potentially increase the quality of news circulating online without rely-
mary, our accuracy message successfully induced Twitter users who ing on a centralized institution to certify truth and censor falsehood.
regularly shared misinformation to increase the average quality of the
news that they shared.
In Supplementary Information section 6, we use computational mod- Online content
elling to connect our empirical observations about individual-level Any methods, additional references, Nature Research reporting sum-
sharing decisions in studies 3–7 to the network-level dynamics of mis- maries, source data, extended data, supplementary information,
information spread. Across a variety of network structures, we observe acknowledgements, peer review information; details of author contri-
that network dynamics can substantially amplify the magnitude of butions and competing interests; and statements of data and code avail-
treatment effects on sharing (Extended Data Fig. 6). Improving the ability are available at https://doi.org/10.1038/s41586-021-03344-2.
quality of the content shared by one user improves the content that
their followers see, and therefore improves the content that their fol-
1. Lazer, D. et al. The science of fake news. Science 9, 1094–1096 (2018).
lowers share. This in turn improves what the followers’ followers see and 2. Lederer, E. UN chief says misinformation about COVID-19 is new enemy. ABC News
share, and so on. Thus, the cumulative effects of such an intervention https://abcnews.go.com/US/wireStory/chief-misinformation-covid-19-enemy-69850124
on how misinformation spreads across networks may be substantially (accessed 4 April 2020).
3. Pasquetto, I. et al. Tackling misinformation: what researchers could do with social media
larger than what is observed when only examining the treated individu- data. HKS Misinformation Review 1, 8 (2020).
als—particularly given that, in study 7, we find that the treatment is as 4. Pennycook, G. & Rand, D. G. The psychology of fake news. Trends. Cogn. Sci. (in the press).
594 | Nature | Vol 592 | 22 April 20215. Guess, A. M. et al. A digital media literacy intervention increases discernment between 20. Pennycook, G., Bear, A., Collins, E. & Rand, D. G. The implied truth effect: attaching
mainstream and false news in the United States and India. Proc. Natl Acad. Sci. USA 117, warnings to a subset of fake news stories increases perceived accuracy of stories without
15536–15545 (2020). warnings. Manage. Sci. 66, 11 (2020).
6. Kozyreva, A., Lewandowsky, S. & Hertwig, R. Citizens versus the internet: confronting 21. Grinberg, N., Joseph, K., Friedland, L., Swire-Thompson, B. & Lazer, D. Fake news on
digital challenges with cognitive tools. Psychol. Sci. Public Interest 21, 103–156 twitter during the 2016 U.S. Presidential election. Science 363, 374–378 (2019).
(2020). 22. Coppock, A. & Mcclellan, O. A. Validating the demographic, political, psychological, and
7. Pennycook, G., McPhetres, J., Zhang, Y., Lu, J. G. & Rand, D. G. Fighting COVID-19 experimental results obtained from a new source of online survey respondents. Res. Polit.
misinformation on social media: experimental evidence for a scalable accuracy nudge https://doi.org/10.1177/2053168018822174 (2019).
intervention. Psychol Sci. 31, 770–780 (2020). 23. Marwick, A. E. & Boyd, D. I tweet honestly, I tweet passionately: Twitter users, context
8. Van Bavel, J. J. & Pereira, A. The partisan brain: an identity-based model of political belief. collapse, and the imagined audience. New Media Soc. 13, 114–133 (2011).
Trends Cogn. Sci. 22, 213–224 (2018). 24. Donath, J. & Boyd, D. Public displays of connection. BT Technol. J. 22, 71–82 (2004).
9. Kahan, D. M. Misconceptions, Misinformation, and the Logic of Identity-Protective 25. Mosleh, M., Martel, C., Eckles, D. & Rand, D. G. Shared partisanship dramatically increases
Cognition. Cultural Cognition Project Working Paper Series No. 164, Yale Law School, social tie formation in a Twitter field experiment. Proc. Natl Acad. Sci. USA 118,
Public Law Research Paper No. 605, Yale Law & Economics Research Paper No. 575. e2022761118 (2021).
https://doi.org/10.2139/ssrn.2973067 (2017). 26. Munger, K. Tweetment effects on the tweeted: experimentally reducing racist
10. Pennycook, G. & Rand, D. G. Research note: Examining false beliefs about voter fraud in harassment. Polit. Behav. 39, 629–649 (2017).
the wake of the 2020 Presidential Election. HKS Misinformation Rev. 2, 1 (2021). 27. Pennycook, G. & Rand, D. G. Fighting misinformation on social media using crowdsourced
11. Pennycook, G., Cannon, T. D. & Rand, D. G. Prior exposure increases perceived accuracy judgments of news source quality. Proc. Natl Acad. Sci. USA 116, 2521–2526 (2019).
of fake news. J. Exp. Psychol. Gen. 147, 1865–1880 (2018). 28. Fisher, R. A. The Design of Experiments (Oliver and Boyd, 1937).
12. McGrew, S., Ortega, T., Breakstone, J. & Wineburg, S. The challenge that’s bigger than 29. Angrist, J. D., Imbens, G. W. & Rubin, D. B. Identification of causal effects using
fake news: civic reasoning in a social media environment. Am. Educ. 41, 4–9 (2017). instrumental variables. J. Am. Stat. Assoc. 91, 444 (1996).
13. Lee, N. M. Fake news, phishing, and fraud: a call for research on digital media literacy 30. Frangakis, C. E. & Rubin, D. B. Principal stratification in causal inference. Biometrics 58,
education beyond the classroom. Commun. Educ. 67, 460–466 (2018). 21–29 (2002).
14. McDougall, J., Brites, M. J., Couto, M. J. & Lucas, C. Digital literacy, fake news and 31. Gilbert, D. T. How mental systems believe. Am. Psychol. 46, 107–119 (1991).
education. Cult. Educ. 31, 203–212 (2019). 32. Dunlap, R. E. & McCright, A. M. Organized Climate Change Denial (eds Schlosberg,
15. Jones-Jang, S. M., Mortensen, T. & Liu, J. Does media literacy help identification of fake D. et al.) 144–160 (Oxford Univ. Press, 2011).
news? Information literacy helps, but other literacies don’t. Am. Behav. Sci. 65, 371–388 33. Mosleh, M., Martel, C., Eckles, D. & Rand, D. G. Perverse consequences of debunking in a
(2019). twitter field experiment: being corrected for posting false news increases subsequent
16. Redlawsk, D. Hot cognition or cool consideration? Testing the effects of motivated sharing of low quality, partisan, and toxic content. In Proc. 2021 CHI Conference on
reasoning on political decision making. J. Polit. 64, 1021–1044 (2002). Human Factors in Computing Systems (2021).
17. Strickland, A. A., Taber, C. S. & Lodge, M. Motivated reasoning and public opinion. 34. Allen, J., Arechar, A. A., Pennycook, G. & Rand, D. G. Scaling up fact-checking using the
J. Health Polit. Policy Law 36, 935–944 (2011). wisdom of crowds. Preprint at https://doi.org/10.31234/osf.io/9qdza (2020).
18. Horton, J., Rand, D. & Zeckhauser, R. The online laboratory: conducting experiments in a
real labor market. Exp. Econ. 14, 399–425 (2011). Publisher’s note Springer Nature remains neutral with regard to jurisdictional claims in
19. Pennycook, G. & Rand, D. G. Lazy, not biased: susceptibility to partisan fake news is better published maps and institutional affiliations.
explained by lack of reasoning than by motivated reasoning. Cognition 188, 39–50
(2019). © The Author(s), under exclusive licence to Springer Nature Limited 2021
Nature | Vol 592 | 22 April 2021 | 595Article
Methods did not intend to exclude these individuals. Participants also completed
several additional measures as part of separate investigations (this was
Preregistrations for all studies are available at https://osf.io/p6u8k/. In also noted in the preregistration); namely, the seven-item cognitive
all survey experiments, we do not exclude participants for inattentive- reflection test19, a political knowledge questionnaire, and the positive
ness or straightlining to avoid selection effects that can undermine and negative affective schedule35. In addition, participants were asked
causal inference. The researchers were not blinded to the hypotheses several demographic questions (age, gender, education, income, and
when carrying out the analyses. All experiments were randomized a variety of political and religious questions). The most central politi-
except for study 2, which was not randomized. No statistical methods cal partisanship question was ‘Which of the following best describes
were used to predetermine sample size. your political preference?’ followed by the following response options:
strongly Democratic; Democratic; lean Democratic; lean Republican;
Study 1 Republican; and strongly Republican. For purposes of data analysis,
In study 1, participants were presented with a pretested set of false this was converted to a Democratic or Republican binary variable. The
and true headlines (in ‘Facebook format’) and were asked to indicate full survey is available online in both text format and as a Qualtrics file,
either whether they thought they were accurate or not, or whether along with all data (https://osf.io/p6u8k/).
they would consider sharing them on social media or not. Our predic-
tion was that the difference in ‘yes’ responses between false and true Procedure. Participants in the accuracy condition were given the fol-
news (that is, discernment) will be greater when individuals are asked lowing instructions: ‘You will be presented with a series of news head-
about accuracy than when they are asked about sharing, whereas the lines from 2017 to 2019 (36 in total). We are interested in whether you
difference between politically discordant and concordant news will be think these headlines describe an event that actually happened in an
greater when they are asked about sharing than when they are asked accurate and unbiased way. Note: the images may take a moment to
about accuracy. load.’ In the sharing condition, the middle sentence was replaced with
‘We are interested in whether you would consider sharing these stories
Participants. We preregistered a target sample of 1,000 complete re- on social media (such as Facebook or Twitter)’. We then presented par-
sponses, using participants recruited from Amazon’s MTurk but noted ticipants with the full set of headlines in a random order. In the accuracy
that we would retain individuals who completed the study above the condition, participants were asked ‘To the best of your knowledge, is
1,000-participant quota. In total, 1,825 participants began the survey. this claim in the above headline accurate?’ In the sharing condition,
However, an initial (pre-treatment) screener only allowed American participants were asked ‘Would you consider sharing this story online
participants who indicated having a Facebook or Twitter account (when (for example, through Facebook or Twitter)?’ Although these shar-
shown a list of different social media platforms) and indicated that they ing decisions are hypothetical, headline-level analyses suggest that
would consider sharing political content (when shown a list of different self-report sharing decisions of news articles such as those used in our
content types) to continue and complete the survey. The purpose of study correlate strongly with actual sharing on social media36.
these screening criteria was to focus our investigation on the relevant In both conditions, the response options were simply ‘no’ and ‘yes’.
subpopulation—those who share political news. The accuracy judg- Moreover, participants saw the response options listed as either yes/
ments of people who never share political news on social media are not no or no/yes (randomized across participants—that is, an individual
relevant here, given our interest in the sharing of political misinforma- participant only ever saw ‘yes’ first or ‘no’ first).
tion. Of the participants who entered the survey, 153 indicated that This study was approved by the University of Regina Research Ethics
they had neither a Facebook nor a Twitter account, and 651 indicated Board (Protocol 2018-116).
that they did have either a Facebook or Twitter account but would not
consider sharing political content. A further 16 participants passed Analysis plan. Our preregistration specified that all analyses would be
the screener but did not finish the survey and thus were removed from performed at the level of the individual item (that is, one data point per
the dataset. The full sample (mean age = 36.7) included 475 males, 516 item per participant; 0 = no, 1 = yes) using linear regression with robust
females, and 14 participants who selected another gender option. This standard errors clustered on participant. However, we subsequently re-
study was run on 13–14 August 2019. alized that we should also be clustering standard errors on headline (as
multiple ratings of the same headline are non-independent in a similar
Materials. We presented participants with 18 false and 18 true news way to multiple ratings from the same participant), and thus deviated
headlines in a random order for each participant. The false news head- from the preregistrations in this minor way (all key results are qualita-
lines were originally selected from a third-party fact-checking website, tively equivalent if only clustering standard errors on participant). The
www.Snopes.com, and were therefore verified as being fabricated and linear regression was preregistered to have the following independent
untrue. The true news headlines were all accurate and selected from variables: a condition dummy (−0.5 = accuracy, 0.5 = sharing), a news
mainstream news outlets to be roughly contemporary with the false type dummy (−0.5 = false, 0.5 = true), a political concordance dummy
news headlines. Moreover, the headlines were selected to be either (−0.5 = discordant, 0.5 = concordant), and all two-way and three-way
pro-Democratic or pro-Republican (and equally so). This was done interactions. (Political concordance is defined based on the match
using a pretest, which confirmed that the headlines were equally par- between content and ideology; specifically, political concordant =
tisan across the categories (similar approaches have been described pro-Democratic [pro-Republican] news (based on a pretest) for Ameri-
previously11,19,20). See Supplementary Information section 1 for details can individuals who prefer the Democratic [Republican] party over the
about the pretest. Republican [Democratic]. Politically discordant is the opposite.) Our
Participants in study 1 were also asked: ‘How important is it to you key prediction was that there would be a negative interaction between
that you only share news articles on social media (such as Facebook and condition and news type, such that the difference between false and
Twitter) if they are accurate?’, to which they responded on a five-point true is smaller in the sharing condition than the accuracy condition.
scale from ‘not at all important’ to ‘extremely important’. We also asked A secondary prediction was that there would be a positive interaction
participants about their frequency of social media use, along with between condition and concordance, such that the difference between
several exploratory questions about media trust. At the end of the concordant and discordant is larger in the sharing condition than the
survey, participants were asked whether they responded randomly accuracy condition. We also said we would check for a three-way in-
at any point during the survey or searched for any of the headlines teraction, and use a Wald test of the relevant net coefficients to test
online (for example, via Google). As noted in our preregistration, we how sharing likelihood of false concordant headlines compares totrue discordant headlines. Finally, as robustness checks, we said we and the sample of participants who would consider sharing political
would repeat the main analysis using logistic regression instead of content (mean age of 34.5) included 274 males, 451 females, and 2 who
linear regression, and using ratings that are z-scored within condition. did not answer the gender question.
In study 4, we preregistered a target sample of 1,200 participants
Study 2 from MTurk. In total, 1,328 participants began the survey between
Study 2 extended the observation of study 1 that most people self-report 28–30 November 2017. However, 8 participants did not report having
that it is important to not share accuracy information on social media. a Facebook profile and 72 participants did not finish the survey. The
First, study 2 assesses the relative, in addition to absolute, importance full sample (mean age of 33.3) included 490 males, 757 females, and
placed on accuracy by also asking about the importance of various 1 who did not answer the question. Restricting to participants were
other factors. Second, study 2 tested whether the results of study 1 responded ‘Yes’ when asked whether they ‘would ever consider sharing
would generalize beyond MTurk by recruiting participants from Lucid something political on Facebook’ excluded 468 people, such that the
for Academics, delivering a sample that matches the distribution of sample of participants who would consider sharing political content
American residents on age, gender, ethnicity and geographical region. (mean age of 33.6) included 282 males, 497 females, and 1 who did not
Third, study 2 avoided the potential spillover effects from study 1 con- answer the gender question.
dition assignment suggested in Extended Data Fig. 1 by not having In study 5, we preregistered a target sample of 1,200 participants from
participants complete a task related to social media beforehand. Lucid. In total, 1,628 participants began the survey between 30 April and
In total, 401 participants (mean age of 43.7) completed the survey on 1 May 2019. However, 236 participants reported not having a Facebook
9–12 January 2020, including 209 males and 184 females, and 8 indicat- profile (and thus were not allowed to complete the survey) and 105
ing other gender identities. Participants were asked ‘When deciding participants did not finish the survey. The full sample (mean age of 45.5)
whether to share a piece of content on social media, how important is it included 626 males and 661 females. Restricting to participants were
to you that the content is...’ and then were given a response grid where responded ‘yes’ when asked whether they ‘would ever consider sharing
the columns were labelled ‘not at all’, ‘slightly’, ‘moderately’, ‘very’, and something political on Facebook’ excluded 616 people, such that the
‘extremely’, and the rows were labelled ‘accurate’, ‘surprising’, ‘interest- sample of participants who would consider sharing political content
ing’, ‘aligned with your politics’ and ‘funny’. (mean age of 44.3) included 333 males and 338 females.
This study was approved by the MIT COUHES (protocol 1806400195). Unlike in study 1, because the question about ever sharing politi-
cal content was asked after the experimental manipulation (rather
Studies 3, 4 and 5 than at the outset of the study), there is the possibility that excluding
In studies 3, 4, and 5 we investigate whether subtly shifting attention participants who responded ‘no’ may introduce selection effects and
to accuracy increases the veracity of the news people are willing to undermine causal inference37. Although there was no significant differ-
share. In particular, participants were asked to judge the accuracy ence in responses to this political sharing question between conditions
of a single (politically neutral) news headline at the beginning of the in any of the three accuracy priming experiments (χ2 test; study 3: χ2
study, ostensibly as part of a pretest for another study. We then tested (1, n = 1,158) = 0.156, P = 0.69; study 4: χ2 (1, n = 1,248) = 0.988, P = 0.32;
whether this accuracy-cue affects the tendency of individuals to discern study 5, χ2 (3, n = 1,287) = 2.320, P = 0.51), for completeness we show that
between false and true news when making subsequent judgments about the results are robust to including all participants (see Supplementary
social media sharing. The principal advantage of this design is that the Information section 2).
manipulation is subtle and not explicitly linked to the main task. Thus,
although social desirability bias may lead people to underreport their Materials. In study 3, we presented participants with 24 news headlines
likelihood of sharing misinformation overall, it is unlikely that any from ref. 20; in study 4, we presented participants with a different set
between-condition difference is driven by participants believing that of 24 news headlines selected via pretest; and in study 5, we presented
the accuracy question at the beginning of the treatment condition participants with yet another set of 20 news headlines selected via
was designed to make them take accuracy into account when making pretest. In all studies, half of the headlines were false (selected from
sharing decisions during the main experiment. It is therefore relatively a third-party fact-checking website, www.Snopes.com, and therefore
unlikely that any treatment effect on sharing would be due to demand verified as being fabricated and untrue) and the other half were true
characteristics or social desirability. (accurate and selected from mainstream news outlets to be roughly
The only difference between studies 3 and 4 was the set of headlines contemporary with the false news headlines). Moreover, half of the
used, to demonstrate the generalizability of these findings. Study 5 used headlines were pro-Democratic or anti-Republican and the other half
a more representative sample and included an active control condition were pro-Republican or anti-Democrat (as determined by the pretests).
and a second treatment condition that primed accuracy concerns in See Supplementary Information section 1 for further details on the
a different way. Studies 3 and 4 were approved by the Yale University pretests.
Committee for the Use of Human Subjects (IRB protocol 1307012383). As in study 1, after the main task, participants in studies 3–5 were
Study 5 was approved by the University of Regina Research Ethics Board asked about the importance of sharing only accurate news articles on
(protocol 2018-116). social media (study 4 also asked about the importance participants’
friends placed on sharing only accurate news on social media). Partici-
Participants. In study 3, we preregistered a target sample of 1,200 pants then completed various exploratory measures and demograph-
participants from MTurk. In total, 1,254 participants began the survey ics. The demographics included the question ‘If you absolutely had
between 4–6 October 2017. However, 21 participants reporting not to choose between only the Democratic and Republican party, which
having a Facebook profile at the outset of the study and, as per our would do you prefer?’ followed by the following response options:
preregistration, were not allowed to proceed; and 71 participants did Democratic Party or Republican Party. We use this question to classify
not complete the survey. The full sample (mean age of 33.7) included participants as Democrats versus Republicans.
453 males, 703 females, and 2 who did not answer the question. Follow-
ing the main task, participants were asked whether they ‘would ever Procedure. In all three studies, participants were first asked whether
consider sharing something political on Facebook’ and were given the they had a Facebook account, and those who did not were not permit-
following response options: ‘yes’, ‘no’, and ‘I don’t use social media’. ted to complete the study. Participants were then randomly assigned
As per our preregistration, only participants who selected ‘yes’ to this to one of two conditions in studies 3 and 4, and one of four conditions
question were included in our main analysis. This excluded 431 people in study 5.You can also read