Food Retail Environments in Greater Melbourne 2008-2016: Longitudinal Analysis of Intra-City Variation in Density and Healthiness of Food Outlets ...
←
→
Page content transcription
If your browser does not render page correctly, please read the page content below
International Journal of
           Environmental Research
           and Public Health

Article
Food Retail Environments in Greater Melbourne
2008–2016: Longitudinal Analysis of Intra-City
Variation in Density and Healthiness of Food Outlets
Cindy Needham 1, * , Liliana Orellana 2 , Steven Allender 1 , Gary Sacks 1 ,
Miranda R. Blake 1 and Claudia Strugnell 1
 1    Institute for Health Transformation, Global Obesity Centre, Deakin University, Geelong 3220, Australia;
      steven.allender@deakin.edu.au (S.A.); gary.sacks@deakin.edu.au (G.S.);
      miranda.blake@deakin.edu.au (M.R.B.); claudia.strugnell@deakin.edu.au (C.S.)
 2    Faculty of Health, Biostatistics Unit, Deakin University, Geelong 3220, Australia; l.orellana@deakin.edu.au
 *    Correspondence: cindy.needham@deakin.edu.au; Tel.: +61-3522-73198

 Received: 14 January 2020; Accepted: 7 February 2020; Published: 19 February 2020

 Abstract: Obesity prevalence is inequitably distributed across geographic areas. Food environments
 may contribute to health disparities, yet little is known about how food environments are evolving
 over time and how this may influence dietary intake and weight. This study aimed to analyse
 intra-city variation in density and healthiness of food outlets between 2008 and 2016 in Melbourne,
 Australia. Food outlet data were classified by location, type and healthiness. Local government
 areas (LGAs) were classified into four groups representing distance from the central business district.
 Residential population estimates for each LGA were used to calculate the density of food outlets per
 10,000 residents. Linear mixed models were fitted to estimate the mean density and ratio of ‘healthy’
 to ‘unhealthy’ food outlets and food outlet ‘types’ by LGA group over time. The number of food
 outlets increased at a faster rate than the residential population, driven by an increasing density of
 both ‘unhealthy’ and ‘healthy’ outlets. Across all years, ratios of ‘unhealthy’ to ‘healthy’ outlets were
 highest in LGAs located in designated Growth Areas. Melbourne’s metropolitan food environment is
 saturated by ‘unhealthy’ and ‘less healthy’ food outlets, relative to ‘healthy’ ones. Melbourne’s urban
 growth areas had the least healthy food environments.

 Keywords: food retail; food environment; diet; obesity; urban growth

1. Introduction
     Worldwide obesity prevalence has tripled since 1975 and no country has managed to reverse this
trend [1]. Unchecked, projections estimate that more than half of the world’s adult population will be
overweight (estimated 2.16 billion) or obese (estimated 1.12 billion) by 2030 [2].
     Increasing prevalence of obesity has been linked to supply-side drivers within the global food
system, with increased production, retail, marketing and subsequent consumption of high energy,
nutrient poor and highly palatable convenience foods [3,4]. Over time, this has contributed to rapid
dietary changes. In addition, the different ways in which the global food system interacts with
local environmental factors have contributed to the wide variation in obesity prevalence between
populations [4]. Indeed, food environments, defined as the “collective economic, policy and social
surroundings, opportunities and conditions that influence people’s food and beverage choices and
nutritional status” [5] have been identified as a key influence on dietary behaviors and obesity
prevalence [6,7]. Global recommendations indicate that governments should play a leading role in
addressing these supply-side drivers by introducing fiscal measures and policies around promoting

Int. J. Environ. Res. Public Health 2020, 17, 1321; doi:10.3390/ijerph17041321       www.mdpi.com/journal/ijerph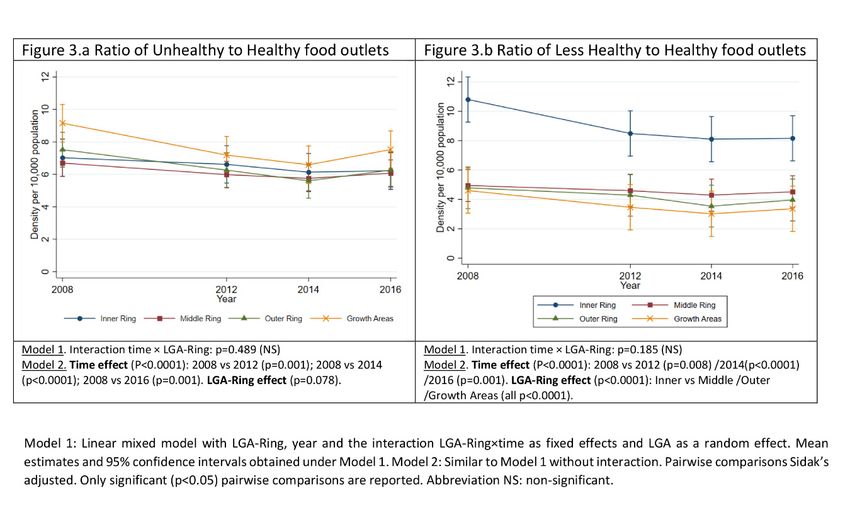
Int. J. Environ. Res. Public Health 2020, 17, 1321                                                 2 of 15

food products consistent with a healthy diet, in an effort to create health-promoting environments [3].
The International Network for Food and Obesity/non-communicable diseases Research, Monitoring and
Action Support (INFORMAS) suggest that governments across the globe should implement policies
and programmes “to support the availability of healthy foods and limit the availability of unhealthy
foods in communities and in-store (product density)” [5]. Local governments in England have been
among the first to initiate recommendations, developing proposals to regulate the proliferation of
takeaway food outlets through urban planning [8].
      Although empirical evidence of a causal relationship between food retail environments (food
environments) and obesity is currently limited [9], several US studies have demonstrated associations
between the food environment, diet and obesity among adults (≥18 years of age) [10]. In Australia,
high proportions of unhealthy relative to healthy food retail outlets (food outlets) have been associated
with higher Body Mass Index (BMI) in children [11], adults [12,13] and less healthy dietary factors
in adults [14]. Evidence also suggests that fast-food outlet exposure is associated with obesity in
Australia [15–17]. Variations in food environments across geographic areas [18–21] have been reported
that could help explain disparities in adult obesity prevalence.
      Contrasting findings from studies examining the food environment emphasise the need to
examine the food environment holistically [21]. The most common food outlet type to be measured
is supermarkets and fast-food, leaving a vast array of food outlet types unaccounted for [21].
Whilst absolute measures of access to food outlets (i.e., only a single type, or comparison of two types
of food outlets), such as supermarkets, may provide some understanding of the availability of fruit
and vegetables within an area, access to other food sources in the broader food environment is needed
to identify disparities.
      More holistic measures of the food environment, such as healthiness scores, relative measures or
dichotomous (healthy or unhealthy) classifications, have been used in recent studies [3,4]. Although
few studies have utilized relative measures, those that have report consistent findings in the expected
direction (i.e., healthier food environments associated with healthier dietary factors) more often than
those using absolute measures. This suggests that the ratio of healthy to unhealthy food stores could
be a better predictor of food purchasing and consumption behaviours, and that getting this balance
right may be key to prevention efforts [14,21,22]. However, using a dichotomous classification requires
classifying food outlets into either category, which often leads to exclusion of food outlets that do
not meet either criteria, reducing the validity of studies seeking to determine the influential nature
of the food environment [5–7]. In our study, the Food Environment Score represents a holistic food
environment classification tool, where all food outlets are given a score ranging from −10 to +10 [22].
This novel approach overcomes the limitations of dichotomous classification and enables researchers
to examine the food environment as a whole [23].
      With rapid growth in urban populations being observed globally, increasing numbers of people
are living around cities [24]. Evidence suggests that communities living in new development areas
absorbing population growth around cities may face limited access to resources, with establishment of
shops and services often withheld until sufficient population densities are present [25–27]. With regard
to the food environment, little is known about how it is evolving over time alongside population
density, particularly in Greenfield sites supporting urban growth. The United Nations emphasises
the need for sustainable management of urban growth to ensure the benefits of rapid urbanisation
are universally enjoyed, and disparities do not emerge [24]. Numerous studies have sought to
identify whether disparities in spatial access to food within the food environment exist across various
measures at a single time point [28,29]. Despite the growing number of studies, the evidence as to the
mechanism behind disparities forming within food environments is inadequate, emphasising the need
for longitudinal studies which are currently lacking [21].
      Australia’s major cities are experiencing rapid population growth and expansion. For example,
the state of Victoria, in Australia’s south-east, has experienced growth of almost 30% between 2008
and 2018 [30] with the population projected to almost double from 4.5 million in 2017 to 8 million by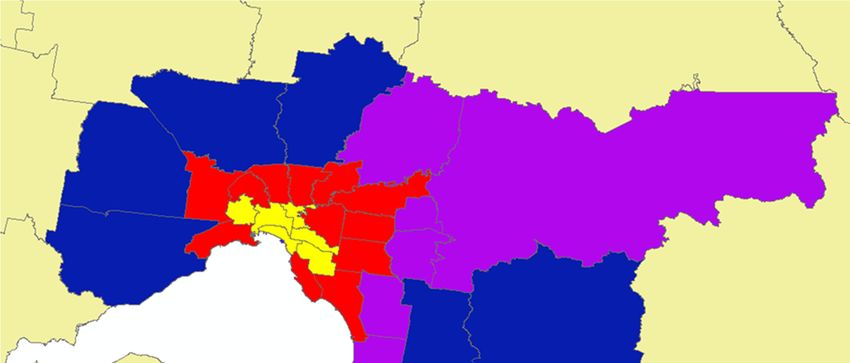
Int. J. Environ. Res. Public Health 2020, 17, 1321                                                    3 of 15

2050 [31,32]. Of Victoria’s 79 local government areas (LGAs), the Victorian Department of Environment,
Land, Water and Planning expect half of this growth to occur in six LGAs on Melbourne’s urban fringe
designated as ‘Victorian Growth Areas’ (Growth Areas) [33]. State government strategic documents set
planning standards for Growth Areas including that at least 80% of households should be within 1 km
of a town center (an important community focal point with a mix of uses to meet local needs) where
there is provision for a supermarket; and, within reach by public transport of a “viable convenience
store” [34]. The state government is currently yet to provide similar standards for ‘established’ LGAs
(n = 73) regarding access to supermarkets or other food outlets.
      Growth Areas experience higher rates of obesity than established areas of Greater Melbourne
(Melbourne), with food environment disparities increasingly being examined to determine their
potential contribution to the disproportionate prevalence of people with obesity [26,35]. In 2013,
Murphy et al. [35] examined whether or not planning standards were being achieved in Growth Areas.
Their study found that only 26% of households in Growth Areas were within 1 km of a supermarket [35].
Further studies have also reported greater access to supermarkets in established LGAs compared to
Growth Areas in Melbourne [35–37]. In contrast, another study found that there was greater access to
fast-food outlets (e.g., takeaway franchises) in established LGAs [26], although a different study found
that fast-food and independent takeaway outlets were ubiquitous across Melbourne [36]. In-store
healthiness has also been shown to vary by geographic area, with shelf space in supermarkets located in
urban fringe areas (i.e., Growth Areas and LGAs located in the outer ring of Melbourne) dedicating less
shelf space to sales of fruit and vegetables and having more checkouts with non-alcoholic carbonated
beverages than other urban areas [38].
      In this paper, we aimed to explore changes in the food environment across geographic areas in
metropolitan Melbourne between 2008 and 2016. We formulated the following research questions:

1.     How did the density of food outlets change in Melbourne between 2008 and 2016?
2.     Did the ‘healthiness’ of food outlets in Melbourne vary with distance from Central Business
       District; and, how has this changed over time between 2008 and 2016?
3.     Did the density of different types of food outlets vary with distance from Central Business District
       in Melbourne; and, how has this changed over time between 2008 and 2016?

2. Materials and Methods

2.1. Study Design
     A repeat cross-sectional study examining the food environment in Melbourne, Australia, over eight
years at four time points (2008, 2012, 2014, and 2016) was carried out.

2.2. Food Outlet Data Collection and Management
      Retrospective food outlet data (food outlet name, type, address) for all Melbourne LGAs (n =
31) was extracted from hard copy Yellow and White Pages business directories for 2008, 2012, 2014,
and 2016. Data extracted for each calendar year were food outlet name; address; Yellow Pages classification
if applicable; and data source (i.e., Yellow Pages or White Pages). Outlet address and suburb was matched
with postcode and LGA using the Victorian Electorates by Locality and Postcode dataset [39].
      The particular years selected align with state surveys on health outcomes [40],
providing opportunities for investigating associations between the food environment and health
outcomes, such as relationships with weight status and dietary intake. Yellow Pages and White
pages publish government and commercial lists of businesses from information provided by
telecommunications services [41]. These businesses are listed under subheadings/categories. Due to the
retrospective nature of this study, ground truthing was not performed. However, limited virtual ground
truthing was carried out in 2019. This involved checking whether outlets that were listed in early
years of the study, but not subsequent years, were still operating. If the outlet was found to still be in
operation in 2019, it was assumed that the outlet was in fact in operation until 2018, even if they were not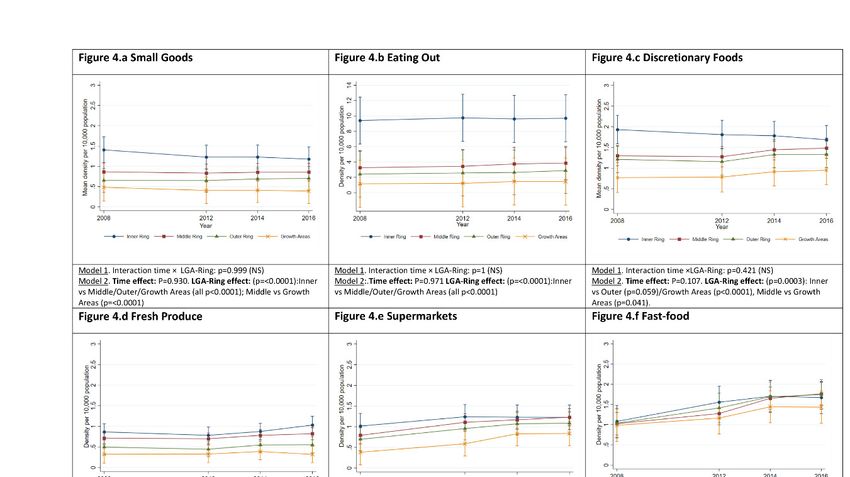
Int. J. Environ. Res. Public Health 2020, 17, 1321 4 of 15
listed as such. Virtual ground truthing was conducted in May 2019, and involved Google and Google
Street View searches for the food outlets at the specified address, inspection of the retailer’s website,
store front and internal photos, food offerings and menu if available. A relevant Australian food retail
outlet classification tool from a validated study was utilised to identify the subheadings/categories
that would be extracted [22]. Supplementary Table S1 presents the classifications and subheadings
extracted from the Yellow and White Pages.
Data extraction excluded a limited number of retailers where the primary product for sale was
not food, as they were unlikely to be visited on a day-to-day basis to purchase food (e.g., pharmacies
and liquor stores); or, where the business listing subheading/categorisation was not consistently listed
across the study period (e.g., ‘nut shop’ was listed in 2008 and 2012 but not 2014 or 2016).
Duplicate food outlets (same name, shop number and address) within a particular year were
removed. Consistent with previous food environment studies, food outlets within the Central Business
District (CBD; Postcode: 3000) were excluded due to outlets in this area largely servicing visitors (i.e.,
employees or tourists) [42].
Int. J. Environ. Res. Public Health 2020, 17, x FOR PEER REVIEW 4 of 16
2.3. Food Outlet Data Preparation
that would be extracted [22]. Supplementary Table S1 presents the classifications and subheadings
extracted from the Yellow and White Pages.
Data extraction excluded a limited number of retailers where the primary product for sale was
2.3.1. Food Outlet Classification Tool
not food, as they were unlikely to be visited on a day-to-day basis to purchase food (e.g., pharmacies
and liquor stores); or, where the business listing subheading/categorisation was not consistently
The Food Environment Scorethe(FES)
listed across tool [22]
study period wasshop’
(e.g., ‘nut usedwasto attribute
listed in 2008 anda healthiness
2012 but not 2014score to food outlets.
or 2016).
It uses a 20-point scoring system ranging between −10 (least healthy) and +10 (most healthy)
Duplicate food outlets (same name, shop number and address) within a particular year were [22].
removed. Consistent with previous food environment studies, food outlets within the Central
The FES is a healthiness rating system developed specifically for Australian food
Business District (CBD; Postcode: 3000) were excluded due to outlets in this area largely servicing outlet types in
Australian residential communities
visitors (i.e., employeesand was considered
or tourists) [42]. the most relevant tool for this study [22].
In developing the tool, twenty-six
2.3. Food Outlet Australian
Data Preparationpublic health nutrition experts took part in two rounds of
a modified Delphi Survey in 2013 and 2014, with median healthiness scores from both rounds highly
2.3.1. Food Outlet Classification Tool
correlated. The FES also closely aligns with an earlier healthiness classification tool developed by
The Food Environment Score (FES) tool [22] was used to attribute a healthiness score to food
Australian and international
outlets. Itacademic
uses a 20-point researchers
scoring system with ranginghealthiness
between −10 (least values
healthy)attributed to food outlets
and +10 (most healthy)
[22]. The[23].
falling within a close range FES is aBoth
healthiness rating systemrating
healthiness developed specifically
tools have forreported
Australian food outlet types inresults in
significant
Australian residential communities and was considered the most relevant tool for this study [22]. In
earlier studies examining the relationship
developing between
the tool, twenty-six thepublic
Australian healthiness of the
health nutrition food
experts tookenvironment
part in two rounds inofAustralia
a modified One
and dietary behaviors [14,23]. Delphiof Survey
thesein 2013 and 2014,
tools alsowith median healthiness
reported a strong scores from both
positive rounds highly between
correlation
correlated. The FES also closely aligns with an earlier healthiness classification tool developed by
the FES tool and a previously
Australian andrecognized
international scoring ratio [14].
academic researchers In applying
with healthiness the FEStotool
values attributed to this study,
food outlets
falling within a close range [23]. Both healthiness rating
we adapted the tool to include an additional food outlet type ‘salad bar/sushi bar’, which wetools have reported significant results in assigned
earlier studies examining the relationship between the healthiness of the food environment in
a healthiness score of +5. Thisand
Australia adaptation was[14,23].
dietary behaviors made Oneto
of reflect
these toolsrelatively
also reportedrecent changes
a strong positive in Australian
correlation
food environments, in consultation with a registered dietitian.
between the FES tool and a previously recognized scoring ratio [14]. In applying the FES tool to this
study, we adapted the tool to include an additional food outlet type ‘salad bar/sushi bar’, which we
assigned a healthiness score of +5. This adaptation was made to reflect relatively recent changes in
2.3.2. Food Outlet Classification
Australian food environments, in consultation with a registered dietitian.
Food outlets were classified intoClassification
2.3.2. Food Outlet one of 17 food outlet types using the adapted FES (Supplementary
Table S2) by the lead author,Foodwith cross
outlets validation
were of one
classified into percent
one of = 491)
17 food(noutlet typesofusing
the sample by FES
the adapted a registered
(Supplementary Table S2) by the lead author, with cross validation of one percent (n = 491) of the
dietitian. Store types were collapsed into seven groups based on similarity in regard to the FES
sample by a registered dietitian. Store types were collapsed into seven groups based on similarity in
definitions, food offerings and
regard healthiness
to the score;
FES definitions, food and finally
offerings into three
and healthiness groups
score; according
and finally to healthiness
into three groups
according to healthiness score (Table 1).
score (Table 1).
Table 1. Food outlet classifications.
Table 1. Food outlet classifications.
Food Outlets Grouped by ‘Type’ Food Outlets Grouped by ‘Healthiness’ Score
1. Supermarkets: Minor and Major
1. Healthy (FES range: +5 to +10): Supermarkets,
Food Outlets Grouped bySupermarkets
‘Type’ Food Outlets Grouped by ‘Healthiness’ Score
Fruit and greengrocer, Butcher, Fish, Poultry shop,
2. Fresh Produce: Fruit and greengrocer,
1. Supermarkets: Minor and Major Supermarkets 1. Healthy (FES range: +5 to +10):bar.
Salad/Sandwich/Sushi Supermarkets, Fruit and
Butcher, Fish, Poultry shop
2. Fresh Produce: Fruit and greengrocer, Butcher, Fish, Poultry shop greengrocer, Butcher, Fish, Poultry shop, Salad/Sandwich/Sushi bar.
3. Eating Out: Cafes and Restaurants
3. Eating Out: Cafes and Restaurants(Independent
(Independent andand Franchise),
Franchise), and Pubs
and Pubs
2. Less
2.
Healthy (FES range: −4 to +4): Cafes and Restaurants
Less Healthy (FES range: −4 to +4): Cafes and
4. Small Goods: Bakers,4.Delis, Sandwich
Small Goods: andDelis,
Bakers, SushiSandwich (Independent and Franchise), Bakers, Delis.
Restaurants (Independent and Franchise), Bakers, Delis.
5. Fast-food: Takeaway Franchise and Sushi 3. Unhealthy (FES range: −10 to −5): Fast-food, Takeaway
6. Takeaways: Takeaway Independent
5. Fast-food: Takeaway Franchise independent,
3. UnhealthyPubs,
(FESGeneral stores
range: −10 and
to −5): Specialty extra.
Fast-food,
7. Discretionary Foods *: General stores and Specialty extra
6. Takeaways: Takeaway Independent
Takeaway independent, Pubs, General stores and
FES: Food Environment7.Score Discretionary Foods *: General stores
reflects the perceived healthiness value allocated to
and Specialty extra
particular
Specialty extra. food outlet types.
Range: −10 to +10. * Discretionary Foods are described in the Australian Dietary Guidelines as foods and drinks
FES: Food Environment Score reflects the perceived healthiness value allocated to particular food
“not necessary for a healthyoutlet
diet and
types.are too high
Range: −10 toin saturated
+10. fat and/or
* Discretionary Foods added sugars,
are described in added salt orDietary
the Australian alcohol or low
in fibre” [43].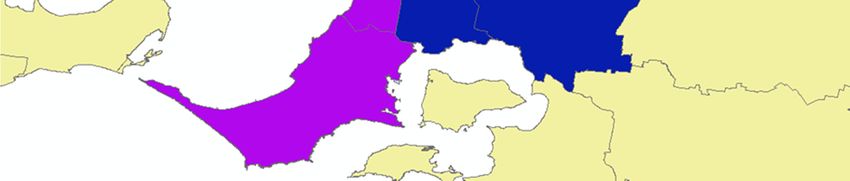
Int. J. Environ. Res. Public Health 2020, 17, x FOR PEER REVIEW                                                5 of 16
Int. J. Environ. Res. Public Health 2020, 17, 1321                                                                         5 of 15
             Guidelines as foods and drinks “not necessary for a healthy diet and are too high in saturated fat
             and/or added sugars, added salt or alcohol or low in fibre” [43].
2.4. Classification of Local Government Areas (LGAs)
      2.4. Classification of Local Government Areas (LGAs)
     Each of Melbourne’s 31 LGAs was classified using a method adapted from an earlier study [27] as
          Each of Melbourne’s 31 LGAs was classified using a method adapted from an earlier study [27]
Inner Ring (n = 6), Middle Ring (n = 12), and Outer Ring (n = 7) based on the ring-like placement of
     as Inner Ring (n = 6), Middle Ring (n = 12), and Outer Ring (n = 7) based on the ring-like placement
the LGAs   around the CBD (Figure 1). A fourth group was defined comprising of six LGAs identified
     of the LGAs around the CBD (Figure 1). A fourth group was defined comprising of six LGAs
as Growth    Areas
     identified     (n = 6),Areas
                as Growth      a classification    also usedalso
                                    (n = 6), a classification in earlier studiesstudies
                                                                 used in earlier  and strategic   documents
                                                                                        and strategic        [35,44].
                                                                                                      documents
This classification
     [35,44]. This classification will be referred to as ‘LGA-Rings’ (Supplementary Table S3 presents eachname
                     will be  referred   to  as ‘LGA-Rings’    (Supplementary    Table  S3 presents  each LGA
within
     LGAeach  LGA-Ring).
           name  within each LGA-Ring).

      Figure 1. Local
          Figure         government
                  1. Local   governmentareas
                                           areasclassified
                                                 classified by ring-like
                                                               ring-likeplacement
                                                                          placement    around
                                                                                     around      Melbourne’s
                                                                                              Melbourne’s       Central
                                                                                                           Central
      Business District
          Business       (LGA-Rings).
                    District  (LGA-Rings).Local
                                            Local Government     Areas:
                                                  Government Areas: Yellow = Inner=Ring;
                                                                         Yellow     InnerRedRing;      = Middle
                                                                                                  RedRing;
                                                                                             = Middle      Purple =Ring;
      Purple = Outer
          Outer        Ring;
                Ring; Blue     Blue =
                           = Growth   Growth Areas.
                                    Areas.

2.5. Food   Environment
      2.5. Food          Measures
                Environment Measures

     Two Two     previously
           previously    usedused    measures
                                 measures        [12,20,45]
                                             [12,20,45]   werewere   derived
                                                                  derived    toto  describethe
                                                                                describe     thefood
                                                                                                 foodenvironment
                                                                                                        environment at the LGA
     LGA    level:  (1) density   of  food   outlets  by  ‘type’   and  ‘healthiness’
level: (1) density of food outlets by ‘type’ and ‘healthiness’ (number of outlets per     (number    of  outlets  per population)
                                                                                                              10,000   10,000
     population)     and  (2)  ratio  of ‘unhealthy’    (or  ‘less healthy’)    to  ‘healthy’  food
and (2) ratio of ‘unhealthy’ (or ‘less healthy’) to ‘healthy’ food outlets. Density is a measure      outlets.  Density   is a   of
     measure of availability of food outlets of a given ‘type’ within the LGA, while the ratio reflects LGA
availability of food outlets of a given ‘type’ within the LGA, while the ratio reflects LGA resident
     resident exposure to ‘unhealthy’ (or ‘less healthy’) food outlets relative to ‘healthy’. Density of food
exposure to ‘unhealthy’ (or ‘less healthy’) food outlets relative to ‘healthy’. Density of food outlets
     outlets per 10,000 population was calculated for the seven food outlet ‘types’ and three ‘healthiness’
per 10,000
     groups. population
               Populationwas       calculated
                              estimates         forLGA
                                          for each   the seven
                                                           and yearfood   outlet
                                                                       were         ‘types’
                                                                               sourced       and
                                                                                          from  thethree   ‘healthiness’
                                                                                                     Australian   Bureau groups.
                                                                                                                            of
Population    estimates
     Statistics  [30]. Forfor
                            eacheach
                                   LGALGA andand  year
                                               year,  thewere
                                                           ratiosourced     from the
                                                                  of ‘unhealthy’        Australian
                                                                                      outlets          Bureau
                                                                                              (and ‘less         of Statistics
                                                                                                           healthy’  outlets) [30].
For each   LGA
     relative  to and   year,outlets
                  ‘healthy’    the ratio
                                      wasof   ‘unhealthy’
                                            calculated   as theoutlets
                                                                 number (and    ‘lessoutlets
                                                                           of food     healthy’   outlets)
                                                                                              classified  as relative  to ‘healthy’
                                                                                                             ‘unhealthy’   (or
outlets was
     ‘less    calculated
           healthy’)        as the
                      divided        number
                                 by the  numberof food    outlets
                                                  of stores         classified
                                                              classified          as ‘unhealthy’ (or ‘less healthy’) divided
                                                                          as ‘healthy’.
by the number of stores classified as ‘healthy’.
      2.6. Statistical Analysis
2.6. Statistical Analysis
           The unit of observation for this study was LGA. Linear mixed models were fitted to estimate the
      meanunit
      The   of each food environment
                of observation for thismeasure across
                                        study was     LGA-Rings
                                                   LGA.         and years.
                                                         Linear mixed       First,were
                                                                        models    we fitted
                                                                                       fitteda to
                                                                                               model
                                                                                                  estimate
the mean of each food environment measure across LGA-Rings and years. First, we fitted a model
including LGA-Ring, time (year as a categorical variable) and the interaction LGA-Ring × time as fixed
effects, and LGA as random effect (Model 1). When the interaction was non-significant the same model
(Model 2) was fitted excluding the interaction term. Sidak adjusted pairwise comparisons are reported
Int. J. Environ. Res. Public Health 2020, 17, 1321                                                                                   6 of 15

(a) within LGA-Rings between years or within year between LGA-Rings for outcomes with significant
interaction (Model 1); and (b) between levels of each factor, LGA-Ring or year (Model 2). Stata version
15.0 was used for all statistical analyses [46].
     Approval for ethics exemption was granted by the Ethics Committee from the lead
author’s institution.

3. Results
     The population of Greater Melbourne increased by 21% from 4.02 million in 2008 to 4.85 million
in 2016. Over the same period, the total number of food outlets increased by 35% from 10,777 to 13,580
and density increased by 3.1 outlets per 10,000 population from 24.9 to 28.0 (Table 2). Between 2008
and 2016, the food outlet density increased for Sushi Bars (470% growth), Major Supermarkets (226%),
Restaurant Café Franchise (67%) and Fast-food Franchise (59%) and decreased for Poultry (−83.8%)
and Sandwich shops (−39.5%).

      Table 2. Annual resident population estimates, number of food outlets and average density per
      10,000 population across Greater Melbourne’s 31 local government areas from 2008 to 2016.

                     Measures                                                   Year
                                                     2008           2012                   2014           2016       % Change #
         Greater Melbourne population          4,020,094          4,356,752             4,566,216      4,851,674         20.7
         Food outlet classification
                                                      Number of outlets (density per 10,000 population)
         (healthiness value):
         Total                                 10,077 (25)      11,415 (26.2)          12,943 (28.4)   13,580 (28)    +34.8(11.7)
         Baker (0)                                804 (2)        841 (1.93)              879 (1.93)     911 (1.88)    +13 (−6.11)
         Butcher (+9)                           386 (0.96)       422 (0.97)              489 (1.07)     502 (1.03)     +30 (7.76)
         General Stores (−5)                    532 (1.32)        523 (1.2)              664 (1.45)     687 (1.42)      +29 (7)
         Delicatessen (0)                       297 (0.74)        262 (0.6)              255 (0.56)     253 (0.52)   −15 (−29.42)
         Fruit & Greengrocer (+10)             304 (0.76)        278 (0.64)             330 (0.72)     337 (0.69)     +11 (−8.15)
         Fish Shop (+9)                         110 (0.27)       118 (0.27)              177 (0.39)     181 (0.37)    +65 (36.34)
         Major Supermarkets (+5)                 99 (0.25)       309 (0.71)              394 (0.86)      390 (0.8)   +294 (226.42)
         Minor Supermarkets (+5)                440 (1.09)       508 (1.17)              552 (1.21)     639 (1.32)    +45 (20.34)
         Poultry Shop (+9)                       97 (0.24)        90 (0.21)              128 (0.28)      19 (0.04)   −80 (−83.77)
         Pubs (−5)                              290 (0.72)        339 (0.78)             323 (0.71)     357 (0.74)     +23.1 (2)
         Restaurant Café Franchise (0)           98 (0.24)        152 (0.35)             247 (0.54)     198 (0.41)   +102 (67.41)
         Restaurant Café Independent (0)       3468 (8.63)       3910 (8.97)            4317 (9.45)    4672 (9.63)    +35 (11.63)
         Sandwich shop (+5)                      78 (0.19)        48 (0.11)               58 (0.13)      57 (0.12)   −27 (−39.45)
         Specialty Core (+5)                   106 (0.26)        149 (0.34)              230 (0.5)      245 (0.5)    +131 (91.52)
         Specialty Extra (−8)                  427 (1.06)        486 (1.12)             520 (1.14)     550 (1.13)      +29 (6.73)
         Sushi bar (+5)                          17 (0.04)       112 (0.26)               136 (0.3)     117 (0.24)   +588 (470.27)
         Fast-food Franchise (−10)              405 (1.01)       560 (1.29)              720 (1.58)     779 (1.61)    +92 (59.38)
         Takeaway Independent (−8)             2119 (5.27)       2308 (5.3)             2524 (5.53)    2686 (5.54)     +27 (5.03)
                                                        # % change 2008 to 2016.

      Supplementary Table S4 presents the mean density of all categories of food outlet by ‘type’,
‘healthiness’ and healthiness ratios. Supplementary Table S5 presents pairwise comparisons between
 LGA-Rings and years for all categories of food outlet by ‘type’, ‘healthiness’ and also ratios (excluding
‘Fast-food’ and ‘Unhealthy’ food outlets).

3.1. Food Outlets Grouped by Healthiness: Density over Time and across LGA-Rings
      Figure 2 shows the estimated mean density of food outlets within each retailer ‘healthiness’
classification (see Table 1) by LGA-Ring and study year. Across all ‘healthiness’ categories, food outlet
density decreased with distance from the CBD, i.e., from LGA-Ring Inner to Growth Areas. Over time
both ‘unhealthy’ and ‘healthy’ food outlet density increased, whereas ‘less healthy’ food outlet density
remained relatively stable. ‘Healthy’ food outlet density increased in all LGA-Rings over the study
period, with no significant difference between LGA-Rings in the rate of increase. However, density of
‘healthy’ outlets was significantly different between the Inner and Middle Ring compared to Growth
Areas, as was the Inner Ring compared to the Outer Ring (Figure 2a). The difference in mean ‘healthy’
retail outlet density was highest between Inner Ring and Growth Areas (4.37; 95%CI: 2.53, 6.2), and the
Over time both ‘unhealthy’ and ‘healthy’ food outlet density increased, whereas ‘less healthy’ food
outlet density remained relatively stable. ‘Healthy’ food outlet density increased in all LGA-Rings
over the study period, with no significant difference between LGA-Rings in the rate of increase.
However, density of ‘healthy’ outlets was significantly different between the Inner and Middle Ring
compared to Growth Areas, as was the Inner Ring compared to the Outer Ring (Figure 2a). The
Int. J. Environ. Res. Public Health 2020, 17, 1321 7 of 15
difference in mean ‘healthy’ retail outlet density was highest between Inner Ring and Growth Areas
(4.37; 95%CI: 2.53, 6.2), and the mean density increased by 1.23 outlets per 10,000 population (95%CI:
0.94, 1.52)
mean density between
increased 2008
by and
1.23 2016 across
outlets all LGA-Rings.
per 10,000 populationThe difference
(95%CI: in mean
0.94, 1.52) betweendensity of ‘less
2008 and 2016
healthy’
across all retailers
LGA-Rings. was The
greatest between
difference Inner density
in mean Ring and of Growth Areasretailers
‘less healthy’ (51.12; 95%CI: 35.37, between
was greatest 66.87),
mean Ring
Inner density andincreasing
Growth Areas by 1.23 (95%CI:
(51.12; 0.94,35.37,
95%CI: 1.52) between
66.87), mean2008density
and 2016. Density by
increasing of ‘unhealthy’
1.23 (95%CI:
food 1.52)
0.94, outlets decreased
between 2008atanddifferent rates with
2016. Density distance from
of ‘unhealthy’ foodCBD (Figure
outlets 2c). Mean
decreased densityrates
at different of
‘unhealthy’
with distancefood fromoutlets increased
CBD (Figure 2c).between 2008 and
Mean density 2012 in the Inner
of ‘unhealthy’ Ring (3.46;
food outlets 95%CI:
increased 0.32, 6.59)
between 2008
at which
and 2012 in point
the itInner
stabilized, the mean
Ring (3.46; 95%CI:density in all at
0.32, 6.59) other
whichLGA-Rings increasingthe
point it stabilized, between
mean 2012 andin
density
2014
all stabilizing
other LGA-Rings between 2014 and
increasing 2016 (Figure
between 2012 and 2c;2014
Supplementary Table S6).
stabilizing between Theand
2014 largest
2016difference
(Figure 2c;
in mean density of ‘unhealthy’ retailers was between Inner Ring and Growth
Supplementary Table S6). The largest difference in mean density of ‘unhealthy’ retailers was between Areas in 2012 (28.19;
Inner Ring and Growth Areas in 2012 (28.19; 95%CI: 14.94, 41.45), and greatest growth in mean in
95%CI: 14.94, 41.45), and greatest growth in mean density occurred between 2008 and 2016 the
density
Middle Ring
occurred (5.38;2008
between 95%CI:
and3.17,
20167.59).
in the Middle Ring (5.38; 95%CI: 3.17, 7.59).
Figure 2. Density of healthy, less healthy and unhealthy food outlets over the period 2008–2016
Figure 2. Density of healthy, less healthy and unhealthy food outlets over the period 2008-2016 across
across local government areas grouped by distance from Greater Melbourne Central Business District
local government areas grouped by distance from Greater Melbourne Central Business District (LGA-
(LGA-Rings).
Rings).
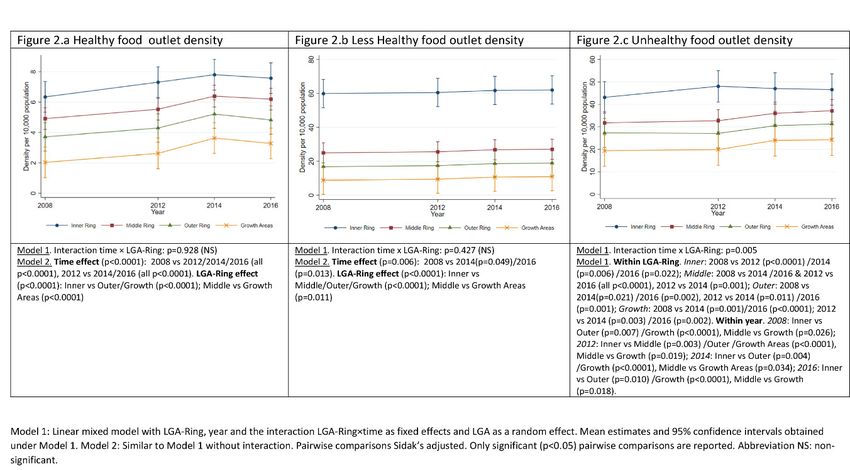
3.2. Ratio of Unhealthy or Less Healthy Food Outlets to Healthy Food Outlets over Time and across LGA-Rings
3.2. Ratio of Unhealthy or Less Healthy Food Outlets to Healthy Food Outlets over Time and
There
across was no significant difference between LGA-Rings in the temporal trend for the ratio of
LGA-Rings
‘unhealthy’ and no
There was ‘less healthy’ to
significant ‘healthy’between
difference food outlets (Modelin
LGA-Rings 1)the
(Figure 3). The
temporal trend
trend forof decreasing
the ratio of
density as LGA distance from CBD increased was reversed in this instance only, Growth Areas
‘unhealthy’ and ‘less healthy’ to ‘healthy’ food outlets (Model 1) (Figure 3). The trend of decreasing having
the highest
density as ratio
LGA of ‘unhealthy’
distance from to
CBD‘healthy’ foodwas
increased outlets although
reversed not significantly
in this instance only,different
Growthfrom the
Areas
other
havingLGA-rings
the highest(Figure
ratio 3a). The ratio ofto‘less
of ‘unhealthy’ healthy’
‘healthy’ to ‘healthy’
food food outlets
outlets although was higher indifferent
not significantly the Inner
Ring compared to all other LGA-rings, Inner Ring decreasing between 2008 and 2016 from 10.8 (95%CI:
3.6, 18.01) to 8.16 (95%CI: 5.31, 11.01) (Figure 3b).
3.3. Food Outlets Grouped by Store Type: Density over Time and across LGA-Rings
Mean density of ‘Takeaways’, was consistently the food outlet ‘type’ with the highest density
across all LGA-Rings (Figure 4g) ranging from a 7.89 (95%CI: 6.65, 9.26) in the Inner Ring to 3.49
(95%CI: 1.52, 5.45) in Growth Areas (both in 2012). Density of ‘Takeaways’ increased by 0.4 (95%CI:
0.04, 0.76) between 2008 and 2016. Inner Ring had significantly more ‘Takeaways’ than the Outer Ring
(2.46; 95%CI: 0.25, 4.68) and Growth Areas (3.72; 95%CI: 1.42, 6.02), and Middle Ring more than Growth
Areas (2.61; 95%CI: 0.62, 4.6). ‘Fast-food’ density increased in all LGA-rings over the study period
(2008–2016), the Middle Ring experienced the highest growth of 73% (0.74; 95%CI: 0.57, 0.91) and
Growth Areas reported the lowest growth of 28% (0.45; 95%CI: 0.2, 0.7) with no significant difference
across LGA-Rings (Figure 4f; Supplementary Table S7).Int. J. Environ. Res. Public Health 2020, 17, x FOR PEER REVIEW 8 of 16
from the other LGA-rings (Figure 3a). The ratio of ‘less healthy’ to ‘healthy’ food outlets was higher
in the
Int. J. Environ. Inner
Res. Ring
Public compared
Health 2020, 17,to all other LGA-rings, Inner Ring decreasing between 2008 and 2016
1321 8 of 15
from 10.8 (95%CI: 3.6, 18.01) to 8.16 (95%CI: 5.31, 11.01) (Figure 3b).
Figure 3. Ratio of Unhealthy and Less Healthy to Healthy food outlets over the period 2008–2016 and
Int. J. Environ. Res. Public Health 2020, 17, x FOR PEER REVIEW 9 of 16
across localFiguregovernment areas grouped
3. Ratio of Unhealthy and Lessby distance
Healthy from Greater
to Healthy Melbourne
food outlets Central
over the period Business
2008-2016 andDistrict
(LGA-Ring). across local government areas grouped by distance from Greater Melbourne Central Business District
(LGA-Ring).
3.3. Food Outlets Grouped by Store Type: Density over Time and across LGA-Rings
Mean density of ‘Takeaways’, was consistently the food outlet ‘type’ with the highest density
across all LGA-Rings (Figure 4g) ranging from a 7.89 (95%CI: 6.65, 9.26) in the Inner Ring to 3.49
(95%CI: 1.52, 5.45) in Growth Areas (both in 2012). Density of ‘Takeaways’ increased by 0.4 (95%CI:
0.04, 0.76) between 2008 and 2016. Inner Ring had significantly more ‘Takeaways’ than the Outer Ring
(2.46; 95%CI: 0.25, 4.68) and Growth Areas (3.72; 95%CI: 1.42, 6.02), and Middle Ring more than
Growth Areas (2.61; 95%CI: 0.62, 4.6). ‘Fast-food’ density increased in all LGA-rings over the study
period (2008–2016), the Middle Ring experienced the highest growth of 73% (0.74; 95%CI: 0.57, 0.91)
and Growth Areas reported the lowest growth of 28% (0.45; 95%CI: 0.2, 0.7) with no significant
difference across LGA-Rings (Figure 4f; Supplementary Table S7).
Density of ‘Supermarkets’ increased at a slower rate than ‘Takeaways’ and ‘Fast-food’ over the
study period, increasing by a mean density of 0.39 (95%CI: 0.16, 0.61) outlets per 10,000 population.
‘Supermarket’ density was higher in the Inner and Middle Ring compared to Growth Areas; mean
difference 0.52 (95%CI: 0.16, 0.88) and 0.41 (0.1, 0.72) respectively (Figure 4e). Between 2008 and 2016
‘Supermarket’ density in the Middle Ring (1.23; 95%CI: 1.03, 1.43) increased to meet that of the Inner
Ring (1.23; 95%CI: 0.76, 1.69), while density in the Outer (1.09; 95%CI: 0.79, 1.38) and Growth Area
(0.84; 95%CI: 0.67, 1) remained 11.4% and 32% lower respectively.
Compared to the Middle Ring, Inner Ring had a higher mean density of ‘Small Goods’ and
‘Eating out’, by 0.4 (95%CI: 0.15, 0.65) and 6.04 (95%CI: 3.52, 8.57) respectively. Compared to Outer
Ring and Growth Areas, Inner Ring also had a higher mean density of ‘Small Goods’, ‘Eating Out’,
‘Discretionary Foods’ and ‘Fresh Produce’. Compared to Outer Ring and Growth Areas, Middle Ring
had a higher mean density of ‘Fresh Produce’, by 0.24 (95%CI: 0.04, 0.45) and 0.42 (95%CI: 0.2, 0.63)
respectively. Middle Ring also had a higher mean density of ‘Discretionary Foods’ compared to
Growth Areas (0.52, 95%CI: 0.01, 1.02) (Figure 4a–d).
Figure 4. Food
Figure 4. Foodretail outletsgrouped
retail outlets grouped by type:
by type: density density
per 10,000per 10,000 over
population population
the periodover
2008-the period
2008-2016 andacross
2016 and acrosslocal
local government
government areasareas grouped
grouped by distance
by distance from Greater
from Greater MelbourneMelbourne
Central Central
Business
Business District.
District.
4. Discussion
As a measure food availability, density of food outlets per capita increased during the study
period. We observed that new Growth Areas had fewer food outlets per capita overall relative to
established LGAs and LGAs closer to the CBD. Inner Melbourne had greater availability of all food
outlets (excluding ‘Fast-food’) with availability decreasing incrementally as LGA distance from CBDInt. J. Environ. Res. Public Health 2020, 17, 1321 9 of 15
Density of ‘Supermarkets’ increased at a slower rate than ‘Takeaways’ and ‘Fast-food’ over the
study period, increasing by a mean density of 0.39 (95%CI: 0.16, 0.61) outlets per 10,000 population.
‘Supermarket’ density was higher in the Inner and Middle Ring compared to Growth Areas;
mean difference 0.52 (95%CI: 0.16, 0.88) and 0.41 (0.1, 0.72) respectively (Figure 4e). Between 2008 and
2016 ‘Supermarket’ density in the Middle Ring (1.23; 95%CI: 1.03, 1.43) increased to meet that of the
Inner Ring (1.23; 95%CI: 0.76, 1.69), while density in the Outer (1.09; 95%CI: 0.79, 1.38) and Growth
Area (0.84; 95%CI: 0.67, 1) remained 11.4% and 32% lower respectively.
Compared to the Middle Ring, Inner Ring had a higher mean density of ‘Small Goods’ and ‘Eating
out’, by 0.4 (95%CI: 0.15, 0.65) and 6.04 (95%CI: 3.52, 8.57) respectively. Compared to Outer Ring and
Growth Areas, Inner Ring also had a higher mean density of ‘Small Goods’, ‘Eating Out’, ‘Discretionary
Foods’ and ‘Fresh Produce’. Compared to Outer Ring and Growth Areas, Middle Ring had a higher
mean density of ‘Fresh Produce’, by 0.24 (95%CI: 0.04, 0.45) and 0.42 (95%CI: 0.2, 0.63) respectively.
Middle Ring also had a higher mean density of ‘Discretionary Foods’ compared to Growth Areas (0.52,
95%CI: 0.01, 1.02) (Figure 4a–d).
4. Discussion
As a measure food availability, density of food outlets per capita increased during the study
period. We observed that new Growth Areas had fewer food outlets per capita overall relative to
established LGAs and LGAs closer to the CBD. Inner Melbourne had greater availability of all food
outlets (excluding ‘Fast-food’) with availability decreasing incrementally as LGA distance from CBD
increased. ‘Fast-food’ was the only food outlet ‘type’ where a similar density and growth was observed
over time across Melbourne. ‘Fast-food’ growth trends suggest establishment of new outlets is closely
aligned with population density. In contrast, the number of ‘Supermarkets’ per capita was higher in
the all other LGA-Rings compared to Growth Areas, suggesting increasing demand for ‘Supermarkets’
is not driven by population growth. As a result of these dissimilar growth patterns, Growth Areas
have developed in a way that they have the highest ratio of ‘unhealthy’ food outlets to ‘healthy’ food
outlets with as much as nine ‘unhealthy’ to one ‘healthy’ outlet in these areas.
The findings from the current study are consistent with earlier studies in terms of rapid growth in
access to food outlets, and trend towards a greater density of unhealthy food outlets relative to healthy
food outlets. For example, an English study identified an 80% growth in food outlets overall between
1980 and 2000 with the most dramatic growth observed for takeaways and restaurants [47]. A second
study reported density per 10,000 population (using data from the 2001 United Kingdom Census)
of takeaway food outlets and supermarkets in Norfolk (United Kingdom) almost doubled between
1990 and 2008 by 45% and 29% respectively [45]. This was also the case in a Western Australia study
examining density within 1.6 km of a residential address, the number of unhealthy outlets increasing
at a faster rate in comparison to healthy outlets between 2004 and 2011 [48].
Understanding how dietary behaviours and healthy weight are influenced by food environments
in which unhealthy food outlets grow at a rate outpacing that of healthy food outlets will be pertinent to
future action. The FES tools have been previously used to examine healthiness of the food environment
and its effect on dietary behaviours, albeit at a single time point. In the Illawara region of New South
Wales (Australia), suburbs that had a higher average FES (higher being healthier) were associated with
a higher consumption of fruit and vegetables [14]. Another study comparing areas using the sum of
healthy outlet FES versus sum of unhealthy outlet FES, reported that a people living in urban areas of
Melbourne with a higher healthy FES were more likely to report ‘never purchasing fast-food’ compared
to those with less favourable healthy FES scores [23]. Informed by these findings, results from our
study suggest an increase in unhealthy outlets, and an imbalance between the density of unhealthy to
healthy outlets, may negatively influence dietary behaviours and in turn prevalence of overweight and
obesity. Whether the relationship between the food environment and diet and obesity remains stable
as the food environment changes (i.e., if obesity rates continue to increase as the food environment
becomes unhealthier) will be an important relationship to understand.Int. J. Environ. Res. Public Health 2020, 17, 1321 10 of 15
A ‘food swamp’ is a spatial metaphor to describe neighbourhoods where there is a higher density
of food outlets selling unhealthy quick serve foods, which are energy dense and nutrient poor, relative
to the density of food outlets selling healthy options [49–51]. As such, we observed characteristics of a
food swamp in Melbourne which parallels studies from Western Australia and Canada where ‘food
swamps’ were more prevalent than ‘food deserts’ [43,46]. This was also the case in deprived areas in
New Zealand, which had a higher density of unhealthy food outlets (fast-food, takeaway, convenience
stores) relative to healthy food outlets (supermarkets, fruit and vegeTable Stores) compared to the least
deprived areas [20].
Evidence is emerging that this imbalance in food retail mix has health implications. A study from
the United States of America identified food swamps as being greater predictors of adult obesity than
food deserts (i.e., areas with limited access to healthy food) [51]; and one Australian study found
when examining the ratio of healthy (i.e., supermarkets and green grocers) to unhealthy (i.e., fast-food
outlets) that a higher BMI was associated with higher density of unhealthy outlets (25% or more of total
outlets located within 1.6 km and 3.2 km from home) [12]. Despite non-significance, the higher ratio of
unhealthy to healthy outlets in Melbourne’s Growth Areas should raise concerns given the reported
higher prevalence of overweight and obesity compared to established suburbs [26,40]. Similar patterns
were observed in Perth (Western Australia), where despite improving over time, the proportion of
healthy outlets to unhealthy outlets in new developments were consistently lower than established
areas [48].
Many factors such as lower housing density, increasing commuting distance to workplaces, car
dependence, poor public transport, cultural factors and increased distances to open space and food retail
may contribute to the relationship between the food environment and obesity [26,52]. Nevertheless,
disparities in Melbourne’s food environments have the potential to disadvantage communities in
Growth Areas due to limited availability and exposure to food resources, which in turn may result in
greater reliance on vehicle access and car travel to obtain healthy food [26,48,53].
4.1. Strengths
To date, no known Australian or international study has examined density, type or ratio of
food outlets in a large metropolitan city over time. Examining the food environment in a larger
geographic unit than earlier studies provides for a more comprehensive understanding of food
availability at a population level, compared to studies examining only food environments immediately
surrounding a residential home. Several steps were taken to improve the quality of food outlet
data in this study: data were sourced from multiple sources (i.e., Yellow Pages and White Pages);
and rigorous cross-checking (i.e., Google search, virtual ground truthing) were undertaken to increase
completeness [54]. By taking a holistic approach and encapsulating all food outlet businesses,
rather than only examining large global chains (absolute measures), this study provides the most
comprehensive snapshot of food outlet trends in Australia.
4.2. Limitations
The assessment of food outlet healthiness was based on a descriptive classification of food outlet
type. Accordingly, it was generally not possible to take into account the types of products available for
sale and other aspects of the in-store environment that may impact the healthiness of purchases from
each outlet. While in-store assessments (e.g., using the NEMS-R tool) may have given a more accurate
measure of food outlet healthiness [55], it was not feasible in this study given the temporal nature,
large-scale and resource constraints. The FES provides only a generalized healthiness measure of food
outlet types which may not reflect in-store variation in healthiness of food offerings and how this
changes over time. Additionally, the FES may not identify the emergence of new food outlet types over
time. Further development, refinement, and continued updating of the FES will create a more nuanced
tool that can be used at scale (i.e., across metropolitan, regional, rural and remote areas). Another key
limitation of this study is that the datasets used may not represent all food outlets available, potentiallyInt. J. Environ. Res. Public Health 2020, 17, 1321 11 of 15
introducing bias in density estimates [54]. For example, some food outlet types were not listed in
the Yellow or White Pages (e.g., farmers markets, local produce stalls, wholesalers/food cooperatives
and service stations convenience stores), meaning they were unable to be included within this study.
Therefore, estimates of food outlet density in this study are likely to be lower than the true density of
food retail. Additionally, due to the retrospective nature of this study, virtual ground truthing could
only be performed in 2019, limiting the ability to confirm store operation or closure at each study time
point. Nevertheless, virtual ground truthing was important to identify food outlets that were still in
operation but may have ceased using fixed-line phone services, and thus would not have been listed in
the Yellow Pages. It is also possible that some food outlets were never listed in the Yellow Pages and as
such would not have been identified. Additionally, alternate food sources, such as online purchasing
for home delivery are likely to be under-represented also, because online food retailers may not have a
physical food retail address listed in the Yellow or White Pages. Additionally, food outlet businesses
listed do not specify that they provide a food delivery service, nor the geographical area in which
they service which could be larger than the single LGA in which their physical premises is located.
This study did not take into account the geographical differences in the size of the LGAs, and therefore
does not elucidate spatial disparities in food outlet access which would be useful. Lastly, this study
did not examine associations between the food environment and measures of dietary intake or obesity
prevalence, which is an important avenue for exploration in future studies.
4.3. Implications for Practice
This study identifies disparities in healthiness of food environments whereby Growth Areas,
where obesity prevalence is highest, appear to have experienced growth in ‘unhealthy’ food outlets,
increased exposure to ‘fast-food’ and subsequent risk of obesity [56]. Development and implementation
of planning policies to limit availability of unhealthy food outlets, and increase healthy food outlet
availability and accessibility are urgently needed across all areas, and particularly for Growth
Areas [5,12]. One mechanism could be the inclusion of ‘public health considerations’ within urban
planning legislative frameworks to provide LGAs the authority to develop and implement healthy
food environment initiatives through urban planning [26].
In our study, an increasing density of supermarkets was observed and it is known that supermarkets
sell unhealthy foods and beverages and encourage purchasing through strategic placement and price
promotions of these products [38,57–59]. Since Australians make two-thirds of food and beverage
purchases (excluding alcohol) at supermarkets [60], further examination of the implications of in-store
promotion and placement is needed.
Additionally, policies that facilitate a healthier food environment (e.g., more fruit and greengrocers,
butchers, fish and poultry shops) in Growth Areas represent a clear strategy achievable through LGAs.
Policies could include support for independent fresh food outlet establishment (e.g., through reduced
council rates). Or, subsidised mobile greengrocers that can visit areas with limited access to healthy
food and high food insecurity such as the ‘Community Grocer’ program, which is led by the community
with support from the City of Melbourne [61].
This study highlights the importance of routine food environment monitoring, which helps identify
widening disparities within communities and cities. Temporal data are crucial to understanding
trends in disparities in environments, particularly given the dynamic growth in population in the most
affected areas. Better understanding mechanisms by which rapid urban growth and development
of expansive areas with low-density housing results in higher obesity prevalence is also needed to
underpin prevention efforts [52] and support policy development. Use of Geographic Information
Systems to examine food outlet access would improve understanding of food outlet accessibility.
Studies examining the feasibility of increasing housing density and land use mix in Growth Areas
would also be valuable to inform strategic planning for healthy urban design to support public health.Int. J. Environ. Res. Public Health 2020, 17, 1321 12 of 15
5. Conclusions
This study provides strong evidence on the proliferation of food outlets and increasing food
availability in Melbourne, and the disproportionate dominance of ‘unhealthy’ food outlets relative
to ‘healthy’ outlets across Melbourne. Evidence indicates that an inequitable balance in availability
and exposure to food resources may exist, particularly with regard to the limited availability of
healthy food outlets in contrast to unhealthy outlets in Melbourne’s Growth Areas. Large-scale food
environment policy change and well-managed population growth will be important components of
efforts to improve population diets and address obesity.
Supplementary Materials: The following are available online at http://www.mdpi.com/1660-4601/17/4/1321/s1,
Table S1: Classifications extracted from Yellow and White Pages, Table S2: Food outlet descriptions and scores,
Table S3: Local government area classification by distance from Central Business District in Melbourne, Australia,
Table S4: Density of food outlet types and food outlet healthiness groups (Healthy, Less Healthy, Unhealthy)
and ratio of Unhealthy, Less Healthy to Healthy food outlets across geographical areas in Greater Melbourne,
Table S5: Pairwise comparisons for liner mixed model without interaction for food outlets types, food outlets
grouped by healthiness and ratio of Healthy and Less Healthy to Healthy outlet over time and across local
government area rings, Melbourne, Australia, 2008–2016, Table S6: Pairwise comparisons for liner mixed model
with interaction for Unhealthy food outlets over time across local government area rings, Melbourne, Australia,
2008–2016, Table S7: Pairwise comparisons for liner mixed model with interaction for Fast-food outlets over time
across local government area rings, Melbourne, Australia, 2008–2016.
Author Contributions: Conceptualization, C.N., L.O., S.A., G.S., M.R.B., & C.S.; methodology, C.N. & L.O.;
formal analysis, C.N.; data curation, C.N. & M.R.B.; writing—original draft preparation, C.N.; writing—review
and editing, C.N., L.O., S.A., G.S., M.R.B., & C.S. All authors have read and agreed to the published version of
the manuscript.
Funding: This research received no external funding.
Acknowledgments: This study is partially supported by a VicHealth Innovation Grant (IR27123) as part of a
wider and related research project although separate from this study; and, from the Australian Government’s
Medical Research Future Fund (MRFF) through funding provided to The Australian Prevention Partnership
Centre under the Boosting Preventative Health Research Program. Needham, Orellana, Allender, Sacks and Blake
are researchers with the National Health and Medical Research Council (NHMRC) funded Centre of Research
Excellence in Food Retail Environments for Health (RE-FRESH) (APP1152968). Gary Sacks is the recipient of a
Heart Foundation Future Leader Fellowship (102035) from the National Heart Foundation of Australia. He is also
a researcher within a NHMRC Centre of Research Excellence entitled Reducing Salt Intake Using Food Policy
Interventions (APP1117300).
Conflicts of Interest: The authors declare no conflict of interest.
References
1. Swinburn, B.A.; Kraak, V.I.; Allender, S.; Atkins, V.J.; Baker, P.I.; Bogard, J.R.; Brinsden, H.; Calvillo, A.;
De Schutter, O.; Devarajan, R.; et al. The global syndemic of obesity, undernutrition, and climate change:
The Lancet Commission report. Lancet N. Am. Ed. 2019, 39, 791–846. [CrossRef]
2. Kelly, T.; Yang, W.; Chen, C.S.; Reynolds, K.; He, J. Global burden of obesity in 2005 and projections to 2030.
IJO 2008, 32, 1431–1437. [CrossRef] [PubMed]
3. World Health Organization (WHO). Diet, Nutrition and the Prevention of Chronic Diseases; WHO Technical
Report Series; World Health Organization (WHO): Geneva, Switzerland, 2003.
4. Swinburn, B.A.; Sacks, G.; Hall, K.D.; McPherson, K.; Finegood, D.T.; Moodie, M.L.; Gortmaker, S.L.
The global obesity pandemic: Shaped by global drivers and local environments. Lancet 2011, 378, 804–814.
[CrossRef]
5. Swinburn, B.; Vandevijvere, S.; Kraak, V.; Sacks, G.; Snowdon, W.; Hawkes, C.; Barquera, S.; Friel, S.;
Kelly, B.; Kumanyika, S.; et al. Monitoring and benchmarking government policies and actions to improve
the healthiness of food environments: A proposed Government Healthy Food Environment Policy Index.
Obes. Rev. 2013, 14 (Suppl. 1), 24–37. [CrossRef] [PubMed]
6. Giskes, K.; van Lenthe, F.; Avendano-Pabon, M.; Brug, J. A systematic review of environmental factors and
obesogenic dietary intakes among adults: Are we getting closer to understanding obesogenic environments?
Obes. Rev. 2011, 12, e95–e106. [CrossRef]You can also read