Investor Day 2019
   March 27th 2019
←
→
Page content transcription
If your browser does not render page correctly, please read the page content below
Investor Day 2019 March 27th 2019

Welcome

Brad Conrad – EVP Treasurer

                              2
Forward Looking Statements and Non-GAAP Measures

During the course of this presentation, there will be forward-looking statements within the meaning of the “safe harbor”
provisions of the Private Securities Litigation Reform Act of 1995. Forward-looking statements often address our expected
future business and financial performance, and often contain words such as “expects,” “anticipates,” “intends,” “plans,”
“believes,” “seeks,” or “will.”

The information in this presentation is based upon our current expectations as of the date hereof unless otherwise noted.
Our actual future business and financial performance may differ materially and adversely from our expectations expressed in
any forward-looking statements. We undertake no obligation to revise or publicly update our forward-looking statements
or this presentation for any reason. Although our expectations and beliefs are based on reasonable assumptions, actual
results may differ materially. The factors that may affect our results are listed in certain of our press releases and disclosed in
the Company’s most recent Form 10-K and 10-Q along with other public filings with the SEC.

In addition, today’s presentation includes certain non-GAAP financial measures as defined under SEC Regulation G. The
reasons we believe such measures are useful together with a reconciliation of those measures to the most directly
comparable U.S. GAAP measures have been included in the appendix to the presentation.

                                                                                                                                      3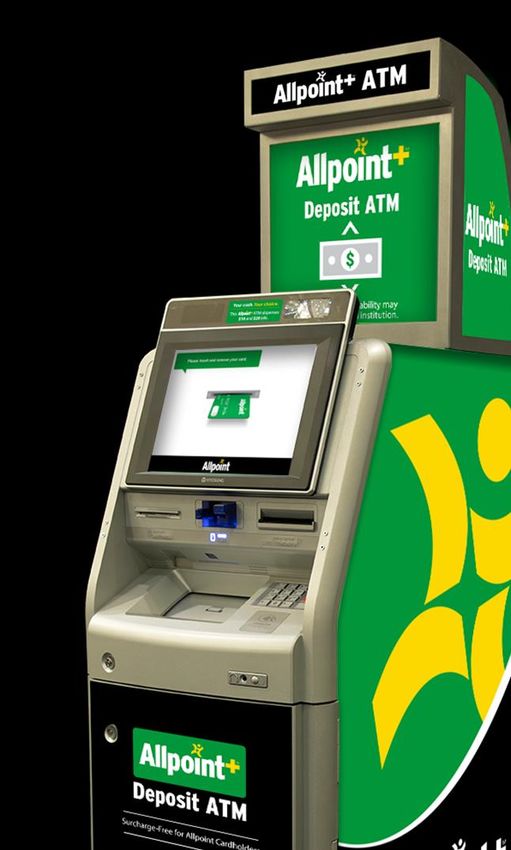
Strategic Overview

Edward H. West – Chief Executive Officer

                                           4
Today’s Agenda
Strategic Overview Ed West 9:00am
North America Business Update Brian Bailey & Brad Nolan 9:30am
Break 10:15am
International Business Update Marc Terry 10:30am
Financial Overview Gary W. Ferrera 11:00am
Questions and Answers Ed West & Gary W. Ferrera 11:30am
Conclusion 12:00pm
5
Strategic Overview
Our Focus
   • New management team focused on durable, product driven organic growth

Market Dynamics
  • Evolving secular trend with retail financial institutions represents a significant growth
    opportunity for CATM in a $15B market, in the US alone

How We Are Changing the Business
  • Evolving from a legacy ATM deployer to a network-based business, driving meaningful
    and quantifiable value to Retailers, FIs and FinTechs
  • Leveraging our unique End-to-End network and process ownership
  • Investing in enhanced solutions to drive increased interest from FIs, Retailers and
    FinTechs

The Results
   • Partnering with FIs and FinTechs to drive additional transactions to our network and
     long-term managed services agreements will deliver growth and operating leverage
   • Our network will become the physical-to-digital access points, handling a broadening
     set of transactions at a leading retailer near you                                         6
Cardtronics Snapshot

Vision                                                                                                                     2.5 Billion
                                                                                                                        Total transactions
To be the                                                                                                               processed in 2018
trusted platform,
enabling the                                                                                                             75,000 Owned
                                                                                                                                             2

majority of cash                                                                                                               +
                                                                                                                                        2
                                                                                                                        152,000 Managed
transactions in
                                                                                       1
                                                                     8 of 10                                             The leading ATM
                                                                     Top US
the communities                                                     Retailers
                                                                                                                             platform
we serve
                                                               60+ Million                                                  ~2,000
                                                           Cardholders with                                                 Financial
                                                           access to Allpoint
                                                                                           4 continents, 10 countries
                                                                                                                           Institution
                                                                                                                          Relationships

1 Source: Kantar Consulting, Stores Top Retailers 2018, US Retailers with an ATM program
2 Ending unit count as of December 31, 2018                                                                                                      7
New Team Focused on Organic Growth and Leveraging our Network

                              2018/2019 Priorities                  2018 Successes

1. Drive Organic Growth & Durable Revenue            • Returned to organic growth in North America
   Streams                                           • Double-digit surcharge-free transaction growth
                                                       at leading retailers in the U.S.
2. Operational Excellence & Portfolio
                                                     • Double-digit growth in Germany, Spain and
   Optimization
                                                       South Africa
3. Create Raving Fans with our Customers             • Record ATM availability
                                                     • Proactive fleet optimization
4. Engender Employee Pride
                                                     • Implemented first phase of ERP
5. Deliver Strong Free Cash Flow                     • Allpoint customers describe their Allpoint
                                                                                     1
                                                       relationship as “Truly Loyal”
                                                     • Exceeded original expectations for CY
                                                       Revenues and Adj. EBITDA
                                                     • $118 million in FCF; up ~60% from PY
                                                     • Total debt reduction of $113 million

1   2018 Walker Voice of the Customer Survey                                                            8
Diverse Revenue Streams

    2018 Revenues by Segment              2018 Source of Revenues       2018 Revenues by Product2

                        9%                      12%                              9%

           30%                                                             41%           50%
                                    61%
                                                      88%

            North America                 CATM-owned (~77k ATMs)
                                                                    1
                                                                             Surcharge
            Europe & Africa                                                  Surcharge-free
                                          Merchant-owned & managed
            Australia & New Zealand       services (~152k ATMs)
                                                                1
                                                                             Managed Services
1   Average transacting ATM count
2   2018 ATM Operating Revenue                                                                      9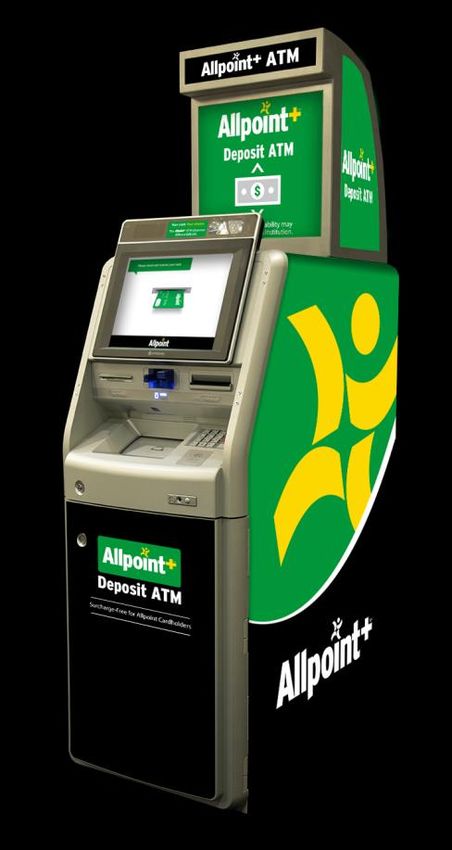
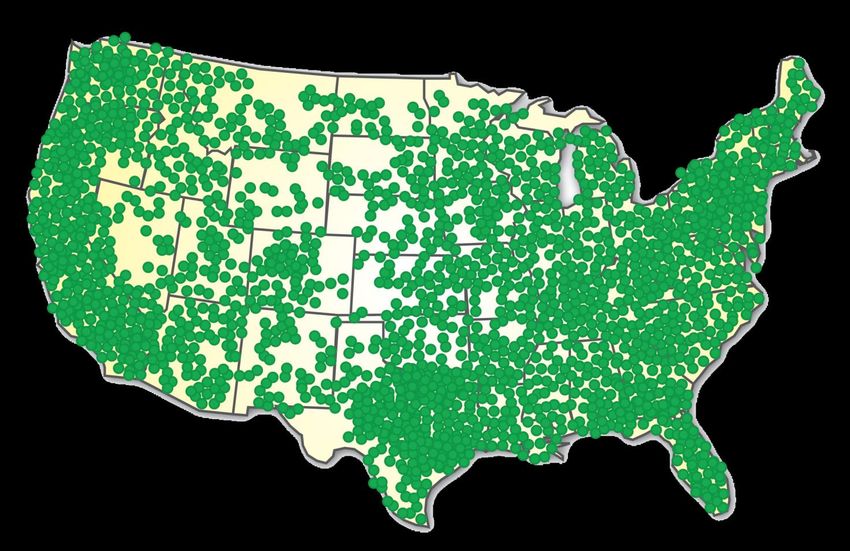
Multiple Revenue Sources at a Single Network ATM

83% of U.S.
population
resides within
five miles of a
Cardtronics
ATM

                                                   10
Multiple Revenue Sources at a Single Network ATM
Branding
Surcharge-free
• Financial institution brands a Cardtronics ATM,
revenue drivers enabling surcharge-free access to its customers
• Revenue from branding (paid by FI):
• 41% of total o Monthly fixed branding fee per ATM, plus
o Per transaction interchange fee
revenue
Allpoint
• ATM customer’s financial institution is a member of
our Allpoint network
• Revenues from Allpoint (paid by financial institution)
o Allpoint network access fee per cardholder
(account) or per transaction, plus
o Per transaction interchange fee
Example based on U.S. Fee structures vary by country.
11Multiple Revenue Sources at a Single Network ATM
Surcharge Convenience transaction
• Customer from a bank outside our network
revenue drivers
• Revenue generated:
o Surcharge (convenience) fee per transaction
• 50% of total (paid by customer)
revenue o Interchange fee per transaction (paid by FI via
third party network)
International FI Customer
• International ATM customer withdrawal
• Revenue generated:
o Surcharge (convenience) fee per transaction
(paid by customer)
o Dynamic currency (DCC) transaction fee to
convert funds to home currency
o Interchange fee per transaction (paid by FI via
third party network) Example based on U.S. Fee structures vary by country.
12Sources of Revenues: Managed Services
A growing Outsourcing opportunity
opportunity • 138,000 ATMs managed today
• Services include:
• 9% of total o Full turnkey ATM management
revenue both on and off-branch
locations
o Corporate and workplace
banking ATMs
o Transaction processing
o Processing and settlement
services for merchants and ATM
distributors
Example based on U.S. Fee structures vary by country.
13Significant Changes in Retail Banking
FIs and Banks Shutter 1,700
Branches in Fastest
How Banks Can Stay
Relevant In The Digital Age
Rethinking Branch Networks
And The Retail Experience in a
FinTechs can Decline on Record
Wall Street Journal | Feb 5, 2018
Forbes | Jan 16, 2019 Mobile-First World
The Financial Brand | Mar 15, 2018
grow and
reduce their • New market expansion by major banks and FinTech
costs by disruption driving market changes
leveraging our
network • Fierce focus on efficiency ratio driving investment
prioritization at FIs
• Operating ATMs is not core for FIs, nor a differentiator
• Broad ATM access is a critical decision factor for consumers
14The Financial Institution Opportunity
Branch 13 million people in Britain have
seen their local bank branch
UK Banks are
Increasingly Closing
Banks Branches Closing at
a Rate of 15 a Month
closures close down in past 10 years
The Telegraph | Oct 19, 2018
Branches
Business Insider | June 18, 2018
AustralianBroker | Dec 18, 2018
provide an
opportunity for Number of retail branches in the U.S. (in thousands)
an efficient 100
11,251 Decrease in U.S. bank branches
cash
transaction 95
network
90
85
80
2009 2010 2011 2012 2013 2014 2015 2016 2017 2018
15Global Cash Usage Continues to Grow
U.S. Consumers Most Frequently Used Payment Type 1
Cash matters Other, 6%
Checks, 6% Electronic / ACH, 10%
• Cash remains a preferred payment
method and is dominant across a vast
array of transaction types Debit, 27%
Cash, 30%
• Cash in circulation grows faster than
GDP in our markets Credit, 21%
• Cash is Secure-Reliable-Private
Volume of U.S. Currency in Circulation
Billions of notes, as of December 31 of each year 2
Consumers desire broad access to
convenient cash 50
40
• Consumers prefer mobile connectivity 30
to a convenient ATM network 20
10
• FinTechs going after large under- 0
banked market 2010 2011 2012 2013 2014 2015 2016 2017
1 Source: 2018 Diary of Consumer Payment Choice, Cash Product Office,
Federal Reserve System, November 2018
$1 $2 $5 $10 $20 $50 $100
2 Federal Reserve Statistics - Currency in Circulation 16Robust Market Opportunity
Unit Count of US ATM Owners 1 U.S. Withdrawal TXN Market Share1
10%
9%
Today
8% 11%
4%
6%
4%
4%
3% 3% 3%
2%
2% 2%
86%
1% 1%
0%
Banks CATM IADs
1 Source: Source: RBR and Company Estimates; unit count does not reflect deposit-taking ATMs 17Well Positioned in a $15 Billion Market
US Withdrawal + Deposits TXN Market Share 1
Unit Count of US ATM Owners 1 $15 Billion Market
2
10%
9%
Today
8%
7%
2%
6%
4%
4%
3% 3% 3%
86%
2%
2% 2%
91%
1% 1%
0%
Banks CATM IADs
1 Source: RBR and Company Estimates; unit count does not reflect deposit-taking ATMs
2 Reflects Company’s estimate of market opportunity by 2022 18End-to-End Capabilities for Retailers, FIs and FinTechs
Key Elements Result
• Premier, convenient locations • Comprehensive solutions for FIs –
Allpoint, Branding, Managed Services
• Scale rivals top 3 US banks combined
• Network enablement for FinTechs
• Control of customer experience
• Product development – speed to
• Common end-to-end platform
market
• Security / Control
• Full service capabilities and lower
costs
• Compelling value proposition for
Processing customers
Platform Physical ATM
at leading • Revenue Growth and Margin
retailers Expansion
Only Cardtronics has ownership of a nationwide ATM asset base,
the leading surcharge-free network and a processing platform
19Value of the Network
Surcharge-Free Network
FI / FinTech
Bank Branding
Retailers
+
More FIs High Value
Drive more Retailers attract
Consumers more FIs 20Built on a Platform to Leverage Scale, Skill and Knowledge
Surcharge-Free Network
Managed FI / FinTech Bank Branding Retailers
Services + Surcharge
Processing & Cash Forecasting Product Engineering Customer
Settlement & Management
The Platform & Expertise Care
21Our Future: Leveraging our Network Significant Today, we have a 4% market share of total withdrawals and
Delivering Shareholder Value

Combination      Invest in product-driven organic growth
of trends,       • Target Metric: 3 - 5% revenue CAGR

network,
product          Drive additional revenues at our existing network and leverage our scale
                 and infrastructure
investments      • Target metrics:
and actions          o Margin expansion
position us          o Adjusted EBITDA CAGR 7 - 9%

well for the
                 Disciplined capital allocation and return excess capital to shareholders
future           after attractive investments and achievement of target leverage
                 • Target net debt to Adjusted EBITDA of 2.0x - 2.5x
                 • Share repurchases
                 • Longer term dividend potential

                                                                                            23
North America Market & Opportunities
Brian Bailey, Managing Director - North America
24North America – Key Messages
1 Our Retail-based ATM network is a competitive and scalable advantage
2 Changes in retail financial services represent a large opportunity for us
Our end-to-end platform is unique and creates value for retailers, financial
3 institutions and consumers
Allpoint, and our growing solution portfolio, solves for growth and efficiency
4 challenges impacting financial institutions
Cardtronics is poised to capitalize on secular trends in financial services and we
5 expect durable organic growth over the long term
25North America Snapshot
Cardtronics is Canada Unit Count of US ATM Owners
the leading 6k Company Owned ATMs 10%
5k Merchant owned ATMs 9%
ATM network #1 Leading Market Position
8%
in North
6%
America 4%
4%
3% 3% 3%
United States 2%
2% 2%
36k Company Owned ATMs 1% 1%
144k Processing and 0%
Managed Service ATMs
#1 Leading Market Position
Mexico
1k Company Owned ATMs
10 Year+ Operating History
26Strong Retail Partnerships Underpin a Robust ATM Network
Our retail
8 of 10 10 years
1
partnerships
enable ATM program with 8 of
the top 10 U.S. retailers
Average age of our
top 10 retail
consumer relationships
convenience
and operating
scale
83% 264 million 2
Of U.S. population lives Annual Cash Withdrawals
within 5 miles of a (Ex. Managed Services)
Cardtronics ATM
1 Source: Kantar Consulting, Stores Top Retailers 2018, US Retailers with an ATM program
2 Cash withdrawals in the North America Segment 27Unprecedented Challenges Facing Two Industries
Cardtronics
can create
value for Financial
Institutions
Retailers
Retailers and
FI’s through
our powerful • Physical banking infrastructure creates • Same store sales headwinds
OPEX headwinds
network and • E-commerce threatens store “trips”
• The battle for consumer deposits and basket size
engaged accelerates, requiring omni-channel
consumers and digital investments • Wage and fixed cost appreciation
creates competitive gap versus
• Compliance and infosec agenda absorbs e-commerce
attention and capital
• Business model diversification
• Emergence of efficient and innovative required in all retail segments
FinTechs
28Two Massive Industries in Service to Consumers
An unrivaled
retail ATM
network is the
key value-add
for Financial
Institutions Surcharge-Free Network
FI / FinTech Bank Branding Retailers
+
More FIs High Value
Drive more Retailers attract
Consumers more FIs
29Preferences for Consumer Financial Services
Consumer Demand Trends
Convenient 30%
30%
and free ATM
25%
access is a top 25%
consideration 20%
20%
21%
19%
18%
for choosing a
financial 15%
services 10%
provider
5%
0%
Useful Online / Mobile Banking Surcharge Free ATM Access Branch Near Me
2014 2018
Source: Novantas Customer Knowledge | 2018 U.S. Shopper Survey 30Financial Institutions – “Expanding While Optimizing”
Retail financial
1 1 1, 2
Core Market Optimization New Market Expansion Digital Bank Expansion
services Banks Shutter 1,700
Branches in Fastest
Bank of America to Open Chase all-mobile bank,
Finn, rolls out nationwide
500 U.S. Branches, Expand
transformation Decline on Record
Wall Street Journal | Feb 5, 2018
Into Ohio
Bloomberg | Feb 26, 2018
in search of millennials
USA Today | Jun 28, 2018
is a significant
opportunity Wells Fargo plans to close
800 more branches by
PNC plans Boston,
Phoenix middle-market
2020 expansion in 2019 1, 2
CNN | Jan 12, 2018 American Banker | Jul 13, 2018 Digital Wallet Growth
Square's new debit card
Regions Bank appoints poses big threat to banks
KeyBank expects to 'ramp Payments Source | Jan 17, 2019
up' branch closures Houston market leader,
Buffalo Bus. Journal | Jan 18, 2019 plans several new branches
Houston Bus. Journal | Jun 28, 2018 How the Venmo Debit Card
May Save PayPal
Investopedia | Oct 12, 2018
1 All logos and trademarks are the property of their respective owners and are not associated with Cardtronics or Allpoint.
2 Potential use-cases are not presently Allpoint Mobile Cash customers. 31U.S. Available Market Expansion Opportunity
Transactions
(billions) ATM Transaction Market Opportunity Deposit market
increase driven by
Unlocking our 10 teller migration to
the ATM
market 8.9B Trans
opportunity 8
through 4.0
2.1
new/enhanced 6
products and $15B
Market
migrated teller 4
transactions 5.3 4.9
2 2.0B Trans*
0
2017 2022
ATM Withdrawals ATM Deposits CATM Available Market
Source: RBR, bank/manufacturer public filings, and CATM market intelligence and estimates;
Transaction Estimates: 1) Excludes non-monetary transactions, bill payments, check cashing, etc. 2) Includes both cash and check deposits.
* Includes IAD Retail ATM and non-branch FI ATM WD market 32Our Platform to Penetrate a Broader Market
Market growth Allpoint Allpoint+ ATM Mobile
Cash
ATM Branding ATM Managed
Services
Solutions
through an
unrivaled ENHANCED NEW NEW ENHANCED ENHANCED
network and a
product line of
FI Partners
new and
enhanced
solutions Transaction driving initiatives shift transactions to our ATM network
Retail Foundation
33Organizational Execution Enables Organic Growth
Organizational Sales and Relationship Product and Solution Line
Operational Excellence
actions Management Management
support • Sales compensation • Service Account • Product Lifecycle
tied to transaction Management (SAM) Management (PLM)
organic driving team established methodology for
growth, solution execution
• Dedicated industry • World class customer
operational sales teams support desk • Novantas partnership
execution, and • New CRM tools and • “Bank Grade”
for FI value alignment
customer management system compliance and • Portfolio management
infosec process for capital
success • Customer Success/ investment
Loyalty platform • FI SLAs and service prioritization
offers for FI Managed
Services
34The Cardtronics Value Proposition In Action
• Houston, TX area based credit union
Our solution •
•
Top 100 CU
$3B in assets, 40+ branches
platform
enables
growth and 2007 2012 2014 2017 2018
value for
Joined Allpoint Branded ATMs in Began ATM Managed Fleet-wide turnkey Enabled retail
Houston and Dallas Service for high ATM Managed deposits at
profile non-branch Service agreement Allpoint+ ATMs
Retailers and sites
FIs
35North America Market & Opportunities
Brad Nolan, Executive Vice President - Allpoint Solutions
36Comprehensive Solutions Platform for Financial Institutions
Unparalleled • Investing to improve our core Allpoint, Branding and Managed Services
advantage in offerings, while also introducing new solutions to meet the needs of this
evolving market place
enabling FIs to
achieve key Allpoint Allpoint+ ATM Mobile
Cash
ATM Branding ATM Managed
Services
growth,
experience and
efficiency ENHANCED
Membership to
NEW
Membership to a
NEW
Cardless access to
ENHANCED
Our sites and
ENHANCED
Managing FI ATMs
imperatives our network of
surcharge-free
growing network
of cash and check
our network of
cash dispense and
devices, the FI’s
brand and
to reduce cost and
increase capability,
cash dispense deposit ATMs in deposit ATMs in experience both at the branch
ATMs prime retail convenient, and away from the
locations trusted locations branch
• All solutions are “on demand” and enable ability to quickly, and cost
efficiently “flex distribution capacity”
37Surcharge-Free Solutions
Allpoint is the • With 40,000 ATMs in the US and just over 55,000 globally, the
Allpoint Surcharge-Free ATM network is the foundation for FI
largest, most growth, experience and efficiency
convenient,
100% retail
surcharge-free
ATM Network
• Allpoint
• ATM
Branding
38Allpoint = Largest, most convenient,
100% retail surcharge-free network
TM
Free & convenient ATM access =
Deposit growth for FIs
Deposit ATMs
Secular changes in how consumers coming soon to a
bank = Massive opportunity retailer near you
ATM deposit taking = table stakes to
unlock the market
Introducing Allpoint+
The 100% Retail, Surcharge-Free
Deposit ATM Network
39Deposits Now Rolling Out to Allpoint ATMs
Building the • Ability to accept cash and checks further enables transactions beyond
deposits including payments and check cashing
largest 100%
retail deposit • Retail deposits will be a catalyst for branch transformation, creating an
industry-first network to quickly enter new markets and grow in existing
network markets while optimizing costly branch and ATM fleets
Deposits can Withdrawals
outnumber
withdrawals at
• Allpoint+ certain ATM
locations Deposits
ATM Cash
Deposits can
outnumber
Check Deposits
by more than 5:1
40Digital disrupting major segments of
the market
Innovative & accessible products
driving value shift to FinTechs
Many FinTechs lack carded portfolios
– a barrier to cash enablement
FinTech needs extend beyond basic
withdrawal, deposit and transfers
Introducing ATM Mobile Cash
The API-based ATM Network
[Available market representation. Not presently CATM ATM Mobile Cash customers.] 41ATM Mobile Cash Now Rolling Out to Cardtronics ATMs
Only ATM • ATM Mobile Cash “Cardless” transactions will tap into the exploding
FinTech segment
network to
enable a • Enables customers to convert funds held in digital accounts to physical
cash in hand – and now with deposits – convert physical cash to digital
broad range of
transaction
types
• ATM Mobile
Cash
42Managed Services Solutions
Comprehensive • Addressable market of >7K Financial Institutions and 90K+ ATMs
ATM services • Bringing best-in-class innovation, marketing engagement, technology,
from world’s security and operations to our FI partners… both inside the branches and
largest, remote
vertically
Manage Secure Engage
integrated ATM
operator Hardware/ Team Brand
Software Services Awareness
• Managed
Services Operational Data Center Innovation
Services & Networks
Processing Physical Targeted
Services Device Marketing
Network Services
43Solutions Platform Offers Measurable Benefits for FIs
Partnered with • Net effect is more total customers and revenues at a lower cost to serve
Novantas to
Growth & Experience Efficiency
understand Add Customers/ Increase Retention Reduce Transaction Cost
impact of
-11.5% Fewer
free and +1.6% Incremental
Total Customers
Teller FTEs
convenient -7.3% Fewer
access to cash Teller Transactions
Before & After CATM Partnership Before & After CATM Partnership
• Large surcharge-free network • More customers transact with
provides marketing value that off-premise ATMs and
attracts new checking customers transactions move off of the
bank’s teller line, saving the bank
• Multi-channel engagement money
equals higher retention and
stickier balances
Source: Novantas Analysis and Benchmarks 44Benefits Intensify When Network Replaces FI Owned Infrastructure
Convenience • Allpoint and Allpoint+ enable exponentially more points to transact at a
fraction of the cost per site
comes at a
significant Allpoint/ Branding
ATM Transactions
cost when you
are only Teller Transactions
Network
Infrastructure
$200K – $350K
serving your Annual Teller Expense per Branch
customers
Lower Cost per Site/
FI ATM Transactions
More Convenient
$10K – $45K
Annual Expense per ATM “Light” On-Demand Business Model
Dedicated Physical
Infrastructure
Higher Cost per Site/
Less Convenient
“Heavy” Business Model
Source: Novantas Benchmarks and Analysis | CATM Analysis | Note: Ranges based on FI size, branch size (back-office/overhead expenses not included) and ATM/ Transaction type (cash dispense/deposit) 45Allpoint & Bank Branding Benefit Consumers, FIs & Retailers
38% increase in
Withdrawals
(baseline)
Pre Post
withdrawals 160%
in the 12 140% 38%
months Withdrawal
Increase
120%
following YOY
Allpoint and FI 100%
Branding 80%
implementation 60%
Allpoint
Launch
Branding
Launch
40%
20%
0%
National Retailer Baseline National Retailer + Allpoint +
Branding
46North America – Key Messages
1 Our Retail-based ATM network is a competitive and scalable advantage
2 Changes in retail financial services represent a large opportunity for us
Our end-to-end platform is unique and creates value for retailers, financial
3 institutions and consumers
Allpoint, and our growing solution portfolio, solves for growth and efficiency
4 challenges impacting financial institutions
Cardtronics is poised to capitalize on secular trends in financial services and we
5 expect durable organic growth over the long term
47International Market & Opportunities
Marc Terry, Managing Director - International
48EMEA and Australia & NZ Snapshot
United Kingdom &
Ireland
18k owned ATMS
~1k Merchant owned ATMs
>80% of EMEA Revenues in ‘18
Germany
1.5k owned ATMs
~10% of EMEA Revenues in ‘18
Spain
~350 owned ATMsEMEA and Australia & NZ – Key Takeaways
1 Significant free cash flow in mature markets with growth trajectory
2 Double-digit revenue and Adjusted EBITDA expansion in growth markets
3 Further penetration into the cash value chain across all markets
4 Adjusted EBITDA growth expected for consolidated International
segment in 2020 and beyond
50Cash Characteristics by Market
UK & Australia: Germany, Spain, South Africa:
Driving transactions at existing locations Growing ATM count
• Cardtronics is bigger than the top 3 banks • Cash dominates as a consumer payment
combined preference
o Strong demand for cash access
• Cash in circulation continues to rise
o Banks retreating from cash provision
• Financial institution branch and ATM o New payment types growing slowly
reduction
• Spain: popular tourist destination
• Governmental focus on financial inclusion
• Germany: strong cash economy
• Scale drives adjacent business opportunity
• South Africa: underserved, growing rapidly
Positioning a return to
Continued double-digit growth
growth and extension into
in revenue and Adjusted EBITDA
adjacent product categories
51Strategy by Market
Mature Markets Growth Markets
• Strategy is to grow transactions per ATM • Significant growth opportunity driven by:
o Economic growth and tourism
• Cardtronics’ scale and capabilities are the
o Underserved markets
differentiator
o Shifting banking trends
o Network capabilities and profit
opportunities include: • Longer runway on network potential
Bank branding and ancillary services
Managed services
Product enhancement
Expect growth in top and bottom line across International in 2020 and beyond
52Strategic Drivers – Australia & NZ
Bank and
ATM count
Bank rationalization driving opportunity (thousands)
25
• Bank surcharge elimination drove strategy change
o Expected ATM reduction by banks of >20% in 20
2019 and 2020
o Transaction decline has been less than expected
15
• Need for ATM utility is an Allpoint opportunity
10
• Cardtronics is the largest IAD
o ~30% market share of total ATM estate
o Non-bank ATMs projected to process over 50%
5
of transactions by 2021, up from around 35%
today 0
2017 2018 2019 2020
• Forecasting to stabilize Adjusted EBITDA in 2019
Bank ATMs IAD ATMs
Source: RBR, AusPaynet and Company estimates 53Strategic Drivers – UK
UK Market Share
Leading operator in (Transaction volume 2018)
Europe’s 2nd largest economy
BOI
LINK network changes required Cardtronics to Barclays 8%
shift strategy
CATM
9%
21%
UK’s largest deployer with ~29% market share
Sainsbury's
of ATMs
9%
Over 5,000 bank branches closed since ‘10
• c30% reduction
• Resulting service issues / dissatisfaction for
consumers and small businesses
Other FIs
Return to long term, profitable growth RBS 15%
• Optimization and fixed cost reduction 21%
• Migration from Free-To-Use ATMs to Pay-To-Use
machines
• Leverage new growth opportunities Other IADs
17%
o Financial Institutions (managed services)
o Branch replacement Source: UK Payments Administration 54UK Opportunity – Bank Hub
Revolutionary Shared Service Model
Bank Hub is a new concept from a
consortium of three banks
• Outsourced hub replicates branch cash
activities for small to medium sized
enterprises
Initial pilot phase operational in Q4 2018
delivering:
• Check, note, and coin deposit
• Business bag drop
55Strategic Drivers - Germany
Cash-heavy market primed for growth Market Share (ATMs)
Cardtronics is largest IAD with 3% share
Rich environment for growth Banks, 92%
• Co-branding and outsourcing for Financial
Institutions
• Product expansion into deposit and recycling
ATMs
Focus on three sales channels CATM, 3%
• Traditional, single sites
• Multi-site placements
• Financial Institutions IADs, 5%
Source: RBR 56Germany – Growth Opportunities
Banking inefficiencies are an opportunity Volume growth from retail partnerships
Europe’s most fragmented banking market • Network of over 850 petrol stations
• 1,400+ Credit Unions and Building Societies
• ATM placement agreement across franchise
• Heavy focus by banks on cost rationalization
• Consolidation of smaller banks expected • Installing new ATMs in high traffic sites
Cardtronics is uniquely positioned to • Further adjacencies for new products
capitalize on this opportunity
Innovative deal with Postbank signed in 2018
• One of Germany’s largest retail banks
• 675 Cardtronics sites co-branded
• Surcharge free access for Postbank cardholders
• Drives incremental usage
57Strategic Drivers – Spain
Spain is one of the world’s Bank Branch & ATM Count (thousands)
leading travel destinations 50 70
Focus on tourism accelerated growth in ‘18
• In 2017 tourism was €180bn or 14% of GDP
40 60
• Heavy British tourist presence familiar with
Cardtronics branding
Limited access to bank ATMs is a key driver 30 50
• Bank branch network down 39% since 2008
Financial Institution penetration is a lever for 20 40
growth
• Selective expansion into the bank sector
• ING deal completed in 2018 10 30
0 20
2008 2010 2012 2014 2016 2018
Bank Branches (left) ATM Count (right)
Source: RBR & ECB 58Strategic Drivers – South Africa
Count South African ATM Market Withdrawals
Africa’s second largest economy (thousands) (millions)
50 1,600
Favorable market conditions
1,400
• 2nd largest IAD with 10% share
40
• High demand for cash access driven by 1,200
o Informal economy 1,000
30
o Consumer preference
800
o Strong governmental support
20 600
Opportunity to capitalize on shifting FI sector
400
• Dominated by “Big 4” banks 10
o Reducing their branch networks and costs 200
• New bank entrants need partners like CATM 0 0
New growth initiatives
• Leverage recent bank wins to drive new
Forecasted ATM Count (left) Total ATM withdrawals (right)
outsourcing
Source: RBR 59Recent South Africa Successes
Cardtronics Fastest growing bank in South Africa
runs ATMs for • CATM is a key contributor to building a national
network of Capitec-branded ATMs
the top South • Today, ~2,000 bank branded, non-branch ATMs
African banks • Cardholders get cheaper access to cash
• Delivers bank presence in underserved areas
One of South Africa’s largest and oldest FIs
• Fully outsourced offering
• 300 in-branch ATMs
• Potential to extend to new sites
60EMEA and Australia & NZ – Key Takeaways
1 Significant free cash flow in mature markets with growth trajectory
2 Double-digit revenue and Adjusted EBITDA expansion in growth markets
3 Further penetration into the cash value chain across all markets
Adjusted EBITDA growth expected for consolidated International
4 segment in 2020 and beyond
61Financial Overview
Gary W. Ferrera – Chief Financial Officer
62Long History of Growth
Revenue $mm
growth and
margin
expansion
driven by a
combination of
acquisitions
and organic
expansion
7-Eleven 12.5% of Rev
~40% Margins
63Driving Free Cash Flow
$300 Cash Flow from
Operations
$250
$225mm
$200
$mm
$118mm(1)
$150 Adj. Free Cash Flow
$100 $46mm $107mm
$50 Capex
$0
2011 2012 2013 2014 2015 2016 2017 2018
1. Adjusted free cash flow as disclosed in our periodic SEC filings 64Recent Capital Allocation
2018 Capital Allocation – last 5 years
• Focus on organic $600
growth and debt
reduction $400
$200
• No material
acquisitions in 2018 $mm
$-
• Reduced capital $(200)
requirements post
EMV upgrades
$(400)
$(600)
2014 2015 2016 2017 2018
Capital Expenditure M&A Debt Repayment / (Issuance)
652018 Review
We delivered Drive organic growth & Operational excellence & Deliver growth in free
on key goals durable revenue streams portfolio optimization cash flow
and priorities
+4% North America
revenue growth (1)
Record high network
availability
~60% Adjusted
free cash flow
growth
+6% US same-store
transaction growth (2) Fleet optimization
in the UK and
Reduced total debt
outstanding $113
Australia million
Double-digit revenue
and Adjusted EBITDA Began ERP
deployment and
Expanded credit
facility drives savings
growth in Germany, systems and future capital
Spain and South Africa consolidation allocation
1. Full year results compared to 2017; Constant-currency and excluding revenue attributable to 7-Eleven
2. Full year transactions compared to 2018 662018 Outlook Progression
Improved $B 2018 Revenue Outlook (midpoint) $mm 2018 Adj. EBITDA Outlook (midpoint)
market trends $1.40 $300
and execution $1.35
enabled better $275
$1.30
than expected $250
performance $1.25
in 2018 $1.20 $225
4Q17 1Q18 2Q18 3Q18 FY18 4Q17 1Q18 2Q18 3Q18 FY18
Actual Actual
1Q18 2Q18 3Q18
• Better than expected • Improved global • Continued record
US same-store transaction trends uptime and
• UK property tax • Australia better than availability
benefit expected
• FX tailwind • Record uptime 672019 Outlook Recap
Full-year 2019 Outlook Ranges Commentary
• Growth in North America led by surcharge-free;
• Revenue = $1.31 billion to $1.35 billion
continued strong growth in Germany, Spain
and South Africa
• Adjusted EBITDA = $285 to $295 million • Adjusted EBITDA approximately flat and back-
end weighted as UK interchange rates and
property tax headwind partly offset solid US
growth
• Adjusted EPS = $1.94 to $2.05 • Higher depreciation from recent investment
profile; lower interest expense due to recent
refinancing
• CapEx of ~$135 million • Investment in new technology, capabilities and
additional placements
682018 to 2019 Outlook Bridges
Revenue $mm
$1,350
High and
~(1%) low end of
outlook
range
~(1%) ~1%
$1,345 $1,310
2018A UK Link UK / AUS Net Organic Growth 2019
Interchange Reduction Samestore / Removals Outlook
Adj. EBITDA $mm
High and $295
~(2%) low end
of
~5% outlook
~(7%) range
~3% $285
$293 ~(1%)
2018A UK Property Tax UK LINK Currency Rates Cost Saving Net Organic 2019
(2018 Non- Interchange Initiatives Revenue Growth Outlook
Recurring benefit) Reduction 69North America - Driving Growth
Positioned for Transaction
Revenue Mix
Growth
2018 2 to 4 years
• Continued growth with financial
institutions drives increased
organic surcharge-free Surcharge-Free 32%
transactions and managed services
• Allpoint+ (deposits) drives
additional transactions Surcharge 56%
• Mobile and cardless access enables
additional uses
• Top line growth in the mid-to- Managed Services 12%
high single digits
70Europe, Africa, Australia – Balance of cash flow and growth
Positioned to Capitalize on Banking
Revenue Mix – Europe and Africa
& Consumer Developments
2018
• ATM deployment in growth markets
Surcharge-Free 66%
• Optimize ATM fleet in mature markets Surcharge 31%
Managed Services 3%
• Market-leading position drives
adjacent business opportunities
Revenue Mix – Australia and New Zealand
• Expect top line growth in low-single
digits, beginning in 2020 2018
Surcharge-Free 5%
Surcharge 77%
Managed Services 18%
71Drivers of Revenue Growth
Medium term Expected Revenue Growth Mix
revenue
growth of 3 to 5%
~30%
3 to 5% Revenue
Growth
Global
~25% Surcharge /
Pay-to-Use
North and Other
~45% America
Managed
Services
North America
Surcharge-Free
2019 2023
72Focus on Efficiency and Driving Margin Expansion
Multiple levers Revenue growth largely leverages existing asset base
• Incremental transactions and new products are margin accretive
for margin
expansion
Continued focus on Operational Excellence
• Integration of disparate systems and processes
• Fleet optimization
• ATM availability
ERP investment will drive savings
• Roll out in 2018 / 2019 to drive savings beginning in 2020
Standardization of processing platforms is scalable
73Recent Capital Investment
Five-Year Capital Investment
• Reduced growth capital
in 2018 driven by fleet $mm % of Rev
re-allocation and use of
warehouse inventory
• ERP and infrastructure
investments in 2018
and 2019 to support
future growth and cost
rationalization
• 2019 investments
driven by enhanced
functionality, new
product and new
placements
74Medium Term Outlook
Top Line Growth Revenue
3-5% CAGR
+
Adj. EBITDA
Operating Efficiency
7-9% CAGR
+
Annual Capex
Disciplined Capital Investment ~8-10% of
Revenues
75Capital Allocation Priorities
Durable Growth Preserve Balance Sheet Shareholder Return
• Product and technology • Target net debt to Adjusted • Long-term, return excess cash
enhancements to drive EBITDA between 2.0x and 2.5x to shareholders
growth
o Share repurchases
2.8x
o Allpoint+ and/or dividend
2.0x – 2.5x
o Enable additional
• Announced opportunistic $50
transactions
million share repurchase plan
o Bank grade capabilities
for FIs 2018 Target
• Managed Services • Anticipate being in target
leverage range by late 2019 or
• ATM placements in select early 2020
global markets
• Flexibility to fund continued
growth and return of capital
76Key Takeaways
We expect to generate durable medium term 3-5% revenue growth and 7-
1 9% Adjusted EBITDA growth
Evolving secular trend with FIs and FinTech disruptors represents a
2 significant growth opportunity in a $15B market, in the US alone
Our unrivaled network, end-to end capabilities and investment in new
3 products best position Cardtronics to capitalize on these changes in
consumer financial services
Cardtronics is poised to deliver long-term shareholder return via durable
4 earnings growth and disciplined capital allocation
77Appendix
78Forward Looking Statements
Certain statements and information in this presentation contain “forward-looking statements” within the meaning of the Private Securities Litigation Reform Act of 1995, as amended and are intended to be covered by the safe
harbor provisions thereof. Forward-looking statements can be identified by words such as “project,” “believe,” “estimate,” “expect,” “future,” “anticipate,” “intend,” “contemplate,” “foresee,” “would,” “could,” “plan,”
and similar expressions that are intended to identify forward-looking statements, which are generally not historical in nature. These forward-looking statements are based on management’s current expectations and beliefs
concerning future developments and their potential effect on the Company. While management believes that these forward-looking statements are reasonable as and when made, there can be no assurance that future
developments affecting the Company will be those that are anticipated. All comments concerning the Company’s expectations for future revenues and operating results are based on its estimates for its existing operations and
do not include the potential impact of any future acquisitions. The Company’s forward-looking statements involve significant risks and uncertainties (some of which are beyond its control) and assumptions that could cause
actual results to differ materially from its historical experience and present expectations or projections. Known material factors that could cause actual results to differ materially from those in the forward-looking statements
include:
• the Company’s financial outlook and the financial outlook of the automated teller machines and multi-function financial services kiosks (collectively, “ATMs”) industry and the continued usage of cash by consumers at
rates near historical patterns;
• the Company’s ability to respond to recent and future network and regulatory changes;
• the Company’s ability to renew its existing merchant relationships on comparable economic terms and add new merchants;
• changes in interest rates and foreign currency rates;
• the Company’s ability to successfully manage its existing international operations and to continue to expand internationally;
• the Company’s ability to manage concentration risks with and changes in the mix of key customers, merchants, vendors, and service providers;
• the Company’s ability to prevent thefts of cash and maintain adequate insurance;
• the Company’s ability to manage cybersecurity risks and protect against cyber-attacks and manage and prevent cyber incidents or other business disruptions;
• the Company’s ability to respond to changes implemented by networks and how they determine interchange, scheduled and potential reductions in the amount of net interchange fees that it receives from global and
regional debit networks for transactions conducted on its ATMs due to pricing changes implemented by those networks as well as changes in how issuers route their ATM transactions over those networks;
• the Company’s ability to provide new ATM solutions to retailers and financial institutions including placing additional banks’ brands on ATMs currently deployed;
• the Company’s ATM vault cash rental needs, including potential liquidity issues with its vault cash providers and its ability to continue to secure vault cash rental agreements in the future on reasonable economic terms;
• the Company’s ability to manage the risks associated with its third-party service providers failing to perform their contractual obligations;
• the Company’s ability to renew its existing third-party service provider relationships on comparable economic terms;
• the Company’s ability to successfully implement and evolve its corporate strategy;
• the Company’s ability to compete successfully with new and existing competitors;
• the Company’s ability to meet the service levels required by its service level agreements with its customers;
• the additional risks the Company is exposed to in its United Kingdom (“U.K.”) armored transport business;
• the Company’s ability to pursue, complete, and successfully integrate acquisitions, strategic alliances, or joint ventures;
• the impact of changes in laws, including tax laws, that could adversely affect the Company’s business and profitability;
• the impact of, or uncertainty related to, the U.K.’s planned exit from the European Union, including any material adverse effect on the tax, tax treaty, currency, operational, legal, and regulatory regime and macro-
economic environment to which it will be subject to as a U.K. company;
• the Company’s ability to adequately maintain and upgrade its ATM fleet to address changes in industry standards, regulations and consumer behavior patterns;
• the Company’s ability to retain its key employees and maintain good relations with its employees; and
• the Company’s ability to manage the fluctuation of its operating results, including as a result of the foregoing and other risk factors included in the 2018 Form 10-K.
Additional information regarding known material factors that could cause the Company's actual results to differ from its projected results are described in its filings with the Securities and Exchange Commission, including its
Annual Report on Form 10-K, Quarterly Reports on Form 10-Q, and Current Reports on Form 8-K. You should not read forward-looking statements as a guarantee of future performance or results. They will not necessarily be
accurate indications of the times at or by which such performance or results will be achieved. Forward-looking statements speak only as of the date the statements are made and are based on information available at the time
those statements are made and/or management's good faith belief as of that time with respect to future events. Unless required by law, the Company undertakes no obligation to publicly update or revise any forward-looking
statements after the date they are made, whether as a result of new information, future events, or otherwise.
In addition, today’s presentation includes certain non-GAAP financial measures as defined under SEC Regulation G. The reasons we believe such measures are useful together with a reconciliation of those measures to the most
directly comparable U.S. GAAP measures have been included in the appendix to the presentation.
79Disclosure of Non-GAAP Financial Information
Adjusted Gross Profit, Adjusted Gross Margin, EBITDA, Adjusted EBITDA, Adjusted Net Income, Adjusted Net Income per diluted share, Adjusted Free Cash Flow, and certain GAAP and
non-GAAP measures on a constant-currency basis represent non-GAAP financial measures provided as a complement to financial results prepared in accordance with GAAP and may not
be comparable to similarly-titled measures reported by other companies. The Company uses these non-GAAP financial measures in managing and measuring the performance of its
business, including setting and measuring incentive based compensation for management. Management believes that the presentation of these measures and the identification of
notable, non-cash, and/or (if applicable in a particular period) certain costs not anticipated to occur in future periods enhance an investor’s understanding of the underlying trends in the
Company’s business and provide for better comparability between periods in different years.
• Adjusted Gross Profit represents total revenues less the total cost of revenues, excluding depreciation, accretion, and amortization of intangible assets. Adjusted Gross Margin is
calculated by dividing Adjusted Gross Profit by total revenues.
• Adjusted EBITDA excludes:
― Depreciation, accretion, and amortization of intangible assets as these amounts can vary substantially from company to company within the Company’s industry depending
upon accounting methods and book values of assets, capital structures, and the methods by which the assets were acquired.
― Adjusted EBITDA also excludes share-based compensation expense, acquisition and divestiture-related expenses, certain non-operating expenses, (if applicable in a particular
period) certain costs not anticipated to occur in future periods, gains or losses on disposal and impairment of assets, the Company’s obligations for the payment of income
taxes, interest expense, and other obligations such as capital expenditures, and includes an adjustment for noncontrolling interests.
• Adjusted Net Income represents net income computed in accordance with GAAP, before amortization of intangible assets, gains or losses on disposal and impairment of assets, share-
based compensation expense, certain other expense amounts, acquisition and divestiture-related expenses, certain non-operating expenses, and (if applicable in a particular period)
certain costs not anticipated to occur in future periods (together, the “Adjustments”).
― The non-GAAP tax rate used to calculate Adjusted Net Income was approximately 20.9% and 24.1% for the three and twelve months ended December 31, 2018, respectively,
and 28.6% and 27.7% for the three and twelve months ended December 31, 2017, respectively. The non-GAAP tax rates represent the GAAP tax rate for the period as adjusted
by the estimated tax impact of the items adjusted from the measure. Adjusted Net Income per diluted share is calculated by dividing Adjusted Net Income by weighted
average diluted shares outstanding. Adjusted Free Cash Flow is defined as cash provided by operating activities less the impact of changes in restricted cash due to the timing
of settlements and less payments for capital expenditures, including those financed through direct debt, but excluding acquisitions.
• The Adjusted Free Cash Flow measure does not take into consideration certain other non-discretionary cash requirements such as mandatory principal payments on portions of the
Company’s long-term debt.
• Management calculates certain GAAP as well as non-GAAP measures on a constant-currency basis using the average foreign currency exchange rates applicable in the corresponding
period of the previous year and applying these rates to the measures in the current reporting period.
• Management uses GAAP as well as non-GAAP measures on a constant-currency basis to assess performance and eliminate the effect foreign currency exchange rates have on
comparability between periods.
• The non-GAAP financial measures presented herein should not be considered in isolation or as a substitute for operating income, net income, cash flows from operating, investing, or
financing activities, or other income or cash flow measures prepared in accordance with GAAP. Reconciliations of the non-GAAP financial measures used herein to the most directly
comparable GAAP financial measures are presented in tabular form at the end of this earnings release.
80Consolidated Results: Reconciliation of Non-GAAP Items
Three Months Ended Twelve Months Ended
December 31, December 31,
2018 2017 2018 2017 (1) Includes foreign currency translation gains/losses, the
revaluation of the estimated acquisition related contingent
Net (loss) income attributable to controlling interests and available to common shareholders $ (6,104) $ 15,954 $ 3,676 $ (145,350) consideration, and other non-operating costs.
Adjustments:
Interest expense, net 8,244 9,276 35,429 35,036 (2) Noncontrolling interests adjustment made such that
Amortization of deferred financing costs and note discount 4,827 3,257 14,887 12,574
Adjusted EBITDA includes only the Company’s ownership
interest in the Adjusted EBITDA of one of its Mexican
Redemption costs for early extinguishment of debt 6,408 — 6,408 —
subsidiaries.
Income tax expense (benefit) 48 (6,957) 10,457 (9,292)
Depreciation and accretion expense 32,746 33,353 126,199 122,036 (3) For the three and twelve months ended December 31, 2018
Amortization of intangible assets 12,648 12,443 52,911 57,866 and 2017, expenses include employee severance and other costs
EBITDA $ 58,817 $ 67,326 $ 249,967 $ 72,870 incurred in conjunction with a corporate reorganization and
cost reduction initiative. For the twelve months ended
Add back: December 31, 2017, expenses also include amounts associated
Loss on disposal and impairment of assets 2,290 7,105 17,873 33,275 with the Company’s redomicile of its parent company to the
Other expense (income) (1) 697 5,254 (627) 3,524 U.K. that occurred on July 1, 2016.
Noncontrolling interests (2) 7 (6) 38 (25)
Share-based compensation expense 5,033 4,422 15,660 14,395 (4) Acquisition expenses include costs incurred for professional
Restructuring expenses (3) 1,052 2,111 6,586 11,136
and legal fees and certain other transition and integration-
related costs. Expenses include employee severance and lease
Acquisition related expenses (4) 558 3,579 3,191 18,917
termination costs related to DCPayments acquisition
Goodwill and intangible asset impairment (5) — — — 194,521
integration in the twelve months ended December 31, 2017.
Adjusted EBITDA $ 68,454 $ 89,791 $ 292,688 $ 348,613
Less: (5) Goodwill and intangible asset impairments related to the
Interest expense, net 8,244 9,276 35,429 35,036 Company’s Australia & New Zealand segment.
Depreciation and accretion expense (6) 32,745 33,352 126,197 122,029
Adjusted pre-tax income $ 27,465 $ 47,163 $ 131,062 $ 191,548 (6) Amounts exclude a portion of the expenses incurred by one
Income tax expense (7) 5,740 13,489 31,529 53,084 of its Mexican subsidiaries to account for the amounts allocable
Adjusted Net Income $ 21,725 $ 33,674 $ 99,533 $ 138,464 to the noncontrolling interest shareholders.
(7) For the three and twelve months ended December 31,
Adjusted Net Income per share – basic $ 0.47 $ 0.74 $ 2.16 $ 3.03
2018, the non-GAAP tax rate used to calculate Adjusted Net
Adjusted Net Income per share – diluted $ 0.47 $ 0.73 $ 2.14 $ 3.00 Income was 20.9% and 24.1%, respectively, and 28.6% and
27.7% for the three and twelve months ended December 31,
Weighted average shares outstanding – basic 46,116,518 45,685,325 45,988,775 45,619,679 2017, respectively, which represents the Company’s GAAP tax
Weighted average shares outstanding – diluted 46,581,822 46,193,914 46,436,439 46,214,715 rate as adjusted for the net tax effects related to the items
excluded from Adjusted Net Income.
81Business Segment Results: Reconciliation of Constant-Currency
Items
Consolidated revenue: Three Months Ended
December 31,
2018 2017 % Change
U.S. Foreign Currency U.S. U.S.
GAAP Impact Constant - Currency GAAP GAAP Constant - Currency
ATM operating revenues $ 314,141 $ 6,572 $ 320,713 $ 346,181 (9.3) % (7.4) %
ATM product sales and other revenues 13,756 170 13,926 16,784 (18.0) (17.0)
Total revenues $ 327,897 $ 6,742 $ 334,639 $ 362,965 (9.7) % (7.8) %
Year Ended
December 31,
2018 2017 % Change
U.S. Foreign Currency U.S. U.S.
GAAP Impact Constant - Currency GAAP GAAP Constant - Currency
ATM operating revenues $ 1,292,930 $ (10,446) $ 1,282,484 $ 1,451,372 (10.9) % (11.6) %
ATM product sales and other revenues 52,313 (273) 52,040 56,227 (7.0) (7.4)
Total revenues $ 1,345,243 $ (10,719) $ 1,334,524 $ 1,507,599 (10.8) % (11.5) %
82Business Segment Results: Reconciliation of Constant-Currency
Items
North America revenue: Three Months Ended
December 31,
2018 2017 % Change
U.S. Foreign Currency U.S. U.S.
GAAP Impact Constant - Currency GAAP GAAP Constant - Currency
(In thousands)
ATM operating revenues $ 193,220 $ 1,431 $ 194,651 $ 249,964 (22.7) % (22.1) %
ATM product sales and other revenues 10,639 52 10,691 9,654 10.2 10.7
Total revenues $ 203,859 $ 1,483 $ 205,342 $ 259,618 (21.5) % (20.9) %
Twelve Months Ended
December 31,
2018 2017 % Change
U.S. Foreign Currency U.S. U.S.
GAAP Impact Constant - Currency GAAP GAAP Constant - Currency
ATM operating revenues $ 786,620 $ 157 $ 786,777 $ 932,962 (15.7) % (15.7) %
ATM product sales and other revenues 42,665 (16) 42,649 47,423 (10.0) (10.1)
Total revenues $ 829,285 $ 141 $ 829,426 $ 980,385 (15.4) % (15.4) %
83Business Segment Results: Reconciliation of Constant-Currency
Items
Europe & Africa revenue Three Months Ended
December 31,
2018 2017 % Change
U.S. Foreign Currency U.S. U.S.
GAAP Impact Constant - Currency GAAP GAAP Constant - Currency
ATM operating revenues $ 95,580 $ 3,121 $ 98,701 $ 102,403 (6.7) % (3.6) %
ATM product sales and other revenues 3,056 113 3,169 2,444 25.0 29.7
Total revenues $ 98,636 $ 3,234 $ 101,870 $ 104,847 (5.9) % (2.8) %
Year Ended
December 31,
2018 2017 % Change
U. S. Foreign Currency Constant - U.S. U.S. Constant -
GAAP Impact Currency GAAP GAAP Currency
(In thousands)
ATM operating revenues $ 400,390 $ (13,614) $ 386,776 $ 396,229 1.1 % (2.4)%
ATM product sales and other revenues 9,379 (262) 9,117 8,603 9.0 6.0
Total revenues $ 409,769 $ (13,876) $ 395,893 $ 404,832 1.2 % (2.2)%
84You can also read