Investor & Analyst Presentation - Second quarter 2011 August 2011 - H. LUNDBECK A/S
←
→
Page content transcription
If your browser does not render page correctly, please read the page content below

H. LUNDBECK A/S

Investor & Analyst
Presentation
Second quarter 2011
August 2011

Company disclaimer

 This presentation contains forward-looking statements that provide our expectations or
 forecasts of future events such as new product introductions, product approvals and
 financial performance.

 Such forward-looking statements are subject to risks, uncertainties and inaccurate
 assumptions. This may cause actual results to differ materially from expectations and
 it may cause any or all of our forward-looking statements here or in other publications
 to be wrong. Factors that may affect future results include interest rate and currency
 exchange rate fluctuations, delay or failure of development projects, production
 problems, unexpected contract breaches or terminations, government-mandated or
 market-driven price decreases for Lundbeck's products, introduction of competing
 products, Lundbeck's ability to successfully market both new and existing products,
 exposure to product liability and other lawsuits, changes in reimbursement rules and
 governmental laws and related interpretation thereof, and unexpected growth in costs
 and expenses.

                                                                                           2
Why invest in Lundbeck?

  Well-established track-record for innovation
  and commercialisation in CNS
  Clear therapeutic focus on selected
  segments
  Substantial unmet medical needs in CNS
  Brand leadership and strong core business
  support growth opportunities
  Lundbeck at the verge of a new product
  cycle
  Several potential product launches before
  2014
  Strong balance sheet and cash generation
  provide flexibility

                                                 3
Our vision -
To become a world leader in CNS

                   Focused on                  Lundbeck priorities
                      CNS
                                                  Maintain focus on the core
                                                  business and grow the
 Increasing                     Research and      company
   product                       innovation-
diversification                    driven         Advance the pipeline
                                                  Continue to expand
                                                  globally
                                                  Return cash to
                              Fully
                         integrated with
                                                  shareholders
         Global
        presence           partnership
                            approach

                                                                           4
Building a better Lundbeck

      Decisions Now
      Improving organisational      Pipeline
      efficacy and effectiveness    Advancing clinical
                                    programmes

               Business Development
               New product opportunities

                                                         5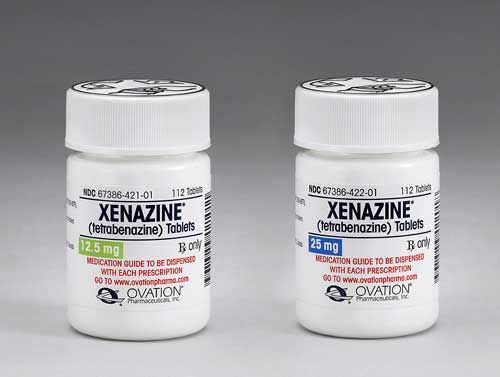
Q2 2011 – solid momentum continues
Operations
  The solid performance continued in the second quarter
         9% revenue growth (y/y)
         18% EBIT growth (y/y)
  Revenue and EBITDA now expected to be in the high end of the guidance range
  Reduction of R&D staff considered necessary as part of ongoing optimization
  programme
  Continued solid cash flow

New product opportunities
  Lexapro® to be launched in Japan in August
  Continued roll-out of Sycrest®

Pipeline
  Nalmefene completes phase III – MAA submission expected by the end of 2011
  Programmes with Lu AA24493 in Friedreich’s ataxia, Lu AA39959 and two
  phase I projects terminated
                                                                                6
Q2 2011 - commercial review
                                                                                           Cipralex®/Lexapro®
                                                                                              Cipralex® withdrawn in Germany (public market)
Product distribution
                                                                                              Market share expansion in Canada continues
                                        Revenue                            Growth             New Chinese sales force in place
 DKKm                                   Q2 2011                  Actual             CER
 Cipralex®                                    1,531                   2%             6%    Ebixa®
 Lexapro®                                        714                13%             13%       Reimbursement in Italy continues to support
                                                                                              sales
 Ebixa®                                          707                16%             19%
                                                                                              Positive development in UK after
 Azilect®                                        299                12%             14%       recommendation from NICE
 Xenazine®                                       209                42%             59%
 Sabril®                                           80             113%              138%   Azilect®
                                                                                              Continued strong growth in France following
 Other
                                                                                              launch
 pharmaceuticals*                                497                 -3%             2%
 * Other pharmaceuticals consist of all products not otherwise specified
                                                                                           Xenazine®
                                                                                             More than 3,100 patients have now started
                                                                                             treatment with Xenazine®

                                                                                           Sabril®
                                                                                             Increased compliance rate among existing
                                                                                             patients
                                                                                                                                            7
Lundbeck product launches 2011/2012

New products
   Lundbeck’s launch programme for                                                First
   the next 1½ year represents               Products              Potential    launch
   significant opportunities
                                             Sycrest®              >DKK 1bn    April 2011
   Significant investments in
   commercialisation of new products         Lexapro® (Japan)    >DKK 500m1)    Q3 2011
   already in 2011
                                             Cephalon products    >DKK 500m     H1 2012

… and expanded collaborations                Onfi™ (clobazam)      >DKK 1bn     H1 2012
   Positive impact from new co-
   promotion agreement related to            Nalmefene            ~DKK 2.5bn    H2 2012
   Lexapro® in China                        1) Royalty share

   Azilect® in Asia represents additional
   opportunity

                                                                                            8
Sycrest® (asenapine) launch initiated in
Europe
 Sycrest® (Saphris® outside EU)           Profile
    Exclusive commercial rights to           Acute treatment of manic and mixed
    Sycrest® in all markets outside the      episodes associated with bipolar I
    US, China and Japan                      disorder in adults
    in-licensed from Merck & Co.             Rapid onset and highly efficacious
    Already approved in all EU               Unique tolerability
    countries                                Fast dissolving sublingual tablet
    Synergies with existing sales force      Metabolic awareness
    Launched in April 2011

    Large switch market
    Diagnosed and treated bipolar
    patients are expected to increase
    The global bipolar disorder market
    has a value of USD ~8 billion
                                                                                  9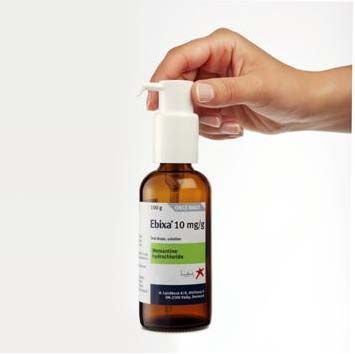
Lundbeck – truly global platform for
growth

   North America:
   + New platform for growth            Europe:
   + Sabril®, Xenazine® and             + Strong market position
     OnfiTM                             + Sycrest®
   + Lu AA21004                         + Nalmefene
   + Saphris® (Canada)                  + Lu AA21004
   + Cephalon brands (Canada)

                                                                   Asia:
                                                                   + Emerging markets
                                                                   + Lexapro® (Japan)
         Latin America:                                            + Improved commercial platform
         + Emerging markets                                          in China
         + Strong commercial platform                              + Saphris®
         + Saphris®                                                + Azilect®
         + Cephalon brands                                         + Lu AA21004
         + Lu AA21004

                                                                                                    10
International Markets -
New growth opportunities to boost sales
Lundbeck revenue from
Sales from International Markets* International Markets*
expected to double in five years DKK
5+ billion
Underlying market growth,
15%
market share expansion and new CAGR
product launches to drive growth 2010-2015e
DKK
Lexapro® (Japan), Sycrest®/ 2.5 billion
Saphris® and Cephalon brands to
be launched in 2011-12
Lu AA21004 expected to be
launched in 2014
2010 2011e 2012e 2013e 2014e 2015e
* Asia (incl. Japan), Australia, Middle East, Africa, Latin America and Canada 11
(Reported revenue from International markets include Israel, Russia and Turkey)“Pharmerging” markets will be the biggest
contributor to market growth going forward
2005 Rank 2010 Rank 2015 Rank
1 United States 1 United States 1 United States
2 Japan 2 Japan 2 Japan
3 France 3 China 3 China
4 Germany 4 Germany 4 Germany
5 Italy 5 France 5 France
6 United Kingdom 6 Italy 6 Brazil
7 Spain 7 Brazil 7 Italy
8 Canada 8 Spain 8 India
9 China 9 Canada 9 Spain
10 Brazil 10 United Kingdom 10 Russia
11 Mexico 11 Russia 11 Canada
12 Australia 12 India 12 United Kingdom
13 South Korea 13 Australia 13 Venezuela
14 Turkey 14 Mexico 14 Turkey
15 India 15 South Korea 15 South Korea
16 Russia 16 Turkey 16 Australia
17 Netherlands 17 Poland 17 Mexico
18 Belgium 18 Netherlands 18 Argentina
19 Poland 19 Belgium 19 Poland
20 Greece 20 Greece 20 Belgium
12
Source: IMSHealth Market prognosis, March 2011Close to 20% of Lundbeck sales are
generated in International Markets*
Share of Lundbeck revenue 17% of Lundbeck 2010
in the region
revenue is generated in
17% Asia, Australia, Middle East,
Africa, Latin America and
Canada
International Markets*
Other markets
Sales in these countries
increased 20% compared to
83% 2009
*Asia, Australia, Middle East, Africa, Latin America and Canada 13
(Reported revenue from International markets include Israel, Russia and Turkey)Lexapro® approved in Japan
Lexapro® in strong position to become
Japanese
no. 1 brand in the market
USDm antidepressant market
1.800
+18%
Mochida has marketing rights in Japan,
in co-promotion with Mitsubishi Tanabe
1.500 Pharmaceuticals
+16%
1.200 +13% To be launched in August 2011
+9%
+3%
NHI Drug Price: JPY 212.00 per tablet
900
Mochida and Mitsubishi Tanabe
600 Pharma estimate that sales amounts of
Lexapro® are JPY 3 billion for the first
year of the launch, and…
300
…peak sales of JPY 33.8 billion, in total
0
2005 2006 2007 2008 2009 2010
14Anti-depressant market in Japan -
a unique opportunity for Lexapro®
60%
50%
Paroxetine and
40% sertraline
dominates the
30%
market
20% Duloxetine and
mirtazapine has
10%
recently been
launched with
high initial uptake
0%
1999Q1
1999Q2
1999Q3
1999Q4
2000Q1
2000Q2
2000Q3
2000Q4
2001Q1
2001Q2
2001Q3
2001Q4
2002Q1
2002Q2
2002Q3
2002Q4
2003Q1
2003Q2
2003Q3
2003Q4
2004Q1
2004Q2
2004Q3
2004Q4
2005Q1
2005Q2
2005Q3
2005Q4
2006Q1
2006Q2
2006Q3
2006Q4
2007Q1
2007Q2
2007Q3
2007Q4
2008Q1
2008Q2
2008Q3
2008Q4
2009Q1
2009Q2
2009Q3
2009Q4
2010Q1
2010Q2
2010Q3
2010Q4
1999 2000 2001 2002 2003 2004 2005 2006 2007 2008 2009 2010
DULOXETINE FLUVOXAMINE LITHIUM MILNACIPRAN MIRTAZAPINE PAROXETINE SERTRALINE
Source: IMS Health 2011
15China represents major opportunity
for Lundbeck
The Chinese pharmaceutical market is fast evolving
Pharmaceutical market growing by 25+% annually
(CER)
Lundbeck has had products available in China since
1996
Improved commercial platform following co-promotion
agreement with Xian-Janssen regarding Lexapro® in
China
Lexapro® promoted by both Xian Janssen and
Lundbeck sales force
Lundbeck’s now has 100 sales reps promoting
Lexapro® and Ebixa®
Launch of Azilect® in a couple of years pending
approval
16Lundbeck expansions in China
Sales & Research &
Production
marketing development
Organisation Packaging plant to Legal R&D entity to
increased from 75 be established in be established
to 150 employees Beijing area - research unit with
compared to 2010 - the facility will be 40 employees
ready in 2012 based in Shanghai
(in Co-operation
with Wuxi)
17The Cephalon portfolio represents new growth
opportunities in Canada and Latin America
The Cephalon products will
significantly strengthen our position in Product Region
Canada and Latin America while Provigil® (modafinil), Canada (Nuvigil® only) and
leveraging existing sales and Nuvigil® (armodafinil) Latin America
marketing capabilities
Treanda® Canada
(bendamustine HCI)
Treanda® and Nuvigil® in particular Fentora® Canada and Latin America
represent attractive product (fentanyl buccal tablet)
opportunities adding significant sales Trisenox® (arsenic trioxide) Canada
in the 2012+ timeframe
Myocet® Latin America
(liposomal- doxorubicin)1)
Well known products already 1) Myocet® will be included in the agreement at a later stage
launched in the US and/or Europe
18Strong sales growth in Latin America
Lundbeck revenue
DKKm Latin America
800
740
700
Strong commercial platform
600
24% Presence in all important markets
CAGR
500 2003-2010
Significant growth based on
400
Cipralex® and Ebixa®
300
200 159
100
0
2003 2004 2005 2006 2007 2008 2009 2010
19New products in Latin America
Expected
Product Indication launch
Saphris® (asenapine) Bipolar disorder + schizophrenia 2012
Fentora® (fentanyl buccal tablet) Break-through cancer pain 2013
Myocet® (liposomal-doxorubicin) Cytotoxin for metastatic breast cancer *
Provigil® (modafinil)
Wakefulness promoting agents (narcolepsy, OSA, SWSD) 2012/2013
Nuvigil® (armodafinil)
Lu AA21004 Mood disorders 2014
*Myocet® will be amended the agreement with Cephalon at a later stage
OSA: obstructive sleep apnea; SWSD: shift work sleep disorder
20Canada approaching DKK 1 billion
annually in revenue
Index 100 =
Canada revenue
revenue
Q1 2008
development
250 Canada revenue up 25%
compared to Q2 2010
200 Now the 2nd largest Cipralex®
market
150 Annual Cipralex® sales of
around DKK 650m in 2010
100
Saphris® and Cephalon brands to
be launched in 2012
50
Q1 2008 Q1 2009 Q1 2010 Q1 2011
21Lundbeck’s mid- to late-stage pipeline
Phase II Phase III Regulatory filing
Lu AA24530 Lu AA21004
MOOD DISORDERS
PSYCHIATRY
ALCOHOL DEPENDENCE Nalmefene
PSYCHOSIS Zicronapine
BRAIN DISEASES
ALZHEIMER’S DISEASE Lu AE58054
NEUROLOGY
EPILEPSY IV Carbamazepine Clobazam
(OnfiTM)
OTHER Desmoteplase
(stroke)
22OnfiTM (clobazam) – addresses clear
unmet medical need
Reduction in weekly drop seizure Lennox-Gastaut syndrome (LGS)
rate by dose
Placebo Low Medium High Clear unmet medical needs
0
Only 10% of cases experiencing full
-10 seizure remission with available therapies
Clobazam has been granted orphan drug
-20
status
Drop Seizure Rate
% Change in
-30
Positive clinical phase III study
-40 Clobazam significantly decreased average
p=0.0120
weekly rates of drop seizures and total
-50 p=0.0015
seizures
-60
Both physicians’ and parents’/caregivers’
-70 assessments indicated that clobazam
pCurrent treatment of alcohol dependence –
time for a treatment paradigm shift?
Today’s Abstinence Concept
Currently approved therapies have been developed to target abstinence as
the only treatment goal
For many patients, abstinence is an unacceptable treatment goal
Alcohol dependence remains a highly stigmatized, under-diagnosed and
undertreated disease
Market is significantly underdeveloped and under-commercialized
Clear unmet medical need for effective treatment and integration of
alcohol treatment into primary care
24Nalmefene – a novel concept for treating
alcohol dependence
Completed phase III studies confirm
nalmefene profile Efficacy shown in published
Finnish phase III study
On track for MAA* submission in
Europe towards year-end 2011 20
Baseline Month 6
Heavy Drinking Days* per month
First treatment to target reduction of 15
(Change from baseline)
alcohol consumption
More than 50% reduction of alcohol 10
consumption observed in studies
Effect seen within one month of
treatment and maintained after 12 5
months
Safe and well tolerated 0
Placebo Nalmefene
Convenient treatment regime Significant change in HDD vs placebo, p = 0.0065, OC analysis;
source: results from 28-week study (N=403); published in Alcohol
Tablet taken as needed Clin Exp Res, Vol 31, No 7, 2007
Heavy drinking days defined as the consumption of 5 or more
No need for extensive counseling drinks per day for men, and 4 or more for women.
program
*Marketing authorisation application
25Lu AA21004 - Why does society need a
new antidepressant?
The need for new anti- Willingness to
depressants is there: prescribe/pay: Lu AA21004 - a solution?
Prevalent as ever New MoA gives promise Unique
High level of non- and Important to provide clear pharmacological profile
insufficient response benefits compared to Effects on multiple
to first-line treatments standard care neurotransmitter
Disorder driving Clinical benefits that systems
suffering and social translate into e.g.: Potential therapeutic
issues both for Increased productivity dose range of 5-20 mg
individuals and (QID)
relatives Decreased sick-leaves
Decreased Positive safety and
High mortality tolerability profile
hospitalisations
Long-term outcomes
still not satisfactory Reduced relapses
Strong partnership with Takeda
26Lu AA21004 – a unique pharmacological profile
Lu AA21004 The current clinical programme
Novel mechanism of action More than 2,000 patients with moderate to
severe depression
Multimodal enhancer* - enhances
levels of serotonin, noradrenaline, Doses are 10, 15 and 20 mg
dopamine, acetylcholine and Additional profiling studies ongoing
histamine The first involve 450 patients
Potential dose range in label 5-20 mg suffering from MDD, who are well-
Tolerability treated, but experiencing treatment-
emergent sexual dysfunctions
Sexual side effects at placebo level
(TESD)
Nausea levels on par with SSRIs,
better than SNRIs
Weight neutral
Receptor
modulation
↑5-HT ↑NA ↑DA ↑Hist ↑ACh
Reuptake
inhibition
Elevation of serotonin, noradrenaline, dopamine,
histamine and acetylcholine systems
*5-HT3, 5-HT7 receptor antagonist, 5 HT1A and partial 5-HT1B receptor agonist, 5-HT transporter inhibitor 27Lu AA21004 data presented at APA 2011
Analysis of relapse over 24 weeks after 12-
weeks open label treatment with Lu AA21004
Four phase III studies presented
at APA 2011 in May
Two European studies showed
strong efficacy
All studies confirmed the positive Source: Boulenger, J. et al, relapse study, 400 patients. (APA 2011 poster)
safety profile of Lu AA21004 Adverse events occurring in ≥ 5% in any
treatment group
Lu AA21004
Adverse event Placebo 1mg 5mg 10mg
Timeline for NDA and MAA
Nausea 4.3% 7.9% 15.7% 12.9%
submission in 2012 on track Headache 7.9% 6.4% 11.4% 5.0%
Nasopharyngitis* 5.7% 3.6% 5.0% 2.2%
Dizziness 2.1% 0.7% 3.6% 6.5%
* common cold
Source: Henigsberg, N. et al, 8 week study, 560 patients. (APA 2011 poster) 28Financials
29Continued growth in a difficult environment
Revenue development Q2 2011
(DKKm) +113% Lundbeck’s revenue was DKK 4,100 million
+42% 43 (2%)
4,100 and grew 9% compared to Q2 2010
62 -9
+12%
+16% 32
96
Revenue in Europe increased 6% despite
+13% increased generic competition and a
84 challenging economic environment
+2%
3,767 23
US revenue increased 18% driven by
Lexapro®, Sabril® and Xenazine®.
International Markets grew 6% heavily
impacted by unfavourable exchange rates
17% growth in constant exchange
rates
Q2 2010 Cipralex Lexapro Ebixa Azilect Xenazine Sabril Other* Q2 2011
*Other includes Other pharmaceuticals and Other revenue
30Financial figures –
distribution of costs for Q2 2011
Profit and loss statement
DKKm Q2 2011 Q2 2010 Growth Total costs increased 6% in compared to
Revenue 4,100 3,767 9%
Q2 2010
Cost of sales 726 706
3%
- as % of revenue 18% 19% Cost of sales increased 3%, as sales of
in-licensed products increased during the
SG&A costs 1,580 1,418
10% year (i.e. Xenazine®, Azilect® and Ebixa®)
- as % of revenue 39% 38%
The sale of production facilities in
R&D costs 692 707 UK (Seal Sands) affected cost of
(2%)
- as % of revenue 17% 19% sales positively with DKK 95 million
Total costs 2,998 2,831
6%
- as % of revenue 73% 75% SG&A costs was impacted by Sycrest®
EBIT 1,102 936 launch costs as well as pre-launch costs
- margin 27% 25%
18% for OnfiTM and nalmefene
Net profit 797 661 17%
EBIT was DKK 1,102 million and up 18%
compared to Q2 2010
31Strong cash flow generation in Q2 2011
Continued strong cash flow
generation in the quarter
Key cash flow figures
DKKm Q2 2011 Q2 2010 Operating activities generated a
Cash flow from operating cash flow of DKK 1,257 million
1,257 1,245
activities
Cash flow from financing activities
Cash and securities
3,550 1,976 was an outflow of DKK 737 million
at end of the period
mainly due to dividend pay
Interest-bearing net cash 1,632 13
Interest-bearing net cash of DKK
1,632 million at the end of the
quarter
Now positive compared to
same quarter last year
322011 financial guidance adjusted
Revenue and EBITDA now expected to be in the high end of the
guidance range
Write offs related to reduction in R&D of DKK 300-400 million now
included in guidance
2011-2014 guidance
Floor guidance
Reported Guidance
DKK 2010 2011 2011e 2012e 2013e 2014e
Revenue 14,765m 15.3-15.8bn >14.5bn >14bn >14bn >14bn
SG&A ratio 36.6% 36-37% 37-40% 37-40% 37-40%
R&D ratio 20.6% ~20% ~20% ~20% ~20%
EBITDA 4,393m 4.3-4.6bn - - - -
EBIT 3,357m 3.3-3.6bn >3bn >2bn >2bn >2bn
Net profit 2,466m 2.3-2.6bn - - - -
33Key priorities for 2011
Operations
Continue the roll out of Sycrest®
Approval and preparation for launch of Cephalon products
Launch of escitalopram in Japan in August 2011
Preparations for successful launch of nalmefene and OnfiTM
Continue expansion in China
Pipeline
OnfiTM (clobazam) FDA approval – Action Day in Q4
Ensure optimal execution of the phase III studies with Lu AA21004
Initiation of the registration process for nalmefene
34Sum-up
Solid first half of the year
Lundbeck is increasingly
diversified
More products on the market
More balanced geographic
distribution
More projects in development
Staying highly profitable during
transition period
Positive cash flow
Continuing dividend policy
Return to growth from 2015
35For more information please contact
Investor Relations
Palle Holm Olesen Magnus Thorstholm Jensen Jacob Tolstrup
Chief Specialist, Investor Relations Investor Relations Officer Vice President
Tel: +45 36 43 24 26 Tel: +45 36 43 38 16 Tel: +1 847 282 5713
palo@lundbeck.com matj@lundbeck.com jtl@lundbeck.com
36Appendix
Lundbeck overview
Disease areas
Assumptions on long term guidance
Financial figures & guidance
The CNS market
The Lundbeck share
37About Lundbeck
A fully integrated, global DKKm Revenues DKK
15.3-15.8bn
16,000
pharmaceutical company
Focused on treatment of diseases in 12,000
the central nervous system (CNS) –
more than 50 years of excellence 8,000
Leading brands within mood 4,000
disorders, Alzheimer’s, Parkinson’s
and Huntington’s disease 0
2006 2007 2008 2009 2010 2011e
World class drug discovery company
with world-class expertise in CNS DKKm EBIT DKK
4,000
diseases 3.3-3.6bn
Strong balance sheet and cash 3,000
generation
2,000
Several potential product launches
before 2014 1,000
More than 5,900 employees in total
0
2006 2007 2008 2009 2010 2011e
38Lundbeck’s operations – FY 2010
Product distribution FY 2010
( growth in brackets)
Lundbeck had total revenue of
2%(-7%)
15%(-18%) DKK 14,765 million in 2010, an
increase of 7% compared to
1%(-)
2009
5%(105%)
Geographical distribution:
38%(9%)
7%(34%) 53% Europe, 25% US,
20% International markets
(2% other revenue)
16%(11%) Xenazine® was launched in
16%(0%)
November 2008 and Sabril® in
September 2009
Cipralex® Lexapro®
Ebixa® Azilect®
Xenazine® Sabril®
Other pharmaceuticals Other revenue
39Appendix
Lundbeck overview
Disease areas
Assumptions on long term guidance
Financial figures & guidance
The CNS market
The Lundbeck share
40The CNS market 2010 – USD 125.5 billion (+5%)
The largest pharmaceutical category
Lundbeck’s current focus areas
(Share of total CNS market and growth)
Antipsychotics
20% (+9%)
The CNS market
represents 16% of the
total pharmaceutical
market
Lundbeck is also
present within
Huntington’s disease
with Xenazine®… Antidepressants
16% (+4%)
… and has two
compounds in clinical
development in
ischaemic stroke
Anti-epileptics
Alcohol dependence 10% (-3%)
0.2% (+8%)
Anti-Parkinson’s Anti-Alzheimer’s
Source: IMS World Review 2011 3% (+4%) 7% (+12%) 41Lundbeck is involved in indications
costly to society and with high unmet
medical needs
Rank* Disease
1 Cancer
2 Unipolar depressive disorder and anxiety
Lundbeck’s focus areas rank high
3 Ischaemic heart disease in terms of burden to society
4 Cerebrovascular disease
These conditions are often of a
5 Chronic obstructive pulmonary disease
serious nature and devastating for
6 Refractive errors
7 Hearing loss, adult onset patients and family…
8 Congenital anomalies … and are characterised by high
9 Alcohol use disorders
unmet needs
10 Diabetes mellitus
11 Cataracts
12 Schizophrenia
CNS disorders are difficult to treat
…… …..
15 Bipolar disorder
because of…
….. ….. the complexity of the brain
17 Alzheimer and other dementias
high level of adverse effects
… …
23 Epilepsy the blood/brain barrier
… …
40 Parkinson’s disease
*) DALY=Disability adjusted life years; Global, non-communicable conditions.
Source: Lundbeck based on World Health Report - 2004 42CNS comprises many disease
areas and diseases
Psychiatry Neurology
Multiple sub-classifications Multiple sub-classifications
Mood Disorders Anxiety Disorders Psychotic Disorders Movement Disorders Dementias Cerebrovascular
• MDD • GAD • Schizophrenia • Parkinson’s Disease • Alzheimer’s Disease • Ischaemic Stroke
• TRD • Panic Disorder • Bipolar disorder • Huntington’s Disease • Vascular Dementia • Haemorrhagic Stroke
• Seasonal Affective Dis. • Social Anxiety • Schizoaffective disorder • Friedreich’s Ataxia • Frontotemporal Dementia • Subarachnoid
• Melancholic Depression • OCD • Delusional disorders • Restless legs syndrome • Dementia with Lewy bodies haemorrhage
• Stress-related • PTSD • Tourette’s syndrome • Creutzfeldt-Jakob disease
Personality Dis. Addiction Development Dis. Demyelinating Dis. Sleep disorders Traumatic Injuries
• Paranoid PD • Alcohol Dependence • Autism • Multiple sclerosis • Primary insomnia • Traumatic brain injury
• Borderline PD • Nicotine addiction • ADHD • Optic neuritis • Narcolepsy • Spinal cord injury
• Schizoid PD • Drug addiction • Asperger’s • Guillain-Barré • Sleep apnoea
• Schizotypical PD • Compulsive shopping • Fragile-X • Charcot-Marie-Tooth
• others • Pathological gambling • Down’s Syndrome
Eating Disorders Pain Epilepsies
• Anorexia nervosa • Acute pain • Simple partial seizures
• Bulimia nervosa • Migraine • Complex partial seizures
• Binge eating disorder • Other headaches • Infantile spasms
• Diabetic polyneuropathy • Lennox-Gastaut
= Lundbeck presence • Post-herpetic neuralgia • Temporal lobe epilepsy 43Depression
Antidepressant (2010) Lundbeck in depression
USD 20.2 billion (growth: 3%)1
(Value growth, volume growth)
Marketed products: Escitalopram (Cipralex®/Lexapro®)
Pipeline compounds: Lu AA21004 (phase III)
(+9%, +7%)
18% Lu AA24530 (phase II)
US
Europe
22%
60% Int. Markets
(+3%, +2%)
(+1%, +4%)
Number of patients2
World: ~ 150 million
World market leaders - 20101 Western world*: ~ 40 million
(Including generic sale)
Molecule Value Molecule Volume
Important unmet medical needs
1. Escitalopram 20.7% Sertraline 16.9% within depression
2. Duloxetine 19.8% Citalopram 14.9% • Drugs with higher remission rates
3. Venlafaxine 19.1% Escitalopram 12.8% • Increased onset of action - up to four weeks before patients
feels symptom relief
4. Paroxetine 7.0% Fluoxetine 10.3%
• Current therapies are relatively well-tolerated but still room for
5. Bupropion 6.8% Paroxetine 9.3% improvement especially on sexual side effects
1) Source: IMS * France, Germany, Italy, Spain, UK, Japan and the US (2008)
2) COGNOS Study – Major depressive disorder, August 2009 44Clinical programme using Lu AA21004 in MDD Clinicaltrials.gov identifier Estimated enrolment Study start Intervention NCT01140906 600 (non-US) May 2010 8 wks. Lu AA21004 (15+20mg); duloxetine (60mg); Placebo NCT01255787 615 (non-US) November 2010 8 wks. Lu AA21004 (5+10+20mg); placebo NCT01323478 300 (non-US) April 2011 52 wks extension. Lu AA21004 (15+20mg) NCT01163266 450 (US) July 2010 8 wks. Lu AA21004 (10+20mg); placebo NCT01153009 600 (US) June 2010 8 wks. Lu AA21004 (15+20mg); duloxetine (60mg); placebo NCT01179516 450 (US) August 2010 8 wks. Lu AA21004 (10+20mg); placebo NCT01152996 1,000 (US) September 2010 52 wks extension. Lu AA21004 (15+20mg) –by invitation only NCT01355081 360 (Japan) May 2011 8 wks. Lu AA21004 (5+10mg); placebo NCT01364649 (sexual funct.) 440 (US+Canada) May 2011 Lu AA21004 (10-20mg); escitalopram (10-20mg) NCT00635219 (*) 766 (non-US) April 2009 8 wks. Lu AA21004 (2.5+5+10mg); duloxetine (60mg); placebo NCT00735709 (*) 560 (non-US) August 2008 8 wks. Lu AA21004 (1+5+10mg); placebo NCT00672620 611 (US) April 2008 8 wks. Lu AA21004 (2.5+5 mg), duloxetine (60mg); placebo NCT00672958 (*) 600 (US) April 2008 6 wks. Lu AA21004 (5mg); placebo NCT00694304 (safety) 536 (non-US) May 2008 52 wks. Lu AA21004 (2.5-10mg flexible dose) NCT00596817 (relapse) (*) 400 (non-US) December 2007
Lu AA21004 – side effects seen in a
published phase III study
                                                      Placebo                                           Lu AA21004                                          Duloxetine
Preferred term                                         n=148                2.5mg, n=155                 5mg, n=157                 10mg, n=151           60mg, n=155

Patients with TEA’s                                 92 (62.2%)                92 (59.4%)                100 (63.7%)                  99 (65.6%)            110 (71.0%)

Nausea                                               13 (8.8%)               26 (16.8%)*                 26 (16.6%)                 33 (21.9%)*            52 (33.5%)*

Headache                                            24 16.2%)                 22 (14.2%)                16 (10.2%)**                 19 (12.6%)             22 (14.2%)

Diarrhea                                             10 (6.8%)                 7 (4.5%)                    3 (1.9%)                    8 (5.3%)              7 (4.5%)

Vomiting                                             5 (3.4%)                  6 (3.9%)                    6 (3.8%)                    7 (4.6%)             11 (7.1%)

Dizziness                                            10 (6.8%)                 7 (4.5%)                    5 (3.2%)                    6 (4.0%)            25 (16.1%)*

Dry mouth                                            11 (7.4%)                 6 (3.9%)                    9 (5.7%)                    6 (4.0%)             12 (7.7%)

Somnolence                                           5 (3.4%)                  5 (3.2%)                    4 (2.5%)                    5 (3.3%)             11 (7.1%)

Nasopharyngitis (common cold)                        6 (4.1%)                 12 (7.7%)                   11 (7.0%)                    4 (2.6%)              3 (1.9%)

Constipation                                         6 (4.1%)                  3 (1.9%)                    5 (3.2%)                    3 (2.0%)             10 (6.5%)

Fatigue                                              3 (2.0%)                  1 (0.6%)                    3 (1.9%)                    3 (2.0%)              8 (5.2%)

Hyperhidrosis                                         1 (0.7%                  1 (0.6%)                    5 (3.2%)                    3 (2.0%)             10 (6.5%)*

Insomnia                                             6 (4.1%)                  8 (5.2%)                   11 (7.0%)                    3 (2.0%)             13 (8.4%)

Decreased appetite                                   2 (1.4%)                       0                      2 (1.3%)                    1 (0.7%)             12 (7.7%)*
 * Significantly higher compared to placebo (p
Lu AA24530
Lu AA24530 Headline phase II data
A multi-modal enhancer 652 patients
Reuptake inhibition at monoamine Moderate to severe depression
transporters 6 week treatment
Antagonist activity at 5-HT3 and 5- Several doses: 5, 10 and 20 mg
HT2c receptors Active reference: 60 mg duloxetine
Increases in acetylcholine, Significant improvement on the
noradrenaline, dopamine and 5-HT primary endpoint and key secondary
levels in brain regions that play a
endpoints compared to placebo
key role in the regulation of mood
Lu AA24530 was well-tolerated
Drop-out rates due to serious
adverse events were low in
groups treated with Lu AA24530
and were similar to those of
duloxetine
47Cipralex®/Lexapro® (escitalopram)
- top of the class anti-depressant
Ranking of antidepressants by
efficacy/acceptability** Cipralex® is an ASRI* with a
unique mode of action,
serotonin dual-action…
Ranking by probability for efficacy
1 Mirtazapine
2 Escitalopram … and has demonstrated
Venlafaxine
superior efficacy and tolerability
3
4 Sertraline
5
6
Citalopram
Milnacipran
in numerous post-approval
7
8 Duloxetine
Bupropion studies
Fluvoxamine
9
10 Paroxetine The Cipriani Study** indicates
11
12 Reboxetine
Fluoxetine
that Cipralex® (and sertraline) is
13
13 12 11 10 9 8 7 6 5 4 3 2 1
the best choice for moderate to
severe depression
Ranking by probability for acceptability
Escitalopram is approved for
MDD, PD, GAD, SAD and OCD
in Europe, and for MDD and
GAD in the US
* allestoric serotonin reuptake inhibitor
**The Cipriani study - Independent meta analysis based on 117 studies including approx 26,000 patients
MDD= Major Depressive Disorder; PD = Panic Disorder; SAD = Social Anxiety Disorder; GAD= General Anxiety Disorder; OCD= Obsessive Compulsive Disorder
48Cipralex®/Lexapro® (escitalopram)
Escitalopram market shares (value)
30%
Europe
Continued strong momentum in key markets
25%
Challenging economic environment
20%
Cipralex® withdrawn in Germany due to new
15% reference price group
10% Patent to expire in most markets in 2014
5%
US
0%
Stable market share despite heavily
may-11 aug-09 nov-09 feb-10 may-10 aug-10 nov-10 feb-11 may-11
genericized market
Europe US Int. Markets
Patent to expire in March 2012
Revenue
Escitalopram International Markets
DKKm Q2 2011 Q2 2010 Growth Growth CER
New sales set up in China in place
Europe 1,001 1,001 0% 1%
Revenue in Canada continue to increase following
US 714 630 13% 13%
reimbursements
Int. Markets 530 506 5% 15%
Health care reforms impact sales
Total 2,245 2,137 5% 8%
49Alcohol dependence
Alcohol dependence market (2010) Lundbeck in alcohol dependence
USD 196 million (growth: 8%)1
Marketed products: -
Pipeline compounds: Nalmefene (phase III)
19%
US
37%
Europe
Int. Markets Number of patients2
44%
Europe: ~ 5.0% of men, 1.4% of women
• Alcohol-related harm is estimated to costs Europe
€125bn a year
• It is estimated that 80% of the patients are undiagnosed,
World market leaders - 2010 1 and only 3% are treated
Product USDm
Important unmet medical needs
1. Campral® (Forest Labs/ Merck KGaA) 65 within alcohol dependence
2. Antabuse® (Barr/Sanofi-Aventis) 29 • Greater resources – number of treatment facilities and trained
3. Vivitrol® (Alkermes) 25 physicians is inadequate
• The integration of alcohol treatment into primary care
• Improved effectiveness – 75% of patients relapse within a year
• Improved compliance
• More treatment options
1) Source: IMS
2) “Alcohol in Europe”, Institute of alcohol studies UK, June 2006, Jürgen Rehm et al.: "Alcohol use disorders in EU countries and Norway: An overview of the 50
epidemiology"; European Neuropsychopharmacology 15 (2005) 377-388Nalmefene treatment opportunity -
WHO category downward shift
Very high-risk consumption,
(>60/100 g alcohol daily
females/males) Cancer risk in alcohol consumption
6 High- and very high-risk consumption
High-risk consumption, Medium-risk consumption
(40–60/60–100 g alcohol 5 Low-risk consumption
Relative risk of cancer
daily females/males)
4 Risk
reduction
3
Medium-risk consumption
(20–40/40–60 g alcohol 2
daily females/males)
1
Low-risk consumption 0
(1–20/1–40 g alcohol
Li
O
M
O
B
th
ve
es
re
ou
er
as
r
op
th
t
ne
/o
ha
daily females/males)
ro
op
gu
p
la
ha
s
sm
ry
s
n
x
Study shows
that nalmefene lowers
risk by 1–3 levels
Source: WHO, Global Status Report, 2004 51Psychosis
Antipsychotics (2010) Lundbeck in depression
USD 25.4 billion (growth: +9%)1
(Value growth, volume growth) Marketed products: Sertindole (Serdolect® )
(+11%, +0%) Asenapine (Sycrest®/Saphris®)
Pipeline compounds: Zicronapine (phase III)
13%
US
(+4%, +2%) Europe
23%
Int. Markets
64%
(+11%, +0%)
Number of patients
World: Approx 1% of the population
World market leaders - 20101
(Including generic sale)
Important unmet medical needs
Molecule Value Molecule Volume within psychosis
1. Quetiapine 28.1% Olanzapine 18.4%
• Improved treatment of cognitive dysfunction
2. Olanzapine 23.9% Risperidone 15.2% • Improved treatment of negative symptoms
3. Aripiprazole 22.0% Quetiapine 14.8% • Improved treatment of co-morbid depression and anxiety
• Early stage, definitive diagnostics
4. Risperidone 10.6% Haloperidol 10.5%
5. Ziprasidone 5.7% Aripiprazole 9.4%
1) Source: IMS
52Bipolar disorder
Bipolar Disorder
The 6th leading cause of disability in the
Mani
world a
Mixed
Episode
Euphoric
Hypomania
Affecting 1-5% of adults - ~4 million
Europeans
Incorrect or non-diagnosis depression Normal
Mood
associated with bipolar disorder is common
About half of the patients who recover in
response to treatment experience Treatment
TreatmentGoal
Goal
Depression
recurrence within two years
Patients often receive multiple medications
or need to switch treatments A spectrum of mood disorders characterized
Standard treatment includes mood by distinct episodes of abnormal mood.
stabilizers, lithium and anti-psychotics Patients reflect a spectrum of functionality
from high-functioning to significant functional
Co-morbidities are the rule
impairment
Obesity, substance abuse, anxiety,
ADHD, cardiovascular disorders,
diabetes, pain, migraine
53Clinical phase III programme commenced
with zicronapine in schizophrenia
Zicronapine The clinical phase III study
Potential to treat a number of Expected to enroll 160 patient
neurological and psychiatric Patients will receive zicronapine
diseases (7.5mg/day ) or risperidone (5mg/day)
Based on solid phase II data, a in a 1:1 ratio
clinical phase III programme has Further phase III studies will be
been initiated in schizophrenia initiated in due time
Unique multi-receptorial profile The clinical phase II study (finished)
Affinity to monoaminergic receptors A total of 375 patients where recruited
Potent in vivo antagonistic effects at Zicronapine was tested at dosages
D1, D2, and 5-HT2a receptors
between 3-10 mg/day
Clear statistically significant
separation from placebo at 7 and
10mg
Convincing efficacy and safety data
when compared to olanzapine
54Alzheimer’s disease
Anti-Alzheimer’s (2010) Lundbeck in depression
USD 8.4 billion (growth: +12%)1
(Value growth, volume growth)
Marketed products: Memantine (Ebixa®)
(+15%, +15%) Pipeline compounds: Lu AE58054 (phase II)
21%
US
Europe
55%
(+14%, +3%)
24% Int. Markets
(+4%, +6%) Number of patients2
Western world*: > 7 million
• Approx. 60% are treated
1
World market leaders - 2010
(Including generic sale)
Important unmet medical needs
Molecule Value Molecule Volume within Alzheimer’s disease
1. Donepezil 56.8% Donepezil 54.8% • Disease modifying treatment
• Disease slowing agents
2. Memantine 23.9% Memantine 23.8%
• Improved symptomatic treatments
3. Rivastigmine 13.2% Rivastigmine 12.6% • Longer lasting symptomatic treatments
4. Galantamine 6.1% Galantamine 8.6%
1) Source: IMS * France, Germany, Italy, Spain, UK, Japan and the US (2008)
2) COGNOS Study – Alzheimer’s disease, September 2010 55Lu AE58054 – in phase II for cognitive
impairment in Alzheimer’s disease
24 weeks study of Lu AE58054 in combination
therapy with donepezil in Alzheimer’s disease
Lu AE58054 - profile
Lu AE58054 TID + donepezil (n=135) Lu AE58054 is a potent, selective
donepezil donepezil
pro-cognitive 5-HT6 antagonist
A number of early trials have
placebo TID + donepezil (n=135)
demonstrated that a 5-HT6-
receptor antagonist could offer
2 weeks
potential in the treatment of
24 weeks 4 weeks
Screening baseline completion Safety
follow-up
disorders such as Alzheimer's
Clinical phase II disease and schizophrenia
The primary objective is to explore the Is known to enhance
effect on cognitive performance after 24 cholinergic and glutaminergic
weeks of treatment neuronal function
270 patients with moderate Is generally well tolerated with a
Alzheimer’s benign side-effect profile
Add-on to donepezil
Study to be completed in first half of 2012
56Ebixa® (memantine) – efficacious even
in severe Alzheimer’s disease
Ebixa® is the only NMDA* receptor
antagonist approved for the
treatment of Alzheimer’s disease
A very efficacious, well-tolerated and
safe treatment with placebo-like side
effects
Only therapy licensed for the
treatment of moderate to severe
Alzheimer’s in most Lundbeck
markets
Once-daily treatment
Recently introduced in an
easy-to-dose pump form (picture)
In-licensed form Merz
Pharmaceuticals GmbH (Germany)
* N-methyl-D-aspartate
57Ebixa® (memantine)
Ebixa® market shares (value)
24%
Europe
20% Market share expansion in most major markets
16% Continued strong sales in Italy after grant of
reimbursement
12%
UK sales show strong growth following NICE
8%
support of the use of memantine
4%
0%
may-10 aug-09 nov-09 feb-10 may-11 aug-10 nov-10 feb-11 may-11
International Markets
Increasing sales in Asia and Latin America
Europe Int. Markets
Market share development heavily impacted by
Revenue generic competition in Canada
Ebixa®
DKKm Q2 2011 Q2 2010 Growth Growth CER
Europe 603 509 18% 19%
Int. Markets 104 101 3% 20%
Total 707 610 16% 19%
58Parkinson’s disease
Anti-Parkinson’s (2010) Lundbeck in depression
USD 2.6 billion (growth: 7%)1
(Value growth, volume growth) Marketed products: Rasagiline (Azilect®)
(+5%, -23%) (+7%, +4%) Pipeline compounds: KW-6356 (pre-clinical)
22%
23% US
Europe
Int. Markets
55%
Number of patients2
(+7%, +1%) Western world*: ~ 3.2 million
• Approx. 70% are treated
World market leaders - 20101
(Including generic sale)
Molecule Value Molecule Volume Important unmet medical needs
1. Pramipexole 19.4% Benzatropine 15.5%
within Parkinson’s disease
2. Stalevo 18.2% Ropinirole 11.9% • Therapies that provide neuro-protection and/or neuro-
restoration
3. Ropinirole 13.1% Trihexyphenidyl 11.7%
• An optimal trial design for demonstrating neuro-protection
4. Rasagaline 12.7% Biperiden 10.9% and/or neuro-restoration
5. Entacapone 8.5% Amantadine 9.9% • Control of levodopa-induced motor response complications
1) Source: Lundbeck based on IMS data * France, Germany, Italy, Spain, UK, Japan and the US (2008)
2) COGNOS Study – Parkinson’s disease, June 2009 59Azilect® is the only drug that shows slowdown
of disease progression in Parkinson’s
Results from ADAGIO study – Change in Azilect® is a potent, selective,
UPDRS score in early and delayed start of
treatment with Azilect®
second generation, irreversible
monoamine oxidase (MAO) type-B
9 months 9 months inhibitor
Delayed-start
Worsening
…approved for monotherapy and
adjunct therapy with levodopa
(placebo–rasagiline 1 mg/day)
Mean UPDRS change from baseline
Early-start
(rasagiline 1 mg/day)
treatment
Sustained
Commencement of
treatment effect of early ADAGIO is the first prospective,
(delayed-start) treatment.
Azilect slows delayed start study in PD designed
the rate of
disease
to demonstrate disease modifying
The rate of
progression effects, using novel hierarchical
endpoints
progression of by 38%
PD higher in
untreated
patients
Azilect® is the first and only drug to
offer disease modification through
slowing the clinical progression of
PD
12 24 36 42 48 54 60 66 72
Week
Improvement
* Olanow et al. Mov Disord 2008; 23: 2194; Olanow et al. N Engl J
Med 2009; 361: 1268 Teva Pharmaceutical Industries, Data on file
60Azilect® (rasagiline)
Azilect® market share (value)
18% Europe
15% Continued strong momentum in most key
12%
markets
Significant market share expansion in France
9%
following launch early 2010
6%
Patent to expire in most markets in 2015
3%
0%
may-11 aug-09 nov-09 feb-10 may-11 aug-10 nov-10 feb-11 may-11
International Markets
Launched only in a few countries in
Europe
International Markets
Revenue Rights acquired to several Asian countries -
Azilect® Launch in first countries in 2012
DKKm Q2 2011 Q2 2010 Growth Growth CER
Europe 274 243 13% 13%
Int. Markets 25 24 5% 21%
Total 299 267 12% 14%
61Other diseases
Stroke:
Acute ischemic stroke
Desmoteplase – currently in phase III
Lu AA24493 – currently in phase I
Rare diseases:
Huntington’s chorea
Xenazine® (tetrabenazine) - launched in November 2008
Refractory complex partial seizures (rCPS) and infantile spasms (IS)
Sabril® (vigabatrine) - launched in September 2009
Lennox-Gastaut syndrome (LGS)
OnfiTM (clobazam) - registration submitted to the FDA in December 2010
62Desmoteplase – a possible improvement
of existing stroke therapy
Arrival time among diagnosed Desmoteplase profile
acute ischaemic stroke patients Nine hour time window increases utility
in the market
0-3h
Potential to decrease bleeding
21% complications
>24h or tim e
of arrival Potential to improve neurological
unknow n
41%
outcome
3-6h
13%
Ongoing phase III clinical studies
6-9h
9-12h
8% Two worldwide clinical phase III studies
12-24h
13%
4% recruiting 400 patients each
Primary endpoint is the effect of a
single dose desmoteplase
Acute ischaemic stroke (AIS) (90μg/kg) in a therapeutic window
AIS is the third most common cause of death in the of 3-9 hours after the incidence
industrialised world
Incidence of 300-500 per 100,000
Fatal outcome in at least 10% of the cases One clinical phase II study in Japan
Single most common cause of severe disability enrolling 48 patients
63
Source: Decision Resources - Acute Ischaemic Stroke; December 2009Lennox-Gastaut syndrome – clear unmet
medical needs
A catastrophic epilepsy characterized by
multiple types of seizures and
developmental delay
Usually occurs at 2 to 8 years of age
Approximately 3-10% of children with
epilepsy have LGS
Prevalence of 23,000-75,000
people in the US1)
Atonic or drop seizures are frequent
Only 10% of cases experience full
Patient with Lennox-Gastaut syndrome wearing seizure remission with current therapies
a helmet with face guard to protect against
facial injury from atonic seizures* Most patients experience ongoing
cognitive impairment and refractory
epilepsy
Before age 11, the mortality rate is 4–7%
1) The US Office of Orphan products
64
*Source: http://emedicine.medscape.com/article/1176735-overviewXenazine® – only drug approved for
Huntington’s chorea in the US
Xenazine®
Selectively inhibiting vesicular
monoamine transporter enzyme
(VMAT)-2, thereby depleting pre-
synaptic dopamine
Approved for chorea associated with
Huntington’s disease
Addresses high unmet medical
needs and has shown strong
Chorea associated with
Huntington’s disease (HD) efficacy
~ 20,000 people in the US suffer from HD Granted orphan drug exclusivity
Chorea the most common symptom of Data exclusivity to expire in 2015
HD (~90%), is characterized by
involuntary movements.
Life expectancy is 15-20 years after onset and
death often caused by pneumonia or choking
Depression is a common co-morbid condition of
the disease.
65Xenazine® on track to meet peak patient
numbers
Xenazine® patient uptake*
3,200
Revenue for Q2 2011 was DKK 209
2,800 million, an increase of 42% compared
to Q2 last year
2,400
Xenazine continues to experience a
2,000 steady uptake of patients
At the end of Q2 2011 more than
1,600
3,100 patients were enrolled
1,200 Continued focus on helping more
physicians to fully understand
800 treatment regimen
400 On track to meet implied peak patient
number of ~ 6-7,000 patients
0
Q4 2008 Q2 2009 Q4 2009 Q2 2010 Q4 2010 Q2 2011
*Patients that are persistent active
66Sabril® (vigabatrine) – addressing highly
unmet needs
Infantile spasms (IS):
~2,500 patients/year in the US with IS
Serious disease with substantial unmet
medical need
70-90% suffers from mental
retardation, mortality of around 5%
Refractory complex partial seizures
Sabril® (rCPS):
Unique method of action as a selective and ~ 1 million patients in the US suffer from
irreversible inhibitor of GABA-transaminase CPS
Aside from risk of critical vision damage
30-36% of patients are refractory
(~30% of patients), Sabril® is generally well
Poorly controlled by current therapies
tolerated
Rapid efficacy - within 2 - 3 weeks Uncontrolled seizures has ~40x higher risk
of inflicting mortality
Data exclusivity to expire in the US in 2015
(rCPS) and 2016 (IS – orphan drug status)
67Appendix
Lundbeck overview
Disease areas
Assumptions on long term guidance
Financial figures
The CNS market
The Lundbeck share
68Key assumptions for revenue
Product Comments:
Cipralex® Cipralex® is maturing, but growth is expected to continue in the period
driven by new markets (incl. Japan)
Lexapro® Lexapro® is expected to show flat to slightly decreasing revenue in 2011
Ebixa® Peak sale to exceed DKK 2.5 billion
Azilect® Peak sale to exceed DKK 2 billion
Sycrest®
Xenazine®
Sabril® Peak sale to exceed DKK 1 billion
OnfiTM NDA process ongoing and pending FDA approval
(clobazam) Expected to be launched by 2012
Other Average negative growth for the period of 10-15% primarily driven by
pharmaceuticals Lundbeck Inc. products
69New products with substantial commercial potential Products Status Potential Azilect® Launched > DKK 2 billion Xenazine®/Sabril® Launched > DKK 1 billion Sycrest® Launched (April 2011) >DKK 1 billion Cephalon products* >DKK 500 million Lexapro® (Japan) Approved >DKK 500 million** Onfi™ (clobazam) NDA process >DKK 1 billion Nalmefene* Phase III ~DKK 2.5 billion Lu AA21004 Phase III DKK 5-10 billion Desmoteplase* Phase III >DKK 2.5 billion Zicronapine* Phase III >DKK 2.5 billion Lu AA24530* Phase II DKK 5-10 billion * Not included in long term guidance ** Royalty share 70
Appendix
  Lundbeck overview
  Disease areas
  Assumptions on long term guidance
  Financial figures
  The CNS market
  The Lundbeck share

                                      71
Revenue, yearly figures
Revenue, DKKm Growth, Y/Y, %
2010 2009 2008 2007 2006 2010 2009 2008 2007
Total revenue 14,765 13,747 11,572 11,171 9,300 7% 19% 4% 20%
Cipralex® 5,808 5,320 4,829 4,094 3,508 9% 10% 18% 17%
Lexapro® 2,443 2,451 2,464 2,594 1,923 - (1%) (5%) 35%
Ebixa® 2,403 2,162 1,878 1,655 1,361 11% 15% 14% 22%
Azilect® 1,028 769 553 354 150 34% 39% 56% 136%
Xenazine® 610 298 - - - 105% - - -
Sabril® 179 - - - - - - - -
Other
pharmaceuticals 2,036 2,469 1,653 1,784 1,983 (18%) 49% (7%) (10%)
Other revenue 258 278 195 690 375 (7%) 42% (72%) 84%
72Costs, yearly figures
DKKm Growth, Y/Y, %
2010 2009 2008 2007 2006 2010 2009 2008 2007
Revenue 14,765 13,747 11,572 11,171 9,300 7% 19% 4% 20%
Cost of sales 2,958 2,655 2,127 2,384 1,721 11% 25% (11%) 38%
Distribution costs 3,496 3,174 2,459 2,409 2,419 10% 29% 2% -
Administrative exp. 1,909 1,864 1,642 1,496 1,415 2% 13% 10% 6%
R&D 3,045 3,196 2,990 2,193 1,956 (5%) 7% 36% 12%
EBIT 3,357 2,858 2,354 2,689 1,789 17% 21% (12%) 50%
Costs, % of
revenue
Cost of sales 20% 19% 19% 21% 19%
Distribution costs 23% 23% 21% 22% 26%
Administrative exp. 13% 14% 14% 13% 15%
R&D 21% 23% 26% 20% 21%
73Balance sheet and dividend
Balance sheet Lundbeck dividend
DKK/
share
DKKm 30.06.11 30.06.10
4.0 Dividend 4.0%
Intangible assets 7,287 8,423 3.5 3.5%
3.0 Dividend 3.0%
Other non-current assets 3,253 3,264 yield*
2.5 2.5%
Current assets 8,280 6,627
2.0 2.0%
Assets 18,820 18,314 1.5 1.5%
1.0 1.0%
0.5 0.5%
Equity 11,723 10,559
0.0 0.0%
Non current liabilities 2,927 2,986 2006 2007 2008 2009 2010
* Dividend Yield = dividend per share/share price, year-end
Current liabilities 4,170 4,769
Equity & Liabilities 18,820 18,314
Dividend of DKK 3.77 per share for 2010,
corresponding to a payout ratio of 30%
Cash 2,895 1,920
Securities 655 56
A total of DKK 739 million and a yield of
3.6%
Interest-bearing debt (1,918) (1,963)
Interest-bearing net cash (debt) 1.632 13
In 2012-2014 the payout ratio is expected to
be in the upper end of the target ratio (25-35%)
74Cash flow
DKKm Q2 2011 Q2 2010 FY 2010
Cash flows from operating activities 1,257 1,245 3,265
Cash flows from investing activities (12) (71) (803)
Cash flows from operating and investing activities 1,245 1,174 2,462
Cash flow from financing activities (737) (610) (2,162)
Change in cash 508 564 300
Cash at beginning of the period 2,389 1,330 1,960
Unrealised exchange adjustments for the period (2) 26 34
Change for the period 508 564 300
Cash at end of the period 2,895 1,920 2,294
75Appendix
Lundbeck overview
Disease areas
Assumptions on long term guidance
Financial figures
The CNS market
The Lundbeck share
76Worldwide pharmaceutical market 2010
USD 791 billion (+5%)
9%(8%)
16%(5%)
3%(+10%)
4%(+5%)
(N) CNS
5%(+3%) (C) Cardiovascular
(A) Alimentary
14% (+3%)
(L) A+Immun
6%(+4%) (J) Anti-Infectives
(R) Respiratory
(B) Blood
(G) G.U.& Sex Hormones
8%(+5%)
(M) Muscolo-Skeletal
(D) Dermatologicals
13%(+5%) Other
11%(+2%)
12%(+8%)
Source: IMS World Review 2011
2009-2010 growth in $ in brackets
77Worldwide CNS market 2010
USD 125 billion (+5%)
16%(5%)
20%(9%)
0.2%(+8%)
N5A ANTIPSYCHOTICS
3%(+4%) N6A ANTIDEPRESS.& MOOD STAB.
N3A ANTI-EPILEPTICS
4%(+1%)
N2A NARCOTIC ANALGESICS
N2B NON-NARCOTIC ANALGESICS
6%(+17%) N7D ANTI-ALZHEIMER PRODUCTS
16% (+4%)
N6B PSYCHOSTIMULANTS
N5B HYPNOTICS & SEDATIVES
7%(+12%)
N4A ANTI-PARKINSON PREPS
N7E DRUGS USED IN ALCOH DEP
Other
9%(+1%) 10%(-3%)
10%(+7%)
Source: IMS World Review 2011
2009-2010 growth in $ in brackets
78CNS market size – overview (2010)
Total market North America Europe Int. Markets
Value (USDbn) Growth Share Growth Share Growth Share Growth
Total pharma 791 5% 42% 3% 28% 2% 30% 14%
Total CNS 125 5% 54% 4% 27% 3% 19% 10%
Alcohol 0.2 8% 35% 9% 44% -2% 21% 40%
Anti-Alzheimer’s 8.4 12% 55% 14% 24% 4% 21% 15%
Antidepressants 20.2 3% 56% 3% 22% 1% 22% 9%
Anti-epileptics 12.5 (3%) 47% (16%) 32% 8% 21% 15%
Anti-Parkinson’s 2.6 7% 23% 7% 55% 7% 22% 5%
Antipsychotics 25.4 9% 61% 11% 23% 4% 16% 11%
Stroke 0.9 7% 54% 10% 26% 2% 20% 5%
Source: IMS World Review 2011 (Parkinson’s market defined by Lundbeck based on IMS data)
79Appendix
Lundbeck overview
Disease areas
Assumptions on long term guidance
Financial figures
The CNS market
The Lundbeck share
80The Lundbeck share
Share structure (end 2010)
2% The Lundbeck Foundation is a
18%
LFI A/S commercial foundation established in
Danish retail 1954 by Grete Lundbeck, widow of the
5%
Institutional, Danish founder of H. Lundbeck A/S
5%
Institutional, International
70% Other, including non identified
The main objective of the Lundbeck
Foundation is to
Maintain and expand the
activities of the Lundbeck Group
Free float (approximately 60m shares)
Provide financial support for
is approx traded twice over annually
research of the highest quality in
(daily trade of approximately 0.5m
biomedical and natural sciences
shares)
The Foundation's commercial activities
are carried out through the wholly-
owned subsidiary LFI a/s
81You can also read


