SUMMARY INVESTMENT HIGHLIGHTS Pani Joint Venture (Lion 33.3%, Merdeka 66.7%) Pani valuation increases to $60.7M, up from $40.7M - Lion ...
←
→
Page content transcription
If your browser does not render page correctly, please read the page content below
Q U A R T E R LY R E P O R T F O R T H E 3 M O N T H S E N D E D 3 1 J U LY 2 0 2 0

SUMMARY
INVESTMENT HIGHLIGHTS
Pani Joint Venture (Lion 33.3%, Merdeka 66.7%)
• Pani valuation increases to $60.7M, up from $40.7M.
• Further upgrade expected when J Resources deal is completed.
• Preliminary results from step-out drilling in ‘link’ zone appear broadly consistent with
  mineralisation on either side; assays awaited. Further drilling paused pending deal completion.
• Concept study underway considering large-scale project with CIL processing.
Nusantara Resources
•   Ore Reserves increased 34% to 1.53moz1.
•   16 year mine life, 1.8 year payback.
•   20% annual production increase to 128k oz / year, first 4 years.
•   Working towards debt funding.
 Erdene Resource Development
• Bankable Feasibility Study completed demonstrating high-grade, shallow open-pit mine with
  strong NPV, IRR and low initial capital investment.
• High grade drill results returned within pit design from a new structure, and high grades in
  trenching from nearby Dark Horse confirms prospect as the best on-license target since the
  discovery of Bayan Khundii.
• Completion of $20M private placement, led by $15M investment by prominent resources investor
  Eric Sprott.
• Funds to be focused on expanding high-grade resources in the Khundii Gold District and initiate
  early works at Bayan Khundii Gold Project.
SECTOR THEMES
• Gold price –record highs during July, outlook on fundamentals is excellent.
• Investor interest surging for explorers and junior resources companies, driven by a resurgent
  Canadian market.
• Lion Clock – moved to 10 o’clock, best years of the cycle (where junior miners and explorers
  perform most strongly) are upon us.

ABOUT LION
Lion Selection Group is a mining investment company, focused on a portfolio of carefully selected and closely
managed investments in listed and unlisted junior developing mining companies. Lion aims to offer diversity
and a portfolio approach to the micro-cap end of mining investment, providing exposure to companies in
various stages of development. Lion’s investment model involves focusing investment towards the best
opportunities in the portfolio, which from time to time results in concentration of Lion’s portfolio towards
specific investments and commodities. Lion is currently weighted towards several developing gold projects,
across a range of jurisdictions but in particular to the Pani gold project in Indonesia.
                   Lion is listed on ASX, under the ticker code LSX.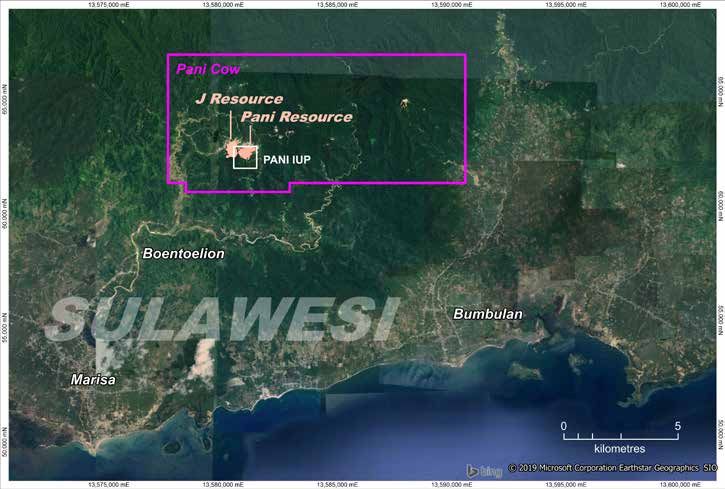
INVESTMENT HIGHLIGHTS

 Pani Joint Venture

Pani Valuation
The value of Lion’s interest in the Pani Joint Venture increased from A$40.7M to A$60.7M as at 31 July 2020.
This increase reflects the sustained escalation in gold prices since November 2018, being the most recent
arms-length transaction when Merdeka acquired its project interest in the Pani Joint Venture. This increase is
most notable since mid-March 2020 with spot gold prices strengthening ~US$500/oz, and the share prices of
most comparable peer companies increasing by more than 100%.

J Resources Deal
In December 2019 Lion announced that its Pani Joint Venture had reached conditional agreement with
J Resources to combine the two Pani tenements into one ownership group. The agreement is subject to
regulatory approvals and approval from J Resources’ secured lenders, with deal closure now anticipated
late-2020. Further material upside is expected for the Pani gold project once the J Resources transaction
completes. This upside has not been considered in the fair value for the assessment made at 31 July as the
deal has not yet been completed. Until completed, there is an ongoing risk that the conditions precedent
are not met and the deal is unable to be completed.

The conditional deal combines two adjacent gold resources in Gorontalo, Sulawesi to form a single gold
deposit with an approximate current footprint of 1.5km x 0.6km:
• Pani IUP JV (66.6% Merdeka, 33.3% Lion) 2.37 moz2
• Pani Contract of Work (100% J Resources) 2.30 moz3

                                   QUARTERLY REPORT 31 JULY 2020 | PAGE 2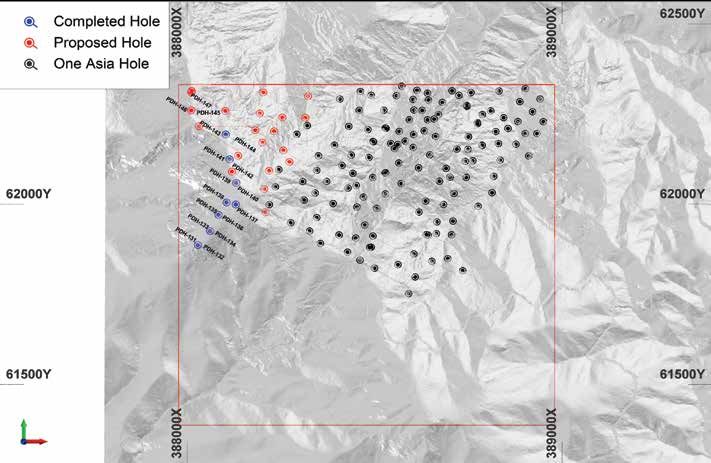
INVESTMENT HIGHLIGHTS

 Pani Joint Venture continued

 Pani IUP (Lion 33.3%/Merdeka 66.7%)                           Contract of Work (J Resources 100%)
 0.2g/t cut off 2                                              0.4g/t cut off3

                 Tonnage        Grade        Contained                           Tonnage    Grade     Contained
 Category                                                      Category
                   (Mt)        (g/t Au)      Gold (Moz)                            (Mt)    (g/t Au)   Gold (Moz)

 Measured          10.8          1.13             0.39         Measured           15.5      1.03         0.51

 Indicated         62.4          0.81             1.63         Indicated          41.3      0.98         1.31

 Inferred          16.2          0.67             0.35         Inferred           15.9      0.93         0.48

 Total             89.5          0.82           2.37           Total              72.7      0.98         2.30

This deal is seen as a win-win for all parties:
• The common tenement boundary restricted individual open pit mine development.
• The larger resource offers scope for large scale open pit mining, improved logistics, and can consider a
  range of treatment methods.
• Exploration opportunities and extensional drilling potential including between the two existing resources.
The resultant structure will see J Resources transfer its interests in PT Gorontalo Sejahtera Mining (GSM) into
the Pani Joint Venture in exchange for a 40% ownership interest in the combined entity.

Pani IUP Drilling
In addition to revaluation reflecting the combination of ground positions, the combined project value could
improve to the extent that step out drilling on the Pani IUP between the two Resources confirms geological
continuity. As reported previously, the Pani Joint Venture has been drilling a 11,000 metre drill program on the
Pani IUP in the area between the Pani IUP and Pani Project where two holes drilled by Utah International in 1982,
assayed 406m @ 0.5 g/t Au (GPD-04) and 154m @ 0.57 g/t Au (GPD-05). As reported in Merdeka’s June 2020
quarterly report,4 four further holes have been completed or were underway for a total of 1,578.6 metres. This
brings total drilling in the current program to 13 holes completed or underway for a total of 3,407.6 metres.
The Pani Joint Venture will temporarily pause its on-going drilling program pending completion of the J Resources
agreement. It is anticipated that assay results of holes that have been drilled will be progressed and become
available after the recommencement of drilling. Preliminary assays and observations from visual geological
logging are broadly consistent with mineralisation that is observed within both the Pani CoW and the Pani IUP.

                                        QUARTERLY REPORT 31 JULY 2020 | PAGE 3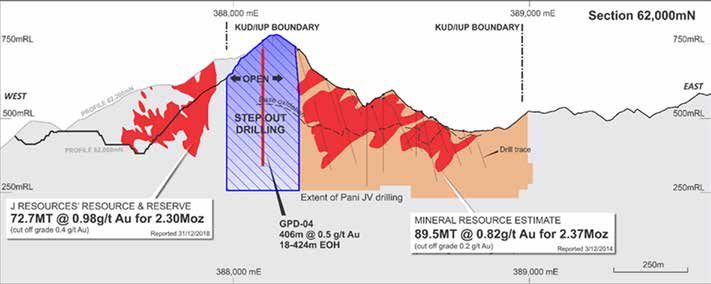
INVESTMENT HIGHLIGHTS

 Pani Joint Venture continued

                     Schematic Showing Pani Proposed and Completed Drill Holes

It is expected that unification of technical databases, geological models and integration of new diamond
drilling results will ultimately culminate in a unified Resource for the ‘Pani Besar’ (‘Greater Pani’) region which
can then be used as the basis of project development studies.

Pani Besar Internal Concept Study
The Pani Joint Venture is working on an internal concept study focused on how a combined Pani Besar project
might look. The purpose of the concept study is to help scope further work, understand key risks requiring
further assessment, and to assess for potential fatal flaws. The study is premised on high level assumptions,
including that the Pani deposit is one continuous zone of mineralisation across the two tenements.
The Internal Concept Study is being undertaken to determine the potential viability of an open pit mine with
conventional milling and CIL processing. The study is a preliminary technical and economic study based
on low-level technical and economic assessments that are not sufficient to support the estimation of ore
reserves. Further evaluation and appropriate studies are required before any ore reserves estimate or any
assurance of an economic development of the project.
The combination of the Pani IUP and Pani COW unlocks optimal development of the Pani deposit unrestricted
by tenement boundaries, including:
• Favourable topography and ore geometries: low strip ratio, open pit operation amenable to large scale
  bulk mining.
• Metallurgical work to date suggests high recoveries are achievable, with conventional CIL assumed for the
  internal concept study.
• Low processing costs anticipated, with grid power available.
• Subject to appropriate assessment, initial concepts envisage 7.5 Mtpa to 15 Mtpa processing rates.

                                     QUARTERLY REPORT 31 JULY 2020 | PAGE 4
INVESTMENT HIGHLIGHTS
Nusantara Resources Limited
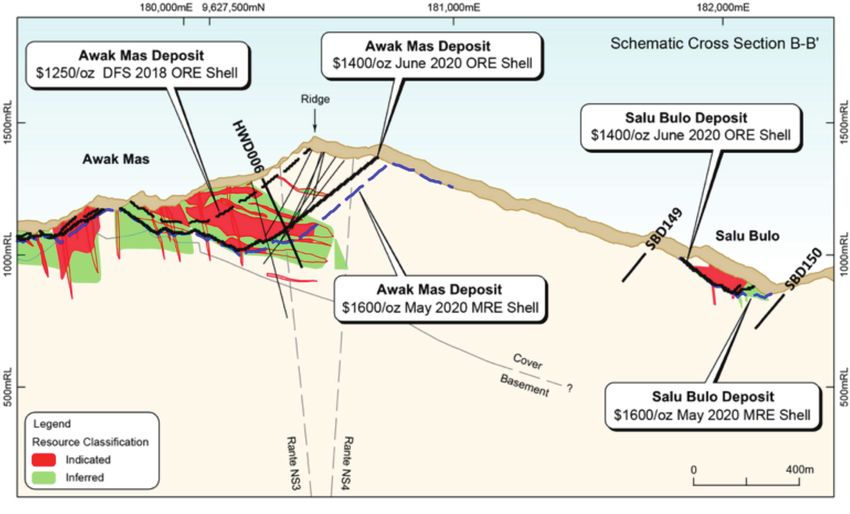
Awak Mas Gold Project in Sulawesi, Indonesia
Ore Reserves
• Increase from 1.1moz to 1.5moz June 20201.
• Open pit reported 0.5 g/t cut off using US$1,400/oz gold price.
Classification Tonnes (Mt) Au Grade (g/t) Contained Gold (Moz)
Proved - - -
Awak Mas (Main)
Probable 32.7 1.30 1.37
Sub-total 32.7 1.30 1.37
Proved - - -
Salu Bulo
Probable 2.9 1.66 0.16
Sub-total 2.9 1.66 0.16
Proved - - -
Total
Probable 35.6 1.33 1.53
Total 35.6 1.33 1.53
Awak Mas (Main) and Salu Bulo Long Section Ore Reserve Estimate and MRE
QUARTERLY REPORT 31 JULY 2020 | PAGE 5INVESTMENT HIGHLIGHTS
Nusantara Resources Limited continued
Updated Economic Assessment5
• Increased production and mine life.
• Based on October 2018 DFS.
• Improved debt carrying capacity.
2020 ADDENDUM KEY ASSUMPTIONS AND OUTCOMES COMPARED TO THE 2018 DFS
Description 2018 DFS 2020 Addendum
Gold Price Assumption USD1,250 per ounce USD1,700 per ounce
Upfront capital USD146M USD156M
Pre-Production capital USD16M USD16M
Gold Produced LOM 1.1M ounces 1.5M ounces*
AISC USD758 per ounce USD875 per ounce
Initial mine life 11 years 16 years
NPV5% real ungeared – after tax USD152M USD517M
IRR – after tax 20% 45%
Payback – post tax 48 months 21 months
* The production targets referred to in this announcement are based on 92% Probable Reserves and 8% Inferred Mineral Resources. There is a
low level of geological confidence associated with Inferred Mineral Resources and there is no certainty that further exploration work will result in the
determination of Indicated Mineral Resources or that the production targets themselves will be realised.
Amended Mine Schedule
• Higher grade first 4 years, average 1.7 g/t.
• Lower grade 0.4-0.5 g/t stockpiled.
• Potential larger scale mining years 5 to 11.
Estimated Recovered Gold Produced
160 3.0
140
2.5
120
2.0
100
Grade per tonne
Ounces (000)
80 1.5
60
1.0
40
0.5
20
- -
1 2 3 4 5 6 7 8 9 10 11 12 13 14 15 16 17
Years
Gold produced (ounces) Head Grade to Plant
QUARTERLY REPORT 31 JULY 2020 | PAGE 6INVESTMENT HIGHLIGHTS
Erdene Resource Development Corp
Khundii Gold District, Mongolia
Bankable Feasibility Study • High grade results returned for a new structure
Erdene delivered the Bayan Khundii BFS , with
6 discovered within the designed BFS pit. Best
headline financials showing a high return from low results included 5.5m at 126g/t gold, and 15m at
initial capital expenditure: 26g/t gold.7 This zone is to be further delineated
by planned drilling commencing in August.
• Base Case after-tax NPV of US$100 million
• Discovery of high-grade zones (eg 6m at 8.8g/t
(NPV5%) and 42% IRR (using gold price of
gold) in trenches at the Dark Horse prospect,
US$1400/oz), increasing to US$216 million and
which is located 3.5km north of the planned
77% IRR, respectively, at current gold price of
development at Bayan Khundii.8 These results
US$1,800/oz.
confirm Dark Horse as the best on-license target
• Total recovered gold over the initial phase of the since the discovery of Bayan Khundii.
Khundii Gold District development of 381,700 oz.
• Six year operating life with average annual gold Corporate
production of 63,500 oz, including 77,600 oz in Erdene announced a non-brokered private
Year 2, from Proven and Probable Reserves of placement of approximately C$20M which was
409,000 oz Au at an average grade of 3.71 g/t Au. closed after the quarter end. This was led by a $15M
• AISC of US$733/ounce of gold recovered and investment by Mr Eric Sprott, a prominent resources
upfront capital costs of US$59M. investor. Lion participated in the placement.
This funding positions Erdene strongly to continue
Exploration
with work to expand high-grade resources in the
High probability growth options have been
Khundii Gold District and provide for initiation of
identified and are set to be tested during the
early development works at the Bayan Khundii Gold
September quarter.
Project, whilst project financing is pursued.
QUARTERLY REPORT 31 JULY 2020 | PAGE 7MINING MARKET REVIEW
2020: Gold is glittering and the year that
Canada re-discovered explorers
OVERVIEW POINTS With investors moving
decisively and with strong
l Gold price – setting record highs. interest into the exploration
l Investor interest surging for explorers and space, and valuations
junior resources companies. jumping as a result, the
Lion Clock has moved
l Canadian market investor interest has swung
to 10 o’clock. We now
strongly back to explorers.
find ourselves within the
l Investors now pricing exploration potential, most exciting time in the
rather than waiting for success. cycle – where juniors can
l Lion Clock – moved to 10 o’clock. perform with access to
enthusiastic investors and
l M&A outlook – new model for M&A rewards
funding to progress.
critical mass, not sector dominating scale.
Lion’s April quarterly report was published at a time of incredible equity market uncertainty: the COVID-19
related equity market crash was extremely fresh and we were in the midst of a fragile recovery. It has certainly
begun to appear that the recovery commenced in April, which could have gone on to be a dead cat bounce,
has stuck and popular confidence in the recovery appears to have grown. The equity market has become
richly valued in comparison to earnings. Viewed against bond yields, this is most easily explained as there
being very few other options for investors besides expensive equity, which seems to be tacitly accepted
as the consequence of extensive stimulus. For the time being at least, stimulus as the guiding force for the
market has won out over reality and even though COVID-19 has not gone away the market is looking past the
point when it does.
Specifically, with regard to mining equities, there are two stand out developments that have taken place
between January and July / August:
• Gold price has appreciated strongly and hit record new highs, driven by a combination of low interest rates
and uncertainty;
• Substantial surge in investor interest toward exploration companies and commensurate liquidity flowing into
the small capitalisation end of the mining sector. Investor sentiment is strongly linked to the gold price, but
the big news really is the long-awaited awakening of the Canadian market.
Gold – setting new records
2019 was a strong year for gold, strengthening by US$235/oz through the year. Most of that gain was
delivered through June, July and August – the months before and after were reasonably flat. 2020 in contrast
has seen far more consistent and steady appreciation for gold, with the exception of March when gold was
caught up in broader financial market collapse. By mid-year in 2020 gold had appreciated by more than
the whole of 2019, and by early August was up by almost US$550/oz, peaking at a record closing price of
US$2,063/oz on 6 August. Once the domain of gold fanatics, fundamentals for gold are now being reported in
mainstream media.
A rally in gold draws out both bulls and nay-sayers, with opposing camps quoting fundamentals or pointing
out gold’s obvious lack of actual use or consumption. Unlike most other commodities, demand for gold
is generated by desire and not consumption. If iron ore rallies strongly, the margins of steel smelters are
QUARTERLY REPORT 31 JULY 2020 | PAGE 8MINING MARKET REVIEW continued
reduced because they are less able to pass on the full price increase to users of steel. In such an instance,
steel producers reduce their purchases of iron ore hoping for the market to cool. The same is not true of
gold – as price increases, it attracts buyers and new interest rather than deter them. Forecasting gold is
challenging because it is not possible to value the cost of gold in use – the price will be whatever buyers
are prepared to pay, and in times of uncertainty and extremely low interest rates, that price typically moves
upward in response to greater buying interest.
The gold champions have recently made light of Berkshire Hathaway taking a circa US$560m position in
Barrick Gold, the world’s largest producer. The headline is all the more tantalising because Warren Buffett has
been famously outspoken against holding gold in the past. It is important to point out that this is not a large
investment for Berkshire Hathaway, and in that regard might not have been championed by Buffett directly.
Even so, as an outsider looking in, this appears an ideal exposure for a value-oriented investors such as
Berkshire Hathaway – the investment is in a gold producer which has far greater leverage to gold, generates
earnings and is capable of distributing earnings. The underlying assumption is that such an investment is
presumably underpinned by a view on the outlook for gold, and as such is an excellent example of ‘generalist’
money moving into the space having previously held little to no exposure.
2100
2019 2020
CY Performance Jan-Jul Performance +US$460/oz
+US$230/oz (+US$550/oz to peak)
1900
June-August 2019
Gold Price US$/oz
Period of most 2019
1700 gold price gains
1500
2020
1300 Gold price gains
steady through YTD
(excl COVID crash)
1100
Post COVID-19 Crash: Explorer Liquidity Surging,
For anyone who especially in Canada
watches the 2020 will no doubt be remembered as the year COVID-19 struck. For
junior market anyone who watches the junior market for miners it will also be the year
for miners it will that liquidity truly returned to the explorer space. The two are connected
also be the year – investor interest surrounds gold companies and the gold price surge
that liquidity truly stems in no small way from factors linked to COVID-19. The turning point
returned to the aspect is that liquidity is flowing into explorers from the largest market
explorer space. for miners in the world – Canada, which has been reluctant to show
enthusiasm for explorers until recently.
Canadian equity exchanges collectively raise more equity funding for miners
and explorers on an annual basis than any other exchange, and Canadian
markets are the largest pool of investment capital for risky enterprises
such as exploration. But ‘risk investors’ aren’t obliged to continually fund
exploration, nor do they. From time to time and especially after a mining
boom has busted, these investors’ ‘risk money’ flows elsewhere.
QUARTERLY REPORT 31 JULY 2020 | PAGE 9MINING MARKET REVIEW continued
Through 2017, 2018 and much of 2019, Canadian risk money was fascinated with medicinal cannabis
– an investment theme premised on a new legal platform and consequent perception of an emerging market.
By late 2019, the Canadian pool of risk money was ready for something new, and the renewed lustre of gold
in a heady mix with global pandemic was perched to catch their collective eye.
The striking and sudden recovery of the Canadian market sentiment toward the exploration end of mining
is strongly reflected in capital raising numbers, as well as the valuation of listed miners and explorers. Most
global equity markets are only segregated into sub-sectors by way of stock indices (eg resources, industrials)
but indices are only applicable to the largest capitalisation companies. There are no indices for micro-
capitalisation companies within a sector such as explorers. The Canadian market is unique in that it has
tiered exchanges, largest companies are typically listed on the Toronto Stock Exchange (TSX) and smaller
companies on the Venture exchange (TSX-V). Whilst not a perfect segregation, when it comes to miners those
listed on TSX-V are overwhelmingly exploration / pre-production stage and statistics for funding of TSX-V
miners are a great indicator of funding from investors going into the exploration sector.
In 2019, ‘mining’ companies on the TSX-V (ie mostly explorers) raised a combined total of C$2.2B. The
running tally at the end of July 2020 is already at C$1.7B, which is 86% above the same time in 2019. This
aligns strongly with a gold price tailwind, and there are a high number of gold focused companies active on
TSX-V. The amount of funds raised by miners and explorers on TSX-V is 47% of the total for miners across
both the TSX and TSX-V – a high proportion in comparison to historic averages (the proportion tends to be
higher in years where investors are enthusiastic about explorers).
Capital raising trends mimic a commensurate appreciation in market capitalisations for Canadian explorers.
The total Quoted Market Value (QMV = quoted shares x share price) of ‘mining’ companies on TSX-V at
the end of 2019 was C$19.0B, and those companies collectively comprised 42% of the total QMV of the
TSX-V. By the end of July 2020 QMV of miners on TSX-V had close to doubled, surging to C$33.7B with these
companies now accounting for 58% of the total QMV of the TSX-V. This is a remarkable jump, and the C$1.7B
of new capital that has been raised in the period is only a small fraction of the difference. Meanwhile, QMV
of miners on the TSX have increased by 35% – a positive change by a far cry from the performance of the
smaller capitalisation companies. The story, clearly, has been about explorers in Canada in 2020.
2500
Equity funds raised (‘Financings’) on TSX-V by miners:
2019 VS 2020
2000
1500 +86% YoY
to July 2020
C$ Millions
1000
500
0
Jan Feb Mar Apr May Jun Jul Aug Sep Oct Nov Dec
2019: Gold: +US230/oz
2020: Gold: +US460/oz | January – July
QUARTERLY REPORT 31 JULY 2020 | PAGE 10MINING MARKET REVIEW continued
Total Quoted Market Value of miners on TSX-V
VS
40,000 Miners % of Total TSX-V QMV 70%
Total Quoted Market Value of Miners C$ Millions
60%
Miners % of Total Quoted Market Value
30,000
50%
40%
20,000
30%
20%
10,000
10%
0 0%
Dec-15 Dec-16 Dec-17 Dec-18 Dec-19 Jul-20
Casting an eye over performance of many
ASX listed exploration / assessment stage This development opens the door
companies there has been a similar and positive to a new and exciting stage of
surge of investor sentiment, and capital raising the boom, and even though there
tempo has also increased. Whilst it is noteworthy is a clear centricity toward gold,
that liquidity is now flowing into the exploration investor enthusiasm for risky
space, it is far more significant that the Canadian activities such as exploration is
market is now experiencing this renewed interest spreading across the sector in a
in explorers, because whilst the Canadian market fashion that was last seen almost
was preoccupied by cannabis it held back the a decade ago.
sector globally.
Appetite for exploration – pricing potential, rather than waiting to reward success
The corollary of valuations surging across the exploration sector is there has been a substantial shift in
sentiment from investors around how they value exploration. In January of this year, investors were clearly
rewarding successful explorers which was a healthy improvement on much of the period from 2011 through
to 2018. Whilst not universal, there are now growing instances where valuations can only indicate that the
investors in the company are valuing potential, yet still await the milestone of exploration success.
QUARTERLY REPORT 31 JULY 2020 | PAGE 11MINING MARKET REVIEW continued
Lion Clock – 10 o’clock
In January 2020 the Lion clock was at 9 o’clock, with investors beginning to show interest in the exploration
sector. Genuine success by explorers would likely be rewarded but fund raising by the sector was selective
and challenging still. Global equity markets collapsed in February and into March in response to the
proliferation of the COVID-19 pandemic – this could have brought about a premature midnight for the mining
cycle, but it didn’t because economic and equity market weakness was countered swiftly and aggressively
by various forms of government stimulus.
AGGRESSIVE SELLER
New floats
CRASH
(big companies) Company liquidations
CAUTIOUS BUYER
12
Paper takeovers 11 1
People leave big Declining exploration
LO
companies (top $ small
companies short careers) 10 2
O
K
9 3
8 4
Rising exploration Mergers
7 5
New floats
6 AGGRESSIVE BUYER
CAUTIOUS SELLER
(small companies) Cash takeovers
BOOM
Outlook toward the top of the boom
Equity markets responded to stimulus strongly and have put on positive Cinderella is
performances since that appear to defy the outlook of a weakened famous for two
economy. Gold has been a major beneficiary of the combination of things – she won
uncertainty and stimulus, finding new record highs in August of 2020. the hand of the
With gold as a strong tailwind, the Canadian market has awoken and prince, but she was
provided a surge of liquidity to the exploration sector. Explorers are now terrible at keeping
able to raise equity funds more readily than at any other time since an eye on the time.
mid-2011, indeed investors are clamouring into some stocks to the
extent that valuations reflect potential rather than necessarily success.
Cinderella is famous for two things – she won the hand of the prince, but she was terrible at keeping an
eye on the time. We don’t know whether she realised that it was 10 o’clock, only that when midnight arrived
it took her totally by surprise. As the Lion Clock moves to 10 o’clock, what expectations are there for the rest
of the cycle?
Rather than anticipating an imminent end to the cycle, there is a strong expectation the mining sector has
exciting years remaining. The Lion clock doesn’t move at a steady pace, rather it reacts to indicators of
liquidity and these tend to occur in irregular surges rather than a set tempo. The time between 10 o’clock
and 12 midnight in historic cycles has lasted for years. And importantly for investors substantial capital
returns are usually available through this stage, especially in the ranks of junior miners and explorers, as it is
characterised by liquidity moving down into smaller companies as investors search for value. With exploration
funds now being raised in the market and deployed widely, we expect to see discoveries take place and new
projects developed as well as growth in the form of M&A to form larger companies.
QUARTERLY REPORT 31 JULY 2020 | PAGE 12MINING MARKET REVIEW continued
Late February
COVID-19
ASX100
Resources
&
ASX Gold
Index
01-Jan-20 01-Feb-20 01-Mar-20 01-Apr-20 01-May-20 01-Jun-20 01-Jul-20 01-Aug-20
Pre-COVID Crash Post-COVID Crash
January 2020 August 2020
Lion Clock
10
9
Liquidity Investors seeking quality Investors warming to
explorers explorers
Rewarding discoveries Pricing exploration potential
Strong preference for Jurisdiction wariness
safe jurisdictions diminishing
QUARTERLY REPORT 31 JULY 2020 | PAGE 13MINING MARKET REVIEW continued
Growth Mindset and M&A
Growth appetite in the mining industry was muted through much of the period 2011 – 2015. Transactions
were dominated by aspiring juniors purchasing operating assets cheaply from major miners, and these have
become the new bastion of mid-tier miners such as Northern Star and Evolution. As the boom was getting
underway through 2016 and 2017, there was far more activity of large miners investing in juniors than making
takeovers – this reflected juniors representing good value (in the eyes of other miners) and there being no
investing competition from the equity market. Deal size and tempo began to increase through 2018 and
2019, those years featuring the mega gold mergers of Barrick and Randgold, then Newmont and Goldcorp.
Beneath the surface of announced deals, the frequency of enquiry around M&A has also surged in this time.
Growth oriented mindsets have expanded, especially in the gold space where the commodity has invigorated
margins and appetites most substantially.
In days gone by, as mining booms progressed, there has often been an evolution of attitude toward growth –
small deals give way to large ones as investor interest shifts to reward larger companies with greater / more
diverse production profiles and (perceived) ability to capture efficiency in a larger organisation. The price
to pay to be the winning suitor in a hot market for a handsome prize is to offer a premium over the market
price for the target company. With history alone as a guide, large and generously priced takeovers might be
an expectation of things to come, especially with growth appetite thriving within the gold sector. Even so,
there are several factors that make it challenging to envisage substantial premia being justifiable for large
acquisitions, and in fact the way that growth is being rewarded by the market may well motivate growth well
below major miner scale.
• There is no precedent (yet) for large deals or premia. Most recent examples of mega deals have been nil /
low premium combinations, and the largest miners are probably more ‘rationalisers’ than buyers, whilst still
being open to small scale (compared to their capitalisation) external investment.
• In the realms of the largest miners, investors have shown they will reward value generation and cost
discipline, there doesn’t appear to be any notion of rewarding increased scale.
• The global mid-tier contains a number of reasonably fresh faces – companies that have grown over recent
years. In most cases these mining companies are still guided by their founders whose mantra of growth
through value oriented transactions has set the tone for their success to date.
• A sudden surge of interest from the investment market in earlier stage companies stands to challenge
the ability for larger companies to acquire whole junior companies and still demonstrate a deep value
proposition. Consequently, asking prices in project sales probably reflect market prices too.
• The memories of 2011 are still reasonably fresh in the memories of investors, who were so appalled at the
largess of large deal making and capital investments by the mining industry they all but abandoned their
mining investments for the next four years.
Perhaps we will see large acquisitions where premiums are offered and paid before the end of this boom. For
the foreseeable future however, there is an easier reward for growth on offer for investors that stems from the
structure of the investment market that has only recently evolved.
QUARTERLY REPORT 31 JULY 2020 | PAGE 14MINING MARKET REVIEW continued
1+1=?
New model for M&A
– reward for critical mass
The premium which is potentially available for merging a smaller company into a major miner is nowhere near
as significant as for successfully combining two juniors. Whilst we’re not (yet) at a point where the investment
market thinks Newmont + Newmont should = anything more than 2x Newmont, it doesn’t mean that 1 + 1
won’t equal 3 or 4. It is often the case that single asset companies don’t quite meet the threshold criteria that
larger institutional investors require to become shareholders, but putting two companies together can achieve
all those in one step. And the market, led by large pools of managed money, is prepared to pay more for
companies after they cross the threshold especially if they enter a relevant index. This phenomenon is especially
true where Exchange Traded Funds (ETF’s) are involved.
Equity ETF’s are set up to provide a one stop investment solution for investors who want exposure to a sector of
the market (say, gold miners) but don’t want to manage it themselves, and the selection of companies the ETF
can hold are defined, often by an index. If a new company appears in the index, then the ETF needs to buy it. In
days gone by, managed funds that were motivated to hold stocks across an index could obtain a position over
a period of time leading up to, or in a measured fashion after a company enters their investment universe or
index. Often, a lump of buying interest could be satisfied in a capital raising.
The catch is, ETF’s can’t take fresh equity, so they need to buy it on the market. As a result, when an ETF
‘needs to own’ a company that has appeared in its guiding index, valuation becomes subsidiary to obtaining
a position and the share price outcome is a simple equation of demand massively outstripping supply as
shares are aggressively bought in the market. This penny has well and truly dropped, rewards in the form
of trading valuations can provide a reward as significant as a doubling of the share price for successfully
merged miners and this can be achieved at respective valuations they are mutually comfortable with, rather
than taking a chance with a large initial premium. This sort of potential performance compares extremely
favourably with conventional takeover premiums, where 50% would be an attractive figure. The attraction of
this style of deal to junior miners is further enhanced by the comparative ease of arranging a merger with
a peer rather than trying to set up a sale to a much larger suitor, and less susceptible to blockage by egos
which is often the case when there is no obvious role for directors and senior management within acquirer
companies. As more and more generalist investors divert funding to mining investments, the pool of funding
available within managed structures such as ETF’s is growing, not shrinking.
Creating a company that is capable of rerating by ETF’s might appear an overnight success but would practically
need to be some time in the making. M&A by its nature needs to be conducted in secret so the time it takes is
usually not obvious. Successful mergers need to be treated like jigsaw puzzles – easing pieces together that
fit, rather than trying to force those together that don’t. As Mark Bristow famously and eloquently pointed out
– mixing cow shit with ice cream only results in shit flavoured ice cream. The qualities that would enhance the
appeal of an asset for inclusion in the portfolio of an aspiring new ‘index scale’ miner no doubt include:
• Mine life (10 years good, more even better).
• Scale (in the case of gold, 100kozpa production capacity from a project is often regarded as ‘entry level’).
• Projects that are fully funded, and either at or close to production.
• Geographical proximity and manageability – local operating synergies are an obvious attraction, also ability
to manage multiple assets across a sensible spread of time zones.
A feature of the market in recent years has been growth of companies with portfolios in ‘safe’ jurisdictions.
As the market reduces its wariness for jurisdiction risk, it is quite likely that appetite for mid-tier miners with
assets across places like Asia and Africa will grow, so appear the logical opportunities for consolidation of a
new mid-tier company.
QUARTERLY REPORT 31 JULY 2020 | PAGE 15LION PERFORMANCE 20%
17.0%
Annualised Total Shareholder Return 9-14
13.6%
Annualised TSR ASX Small
8.4%
Lion
7.2%
to 31 July 2020 Resources
4.8%
1 Year 13.6% 1.5%
-1.6%
3 Years 4.8% 11.5% 0%
5 Years 17.0% 14.4%
10 Years -1.6% -4.9%
15 Years 7.2% 1.5%
Inception (23 yrs) 8.4% 3.8% Lion ASX Small Resources
-20%
1 Year 3 Year 5 Year 10 Year 15 Year Return since
Return Return Return Return Return inception
NOTES
1. Refer to Nusantara Resources Limited ASX Announcement, 16 June 2020, Awak Mas Ore Reserves Increase by 34% to
1.53m ounces.
2. Refer to One Asia Resources Limited news release 3 December 2014, (https://www.lionselection.com.au/wp-content/
uploads/2018/08/PANI%20JORC%20RESOURCE.pdf).
3. Refer to J Resources 31 December 2018 Annual Report, (http://www.jresources.com/investors/article/final-resources-reserves-
compilation-2017-to-2018).
4. PT Merdeka Copper Gold Tbk Quarterly Report: June 2020. (3 August 2020, https://www.merdekacoppergold.com/en/download/
activities-report-q2-2020/).
5. Refer to Nusantara Resources Limited ASX Announcement, 29 June 2020, Awak Mas NPV Increases by 240% to USD517m.
6. Refer to Erdene Resource Development Corporation news release made 20 July 2020.
7. Refer to Erdene Resource Development Corporation news release made 7 July 2020.
8. Refer to Erdene Resources Development Corporation news release made 15 July 2020.
9. Investment performance figures reflect the historic performance of Lion Selection Group Limited (ASX:LSG, 1997 – 2007),
Lion Selection Limited (ASX:LST, 2007-2009), Lion Selection Group Limited (NSX:LGP, 2009-2013) and Lion Selection Group Limited
(ASX:LSX, 2013-present).
10. Methodology for calculating total shareholder return is based on MorningStar (2006), which assumes reinvestment of distributions.
11. Distributions made include cash dividends, shares distributed in specie as a dividend, proceeds from an off market buyback
conducted in December 2008, and the distribution of shares in Catalpa Resources via the demerger of Lion Selection Limited in
December 2009. Lion assume all distributions are reinvested, with all non-cash distributions sold and the proceeds reinvested on
the distribution pay date.
12. Investment performance is pre-tax and ignores the potential value of franking credits on dividends that were partially or fully franked.
13. Past performance is not a guide to future performance.
14. Source: IRESS, Lion Manager.
.
QUARTERLY REPORT 31 JULY 2020 | PAGE 16SUMMARY OF INVESTMENTS AS AT 31 JULY 2020
Net Tangible Asset Backing
Lion Selection Group Limited (Lion) advises that the unaudited net tangible asset backing of Lion as at
31 July 2020 is 66.5 cents per share (after tax).
SUMMARY OF INVESTMENTS AS AT 31 JULY 2020
June 2020 July 2020
Commodity A$M A$M ¢ps
Pani Joint Venture Gold 40.3 60.7 40.5
• The fair value of Lion’s interest in the Pani Joint Venture increased
to A$60.7M at 31 July 2020. This increase reflects the sustained
escalation in gold prices since November 2018, being the most
recent arms-length transaction when Merdeka acquired its project
interest in the Pani Joint Venture.(See page 2 for more details).
Portfolio
Nusantara Resources Gold 15.7 16.8 11.2
Erdene Resources Gold 4.3 7.8 5.2
Sihayo Gold Gold 2.2 2.1 1.4
Celamin Holdings Phosphate 1.0 1.1 0.7
Other 0.4 0.5 0.3
• Portfolio holdings measured at fair value
• Includes investments held directly by Lion and the value to Lion of
investments held by African Lion.
Net Cash 13.3 10.8 7.2
Net Tangible Assets A$77.2m A$99.8m 66.5¢ps
Capital Structure
Shares on Issue: 150,141,271
Share Price: 46.0¢ps 31 July 2020
Lion Selection Group Limited ABN 26 077 729 572 Authorised for release by:
Level 2, 175 Flinders Lane, Melbourne Vic 3000 Craig Smyth
T: +61 3 9614 8008 F: +61 3 9614 8009 www.lsg.com.au E: csmyth@lsg.com.au
Enquiries:
Hedley Widdup – hwiddup@lsg.com.au
Jane Rose – jrose@lsg.com.au QUARTERLY REPORT 31 JULY 2020 | PAGE 17You can also read