New Zealand Property Focus - Locked out ANZ Research August 2020
←
→
Page content transcription
If your browser does not render page correctly, please read the page content below

ANZ Research     August 2020

New Zealand
Property Focus
Locked out

At a glance

Housing market resilient                                                                                         Expensive in most places
With prices at high levels                                                                                       That’s not set to change much

                          Pent-up demand at play

                          First home buying up a little

                          Lower rates supportive

                          But housing is expensive…

                          … due to structural factors

Servicing getting cheaper
On the back of lower interest rates
               65%

               60%

               55%

               50%
% of incomes

               45%
                                                                                                                                    Key
               40%
                                                                                                                                             Severely unaffordable
               35%                                                          Servicing a new purchase
                                                                            is getting a little cheaper                                      Seriously unaffordable
               30%                                                          for those who can afford it
                                                                                                                                             Moderately unaffordable
               25%
                                                                                                                                             Affordable
               20%
                         99        01        03        05        07    09     11    13    15    17    19    21

Source: Statistics NZ, REINZ, RBNZ, ANZ Research

But a difficult time ahead                                                                                       Housing market to weaken
Unemployment to rise                                                                                             As economic outlook deteriorates
               12
                                                                                                                       We see house prices 5-10% lower
               10

                                                                                                                       Uncertainty is high
                8

 %              6                                                                                                      Income strains to weigh longer term

                4                                                                                                      But mortgage rates to go even lower
                2
                                                                                                                       1-year mortgage rate offers good value
                0
                    99        01        03        05        07        09    11     13    15    17    19    21

                                                       Unemployment rate (LHS)

Source: Statistics NZ, ANZ Research

This is not personal advice. It does not consider your objectives or circumstances. Please refer to the Important Notice.

ANZ New Zealand Property Focus | August 2020                                                                                                                           2
Summary
         Contact                        Our monthly Property Focus publication provides an independent appraisal of
                                        recent developments in the residential property market.
         Liz Kendall, David Croy
         or Sharon Zollner for
         more details.                  Housing market overview
         See page 12.                   Lower mortgage rates have provided an opportunity for some buyers to enter
                                        the housing market, contributing to recent strength in house prices. There has
INSIDE
                                        been a small lift in first home buyer activity, with some loans to buyers with
                                        smaller deposits, though households and banks are cautious more generally.
At a glance                         2
                                        The renewed lockdown will see a pause in some segments, even if sales and
Housing Market Overview             4
                                        building work can proceed. And when economic impacts of the current crisis
Regional Housing Market
Indicators                          6
                                        become more evident down the track, we see the housing market weakening.
Feature Article: Locked out         7   Lower rates will continue to prove a cushion to the market and give cash-flow
Mortgage Borrowing Strategy        12   relief to existing mortgage borrowers, but rising unemployment and a range of
Weekly Mortgage Repayment               other factors will weigh, though the outlook remains uncertain. See Housing
Table                              13   Market Overview for more.
Mortgage Rate Forecasts            13
Economic Forecasts                 13   Feature Article: Locked out
Important Notice                   15
                                        The long-term benefits of home ownership are significant, but buying a new
                                        home is expensive. Housing affordability has worsened in recent decades; it
                                        now costs more to purchase a house and longer to save for a deposit, putting
                                        home ownership further out of reach for many. This is true across most New
ISSN 2624-0629                          Zealand regions. Recently, lower mortgage rates have made home ownership
                                        costs cheaper, benefiting existing homeowners and those who can enter the
Publication date: 25 August 2020
                                        market. But those who are locked out of the market cannot reap the same
                                        benefits, and rising unemployment and income strains are eventually expected
                                        to put pressure on the debt-servicing capability of some households. The RBNZ
                                        is providing an important cushion to the economy through lower mortgage rates
                                        (and other channels), reducing the blow to both house prices and incomes. But
                                        it won’t solve New Zealand’s housing affordability problem; that requires a hard
                                        look at structural factors. See Feature Article: Locked out for more.

                                        Mortgage borrowing strategy
                                        Home loan rates haven’t changed much over the past month. However, that’s
                                        set to change next year if the Reserve Bank cuts the OCR to below zero in April,
                                        as we expect. If that occurs, retail mortgage rates are likely to fall further after
                                        April. We like the 1-year term at the moment – not only is this the cheapest
                                        rate, but it will expire after April, after which it is likely to be cheaper to re-fix
                                        (if the OCR goes lower as we expect). With 2- and 3-year rates also very low,
                                        they are also worth considering in order to stagger expiry dates. We generally
                                        think that’s a good long-term strategy, but if the OCR does go lower, those
                                        rates are likely to go lower next year too. In our view, that gives the 1-year a
                                        slight edge at the moment.

ANZ New Zealand Property Focus | August 2020                                                                                 3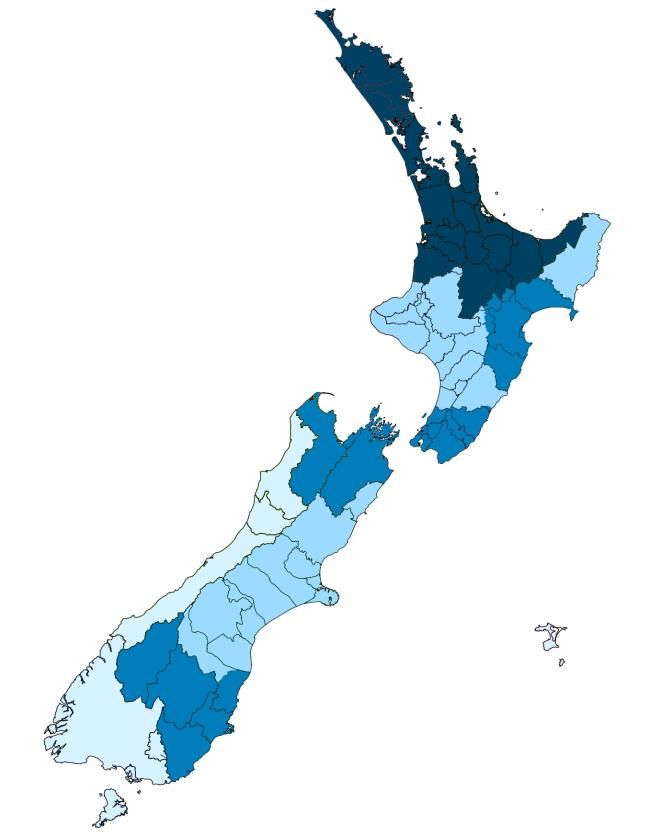
Housing market overview

Summary                                                             On the whole, the housing market has been
                                                                    remarkably resilient in the face of the enormous
Lower mortgage rates have provided an opportunity                   disruption of the COVID-19 crisis, with lower mortgage
for some buyers to enter the housing market,                        rates and the wage subsidy providing significant
contributing to recent resilience in house prices. There            support, and the mortgage deferment scheme
has been a small lift in first home buyer activity, with            preventing fire sales. However, these policy supports
some loans to buyers with smaller deposits, though                  have been a cushion, not a trampoline, and a number
households and banks are cautious more generally.
                                                                    of fundamental factors are expected to weigh in time.
The renewed lockdown will see a pause in some
segments, even if sales and building work can                       Mortgage rates supportive
proceed. And when economic impacts of the current
crisis become more evident down the track, we see                   Lower mortgage rates have contributed to the recent
the housing market weakening. Lower rates will                      resilience in house sales and prices, with rates having
continue to prove a cushion to the market and give                  fallen around 85bps from pre-crisis levels (figure 2).
cash-flow relief to existing mortgage borrowers, but                Recent declines in mortgage rates are a direct
rising unemployment and a range of other factors will               consequence of the RBNZ cutting the Official Cash
weigh, though the outlook remains uncertain.                        Rate (OCR) to 0.25%, committing to keep it there,
                                                                    embarking on quantitative easing (QE), and recently,
The housing market has been resilient                               talking up the possibility of a negative OCR.

The housing market has seen a solid post-lockdown                   Lower mortgage rates are providing an opportunity for
bounce, driven by pent-up demand, the generalised                   would-be buyers, supporting turnover and bidding
rebound in economic activity, lower mortgage rates,                 power. They are also shaping expectations about
and support to incomes via the wage subsidy.                        future interest costs, and easing cash-flow pressures
                                                                    for existing mortgage holders, supporting both the
Monthly house sales are 16% above February levels,                  housing market and spending.
reflecting partial catch-up as sales that were otherwise
lost or delayed in lockdown proceed (figure 1). House               Figure 2. Mortgage rates
prices are now 0.5% above March levels in seasonally
                                                                        12
adjusted terms, after dipping in April and May.
                                                                        11
However, the recent lift in the market has occurred at
                                                                        10
a time of the year when it would usually be on the                       9
weaker side, and further volatility in the data should                   8
be expected.                                                             7
                                                                    %
Figure 1. House sales                                                    6
                                                                         5
12000                                                                    4
                                             Post-lockdown               3
10000                                        bounce
                                                                         2
                                                                         1
 8000                                                                        98   00   02   04   06   08   10   12   14   16   18   20
                                                                         Floating      1-year    2-year     5-year    Effective mortgage rate
 6000
                                                                    Source: RBNZ, ANZ Research
 4000
                              Lost or delayed                       An opportunity for some
 2000                         sales
                                                                    The share of new lending to first home buyers has
                                                                    ticked up a little, with a slight increase in those with
    0
         Jan   Feb Mar Apr May Jun   Jul   Aug Sep Oct Nov Dec      deposits of less than 20% (figure 3). Lower mortgage
        2015      2016     2017      2018       2019         2020   rates have provided an opportunity for some first
                                                                    home buyers to take the plunge or spend a bit more
Source: REINZ, ANZ Research
                                                                    on planned purchases, with home ownership costs now
Building activity has been elevated too, with new                   a little lower and set to continue falling. See Feature
dwelling consents running at just 1.3% under February               Article: Locked out for more.
levels in seasonally adjusted terms. How this fares
going forward will depend on the outlook for house                  Relaxation of loan-to-value restrictions by the RBNZ
sales and prices, along with broader business activity,             may have encouraged the uptick in lower-deposit
                                                                    lending at the margin. But banks have always been
which tends to be linked to high-value residential
construction.                                                       able to do a portion of lending at lower deposits (20%

ANZ New Zealand Property Focus | August 2020                                                                                               4
Housing market overview
of owner-occupier lending), and new lending is still impacts of renewed lockdown and weakening in
well within where the restrictions used to be (there has underlying momentum, and the supportive impacts of
been a tick up from 13% to 15%, still well within increased fiscal and monetary stimulus. But downside
previous limits). So it is unlikely that the restrictions risks remain, especially on the back of the renewed
were constraining activity in aggregate prior to the lockdown. Income strains are expected to intensify as
change, but the response and impact may vary from unemployment rises, weighing significantly on
bank to bank. spending and the housing market.
Figure 3. Lending to first home buyers Figure 4. Employment and forward indicators
50 2 6
45 1 4
40 0 2
Annual % change
35 -1
0
Standardised
-2
30 -2
%
-3
25
-4
-4
20
-5 -6
15
-6 -8
10
-7 -10
5 12 13 14 15 16 17 18 19 20
0 MBIE job ads y/y (adv. 4 mths, LHS)
Aug-14 Aug-15 Aug-16 Aug-17 Aug-18 Aug-19 Aug-20 ANZBO hiring intentions (adv. 2 mths, LHS)
Share of new lending to first home buyers Seek job ads (adv. 3 mths, LHS)
Share of FHBs with low deposits Employment y/y (RHS)
Source: RBNZ, ANZ Research Source: MBIE, Statistics NZ, Seek. ANZ Research
In the current environment of uncertainty, house price
Lockdown pause expected expectations are downbeat (figure 5), and that is
For house prices, the boost from lower mortgage rates expected to affect negotiations and bidding behaviour
alongside income support from the wage subsidy has in auction rooms. Adding to that, banks and
been offset by weak net migration, uncertainty about households are cautious about credit, and this
the future, and rising unemployment. Those offsetting underlying caution is expected to become more evident
forces have seen house prices back around where they once the current flurry subsides.
were in March. But where to now?
Figure 5. House price expectations and actual
The renewed Alert Level 3 lockdown in Auckland will
20 7
affect the housing market, even if the current outbreak
can be contained quickly. House sales and building will 15 6
be impaired in Auckland, which comprises about a third 5
10
of national house sales and 38% of New Zealand’s
Annual % change
Annual % change
4
GDP. And even if the lockdown is relatively short, there 5
are clearly broader output losses, making the outlook 3
0
worse. Significant regional divergence in the housing 2
market can be expected in the near term, potentially -5
1
putting the recent rebound on pause in aggregate.
-10 0
Economic outlook to weigh longer term -15 -1
08 09 10 11 12 13 14 15 16 17 18 19 20
Eventually, the impact of a weaker economy is House price inflation (LHS)
expected to weigh on the market. But this may not be Consumer house price expectations (RHS)
seen until we see the labour market start to weaken Source: REINZ, Roy-Morgan, ANZ Research
materially. Job losses have been reduced and delayed
by the wage subsidy and its subsequent extensions, But mortgage rates to go even lower
though impacts of the downturn on the labour market
Providing an offset, mortgage rates now look set to go
cannot be avoided indefinitely. Even before the
even lower than previously forecast.
renewed lockdown began, firms were cutting back on
headcount (figure 4) and job losses were rising. The RBNZ’s most recent easing in monetary policy
through the expansion of QE to $100bn will flow
We’ve updated our GDP and labour market forecasts
through into lower mortgage rates in coming months.
to incorporate a stronger starting point, the negative
But more importantly, the fact that the OCR looks set
ANZ New Zealand Property Focus | August 2020 5
Housing market overview

to go into negative territory next year will weigh on                 However, uncertainty around the economic outlook,
mortgage rates significantly, even before the policy is               and by extension the outlook for the housing market,
deployed. We expect the OCR to reach -0.25% in April                  is large. Downside risks are significant and could see
next year, with mortgage rates assumed to fall around                 the GDP and labour market outlooks deteriorate more
another 80bps or more from current levels, though the                 significantly than currently assumed, which could see a
impacts of monetary stimulus on mortgage rates is                     more abrupt or larger correction in house prices.
uncertain (See mortgage rate forecast table).
                                                                      On the other hand, it is possible that the economy can
Still-lower mortgage rates will provide further support               regain momentum on the other side of the current
to the housing market, cushioning against the weaker                  outbreak and generate a more self-sustaining
economic outlook we see unfolding.                                    recovery, even with the border closed. This, and/or
                                                                      more potent impacts from policy than we currently
Overall, we see house prices falling 5-10%, but a fall
                                                                      expect, could see the housing market remain relatively
in the smaller end of this range now looks possible
                                                                      resilient, rather than weakening as we currently
(central forecast is now 6%, versus 9% previously),
                                                                      expect. Forecasting the housing market is a fraught
with this weakening not expected to be seen until later
                                                                      exercise at the best of times, and these are not the
this year and into next, given the extension of the
                                                                      best of times, with significant uncertainty around
wage subsidy and mortgage deferment schemes.
                                                                      migration, unemployment, the impact of
Without more stimulus, our more downbeat view of                      unprecedentedly low mortgage rates, and a very
the outlook would otherwise weigh on house prices,                    uncertain macroeconomic environment more
but monetary policy and the extension of the wage                     generally.
subsidy are expected to provide a potent offset.

Housing market indicators for July 2020 (based on REINZ data seasonally adjusted by ANZ Research)
                                          Median house price                House price index    # of     Monthly   Average
                                  Level        Annual %    3-mth %        Annual %    3-mth %   monthly     %       days to
                                                change      change         change      change    sales    change      sell
Northland                       $550,667         16.4          5.1           10.1        1.2      219      +20%        49
Auckland                        $938,022         11.7          1.5           9.3        -0.2     2,580     +24%        34
Waikato                         $622,114         17.3          7.9           11.4        1.3      898      +15%        31
Bay of Plenty                   $665,235         15.7          -1.2          7.1         0.1      576      +27%        39
Gisborne                        $490,710         36.9          11.7                                35      -35%        37
Hawke’s Bay                     $571,787         17.5          1.4           15.7        2.2      283      +22%        29
Manawatu-Whanganui              $448,082         19.7          2.8           9.6        -5.7      444      +14%        28
Taranaki                        $462,135         23.7          9.7           10.5        0.9      236      +39%        25
Wellington                      $716,975         10.4          -0.2          10.2       -2.1      886      +15%        29
Tasman, Nelson & Marlborough    $595,000         14.4          -2.8                               301      +34%        36
Canterbury                      $482,665          6.7          1.0           7.6         2.5     1,095      +8%        33
Otago                           $537,581          8.5          5.7           9.0        -4.9      460       +5%        35
West Coast                      $227,712         26.6          2.1           5.7         0.1       61       +2%        51
Southland                       $360,365         20.3          6.0           13.2       -0.3      172      -21%        30
New Zealand                    $669,243          14.9          -2.4          9.4        -0.4     8,188     +16%       34

ANZ New Zealand Property Focus | August 2020                                                                                  6
Feature Article: Locked out
Summary Ownership costs relative to incomes, for those
purchasing their first home; and
The long-term benefits of home ownership are
significant, but buying a new home is expensive. Costs of saving for a deposit while renting relative
Housing affordability has worsened in recent decades; to incomes, for those who are trying to get onto
it now costs more to purchase a house and longer to the property ladder.
save for a deposit, putting home ownership further out
Figure 2. Alternative measure of housing unaffordability
of reach for many. This is true across most New
Zealand regions. Recently, lower mortgage rates have 65% 14
made home ownership costs cheaper, benefiting 60% 13
existing homeowners and those who can enter the
55%
market. But those who are locked out of the market 12
50%
cannot reap the same benefits, and rising 11
unemployment and income strains are eventually 45%
10
expected to put pressure on debt-servicing capability 40%
of some households. The RBNZ is providing an 35%
9
important cushion to the economy through lower 8
30%
mortgage rates (and other channels), reducing the
25% 7
blow to both house prices and incomes. But it won’t
solve Zealand’s housing affordability problem; that 20% 6
99 01 03 05 07 09 11 13 15 17 19
requires a hard look at structural factors.
Ownership costs (LHS) Years saving for a deposit (RHS)
New Zealand houses are expensive Source: RBNZ, REINZ, Statistics NZ, ANZ Research
Note: Based on median house price, median incomes, mortgage
Houses have become more expensive over the past
and deposit rates, and other costs (rates, maintenance, insurance
two decades. House prices have risen dramatically to etc.) assumed to equal 2% of property value.
be 2.5 times higher than in the late 1990s in real
terms. Incomes have risen too, but not to the same These measures are illustrative, based on median
extent. House prices have risen from four times to housing values and incomes. In reality, costs will
almost seven times incomes over the same period depend on personal circumstances and the particular
(figure 1). house one buys or rents. For example, most
purchasers choose a lower-value property as their first
Figure 1. House prices to incomes (median multiple) step on the property ladder, but the same trends will
7.0
hold.
Based on these measures, houses are expensive and
6.5
have become more so. Since the late 1990s,
6.0 ownership costs have increased from about 35% of
5.5
household incomes to around 45%, and the time taken
to save for a deposit (assuming one is saving 10% of
Ratio
5.0 pre-tax income) has extended from 8 to almost 14
4.5
years. On a like-for-like basis, purchasing a new home
costs about twice as much as renting.
4.0
Weighing up the decision to rent or buy is very
3.5 situation dependent and is contingent on personal
3.0
circumstances, costs, preferences, income
99 01 03 05 07 09 11 13 15 17 19 expectations, taxes, expectations of capital gains, and
Source: REINZ, Statistics NZ, ANZ Research other perceived benefits. But for those who do own
their own homes, the benefits can be very substantial,
House prices relative to incomes is not a perfect including security of tenure and eventual freehold
measure of housing affordability, because it does not status, especially valuable in retirement.
take into account the fact that structural declines in
mortgage rates have provided an offset by reducing There will always be some who cannot afford to
debt-servicing costs. purchase a house to secure these benefits, and the
cohort of people who are able and willing to do so has
We consider two alternative measures, which we view reduced as houses have become more expensive. The
as more representative of housing affordability rate of home ownership has fallen from 74% in the
(figure 2): early 90s to 65% in 2013.
ANZ New Zealand Property Focus | August 2020 7
Feature Article: Locked out
Costs of home ownership can be a significant Figure 4. Costs of owning versus renting (June 2019)
constraint on housing affordability even with interest
70%
rates extremely low. This is because house prices, and
60%
by extension debt levels, are very high. Secular
50%
declines in mortgage rates have been more than offset 40%
by rising house prices over the past few decades. 30%
20%
Most regions are expensive 10%
Houses are expensive across most New Zealand 0%
Southland
West Coast
Tasman
Gisborne
Waikato
Taranaki
Northland
Mana/Wang
Canterbury
Wellington
Hawke's Bay
New Zealand
Otago
Auckland
Bay of Plenty
regions, with home ownership costs comprising more
than 40% of incomes in 8 out of 14 regions, and more
than 60% in Auckland (figure 3 and heatmap).
Figure 3. Housing affordability by region (June 2019) Renting (cheaper now, but without the benefits later)
Owning and paying a mortgage
70% 10 Renting and saving for a deposit
9 Source: MBIE, RBNZ, REINZ, Statistics NZ, ANZ Research
60%
8
50% 7 High house prices in regions like Auckland reflect the
6
40% desirability of living there and also that population
Ratio
5
30% 4 growth tends to be strong, with the region getting a
20% 3 significant portion of new migrants. In general, people
10%
2 (including those with a high willingness to pay) will
1
pay a premium to live in vibrant centres, with
0% 0
amenities, good weather, natural capital, good
Southland
West Coast
Tasman
Mana/Wang
Canterbury
Gisborne
Waikato
Taranaki
Northland
Wellington
Otago
Hawke's Bay
New Zealand
Auckland
Bay of Plenty
infrastructure, plentiful jobs, and growth potential.
To some extent, population can adjust to high housing
costs, with people gravitating to areas where housing
Ownership cost % of incomes (LHS) House price to income (RHS)
is cheaper, and this does occur to some degree, but it
Source: RBNZ, REINZ, Statistics NZ, ANZ Research is limited. Generally, people will move to where the
For those looking to get onto the property ladder, jobs are. When houses in Auckland get more
saving and renting concurrently on average eats up expensive, people may move to Hamilton and
about 37% of incomes in New Zealand as a whole, and Tauranga, but Southland is a less obvious substitute.
as much as 43% in Auckland (figure 4).
Regional comparison
House Years saving Home Rent Rent + Home Home
price to for a deposit ownership relative to deposit saving ownership cost ownership cost
annual (10% of pre- costs % of incomes relative to relative to rents relative to
income tax incomes) incomes (pre-tax) incomes + deposit saving rents
Northland 7.1 14 53% 28% 42% 1.2 1.9
Auckland 8.3 16 62% 27% 43% 1.4 2.3
Waikato 6.0 12 45% 22% 34% 1.3 2.0
Bay of Plenty 6.9 13 51% 25% 39% 1.3 2.0
Gisborne 4.9 9 36% 21% 31% 1.2 1.7
Hawke’s Bay 6.0 12 45% 25% 37% 1.2 1.8
Manawatu-Whanganui 4.7 9 35% 21% 31% 1.1 1.7
Taranaki 5.1 10 38% 23% 34% 1.1 1.6
Wellington 5.9 12 44% 24% 36% 1.2 1.8
Tasman-Nelson-Marlb 6.4 12 47% 24% 37% 1.3 2.0
Canterbury 5.0 10 37% 22% 32% 1.2 1.7
Otago 5.8 11 43% 27% 38% 1.1 1.6
West Coast 2.4 5 18% 16% 21% 0.9 1.1
Southland 3.6 7 27% 17% 25% 1.1 1.5
New Zealand 6.3 12 47% 25% 37% 1.3 1.9
Source: Statistics NZ, MBIE, REINZ, ANZ Research
ANZ New Zealand Property Focus | August 2020 8
Feature Article: Locked out

Heatmap: Regional comparison

                                               Key
                                                     Severely unaffordable

                                                     Seriously unaffordable

                                                     Moderately unaffordable

                                                     Affordable

ANZ New Zealand Property Focus | August 2020                                   9
Feature Article: Locked out

                                                            Figure 5. Minimum and effective mortgage rate
High house prices reflect structural factors
                                                                           10
The reasons why housing has become more expensive
                                                                           9
tend to be structural in nature. Demand for housing
                                                                           8
has been very strong in a supply-constrained                                                                                         Existing
                                                                           7                                                         homeowners
environment. Supply constraints exist because of
land-use constraints, regulatory restrictions and slow                     6
                                                              %
responsiveness of new building. Demand pressures                           5

have been a result of migration-driven population                          4
growth, increased credit availability, and a trend                         3
decline in neutral interest rates (largely owing to                        2
                                                                                                                               New purchases
structural factors, not cyclical monetary policy). If                      1
housing supply could easily respond, then these                            0
demand pressures would result in more building (both                            99        01    03    05    07    09     11     13     15   17    19    21

more and bigger houses), but in a supply-restricted                                  Minimum mortgage rate                    Effective mortgage rate
environment, higher demand ends up being reflected          Source: RBNZ, ANZ Research
to a greater degree in the price.
                                                            As minimum mortgage rates have fallen, home
Addressing New Zealand’s housing affordability              ownership costs for those entering the market have
problem would require a hard look at land supply,           eased a little to 43% of incomes (figure 6), with
building regulation, migration settings, and structural     incomes also coming under pressure recently. We
policies. Affordability metrics may ebb and flow in the     expect home ownership costs will decline further, to
future around current levels as conditions change, but      perhaps 35% of incomes, as mortgage rates fall
a significant shift is hard to imagine. With an             further, with weakness in house prices dampening
enormous amount of wealth tied up in housing and            costs for new purchases too, but weaker incomes
changes both logistically and politically difficult, it’s   providing an offset.
difficult to achieve the sorts of structural changes that
                                                            Figure 6. Home ownership costs (for new purchases)
would elicit a meaningful difference. The current
Government has made efforts to free up land supply                         65%
and solving greenfields infrastructure funding
                                                                           60%
challenges, but it’s not easy.
                                                                           55%

Ownership costs a little cheaper recently                                  50%
                                                            % of incomes

Recently, declines in mortgage rates have contributed                      45%
to resilience in house prices (see Housing market
                                                                           40%
overview for more details). For new purchases, the
minimum mortgage rate has fallen about 80bps. And                          35%                                         Servicing a new purchase
                                                                                                                       is getting a little cheaper
we assume this will decline by another 80bps, though                       30%                                         for those who can afford it
the outlook is uncertain. We are currently pencilling in
                                                                           25%
total falls across the curve of 160-195bps between
February 2020 and May next year.                                           20%
                                                                                     99    01    03    05    07   09     11     13     15   17    19    21
The catalyst for further falls is predominantly expected    Source: RBNZ, REINZ, Statistics NZ, ANZ Research
to be a move to a negative OCR next year. No, your
bank won’t be paying you to borrow, but it will mean        But income strains to more than offset
further downward pressure on mortgage rates. QE will
                                                            Although some new and existing homeowners are
also drive the term structure flatter, meaning particular
                                                            benefiting from lower mortgage rates, overall ability to
pressure on longer-term rates. However, there is
                                                            service debt has the potential to be much more
uncertainty about the pass through of these policies to
                                                            negatively impacted by firm difficulties and rising
mortgage rates in practice.
                                                            unemployment, especially for those directly affected.
For existing homeowners, the effective mortgage rate        This will weigh on house prices and spending generally.
on outstanding debt will take a bit longer to decline, as
                                                            Income strains and job losses are expected to be
fixed mortgage parcels roll off and are re-fixed at lower
                                                            further exacerbated by the renewed lockdown in
rates. We assume that it will fall gradually from 4.1%
                                                            Auckland, dampening the GDP outlook, although the
pre-COVID, to 3.7% now, to 2.4% at the end of 2021
                                                            extent of this is uncertain. More monetary stimulus and
(figure 5).
                                                            extended fiscal supports are likely to cushion the blow,

ANZ New Zealand Property Focus | August 2020                                                                                                            10
Feature Article: Locked out
but the scars of the current crisis are likely to worsen No game changer for housing affordability
as the lack of normality becomes more prolonged and
RBNZ stimulus will boost both incomes and house
closed border impacts hit, especially with some
prices, so the implications for overall housing
businesses coming out of the previous lockdown in an
affordability are unclear. Generally speaking,
already-fragile position.
inflation-targeting monetary policy is a cyclical policy to
The RBNZ is fulfilling a crucial role to cushion the blow, stabilise the economy, rather than being a structural
stimulating demand through lower mortgage rates and driver of unaffordable house prices.
a range of other channels. But monetary policy is a
There is a risk that the current crisis sees equilibrium
blunt instrument and can’t offset all of the painful interest rates lower for a long time (due to reduced
economic adjustment taking place due to the closed productive capacity in the economy, higher debt
border. We see unemployment rising to 10% burdens and/or lower inflation expectations), which
(figure 7), but a bit later than previously expected, with could see house prices to income ratios worsen slightly
the brunt of the economic impact to become clear later
for a time, though lower mortgage rates would offset in
this year.
terms of home ownership costs. But on the other hand,
Figure 7. Unemployment rate there is a risk that a more abrupt adjustment in house
prices could see house price to incomes reduce.
12
Our current forecasts have house prices to income
10 declining, but not moving too far from current levels,
though the exact path is uncertain. The point is: we
8 don’t see the current crisis, or the dramatic change in
the stance of monetary policy that has occurred, as
% 6
being a game changer for housing affordability in either
4
direction.
There are always winners and losers in terms of policy
2
impacts, though. For those saving for a deposit (and
for savers generally), lower interest rates will mean it
0
99 01 03 05 07 09 11 13 15 17 19 21 takes longer to build up a nest egg. However, if
Unemployment rate (LHS)
interest rates were not lower, income prospects would
be worse for many people. And the hardship and
Source: Statistics NZ, ANZ Research
inequalities that arise from people not being able to
The impact of income strains will be felt unevenly by find employment should not be underestimated.
region. Disparate regional impacts across the country
are already being borne out in mortgage deferment
data, which suggest that households in tourism
hotspots Queenstown and Rotorua are feeling the most
financial strain (figure 8). Some areas are particularly
vulnerable to house price falls, while other areas are
likely to see more resilient prices.
Figure 8. Mortgage deferment by region
Wellington
Palmerston North
Gisborne
Blenheim
Hamilton
Hastings
Dunedin
Nelson
New Plymouth
Christchurch
Napier
Auckland
Invercargil
Tauranga
Taupo
Whangarei
Rotorua
Queenstown
0 2 4 6 8 10 12
% of mortgages
Source: Centrix
ANZ New Zealand Property Focus | August 2020 11Mortgage borrowing strategy
This is not personal advice. The opinions and research higher than the one-year and we don’t see the RBNZ
contained in this document are provided for cutting till April, making it a less attractive proposition.
information only, are intended to be general in nature
and do not take into account your financial situation Staggering fixed terms has merit as it spreads out the
or goals. risk of unexpected moves in interest rates. But it tends
to better suit times when one is more confident that
Summary interest rates are rising. At the moment, the RBNZ is
Home loan rates haven’t changed much over the past clearly signalling lower rates. Nonetheless, it’s worth
month. However, that’s set to change next year if the doing the maths, and breakeven analysis can help. For
Reserve Bank cuts the OCR to below zero in April, as example; the 1-year breakeven rate in one year’s time
we expect. If that occurs, retail mortgage rates are is 2.83%. If the choice is between 1-year at 2.55% or
likely to fall further after April. We like the 1-year term 2-years at 2.69%, you’d be financially better off
at the moment – not only is this the cheapest rate, but selecting the 1-year and re-fixing for another year in a
it will expire after April, after which it is likely to be year if you thought the 1-year would likely be below
cheaper to re-fix (if the OCR goes lower as we expect). 2.80% in a year. And because we think rates are
With 2- and 3-year rates also very low, they are also biased to go lower, that tilts the decision towards the
worth considering in order to stagger expiry dates. We 1-year, with a view to re-fixing once the OCR is lower
generally think that’s a good long-term strategy, but if in 2021.
the OCR does go lower, those rates are likely to go
Figure 1. Carded special mortgage rates^
lower next year too. In our view, that gives the 1-year
4.75%
a slight edge at the moment.
4.50%
Our view 4.25%
4.00%
Average mortgage rates haven’t changed much over
3.75%
the past month, but that is all set to change as we
head into 2021, with most forecasters including ANZ 3.50%
now expecting the Reserve Bank (RBNZ) to lower the 3.25%
OCR to below zero in April. At the outset it is worth 3.00%
highlighting that we and the RBNZ do not have any 2.75%
expectation that retail interest rates will end up falling 2.50%
below zero – that’s not what is likely to happen. But if 2.25%
we do see wholesale interest rates fall further, that has 0 1 2
Years
3 4 5
important implications for retail interest rates. In fact, Last Month This Month
it is worth adding that the whole reason why the RBNZ
increased the size of its Large Scale Asset Purchase Table 1. Special Mortgage Rates
(QE) programme this month was to “further lower Breakevens for 20%+ equity borrowers
retail interest rates in order to achieve its [inflation and Term Current in 6mths in 1yr in 18mths in 2 yrs
full employment] remit”. In plain English: the RBNZ Floating 4.51%
want retail interest rates to fall, and they will set 6 months 4.01% 1.10% 2.76% 2.90% 2.94%
monetary policy to make sure that it happens. 1 year 2.55% 1.93% 2.83% 2.92% 2.99%
So if the likelihood of mortgage rates falling further is 2 years 2.69% 2.42% 2.91% 3.37% 3.92%
on the cards, readers may ask themselves: why fix at 3 years 2.79% 2.89% 3.56% 3.69% 3.80%
all? There are two good reasons. First, floating rates 4 years 3.31% 3.25% 3.56%
are a lot more expensive than, for example, the 5 years 3.36% #Average of “big four” banks
average 1-year fixed rate. Mortgage rates are based on
Table 2. Standard Mortgage Rates
wholesale interest rates, which now incorporate an
expectation of lower interest rates. But the 1-year rate Breakevens for standard mortgage rates*
is mostly lower because that’s the part of the market Term Current in 6mths in 1yr in 18mths in 2 yrs
where banks like to compete the most, and because of Floating 4.51%
that, we tend to view a 1-year fixed rate as a close 6 months 4.16% 2.35% 3.49% 3.33% 3.79%
proxy to floating, albeit a vastly cheaper one. The 1 year 3.25% 2.92% 3.41% 3.56% 3.89%
second reason (and it isn’t always the case – but it is
2 years 3.33% 3.24% 3.65% 4.01% 4.51%
now) is that the RBNZ have committed to not lowering
3 years 3.52% 3.64% 4.14% 4.27% 4.44%
the OCR till at least March 16th 2001. So that means
4 years 3.92% 3.93% 4.18%
they won’t cut at their February meeting, but they can
in April, and that’s what we expect them to do. 5 years 4.00% #Average of “big four” banks
^ Average of carded rates from ANZ, ASB, BNZ and Westpac.
The logic of using a fixed rate as a proxy for floating
also applies to the 6-month, but the 6-month rate is Source: interest.co.nz, ANZ Research
ANZ New Zealand Property Focus | August 2020 12Key forecasts
Weekly mortgage repayments table (based on 25-year term)
Mortgage Rate (%)
2.50 2.75 3.00 3.25 3.50 3.75 4.00 4.25 4.50 4.75 5.00 5.25 5.50 5.75
200 103 106 109 112 115 119 122 125 128 131 135 138 142 145
250 155 160 164 169 173 178 183 187 192 197 202 207 212 218
300 207 213 219 225 231 237 243 250 256 263 270 276 283 290
350 259 266 273 281 289 296 304 312 320 329 337 345 354 363
400 310 319 328 337 346 356 365 375 385 394 404 415 425 435
Mortgage Size ($’000)
450 362 372 383 393 404 415 426 437 449 460 472 484 496 508
500 414 426 437 450 462 474 487 500 513 526 539 553 566 580
550 466 479 492 506 520 534 548 562 577 592 607 622 637 653
600 517 532 547 562 577 593 609 625 641 657 674 691 708 725
650 569 585 601 618 635 652 669 687 705 723 741 760 779 798
700 621 638 656 674 693 711 730 750 769 789 809 829 850 870
750 673 692 711 730 750 771 791 812 833 854 876 898 920 943
800 724 745 766 787 808 830 852 874 897 920 944 967 991 1,015
850 776 798 820 843 866 889 913 937 961 986 1,011 1,036 1,062 1,088
900 828 851 875 899 924 948 974 999 1,025 1,052 1,078 1,105 1,133 1,160
950 879 904 930 955 981 1,008 1,035 1,062 1,089 1,117 1,146 1,174 1,204 1,233
1000 931 958 984 1,011 1,039 1,067 1,095 1,124 1,154 1,183 1,213 1,244 1,274 1,306
Mortgage rate forecasts (fixed rates based on special rates)
Actual Forecasts
Interest rates Dec-19 Mar-20 Jun-20 Sep-20 Dec-20 Mar-21 Jun-21 Sep-21 Dec-21 Mar-22
Floating Mortgage Rate 5.5 4.8 4.6 4.5 4.3 4.3 3.8 3.8 3.8 3.8
1-Yr Fixed Mortgage Rate 3.4 3.1 2.7 2.3 2.1 1.9 1.8 1.8 1.8 1.8
2-Yr Fixed Mortgage Rate 3.5 3.3 2.7 2.4 2.1 2.0 1.9 1.9 1.9 1.9
5-Yr Fixed Mortgage Rate 4.2 3.9 3.1 2.7 2.2 2.2 2.2 2.3 2.3 2.3
Source: RBNZ, ANZ Research
Economic forecasts
Actual Forecasts
Economic indicators Sep-19 Dec-19 Mar-20 Jun-20 Sep-20 Dec-20 Mar-21 Jun-21 Sep-21 Dec-21
GDP (Annual % Chg) 2.4 1.8 -0.2 -17.8 -5.4 -4.7 -4.6 16.8 1.7 2.5
CPI Inflation (Annual % Chg) 1.5 1.9 2.5 1.5 1.3 0.9 0.5 1.1 0.8 0.6
Unemployment Rate (%) 4.1 4.1 4.2 4.0 6.5 8.0 8.8 9.8 9.3 8.5
House Prices (Quarter % Chg) 1.6 3.2 3.3 0.2 0.0 -3.0 -3.0 0.0 2.0 2.0
House Prices (Annual % Chg) 2.7 5.3 8.2 8.5 6.8 0.4 -5.7 -5.9 -4.0 0.9
Interest rates Dec-19 Mar-20 Jun-20 Sep-20 Dec-20 Mar-21 Jun-21 Sep-21 Dec-21
Official Cash Rate 1.00 0.25 0.25 0.25 0.25 0.25 -0.25 -0.25 -0.25
90-Day Bank Bill Rate 1.29 0.49 0.30 0.26 0.25 -0.08 -0.25 -0.25 -0.25
LSAP ($bn) 33 60 100 120 120 120 120 120
Source: ANZ Research, Statistics NZ, RBNZ, REINZ
ANZ New Zealand Property Focus | August 2020 13Contact us
Meet the team
We welcome your questions and feedback. Click here for more information about our team.
Sharon Zollner General enquiries:
Chief Economist research@anz.com
Follow Sharon on Twitter Follow ANZ Research
@sharon_zollner @ANZ_Research (global)
Telephone: +64 27 664 3554
Email: sharon.zollner@anz.com
David Croy Susan Kilsby
Senior Strategist Agricultural Economist
Market developments, interest Primary industry developments
rates, FX, unconventional and outlook, structural change
monetary policy, liaison with and regulation, liaison with
market participants. industry.
Telephone: +64 4 576 1022 Telephone: +64 21 633 469
Email: david.croy@anz.com Email: susan.kilsby@anz.com
Liz Kendall Miles Workman
Senior Economist Senior Economist
Research co-ordinator, publication Macroeconomic forecast co-
strategy, property market ordinator, fiscal policy, economic
analysis, monetary and prudential risk assessment and credit
policy. developments.
Telephone: +64 27 240 9969 Telephone: +64 21 661 792
Email: elizabeth.kendall@anz.com Email: miles.workman@anz.com
Kyle Uerata Natalie Denne
Economic Statistician PA / Desktop Publisher
Economic statistics, ANZ Business management, general
proprietary data (including ANZ enquiries, mailing lists,
Business Outlook), data capability publications, chief economist’s
and infrastructure. diary.
Telephone: +64 21 633 894 Telephone: +64 21 253 6808
Email: kyle.uerata@anz.com Email: natalie.denne@anz.com
ANZ New Zealand Property Focus | August 2020 14Important notice This document is intended for ANZ’s Institutional, Markets and Private Banking clients. It should not be forwarded, copied or distributed. The information in this document is general in nature, and does not constitute personal financial product advice or take into account your objectives, financial situation or needs. This document may be restricted by law in certain jurisdictions. Persons who receive this document must inform themselves about and observe all relevant restrictions. Disclaimer for all jurisdictions: This document is prepared and distributed in your country/region by either: Australia and New Zealand Banking Group Limited (ABN11 005 357 522) (ANZ); or its relevant subsidiary or branch (each, an Affiliate), as appropriate or as set out below. This document is distributed on the basis that it is only for the information of the specified recipient or permitted user of the relevant website (recipients). This document is solely for informational purposes and nothing contained within is intended to be an invitation, solicitation or offer by ANZ to sell, or buy, receive or provide any product or service, or to participate in a particular trading strategy. Distribution of this document to you is only as may be permissible by the laws of your jurisdiction, and is not directed to or intended for distribution or use by recipients resident or located in jurisdictions where its use or distribution would be contrary to those laws or regulations, or in jurisdictions where ANZ would be subject to additional licensing or registration requirements. Further, the products and services mentioned in this document may not be available in all countries. ANZ in no way provides any financial, legal, taxation or investment advice to you in connection with any product or service discussed in this document. Before making any investment decision, recipients should seek independent financial, legal, tax and other relevant advice having regard to their particular circumstances. Whilst care has been taken in the preparation of this document and the information contained within is believed to be accurate, ANZ does not represent or warrant the accuracy or completeness of the information Further, ANZ does not accept any responsibility to inform you of any matter that subsequently comes to its notice, which may affect the accuracy of the information in this document. Preparation of this document and the opinions expressed in it may involve material elements of subjective judgement and analysis. Unless specifically stated otherwise: they are current on the date of this document and are subject to change without notice; and, all price information is indicative only. Any opinions expressed in this document are subject to change at any time without notice. ANZ does not guarantee the performance of any product mentioned in this document. All investments entail a risk and may result in both profits and losses. Past performance is not necessarily an indicator of future performance. The products and services described in this document may not be suitable for all investors, and transacting in these products or services may be considered risky. ANZ expressly disclaims any responsibility and shall not be liable for any loss, damage, claim, liability, proceedings, cost or expense (Liability) arising directly or indirectly and whether in tort (including negligence), contract, equity or otherwise out of or in connection with this document to the extent permissible under relevant law. Please note, the contents of this document have not been reviewed by any regulatory body or authority in any jurisdiction. ANZ and its Affiliates may have an interest in the subject matter of this document. They may receive fees from customers for dealing in the products or services described in this document, and their staff and introducers of business may share in such fees or remuneration that may be influenced by total sales, at all times received and/or apportioned in accordance with local regulatory requirements. Further, they or their customers may have or have had interests or long or short positions in the products or services described in this document, and may at any time make purchases and/or sales in them as principal or agent, as well as act (or have acted) as a market maker in such products. This document is published in accordance with ANZ’s policies on conflicts of interest and ANZ maintains appropriate information barriers to control the flow of information between businesses within it and its Affiliates. Your ANZ point of contact can assist with any questions about this document including for further information on these disclosures of interest. Country/region specific information: Unless stated otherwise, this document is distributed by Australia and New Zealand Banking Group Limited (ANZ). Australia. ANZ holds an Australian Financial Services licence no. 234527. For a copy of ANZ's Financial Services Guide please click here or request from your ANZ point of contact. Brazil, Brunei, India, Japan, Kuwait, Malaysia, Switzerland, Taiwan. This document is distributed in each of these jurisdictions by ANZ on a cross-border basis. European Economic Area (EEA): United Kingdom. ANZ is authorised in the United Kingdom by the Prudential Regulation Authority (PRA) and is subject to regulation by the Financial Conduct Authority (FCA) and limited regulation by the PRA. Details about the extent of our regulation by the PRA are available from us on request. This document is distributed in the United Kingdom by Australia and New Zealand Banking Group Limited ANZ solely for the information of persons who would come within the FCA definition of “eligible counterparty” or “professional client”. It is not intended for and must not be distributed to any person who would come within the FCA definition of “retail client”. Nothing here excludes or restricts any duty or liability to a customer which ANZ may have under the UK Financial Services and Markets Act 2000 or under the regulatory system as defined in the Rules of the Prudential Regulation Authority (PRA) and the FCA. ANZ is authorised in the United Kingdom by the PRA and is subject to regulation by the FCA and limited regulation by the PRA. Details about the extent of our regulation by the PRA are available from us on request. Fiji. For Fiji regulatory purposes, this document and any views and recommendations are not to be deemed as investment advice. Fiji investors must seek licensed professional advice should they wish to make any investment in relation to this document. Hong Kong. This publication is issued or distributed in Hong Kong by the Hong Kong branch of ANZ, which is registered at the Hong Kong Monetary Authority to conduct Type 1 (dealing in securities), Type 4 (advising on securities) and Type 6 (advising on corporate finance) regulated activities. The contents of this publication have not been reviewed by any regulatory authority in Hong Kong. India. If this document is received in India, only you (the specified recipient) may print it provided that before doing so, you specify on it your name and place of printing. Myanmar. This publication is intended to be general and part of ANZ’s customer service and marketing activities when implementing its functions as a licensed bank. This publication is not Securities Investment Advice (as that term is defined in the Myanmar Securities Transaction Law 2013). New Zealand. This document is intended to be of a general nature, does not take into account your financial situation or goals, and is not a personalised adviser service under the Financial Advisers Act 2008 (FAA). ANZ New Zealand Property Focus | August 2020 15
Important notice

Oman. ANZ neither has a registered business presence nor a representative office in Oman and does not undertake banking business
or provide financial services in Oman. Consequently ANZ is not regulated by either the Central Bank of Oman or Oman’s Capital
Market Authority. The information contained in this document is for discussion purposes only and neither constitutes an offer of
securities in Oman as contemplated by the Commercial Companies Law of Oman (Royal Decree 4/74) or the Capital Market Law of
Oman (Royal Decree 80/98), nor does it constitute an offer to sell, or the solicitation of any offer to buy non-Omani securities in
Oman as contemplated by Article 139 of the Executive Regulations to the Capital Market Law (issued vide CMA Decision 1/2009). ANZ
does not solicit business in Oman and the only circumstances in which ANZ sends information or material describing financial products
or financial services to recipients in Oman, is where such information or material has been requested from ANZ and the recipient
understands, acknowledges and agrees that this document has not been approved by the CBO, the CMA or any other regulatory body
or authority in Oman. ANZ does not market, offer, sell or distribute any financial or investment products or services in Oman and no
subscription to any securities, products or financial services may or will be consummated within Oman. Nothing contained in this
document is intended to constitute Omani investment, legal, tax, accounting or other professional advice.
People’s Republic of China (PRC). This document may be distributed by either ANZ or Australia and New Zealand Bank (China)
Company Limited (ANZ China). Recipients must comply with all applicable laws and regulations of PRC, including any prohibitions on
speculative transactions and CNY/CNH arbitrage trading. If this document is distributed by ANZ or an Affiliate (other than ANZ China),
the following statement and the text below is applicable: No action has been taken by ANZ or any affiliate which would permit a public
offering of any products or services of such an entity or distribution or re-distribution of this document in the PRC. Accordingly, the
products and services of such entities are not being offered or sold within the PRC by means of this document or any other document.
This document may not be distributed, re-distributed or published in the PRC, except under circumstances that will result in
compliance with any applicable laws and regulations. If and when the material accompanying this document relates to the products
and/or services of ANZ China, the following statement and the text below is applicable: This document is distributed by ANZ China in
the Mainland of the PRC.
Qatar. This document has not been, and will not be:
• lodged or registered with, or reviewed or approved by, the Qatar Central Bank (QCB), the Qatar Financial Centre (QFC) Authority,
  QFC Regulatory Authority or any other authority in the State of Qatar (Qatar); or
• authorised or licensed for distribution in Qatar,
and the information contained in this document does not, and is not intended to, constitute a public offer or other invitation in respect
of securities in Qatar or the QFC. The financial products or services described in this document have not been, and will not be:
• registered with the QCB, QFC Authority, QFC Regulatory Authority or any other governmental authority in Qatar; or
• authorised or licensed for offering, marketing, issue or sale, directly or indirectly, in Qatar.
Accordingly, the financial products or services described in this document are not being, and will not be, offered, issued or sold in
Qatar, and this document is not being, and will not be, distributed in Qatar. The offering, marketing, issue and sale of the financial
products or services described in this document and distribution of this document is being made in, and is subject to the laws,
regulations and rules of, jurisdictions outside of Qatar and the QFC. Recipients of this document must abide by this restriction and not
distribute this document in breach of this restriction. This document is being sent/issued to a limited number of institutional and/or
sophisticated investors (i) upon their request and confirmation that they understand the statements above; and (ii) on the condition
that it will not be provided to any person other than the original recipient, and is not for general circulation and may not be
reproduced or used for any other purpose.
Singapore. This document is distributed in Singapore by the Singapore branch of ANZ solely for the information of “accredited
investors”, “expert investors” or (as the case may be) “institutional investors” (each term as defined in the Securities and Futures Act
Cap. 289 of Singapore). ANZ is licensed in Singapore under the Banking Act Cap. 19 of Singapore and is exempted from holding a
financial adviser’s licence under Section 23(1)(a) of the Financial Advisers Act Cap. 100 of Singapore.
United Arab Emirates (UAE). This document is distributed in the UAE or the Dubai International Financial Centre (DIFC) (as
applicable) by ANZ. This document does not, and is not intended to constitute: (a) an offer of securities anywhere in the UAE; (b) the
carrying on or engagement in banking, financial and/or investment consultation business in the UAE under the rules and regulations
made by the Central Bank of the UAE, the Emirates Securities and Commodities Authority or the UAE Ministry of Economy; (c) an
offer of securities within the meaning of the Dubai International Financial Centre Markets Law (DIFCML) No. 12 of 2004; and (d) a
financial promotion, as defined under the DIFCML No. 1 of 200. ANZ DIFC Branch is regulated by the Dubai Financial Services
Authority (DFSA) ANZ DIFC Branch is regulated by the Dubai Financial Services Authority (DFSA). The financial products or services
described in this document are only available to persons who qualify as “Professional Clients” or “Market Counterparty” in accordance
with the provisions of the DFSA rules.
United States. Except where this is a FX- related document, this document is distributed in the United States by ANZ Securities, Inc.
(ANZ SI) which is a member of the Financial Regulatory Authority (FINRA) (www.finra.org) and registered with the SEC. ANZSI’s
address is 277 Park Avenue, 31st Floor, New York, NY 10172, USA (Tel: +1 212 801 9160 Fax: +1 212 801 9163). ANZSI accepts
responsibility for its content. Information on any securities referred to in this document may be obtained from ANZSI upon request.
This document or material is intended for institutional use only – not retail. If you are an institutional customer wishing to effect
transactions in any securities referred to in this document you must contact ANZSI, not its affiliates. ANZSI is authorised as a broker-
dealer only for institutional customers, not for US Persons (as “US person” is defined in Regulation S under the US Securities Act of
1933, as amended) who are individuals. If you have registered to use this website or have otherwise received this document and are
a US Person who is an individual: to avoid loss, you should cease to use this website by unsubscribing or should notify the sender and
you should not act on the contents of this document in any way. Non-U.S. analysts: Non-U.S. analysts may not be associated persons
of ANZSI and therefore may not be subject to FINRA Rule 2242 restrictions on communications with the subject company, public
appearances and trading securities held by the analysts. Where this is an FX-related document, it is distributed in the United States
by ANZ's New York Branch, which is also located at 277 Park Avenue, 31st Floor, New York, NY 10172, USA (Tel: +1 212 801 916 0
Fax: +1 212 801 9163).
Vietnam. This document is distributed in Vietnam by ANZ or ANZ Bank (Vietnam) Limited, a subsidiary of ANZ.

This document has been prepared by ANZ Bank New Zealand Limited, Level 26, 23-29 Albert Street, Auckland 1010, New Zealand,
Ph 64 9 357 4094, e-mail nzeconomics@anz.com, http://www.anz.co.nz

ANZ New Zealand Property Focus | August 2020                                                                                           16
You can also read