New Zealand Property Focus - Where the rubber meets the road ANZ Research June 2020

Page created by Lloyd Deleon
 
CONTINUE READING
New Zealand Property Focus - Where the rubber meets the road ANZ Research June 2020
ANZ Research                June 2020

New Zealand
Property Focus
Where the rubber meets the road
New Zealand Property Focus - Where the rubber meets the road ANZ Research June 2020
This is not personal advice. It
                                      Summary
does not consider your                Our monthly Property Focus publication provides an independent appraisal of
objectives or circumstances.          recent developments in the residential property market.
Please refer to the Important
Notice.
                                      Feature Article: Where the rubber meets the road
                                      The reopening of the New Zealand economy has made the outlook a little bit
INSIDE                                brighter. Recently, there has been a bounce in spending and positive anecdotes
Feature Article: Where the rubber     about the housing market – but we do not expect this positivity to last. The
meets the road                    3   period ahead is when people on the street will feel the recession in lasting ways.
The Property Market in Pictures 8
                                      Unemployment is rising and businesses are cautious. It will be a slow economic
Property Gauges                 12
Mortgage Borrowing Strategy     14    recovery, which means mortgage rates will be low for a long time. For some
Key Forecasts                   15    households, this will make home buying and spending more attractive, while for
Important Notice                16    others it presents an opportunity to improve their financial positions. Although
                                      low interest rates will cushion the economic blow to some extent, weaker
                                      incomes and reduced job security will weigh on the housing market. The
                                      shortage of housing will likely erode, particularly in tourist regions. We have
CONTRIBUTORS                          nudged up our house price forecasts, but only a little. We see house prices
Liz Kendall                           down 12%, which will weigh on household spending, with risks now more
Senior Economist                      balanced. See our heatmap for vulnerability to house price falls by region.
Telephone: +64 27 240 9969
Elizabeth.Kendall@anz.com             House price inflation: expectations and reality
David Croy                                              20                                                                     7
Strategist
Telephone: +64 27 432 2769                              15                                                                     6
david.croy@anz.com
                                                                                                                               5
                                                        10
                                      Annual % change

                                                                                                                                    Annual % change
Sharon Zollner
Chief Economist                                                                                                                4
Telephone: +64 27 664 3554                               5
Sharon.Zollner@anz.com                                                                                                         3
                                                         0
                                                                                                                               2
                                                         -5
                                                                                                                               1
ISSN 2624-0629
                                                        -10                                                                    0

Publication date: 18 June 2020                          -15                                                                    -1
                                                              08   09   10   11   12   13   14   15   16   17   18   19   20
                                                                         House price inflation (LHS)
                                                                         Consumer house price expectations (RHS)

                                      Source: REINZ, Roy Morgan, ANZ Research

                                      Mortgage borrowing strategy
                                      Improving financial market conditions and increased competition in the
                                      mortgage market have seen home loan rates drop further over the past month,
                                      taking fixed rates down another notch. For the first time in decades, mortgage
                                      rates (on average across the “majors”) are below 3%. Competition is heating up
                                      in the floating rates space, but even so, it’s hard to go past 1-2 year rates at
                                      the moment, which are generally lower. We had been expecting rates to fall,
                                      and more falls are likely as the RBNZ presses ahead with quantitative easing
                                      (QE), but the pace of falls from here is likely to be slower. We still favour the 1-
                                      year, but for the first time in a long time it might be worth considering the 2-
                                      year, which has a further decline in rates “baked in”. Longer rates are less
                                      attractive.

ANZ New Zealand Property Focus | June 2020                                                                                                            2
New Zealand Property Focus - Where the rubber meets the road ANZ Research June 2020
Feature Article: Where the rubber meets the road

Summary                                                                                      Figure 2. ANZ card spend data (daily spend)
                                                                                                                          120
The reopening of the New Zealand economy has made

                                                                                             Index (base March 7 = 100)
the outlook a little bit brighter. Recently, there has                                                                    100
been a bounce in spending and positive anecdotes

                                                                                                 Rolling 7-day total
                                                                                                                              80
about the housing market – but we do not expect this
positivity to last. The period ahead is when people on                                                                        60
the street will feel the recession in lasting ways.
                                                                                                                              40
Unemployment is rising and businesses are cautious.
It will be a slow economic recovery, which means                                                                              20
mortgage rates will be low for a long time. For some
households, this will make home buying and spending                                                                            0

                                                                                                                                   7 Mar

                                                                                                                                                                                                                                            30 May
                                                                                                                                           14 Mar
                                                                                                                                                    21 Mar
                                                                                                                                                             28 Mar

                                                                                                                                                                                                         2 May
                                                                                                                                                                                                                 9 May
                                                                                                                                                                                                                          16 May
                                                                                                                                                                                                                                   23 May
                                                                                                                                                                      4 Apr
                                                                                                                                                                              11 Apr

                                                                                                                                                                                                                                                     6 Jun
                                                                                                                                                                                       18 Apr
                                                                                                                                                                                                25 Apr

                                                                                                                                                                                                                                                             13 Jun
                                                                                                                                                                                                                                                                      20 Jun
                                                                                                                                                                                                                                                                               27 Jun
more attractive, while for others it presents an
opportunity to improve their financial positions.
Although low interest rates will cushion the economic                                                                                                                                  2019                      2020
blow to some extent, weaker incomes and reduced job
                                                                                             Source: ANZ Research
security will weigh on the housing market. The
shortage of housing will likely erode, particularly in                                       Positive housing vibes not expected to last
tourist regions. We have nudged up our house price
forecasts, but only a little. We see house prices down                                       A similar resurgence in demand has been seen in the
12%, which will weigh on household spending, with                                            housing market, after sales were not able to proceed
risks now more balanced.                                                                     in alert level 4, and real estate activity was somewhat
                                                                                             limited in levels 2 and 3. This has fuelled a number of
The economic outlook is a little better                                                      positive anecdotes about the housing market.
New Zealand’s success at curbing COVID-19 has                                                There have been reports of busy open homes and
improved the near-term economic outlook. We have                                             strong demand. But listings were low coming out of
been able to progress through the alert levels and                                           lockdown. The recent flurry of sales in May took place
open up the economy a little faster than expected.                                           after relatively few houses were available in April
More production will be able to take place, and                                              (houses usually take about a month to sell on
households and firms will feel a little more optimistic                                      average). Over this period, the housing market was
about the outlook and ready to spend. Overall, we see                                        “tight” and this supported prices, with only a modest
spending in the economy a little stronger over the next                                      decline in house prices (-1.2%) seen since March.
few years than previously (figure 1).
                                                                                             More recently, a tick-up in listings has taken place post
Figure 1. ANZ GDP forecasts                                                                  lockdown, and there are now many more houses
                         110                                                                 available for those looking to buy. Tightness in the
                                                                                             market has abated (figure 3). This slackening and an
                         100                                                                 end to the post-lockdown flurry should see more
Index (Dec 2019 = 100)

                                                                                             downward pressure on prices emerge in coming
                          90                                                                 months, especially as the economy settles at a weaker
                                                                                             trend after the post-lockdown bounce.
                          80                                                                 Figure 3. Listings and tightness in the market
                                                                                                                          0                                                                                                                                                    1.1
                          70                                                                       2,000                                                                                                                                                                       1.0

                                                                                                   4,000                                                                                                                                                                       0.9
                          60                                                                       6,000                                                                                                                                                                       0.8
                               02      04   06    08    10    12   14   16   18   20   22
                                                                                                   8,000                                                                                                                                                                       0.7
                                    ANZ forecast (previous)         ANZ Forecast (updated)
                                                                                             10,000                                                                                                                                                                            0.6
Source: Statistics NZ, ANZ Research
                                                                                             12,000                                                                                                                                                                            0.5
We are currently seeing a post-lockdown spending                                             14,000                                                                                                                        Slack                                               0.4
                                                                                                                                                                                                                         opening up
flurry, after households were not able to spend in                                           16,000                                                                                                                                                                            0.3
lockdown. For some, this period saw a temporary                                              18,000                                                                                                                                                                            0.2
increase in savings. Since then, daily spending has                                                                           07 08 09 10 11 12 13 14 15 16 17 18 19 20
returned to pre-lockdown levels (figure 2). However, it                                                                                       Listings (sa, inverted, LHS)
has not increased above those levels, which would be                                                                                          Sales/listings: "tightness" in the market (RHS)

required for households to make up for lost time. It is                                      Source: REINZ, realestate.co.nz, ANZ Research
our expectation that spending will revert to a slightly
weaker trend once the freedom party subsides.

ANZ New Zealand Property Focus | June 2020                                                                                                                                                                                                                                         3
New Zealand Property Focus - Where the rubber meets the road ANZ Research June 2020
Feature Article: Where the rubber meets the road

A challenging period lies ahead                                                         0.25% for the foreseeable future, and more
                                                                                        quantitative easing is also expected. See our recent
Although economic disruption has now ended (aside
                                                                                        FAQs here and here for more on quantitative easing).
from border restrictions), we are moving to a new
phase of the economic downturn. The worst of the                                        Retail mortgage rates are also expected to remain low
economic impact has already occurred in GDP terms.                                      for a long time, and have fallen further over the last
But for most people on the street, the worst of the                                     month to be down as much as 75bps since March
recession is yet to be felt.                                                            (figure 5). This downward pressure is likely to continue
                                                                                        for a while longer as the knock-on of quantitative
Although wage subsidies and other fiscal policy
                                                                                        easing lowers funding costs for banks and increases
measures are masking and deferring the impact,
                                                                                        liquidity. See our mortgage borrower strategy for more
unemployment is rising, and more job losses are on
                                                                                        details on current mortgage rates and the outlook).
the way. Firms profits are expected to be lower
(especially in hard-hit sectors like tourism and                                        Figure 5. Carded special mortgage rates
hospitality) and some will shut up shop. To keep costs                                  4.75%

low and respond to lower demand, many firms intend                                      4.50%
to reduce headcount (figure 4). Hours worked may                                        4.25%
reduce.
                                                                                        4.00%
Figure 4. ANZBO profit expectations and hiring                                          3.75%
intentions (including June flash)
                                                                                        3.50%
            60
                                                                                        3.25%
            40
                                                                                        3.00%

            20                                                                          2.75%

                                                                                        2.50%
Net Index

             0
                                                                                                0       1           2           3           4   5
                                                                                                                        Years
            -20                                                                                        March 2020                   June 2020

            -40                                                                         Source: interest.co.nz, ANZ Research

            -60        Percentage expecting increase minus
                                                                                        Recent declines in mortgage rates will cushion some of
                       percentage expecting decrease                                    the impacts of this crisis. The housing market will
            -80
                                                                                        experience less of a downturn than otherwise. For
                  09     10    11     12    13     14    15   16   17   18    19   20
                                                                                        some households, low mortgage rates will make home
                                  Employment                        Profits
                                                                                        buying and spending more attractive, and may be
Source: ANZ Research                                                                    particularly welcome for some first home buyers.
The unemployment rate is expected to peak at 10% in                                     Expectations of low interest rates for a prolonged
Q3 (compared to 4% before the crisis began). That’s                                     period will also boost demand for a range of assets.
where the rubber meets the road for many                                                Some people will take on a bit more risk in the pursuit
households. Income expectations will be weaker, job                                     of better returns, with some looking to move more of
security will take a hit even for those who remain                                      their money into real estate.
employed, and households and firms will be cautious                                     For many households, low mortgage rates will help to
in their spending, including when thinking about home                                   relieve pressure on financial positions by lowering
purchases.                                                                              debt-servicing costs. Fiscal policy is cushioning the
As the economy has exited lockdown, more economic                                       blow for these households too, through wage
activity has become possible, but that doesn’t mean it                                  subsidies, unemployment benefits, and the like.
will all necessarily happen. Lost income, weak demand                                   Those whose jobs have been lost or whose incomes
for our exports, primary sector challenges, and                                         have taken a hit will get a small reprieve via lower
persistent impacts on industries like tourism will all                                  interest rates, but it’s only a partial offset to a much
                                                                                        bigger income shock and some will still find
create an economic hole. Spending in the economy (as
measured by GDP) is not expected to return to                                           themselves in a position where they can no longer
pre-crisis levels until the end of 2022.                                                afford to service their debt.

                                                                                        For other households, low mortgage rates will present
Low mortgage rates will cushion the blow                                                an opportunity to shore up financial positions. Lower
With the economic recovery expected to be slow,                                         interest payments provide an attractive opportunity to
inflation and unemployment will take a long time to                                     pay down principal faster. This option is likely to
return to the RBNZ’s targets. This means the Official                                   appeal particularly to those who are unsure about
Cash Rate is expected to be held at its current low of                                  their income prospects or who are quite indebted.

ANZ New Zealand Property Focus | June 2020                                                                                                         4
Feature Article: Where the rubber meets the road

Weak incomes, uncertainty and reduced job security          Figure 6: Housing supply-demand balance
will weigh on the housing market, reducing purchasing                          16,000
                                                                                                                         Supply bump from       Lower
                                                                               14,000                                                           rates of
power and willingness to buy. Lower mortgage rates                                                                       short-term rentals
                                                                                                                                                building
                                                                               12,000
will provide an offset but only a partial one. There will

                                                            Number of houses
                                                                               10,000
also be more houses available relative to demand,                               8,000
adding further downward pressure on prices.                                     6,000
                                                                                4,000                                                           Weak
                                                                                2,000                                                           migration
The housing shortage is expected to erode                                             0
New Zealand currently has a housing shortage, which                             -2,000
                                                                                                                                Shortage
                                                                                -4,000
has been building steadily and contributing to house                                                                            eroding
                                                                                -6,000
price pressures in recent years. However, that picture                          -8,000
is now expected to change very quickly. Demand                                 -10,000
pressures are no longer building and we expect that                                       92 94 96 98 00 02 04 06 08 10 12 14 16 18 20 22

supply of housing is now outpacing demand.                                                Excess demand                Supply              Demand

Before the crisis began, we estimated that the housing      Source: Statistics NZ, ANZ Research
shortage could be 50k or more. It could be as high as
100k, depending on how many people would choose to          House prices to fall, more in some regions
live in smaller households if houses were cheaper. See      We have nudged up our house price forecasts on the
last month’s ANZ Property Focus for more details.           back of a slightly better economic outlook and lower
                                                            mortgage rates, but only slightly. We expect that
Looking forward, demand for houses is expected to
                                                            house prices will fall 12% (only a little above our
grow more slowly in coming years, due primarily to a
                                                            previous forecast of 13½%), but risks are now
slowdown in migration-led population growth.
                                                            considered more balanced.
Meanwhile, the supply of available houses is expected
to increase in the short term. A significant reduction in   House prices often fall in economic downturns,
tourism-related demand for accommodation will               especially in real terms (that is, adjusted for how
reduce the need for houses as short-term rentals.           much other prices have increased). This downturn is
Some of these may stand empty for a time, but we            expected to be no different, though we’d discount the
expect that some will move to the long-term rental          impact of the initial fall in GDP due to the lockdown, as
market or be sold.                                          this reflects imposed constraints on activity rather
                                                            than individual economic choices (figure 7).
Weakness in new building is expected to eventually
emerge after lockdown-induced volatility subsides and       Figure 7: Real house prices and GDP
the housing market softens. But new building is                                150                                                                  140

expected to be supported by the recent backlog of                              140
                                                                                                                                                    130
                                                                               130
consents for a time, even though some projects may                                                                                                  120
                                                                               120
be cancelled. Looking further out, we see a trough in
                                                                               110                                                                  110
the level of home building at 24% below pre-crisis
                                                                               100
                                                                                                                                                    100
levels next year, before recovering.
                                                                                                                                                          Index
                                                            Index

                                                                                90
                                                                                                                                                    90
                                                                                80
We have run some calculations and found that the
                                                                                70                                                                  80
shortage of housing could potentially fall by 35-40k
                                                                                60
between now and the end of 2022 (figure 6). This                                                                                                    70
                                                                                50
assumes weak net migration, slow new building, and a                            40
                                                                                                                                                    60
small decline in household size as house prices and                             30                                                                  50
rents fall – tempered by the fact that young people                                  92 94 96 98 00 02 04 06 08 10 12 14 16 18 20 22
tend to bear the brunt of unemployment increases and                                         Real house prices (LHS)               GDP (RHS)

are usually more willing/able to live in larger             Source: Statistics NZ, REINZ, ANZ Research
households if necessary. We have also made an
                                                            Both people’s willingness and ability to pay for houses
adjustment to our estimate of housing supply to
                                                            will be affected by the economic downturn. Firm
include an increase from short-term rentals coming
                                                            revenue and household income expectations will be
available.
                                                            lower, while unemployment and business failure rates
Of course, the outlook for each of these factors is very    are expected to increase. Some homeowners will
uncertain. Housing supply, demand, household size           experience job losses and financial distress.
and house prices are all related variables that depend      Uncertainty is huge, and households and firms are
on each other.                                              expected to be cautious, including when it comes to
                                                            taking on debt.

ANZ New Zealand Property Focus | June 2020                                                                                                                   5
Feature Article: Where the rubber meets the road

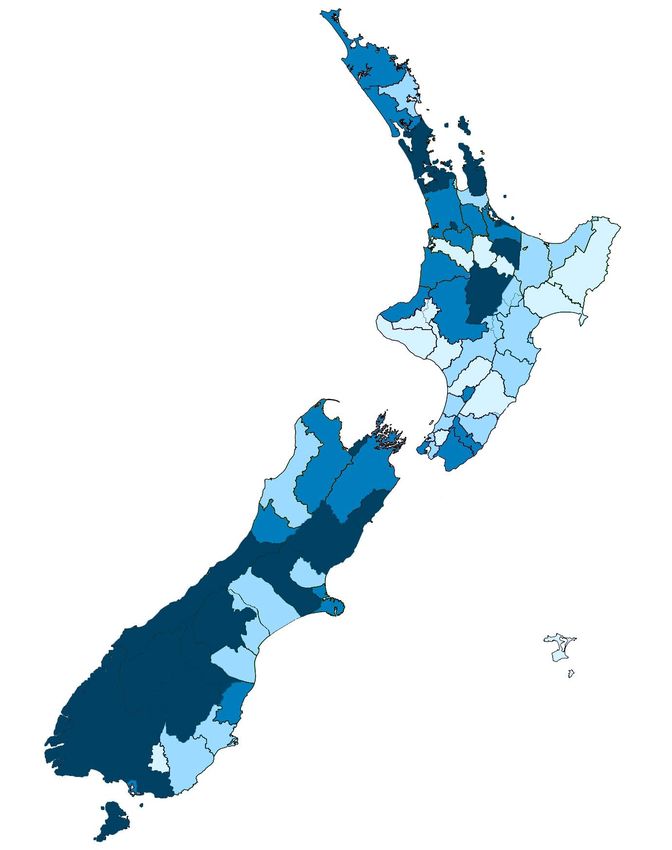
Adding to that, the shortage of housing is starting to                                                          Table 1. Vulnerability to house price falls by region
be eroded, and expectations of house price gains have                                                           Vulnerability is estimated based on per capita exposure to
already shifted (figure 8). Previously, expectations of                                                         tourism, migration and high rates of building (darker blue
continued strong population growth had contributed to                                                           indicates greater vulnerability)
strong rises in house prices, but the outlook has                                                                                                 Tourism          Migration          Building          Overall
                                                                                                                Ashburton District
changed a lot.
                                                                                                                                                 Dark blue         Lighter blue      Lighter blue      Light e r blue
                                                                                                                Auckland                         Dark blue         Navy              Navy              N avy
                                                                                                                Buller District
Figure 8: House price inflation: expectations and reality
                                                                                                                                                 Dark blue         Very light blue   Dark blue         Light e r blue
                                                                                                                Carterton District               Very light blue   Dark blue         Navy              D a rk blue
                  20                                                                     7                      Central Hawke's Bay District     Very light blue   Dark blue         Dark blue         Light e r blue
                                                                                                                Central Otago District           Dark blue         Dark blue         Navy              N avy
                  15                                                                     6                      Chatham Islands Territory        Dark blue         Very light blue   Very light blue   V e ry light blue
                                                                                                                Christchurch City                Dark blue         Navy              Dark blue         D a rk blue
                                                                                         5
                  10                                                                                            Clutha District
Annual % change

                                                                                              Annual % change
                                                                                                                                                 Lighter blue      Dark blue         Lighter blue      Light e r blue

                                                                                         4                      Dunedin City                     Dark blue         Dark blue         Lighter blue      Light e r blue
                   5                                                                                            Far North District               Dark blue         Dark blue         Lighter blue      D a rk blue
                                                                                         3                      Gisborne District                Lighter blue      Lighter blue      Very light blue   V e ry light blue
                   0                                                                                            Gore District                    Dark blue         Lighter blue      Very light blue   V e ry light blue
                                                                                         2                      Grey District                    Dark blue         Lighter blue      Lighter blue      D a rk blue

                   -5                                                                                           Hamilton City                    Dark blue         Navy              Navy              N avy
                                                                                         1
                                                                                                                Hastings District                Lighter blue      Dark blue         Dark blue         Light e r blue

                  -10                                                                                           Hauraki District                 Lighter blue      Dark blue         Dark blue         Light e r blue
                                                                                         0
                                                                                                                Horowhenua District              Very light blue   Lighter blue      Navy              Light e r blue

                  -15                                                                    -1                     Hurunui District                 Navy              Very light blue   Navy              N avy

                        08   09   10   11   12   13   14   15   16   17   18   19   20                          Invercargill City                Lighter blue      Navy              Lighter blue      D a rk blue
                                                                                                                Kaikoura District                Navy              Dark blue         Navy              N avy
                                   House price inflation (LHS)
                                                                                                                Kaipara District                 Dark blue         Lighter blue      Navy              D a rk blue
                                   Consumer house price expectations (RHS)
                                                                                                                Kapiti Coast District            Lighter blue      Dark blue         Lighter blue      Light e r blue

Source: REINZ, Roy Morgan, ANZ Research                                                                         Kawerau District                 Very light blue   Navy              Very light blue   Light e r blue
                                                                                                                Lower Hutt City                  Very light blue   Dark blue         Dark blue         Light e r blue

Risks of a sharper correction in house prices have                                                              Mackenzie District               Navy              Very light blue   Navy              N avy
                                                                                                                Manawatu District                Very light blue   Very light blue   Dark blue         V e ry light blue
dissipated a little, partly due to policy responses from                                                        Marlborough District             Dark blue         Lighter blue      Dark blue         D a rk blue

the RBNZ to ensure that money is flowing effectively in                                                         Masterton District               Lighter blue      Lighter blue      Dark blue         Light e r blue
                                                                                                                Matamata-Piako District
the financial system. Banks are expected to be a little
                                                                                                                                                 Lighter blue      Navy              Navy              D a rk blue
                                                                                                                Napier City                      Dark blue         Dark blue         Lighter blue      Light e r blue
cautious about the outlook, but a widespread credit                                                             Nelson City                      Dark blue         Navy              Dark blue         N avy
                                                                                                                New Plymouth District
crunch now appears less likely.                                                                                                                  Lighter blue      Dark blue         Dark blue         D a rk blue
                                                                                                                Opotiki District                 Lighter blue      Dark blue         Lighter blue      Light e r blue
                                                                                                                Otorohanga District
Job losses, increased supply of short-term rental
                                                                                                                                                 Very light blue   Lighter blue      Very light blue   V e ry light blue
                                                                                                                Palmerston North City            Lighter blue      Navy              Dark blue         D a rk blue
properties, and uncertainty will weigh most heavily on                                                          Porirua City                     Very light blue   Lighter blue      Dark blue         Light e r blue

house prices in regions exposed to tourism (table 1                                                             Queenstown-Lakes District        Navy              Navy              Navy              N avy
                                                                                                                Rangitikei District              Lighter blue      Lighter blue      Lighter blue      Light e r blue
and heatmap). This will contribute to more downward                                                             Rotorua District                 Navy              Navy              Very light blue   N avy

pressure on housing markets in those regions, which                                                             Ruapehu District                 Navy              Very light blue   Lighter blue      D a rk blue
                                                                                                                Selwyn District
will weigh on spending in places where the economic
                                                                                                                                                 Very light blue   Dark blue         Navy              N avy
                                                                                                                South Taranaki District          Very light blue   Dark blue         Very light blue   V e ry light blue
outlook is already weak. In those places, it will be                                                            South Waikato District           Lighter blue      Very light blue   Very light blue   V e ry light blue
                                                                                                                South Wairarapa District
difficult to fill a tourism-shaped economic hole. The                                                                                            Dark blue         Lighter blue      Dark blue         D a rk blue
                                                                                                                Southland District               Navy              Dark blue         Dark blue         N avy
recovery will be slower, and the recession will be felt                                                         Stratford District               Very light blue   Lighter blue      Lighter blue      V e ry light blue

more acutely.                                                                                                   Tararua District                 Very light blue   Very light blue   Very light blue   V e ry light blue
                                                                                                                Tasman District                  Dark blue         Lighter blue      Navy              D a rk blue
                                                                                                                Taupo District                   Navy              Lighter blue      Navy              N avy
                                                                                                                Tauranga City                    Dark blue         Navy              Navy              N avy
                                                                                                                Thames-Coromandel District       Navy              Dark blue         Navy              N avy
                                                                                                                Timaru District                  Lighter blue      Lighter blue      Lighter blue      Light e r blue
                                                                                                                Upper Hutt City                  Very light blue   Lighter blue      Lighter blue      V e ry light blue
                                                                                                                Waikato District                 Very light blue   Lighter blue      Navy              D a rk blue
                                                                                                                Waimakariri District             Very light blue   Lighter blue      Navy              Light e r blue
                                                                                                                Waimate District                 Very light blue   Dark blue         Lighter blue      Light e r blue
                                                                                                                Waipa District                   Lighter blue      Lighter blue      Navy              D a rk blue
                                                                                                                Wairoa District                  Very light blue   Very light blue   Very light blue   V e ry light blue
                                                                                                                Waitaki District                 Dark blue         Navy              Dark blue         D a rk blue
                                                                                                                Waitomo District                 Dark blue         Navy              Very light blue   D a rk blue
                                                                                                                Wellington City                  Dark blue         Lighter blue      Dark blue         D a rk blue
                                                                                                                Western Bay of Plenty District   Very light blue   Navy              Dark blue         D a rk blue
                                                                                                                Westland District                Navy              Very light blue   Lighter blue      N avy
                                                                                                                Whakatane District               Lighter blue      Dark blue         Lighter blue      Light e r blue
                                                                                                                Whanganui District               Very light blue   Dark blue         Very light blue   V e ry light blue
                                                                                                                Whangarei District               Dark blue         Lighter blue      Dark blue         Light e r blue

                                                                                                                Source: MBIE, Statistics NZ, ANZ Research

ANZ New Zealand Property Focus | June 2020                                                                                                                                                                              6
Feature Article: Where the rubber meets the road

Heatmap: Vulnerability to house price falls by region

                                                        Key
                                                              Extremely vulnerable

                                                              Very vulnerable

                                                              Vulnerable

                                                              Less vulnerable

ANZ New Zealand Property Focus | June 2020                                           7
Property Market in Pictures

Figure 1. Regional house price inflation                                                                                                  House prices fell 0.3% m/m in May to be down 1.2%
                               35                                                                                                         since March. A post-lockdown buying flurry supported
                               30                                                                                                         sales in the month, due to pent-up demand from sales
Annual % change (3-mth avg)

                               25                                                                                                         not being able to take place in lockdown. This
                               20                                                                                                         occurred when inventories of houses in the market
                               15                                                                                                         were still low, making the market relatively tight.
                               10                                                                                                         Lower mortgage rates also provided support. All of
                                   5
                                                                                                                                          these factors stemmed the decline in prices in the
                                                                                                                                          month, with more weakness expected to become
                                   0
                                                                                                                                          evident in time.
                               -5

                              -10                                                                                                         Since March, house price falls have been largest in
                              -15                                                                                                         Otago (-3.3%), Manawatu-Wanganui (-2.0%) and
                                       93   95   97   99   01   03   05   07    09   11     13   15   17   19                             Auckland (-1.7%). However, some volatility is
                                       New Zealand         Auckland            Wellington         Canterbury                              expected. See the feature article for more on regions
Source: ANZ Research, REINZ                                                                                                               most vulnerable to house price falls.

Figure 2. REINZ house prices and sales                                                                                                    Sales volumes and prices tend to be closely
                               8                                                                           40                             correlated, although at times tight dwelling supply can
                               7                                                                                                          complicate the relationship.
                                                                                                           30
                                                                                                                                          House sales increased 87% m/m in May, after falling
 Sales per '000 dwellings

                               6
                                                                                                                       3-mth annualised

                               5
                                                                                                           20                             75% in April on account of lockdown. After this
                                                                                                                                          bounce, sales are now 53% lower than in March. Part
                               4                                                                           10
                                                                                                                                          of this weakness is due to a low volume of houses
                               3                                                                                                          being on the market when lockdown ended. Inventory
                                                                                                           0
                                                                                                                                          has since lifted. That means sales may lift further too,
                               2
                                                                                                           -10
                                                                                                                                          but overall the market now has more slack, which will
                               1                                                                                                          weigh on prices going forward. Sales are expected to
                               0                                                                           -20                            settle at a weaker level than before the crisis, but
                                   91 93 95 97 99 01 03 05 07 09 11 13 15 17 19                                                           there may be a little more volatility before the dust
                                             House sales (LHS)                    REINZ HPI (RHS)                                         settles. Compared to March, sales are down the most
Source: ANZ Research, REINZ                                                                                                               in Auckland (-53%), Northland (-49%) and Tasman,
                                                                                                                                          Nelson, Marlborough (-48%).

Figure 3. Sales and median days to sell                                                                                                   How long it takes to sell a house is also an indicator of
                              12                                                                           20                             the strength of the market, encompassing both
                              11                                                                           25                             demand and supply-side considerations. Larger cities
                              10
                                                                                                           30                             tend to see houses sell more quickly, but deviations in
                               9                                                                                                          a region from its average provide an indicator of the
                                                                                                                Days (inverted, sa)

                                                                                                           35
                               8                                                                                                          heat in a market at any given time.
  '000 (sa)

                               7                                                                           40

                               6                                                                           45
                                                                                                                                          The number of days it takes to sell a house has
                               5                                                                                                          generally been very low recently. It rose from 36 to
                                                                                                           50
                               4                                                                                                          56 days in May, but that’s not surprising since the
                                                                                                           55                             majority of sales couldn’t take place in lockdown.
                               3
                               2                                                                           60                             Although days to sell lengthened as we exited
                               1                                                                           65                             lockdown, the market was actually pretty tight,
                                   93 95 97 99 01 03 05 07 09 11 13 15 17 19                                                              supporting prices. But with houses on the market
                                                  House sales (LHS)            Days to sell (RHS)                                         having increased, slack is now emerging. This will see
Source: ANZ Research, REINZ                                                                                                               prices under pressure in time, especially as underlying
                                                                                                                                          weakness in demand to becomes evident.

ANZ New Zealand Property Focus | June 2020                                                                                                                                                        8
Property Market in Pictures

Figure 4. REINZ and QV house prices                                                          There are three monthly measures of house prices in
                   30                                                                        New Zealand: the median and house price index
                   25                                                                        measures produced by REINZ, and the monthly
                   20
                                                                                             QVNZ house price index. The latter tends to lag the
                                                                                             other measures as it records sales later in the
Annual % change

                   15
                                                                                             transaction process. Moreover, movements do not
                   10
                                                                                             line up exactly, given differing methodologies (the
                    5                                                                        REINZ house price index and QVNZ measures
                    0                                                                        attempt to adjust for the quality of houses sold).
                   -5                                                                        The REINZ HPI – our preferred measure – softened
                  -10                                                                        to 7.9% y/y in April. The QVNZ measure (7.7% y/y)
                  -15
                                                                                             is the only measure yet to turn (reflecting lags
                        92 94 96 98 00 02 04 06 08 10 12 14 16 18 20                         between sale and settlement), but slowing will
                        QV HPI             REINZ HPI           REINZ median (3m avg)         happen. The REINZ median dipped from 15% to 12%
Source: ANZ Research, REINZ, QVNZ                                                            y/y, with previous strength due to composition.

Figure 5. Arrivals to New Zealand                                                            Migration flows to and from New Zealand are one of
                  35,000                                                                     the major drivers of housing market cycles. The
                  30,000                                                                     early-1970s, mid-1990s, mid-2000s and most recent
                                                                                             house price booms have coincided with large net
                  25,000
                                                                                             migration inflows.
Number

                  20,000
                                                                                             Arrivals to New Zealand have fallen to zero, reflecting
                  15,000                                                                     border closures and the grounding of most
                  10,000                                                                     international flights for the foreseeable future. The
                                                                                             dearth of tourists will weigh on the outlook for
                   5,000
                                                                                             tourism and GDP, and see some properties flood the
                        0                                                                    rental market, putting downward pressure on rents.
                            15-Apr
                            22-Apr
                            29-Apr
                             6-May
                             15-Jan

                              1-Apr
                              1-Jan
                              8-Jan

                              8-Apr
                             22-Jan
                             29-Jan
                              5-Feb

                              4-Mar

                            13-May
                            20-May
                            27-May
                            12-Feb
                            19-Feb
                            26-Feb

                            11-Mar
                            18-Mar
                            25-Mar

                              3-Jun
                            10-Jun
                            17-Jun
                            24-Jun

                                                                                             Meanwhile, low rates of migration will result in
                                                                                             significantly weaker housing demand. All of the
                                                2019           2020                          above will contribute to lower house prices.
Source: Statistics NZ

Figure 6. Residential building consents                                                      Residential building consents fell 6.5% in April,
                   4,000                                                                     following a 22% fall in March. Continued weakness in
                                                                                             April reflects the fact that consenting and building
                   3,500
                                                                                             activity both hit pause during lockdown. An initial
                   3,000                                                                     rebound is expected in the May data. However, some
Monthly number

                                                                                             of the projects that have recently been consented
                   2,500
                                                                                             may be cancelled, given that the economic landscape
                   2,000                                                                     and income prospects have changed dramatically
                                                                                             since the start of the year.
                   1,500
                                                                                             The previous backlog of consents will provide some
                   1,000
                                                                                             support for building activity as construction gets back
                    500
                                                                                             to work. But beyond that, softer demand is expected
                            96   98   00   02   04   06   08   10   12   14   16   18   20   to weigh on consents and building activity. This may
                                  Seasonally adjusted                    Trend               expose some profitability and construction challenges
Source: ANZ Research, Statistics NZ                                                          in the construction industry.

ANZ New Zealand Property Focus | June 2020                                                                                                         9
Property Market in Pictures

Figure 7. Construction cost inflation                                                                                      Construction cost inflation has softened since 2017,
                    25                                                                                                     and will likely soften further from here, with demand
                                                                                                                           weak. Growth in the cost of consented work per
                    20
                                                                                                                           square metre – a proxy – has been low recently,
                    15                                                                                                     down 1% y/y in April. The data is extremely volatile
Annual % change

                                                                                                                           (largely due to the different types of dwellings being
                    10
                                                                                                                           consented). However, the recent downward trend is
                     5                                                                                                     expected to continue for some time, especially given
                                                                                                                           the weak demand pulse that is expected to emerge.
                     0
                                                                                                                           As is usual in times of economic strain, we expect
                     -5
                                                                                                                           big-ticket items such as house builds to take a
                    -10                                                                                                    backseat. The economic downturn and weaker
                          00    02    04    06      08    10    12      14        16        18       20                    housing demand will apply downward pressure on
                               Consents per sq-m               Construction costs CPI                                      construction costs.
Source: ANZ Research, Statistics NZ

Figure 8. New mortgage lending and housing turnover                                                                        New residential mortgage lending figures are
                    5.5                                                                      7.0                           published by the RBNZ. These are gross (rather than
                    5.0                                                                      6.5                           net) flows and can provide leading information on
                    4.5                                                                      6.0                           household credit growth.
                                                                                             5.5
                    4.0                                                                                                    New mortgage lending fell 56% m/m in April. This
                                                                                                     $bn (3mth avg)

                                                                                             5.0
                    3.5                                                                                                    reflects the impact of house sales and settlements
$bn

                                                                                             4.5                           stalling under lockdown, partially offset by any new
                    3.0
                                                                                             4.0                           mortgage lending taken out by households to get
                    2.5
                                                                                             3.5                           through the crisis. A bounce is expected in May,
                    2.0                                                                      3.0                           supported by recent declines in mortgage rates, but
                    1.5                                                                      2.5                           weakness is then expected to emerge. Weak income
                    1.0                                                                      2.0
                                                                                                                           prospects, downbeat sentiment and caution towards
                          04    06    08    10       12    14      16        18        20                                  debt will weigh on households’ willingness and ability
                           Housing turnover (LHS)          New mortgage lending (RHS)                                      to purchase houses and new lending. We expect
Source: ANZ Research, RBNZ                                                                                                 banks will be prudent in their lending decisions too.

Figure 9. New mortgage lending and housing credit                                                                          Housing credit fell 0.1% in April. Softness in new
                    2.0                                                                          8                         lending is weighing, but an increase in saving may
                    1.8                                                                                                    have allowed people to pay off some principal in
                                                                                                 7
                    1.6                                                                                                    lockdown too. Consumer credit fell 8.3% in April,
                    1.4                                                                                                    after a 2.8% drop in March.
                                                                                                       $bn sa (3mth avg)

                                                                                                 6
$bn sa (3mth avg)

                    1.2
                                                                                                                           Some households and businesses have increased
                    1.0                                                                          5                         their reliance on debt to get through the current
                    0.8                                                                                                    difficult economic period, with lower interest rates
                                                                                                 4
                    0.6                                                                                                    easing debt-servicing costs a little. Meanwhile, others
                    0.4
                                                                                                 3
                                                                                                                           are hunkering down, consolidating their financial
                    0.2                                                                                                    positions and putting off purchases. Overall, we
                    0.0                                                                          2                         expect to see a trend towards weaker credit growth
                          06 07 08 09 10 11 12 13 14 15 16 17 18 19 20                                                     in time, due to weakness in housing turnover and
                      Increase in housing credit (LHS)         New mortgage lending (RHS)                                  household caution, although low interest rates will
Source: ANZ Research, REINZ, RBNZ                                                                                          continue to provide an offset.

ANZ New Zealand Property Focus | June 2020                                                                                                                                      10
Property Market in Pictures

Figure 10. Investor lending by LVR                                                                        Lending to investors continues to slide, down 53%
                      3,000                                                                               m/m in April, after a 11% slide in March and 5% fall in
                                                                                                          February (seasonally adjusted, ANZ estimate). This
                      2,500
                                                                                                          reflects the stall in sales and settlements. Lending to
$m new lending (sa)

                                                                                                          investors, first home buyers, and other owner-
                      2,000
                                                                                                          occupiers have fallen in tandem so far. However, the
                      1,500                                                                               current period, with low mortgage rates and house
                                                                                                          price falls expected, could present opportunities for
                      1,000                                                                               some owner-occupiers.

                           500                                                                            The share of riskier lending remains broadly stable
                                                                                                          although there was another tick up in interest only (for
                             0                                                                            all borrowers) in April. There is no sign of an increase
                                 15           16             17         18           19             20    in the share of high-LVR lending, despite the RBNZ
                                 80%+ LVR               70-80% LVR                 Sub 70% LVR            loosening LVR restrictions.
Source: ANZ Research, RBNZ

Figure 11. Regional house prices to income                                                                One commonly cited measure of housing affordability
                      10                                                                                  is the ratio of average house prices to incomes. It is a
                       9                                                                                  standard measure used internationally to compare
                                                                                                          housing affordability across countries. It isn’t perfect;
                       8
                                                                                                          it does not take into account things like average
                       7                                                                                  housing size and quality, interest rates, and financial
                                                                                                          liberalisation. Therefore, it is really only a partial gauge
Ratio

                       6
                                                                                                          as some of these factors mean that it is logical for this
                       5
                                                                                                          ratio to have risen over time.
                       4
                                                                                                          Nationally, the ratio has been stable at around 5.7
                       3                                                                                  times income since early 2017. Auckland has seen its
                       2                                                                                  ratio ease from 9 times in 2016 to an estimated 7.8
                           93     95   97   99     01   03    05   07   09    11    13    15   17    19   times in Q4 2019. Excluding Auckland, this is sitting at
                                 New Zealand                 NZ ex Auckland               Auckland        5.5 times incomes.
Source: ANZ Research, REINZ, Statistics NZ

Figure 12. Regional mortgage payments to income                                                           Another, arguably more comprehensive, measure of
                      60                                                                                  housing affordability is to look at it through the lens of
                      55                                                                                  debt serviceability, as this also takes into account
                      50                                                                                  interest rates, which are an important driver of
                      45                                                                                  housing market cycles.
                      40
 %                                                                                                        We estimate that for a purchaser of a median-priced
                      35
                                                                                                          home (20% deposit), the average mortgage payment
                      30                                                                                  to income nationally was 30% in Q4, having eased a
                      25                                                                                  little on the back of lower mortgage rates. In Auckland
                      20                                                                                  it was 42%. In the rest of New Zealand it was 29%.
                      15        Assumes a 25 year mortgage, with 20% deposit and the minimum              This may start to ease as interest rates fall further.
                                interest rate available
                      10
                           93     95   97    99    01   03    05   07   09    11    13    15   17    19

                                 New Zealand                 NZ ex Auckland               Auckland

Source: ANZ Research, REINZ, RBNZ, Statistics NZ

ANZ New Zealand Property Focus | June 2020                                                                                                                         11
Property gauges

The housing market will be affected by the enormous economic slump underway, especially with unemployment
rising, income prospects more shaky, and the outlook uncertain. Volatility will continue in coming months, but a
weaker housing demand impulse is expected to become evident. We expect house prices to fall 10-15% this year,
but have nudged up our central forecast from a fall of 13½% to a fall of 12% on the back of a better economic
outlook and lower mortgage rates. Risks are now considered more balanced. Regional markets exposed to tourism
will likely be hit hard, and expectations may shift abruptly.
We use ten gauges to assess the state of the property market and look for signs that changes are in the wind.
Affordability. For new entrants into the housing market, we measure affordability using the ratio of house
prices to income (adjusted for interest rates) and mortgage payments as a proportion of income.
Serviceability / indebtedness. For existing homeowners, serviceability relates interest payments to income,
while indebtedness is measured as the level of debt relative to income.
Interest rates. Interest rates affect both the affordability of new houses and the serviceability of debt.
Migration. A key source of demand for housing.
Supply-demand balance. We use dwelling consents issuance to proxy growth in supply. Demand is derived
via the natural growth rate in the population, net migration, and the average household size.
Consents and house sales. These are key gauges of activity in the property market.
Liquidity. We look at growth in private sector credit relative to GDP to assess the availability of credit in
supporting the property market.
Globalisation. We look at relative property price movements between New Zealand, the US, the UK, and
Australia, in recognition of the important role that global factors play in New Zealand’s property cycle.
Housing supply. We look at the supply of housing listed on the market, recorded as the number of months
needed to clear the housing stock. A high figure indicates that buyers have the upper hand.
House prices to rents. We look at median prices to rents as an indicator of relative affordability.
Policy changes. Government and macro-prudential policy can affect the property market landscape.
                                             Direction
Indicator                  Level                          Comment
                                             for prices
                                                          Affordability constraints are relevant. It’s hard to see people buying
Affordability           Unaffordable            ↓↓
                                                          super-expensive houses when the outlook is bleak.
Serviceability/                                           Serviceability is fine, but job security isn’t. Debt levels are high,
                      Jobs in jeopardy          ↓↓
indebtedness                                              incomes are expected to be lower, and uncertainty is rife.
Interest rates /                                          The OCR is set to remain at 0.25% for at least 12 months. Funding
                            Flat               ↔/↑
RBNZ                                                      costs will matter for mortgage rates too though.
                                                          Migration has been moderating. It will settle at a lower trend after
Migration                 Peaking              ↔/↓        dropping to zero with borders closed.
Supply-demand                                             The balance has shifted to more supply, with short-term rentals
                          Shifted                ↓
balance                                                   coming available and demand building less quickly.
Consents and                                              The market is under pressure, which may see transactions and new
                            Turn                ↓↓
house sales                                               projects dry up, with prices moving lower.
                                                          The outlook is uncertain. QE is providing a boost, but funding
Liquidity                  Relief               ↔
                                                          pressure and credit constraints are still possible.
                                                          The global slowdown will weigh on housing markets around the
Global forces              Weak                 ↓↓
                                                          world, with sentiment and incomes under pressure.
                                                          While the market has been playing catch up, a shift in the demand-
Housing supply            Unclear               ↔
                                                          supply balance could see less need than previously thought.
House prices to                                           Buying remains relatively expensive. Low interest rates are
rents
                          Too high             ↔/↓        suppressing yields, but incomes will be under pressure.
                                                          Policy changes have been a headwind. But the Government’s
Policy changes          Dampening              ↔/↑        COVID-19 response will help cushion the economic blow.
                                                          House prices are expected to be under significant downward
On balance                 Down                 ↓↓
                                                          pressure, eventually recovering when the economy does.

ANZ New Zealand Property Focus | June 2020                                                                                         12
Property gauges

 Figure 1: Housing affordability                                                                                                                Figure 2: Household debt to disposable income
                                         70                                                                      200                                                     16                                                                          180

                                                                                                                                                % of disposable income
                                         60                                                                                                                              14                                                                          160

                                                                                                                                                                                                                                                              % of disposable income
                                                                                                                       Index (1992Q1=100)
                                                                                                                 160
                                         50                                                                                                                              12                                                                          140

                                                                                                                 120                                                                                                                                 120
                                         40                                                                                                                              10
          %                                                                                                                                                                                                                                          100
                                         30                                                                      80                                                       8
                                                                                                                                                                                                                                                     80
                                         20                                                                                                                               6
                                                                                                                 40                                                                                                                                  60
                                         10                                                                                                                               4                                                                          40
                                          0                                                                      0                                                        2                                                                          20
                                              92 94 96 98 00 02 04 06 08 10 12 14 16 18
                                                                                                                                                                          0                                                                          0
                                              House price-to-income adjusted for interest rates (RHS)                                                                         92 94 96 98 00 02 04 06 08 10 12 14 16 18 20
                                              Proportion of average weekly household earnings required to                                                                                   Household debt to disposable income (RHS)
                                              service a 25 year mortgage based on 2-year fixed rate and 20%
                                              deposit on a median house (LHS)                                                                                                               Interest servicing as % of disposable income (LHS)

 Figure 3: New customer average residential mortgage                                                                                            Figure 4: Housing supply-demand balance
 rate (
Mortgage borrower strategy

This is not personal advice. The opinions and research      unlikely unless the OCR goes lower, which the RBNZ
contained in this document are provided for                 has said isn’t on the cards, at least until March 2021.
information only, are intended to be general in nature
and do not take into account your financial situation       With interest rates unlikely to rise for some time (likely
or goals.                                                   years rather than months), we favour shorter-term
                                                            fixed rates over longer terms. The 1-year remains
Summary                                                     attractive, but the average 2-year is now even lower,
Improving financial market conditions and increased         “baking in” a further mild decline in rates, which makes
competition in the mortgage market have seen home           it worthy of consideration too. This is demonstrated by
loan rates drop further over the past month, taking         our breakeven table1. Fixing for 2 years at 2.71%
fixed rates down another notch. For the first time in       would, for example, cost the same as fixing for 1 year
decades, mortgage rates (on average across the              at 2.77% and rolling for another year (in 1 year) at
“majors”) are below 3%. Competition is heating up in        2.62%. By selecting the 2-year fixed rate, you’ve
the floating rates space, but even so, it’s hard to go      baked that fall in the 1-year rate in.
past 1-2 year rates at the moment, which are generally
                                                            Figure 1. Carded special mortgage rates^
lower. We had been expecting rates to fall, and more
                                                            4.75%
falls are likely as the RBNZ presses ahead with
                                                            4.50%
quantitative easing (QE), but the pace of falls from
here is likely to be slower. We still favour the 1-year,    4.25%

but for the first time in a long time it might be worth     4.00%
considering the 2-year, which has a further decline in      3.75%
rates “baked in”. Longer rates are less attractive.
                                                            3.50%

Our view                                                    3.25%

Fixed mortgage rates continue to move lower, with falls     3.00%

in 1-2 year special rates now widespread as opposed to      2.75%
only at one or two banks, which has been sufficient to      2.50%
take average rates across the major banks comfortably                0         1           2
                                                                                               Years
                                                                                                       3             4         5

below 3% for the first time in decades. The move over                         Last Month                    This Month
the past month (Figure 1) has been the starkest we
                                                            Table 1. Special Mortgage Rates
have seen in some time, and adds to the move seen
last month (the drop in most fixed rates since March                                   Breakevens for 20%+ equity borrowers
has been around three-quarters of a percent).               Term          Current    in 6mths      in 1yr     in 18mths   in 2 yrs

These moves have been driven by QE, and have in turn        Floating      4.51%
gradually lowered wholesale swap interest rates, where      6 months      4.07%       1.47%       2.67%         2.61%     3.74%
banks hedge the risk on their mortgage books. QE has        1 year        2.77%       2.07%       2.64%         3.18%     3.95%
also been successful in driving down wholesale credit       2 years       2.71%       2.62%       3.30%         3.65%     4.09%
spreads, including bank funding spreads, making it          3 years       3.12%       3.12%       3.60%         3.76%     3.94%
cheaper for banks to fund. In a nutshell, it is now         4 years       3.40%       3.34%       3.61%
cheaper for banks to both fund and hedge their              5 years       3.45%            #Average of “big four” banks
mortgage exposures, and that has translated into lower
                                                            Table 2. Standard Mortgage Rates
rates for consumers.
                                                                                      Breakevens for standard mortgage rates*
Competition has also heated up in the floating rate
                                                            Term          Current    in 6mths      in 1yr     in 18mths   in 2 yrs
space, which has typically been more expensive for
borrowers and thus less popular, with many                  Floating      4.51%
homeowners using generally much lower 6-12 month            6 months      4.32%       2.70%       3.35%         3.45%     4.68%
fixed rates as proxies for floating. Should we see          1 year        3.51%       3.02%       3.40%         4.07%     4.93%
further intensification of competition in the floating      2 years       3.46%       3.55%       4.16%         4.48%     4.82%
space, it may become more attractive. However, for          3 years       3.95%       3.99%       4.34%         4.53%     4.71%
now, we are not aware of any bank offering a lower          4 years       4.14%       4.15%       4.39%
floating rate than its lowest fixed rate.                   5 years       4.21%            #Average of “big four” banks
For now, given the gap between average floating rates       ^ Average of carded rates from ANZ, ASB, BNZ and Westpac.
and shorter-term fixed rates, we believe there is           Source: interest.co.nz
limited benefit in remaining floating and waiting for
fixed rates to fall. They have already fallen a long way,   1
                                                              Breakevens are future rates implied by the term structure of
and while further significant falls could happen, that’s    current interest rates. They show where shorter-term fixed rates
                                                            need to be in future in order to justify choosing (typically higher)
                                                            longer-term fixed rates.

ANZ New Zealand Property Focus | June 2020                                                                                     14
Key forecasts

                                                Weekly mortgage repayments table (based on 25-year term)
                                                                                   Mortgage Rate (%)
                               2.50     2.75    3.00      3.25       3.50         3.75      4.00    4.25        4.50     4.75         5.00          5.25      5.50        5.75
                        200    103      106      109      112        115           119      122     125         128      131          135           138       142         145
                        250    155      160      164      169        173           178      183     187         192      197          202           207       212         218
                        300    207      213      219      225        231           237      243     250         256      263          270           276       283         290
                        350    259      266      273      281        289           296      304     312         320      329          337           345       354         363
                        400    310      319      328      337        346           356      365     375         385      394          404           415       425         435
Mortgage Size ($’000)

                        450    362      372      383      393        404           415      426     437         449      460          472           484       496         508
                        500    414      426      437      450        462           474      487     500         513      526          539           553       566         580
                        550    466      479      492      506        520           534      548     562         577      592          607           622       637         653
                        600    517      532      547      562        577           593      609     625         641      657          674           691       708         725
                        650    569      585      601      618        635           652      669     687         705      723          741           760       779         798
                        700    621      638      656      674        693           711      730     750         769      789          809           829       850         870
                        750    673      692      711      730        750           771      791     812         833      854          876           898       920         943
                        800    724      745      766      787        808           830      852     874         897      920          944           967       991         1,015
                        850    776      798      820      843        866           889      913     937         961      986          1,011        1,036     1,062        1,088
                        900    828      851      875      899        924           948      974     999        1,025    1,052         1,078        1,105     1,133        1,160
                        950    879      904      930      955        981       1,008       1,035    1,062      1,089    1,117         1,146        1,174     1,204        1,233
                        1000   931      958      984      1,011     1,039      1,067       1,095    1,124      1,154    1,183         1,213        1,244     1,274        1,306

                                               Housing market indicators for May 2020 (based on REINZ data)
                                                                    Median house prices                                                                       Avg days to
                                                                                                           No of sales (sa)          Mthly % chg
                                                             Ann % chg               3mth % chg                                                                sell (sa)

Northland                                                         13.8                     -0.8                  100                   +121%                         64
Auckland                                                           7.1                     2.3                   939                   +65%                          58
Waikato                                                            9.4                     -2.5                  330                   +163%                         54
Bay of Plenty                                                      4.5                     -4.2                  224                   +180%                         58
Gisborne                                                          -5.8                     -3.2                  31                    +291%                         58
Hawke’s Bay                                                       16.1                     10.6                  138                   +217%                         56
Manawatu-Whanganui                                                18.9                     -0.5                  228                   +327%                         46
Taranaki                                                          17.1                     0.1                   110                   +257%                         50
Wellington                                                         9.4                     2.7                   447                   +268%                         51
Tasman, Nelson and Marlborough                                    11.3                     0.6                   131                   +285%                         58
Canterbury                                                         3.5                     -0.4                  490                   +120%                         59
Otago                                                              5.4                    -12.3                  180                   +249%                         48
West Coast                                                         5.1                     -7.6                  23                    +105%                         45
Southland                                                         23.5                     2.1                   83                    +485%                         42
New Zealand                                                        7.0                     1.1                 2,877                   +87%                         56

                                                                                   Key forecasts
                                                            Actual                                                       Forecasts
Economic indicators                              Sep-19     Dec-19       Mar-20          Jun-20    Sep-20      Dec-20     Mar-21         Jun-21            Sep-21     Dec-21
GDP (Ann % Chg)                                   2.4        1.8            -0.2         -19.3      -7.1         -8.0         -4.6          18.9            3.5           5.1
CPI Inflation (Annual % Chg)                      1.5        1.9            2.5           1.6       1.0          0.4           0.1           0.7            0.9           0.8
Unemployment Rate (%)                             4.1        4.0            4.2           7.6       10.0         9.7           9.3           9.2            8.9           8.4
House Prices (Annual % Chg)                       2.5        5.3            8.2           5.6       0.0          -7.0         -11.8          -8.6           -3.6          2.0
Interest rates (RBNZ)                            Sep-19     Dec-19       Mar-20          Jun-20    Sep-20      Dec-20     Mar-21         Jun-21            Sep-21     Dec-21
Official Cash Rate                                1.00       1.00           0.25          0.25      0.25         0.25         0.25          0.25            0.25          0.25
90-Day Bank Bill Rate                             1.15       1.29           0.49          0.26      0.26         0.26         0.26          0.26            0.26          0.26
LSAP ($bn)                                                                  30            60        90            90           90             90            90            90
Source: ANZ Research, Statistics NZ, REINZ

ANZ New Zealand Property Focus | June 2020                                                                                                                                       15
Important notice

This document is intended for ANZ’s Institutional, Markets and Private Banking clients. It should not be forwarded, copied or
distributed. The information in this document is general in nature, and does not constitute personal financial product advice
or take into account your objectives, financial situation or needs.
This document may be restricted by law in certain jurisdictions. Persons who receive this document must inform themselves about and
observe all relevant restrictions.
Disclaimer for all jurisdictions: This document is prepared and distributed in your country/region by either: Australia and New Zealand
Banking Group Limited (ABN11 005 357 522) (ANZ); or its relevant subsidiary or branch (each, an Affiliate), as appropriate or as set out
below.
This document is distributed on the basis that it is only for the information of the specified recipient or permitted user of the relevant
website (recipients).
This document is solely for informational purposes and nothing contained within is intended to be an invitation, solicitation or offer by ANZ
to sell, or buy, receive or provide any product or service, or to participate in a particular trading strategy.
Distribution of this document to you is only as may be permissible by the laws of your jurisdiction, and is not directed to or intended for
distribution or use by recipients resident or located in jurisdictions where its use or distribution would be contrary to those laws or
regulations, or in jurisdictions where ANZ would be subject to additional licensing or registration requirements. Further, the products and
services mentioned in this document may not be available in all countries.
ANZ in no way provides any financial, legal, taxation or investment advice to you in connection with any product or service discussed in this
document. Before making any investment decision, recipients should seek independent financial, legal, tax and other relevant advice
having regard to their particular circumstances.
Whilst care has been taken in the preparation of this document and the information contained within is believed to be accurate, ANZ does
not represent or warrant the accuracy or completeness of the information Further, ANZ does not accept any responsibility to inform you of
any matter that subsequently comes to its notice, which may affect the accuracy of the information in this document.
Preparation of this document and the opinions expressed in it may involve material elements of subjective judgement and analysis. Unless
specifically stated otherwise: they are current on the date of this document and are subject to change without notice; and, all price
information is indicative only. Any opinions expressed in this document are subject to change at any time without notice.
ANZ does not guarantee the performance of any product mentioned in this document. All investments entail a risk and may result in both
profits and losses. Past performance is not necessarily an indicator of future performance. The products and services described in this
document may not be suitable for all investors, and transacting in these products or services may be considered risky.
ANZ expressly disclaims any responsibility and shall not be liable for any loss, damage, claim, liability, proceedings, cost or expense
(Liability) arising directly or indirectly and whether in tort (including negligence), contract, equity or otherwise out of or in connection with
this document to the extent permissible under relevant law. Please note, the contents of this document have not been reviewed by any
regulatory body or authority in any jurisdiction.
ANZ and its Affiliates may have an interest in the subject matter of this document. They may receive fees from customers for dealing in the
products or services described in this document, and their staff and introducers of business may share in such fees or remuneration that
may be influenced by total sales, at all times received and/or apportioned in accordance with local regulatory requirements. Further, they
or their customers may have or have had interests or long or short positions in the products or services described in this document, and
may at any time make purchases and/or sales in them as principal or agent, as well as act (or have acted) as a market maker in such
products. This document is published in accordance with ANZ’s policies on conflicts of interest and ANZ maintains appropriate information
barriers to control the flow of information between businesses within it and its Affiliates.
Your ANZ point of contact can assist with any questions about this document including for further information on these disclosures of
interest.

Country/region specific information: Unless stated otherwise, this document is distributed by Australia and New Zealand Banking
Group Limited (ANZ).
Australia. ANZ holds an Australian Financial Services licence no. 234527. For a copy of ANZ's Financial Services Guide please click
here or request from your ANZ point of contact.
Brazil, Brunei, India, Japan, Kuwait, Malaysia, Switzerland, Taiwan. This document is distributed in each of these jurisdictions
by ANZ on a cross-border basis.
European Economic Area (EEA): United Kingdom. ANZ is authorised in the United Kingdom by the Prudential Regulation
Authority (PRA) and is subject to regulation by the Financial Conduct Authority (FCA) and limited regulation by the PRA. Details
about the extent of our regulation by the PRA are available from us on request. This document is distributed in the United Kingdom by
Australia and New Zealand Banking Group Limited ANZ solely for the information of persons who would come within the FCA definition
of “eligible counterparty” or “professional client”. It is not intended for and must not be distributed to any person who would come
within the FCA definition of “retail client”. Nothing here excludes or restricts any duty or liability to a customer which ANZ may have
under the UK Financial Services and Markets Act 2000 or under the regulatory system as defined in the Rules of the Prudential
Regulation Authority (PRA) and the FCA. ANZ is authorised in the United Kingdom by the PRA and is subject to regulation by the FCA
and limited regulation by the PRA. Details about the extent of our regulation by the PRA are available from us on request.
Fiji. For Fiji regulatory purposes, this document and any views and recommendations are not to be deemed as investment advice. Fiji
investors must seek licensed professional advice should they wish to make any investment in relation to this document.
Hong Kong. This publication is issued or distributed in Hong Kong by the Hong Kong branch of ANZ, which is registered at the Hong
Kong Monetary Authority to conduct Type 1 (dealing in securities), Type 4 (advising on securities) and Type 6 (advising on corporate
finance) regulated activities. The contents of this publication have not been reviewed by any regulatory authority in Hong Kong.
India. If this document is received in India, only you (the specified recipient) may print it provided that before doing so, you specify
on it your name and place of printing.
Myanmar. This publication is intended to be general and part of ANZ’s customer service and marketing activities when implementing
its functions as a licensed bank. This publication is not Securities Investment Advice (as that term is defined in the Myanmar
Securities Transaction Law 2013).
New Zealand. This document is intended to be of a general nature, does not take into account your financial situation or goals, and
is not a personalised adviser service under the Financial Advisers Act 2008 (FAA).

ANZ New Zealand Property Focus | June 2020                                                                                                      16
Important notice

Oman. ANZ neither has a registered business presence nor a representative office in Oman and does not undertake banking business
or provide financial services in Oman. Consequently ANZ is not regulated by either the Central Bank of Oman or Oman’s Capital
Market Authority. The information contained in this document is for discussion purposes only and neither constitutes an offer of
securities in Oman as contemplated by the Commercial Companies Law of Oman (Royal Decree 4/74) or the Capital Market Law of
Oman (Royal Decree 80/98), nor does it constitute an offer to sell, or the solicitation of any offer to buy non-Omani securities in
Oman as contemplated by Article 139 of the Executive Regulations to the Capital Market Law (issued vide CMA Decision 1/2009). ANZ
does not solicit business in Oman and the only circumstances in which ANZ sends information or material describing financial products
or financial services to recipients in Oman, is where such information or material has been requested from ANZ and the recipient
understands, acknowledges and agrees that this document has not been approved by the CBO, the CMA or any other regulatory body
or authority in Oman. ANZ does not market, offer, sell or distribute any financial or investment products or services in Oman and no
subscription to any securities, products or financial services may or will be consummated within Oman. Nothing contained in this
document is intended to constitute Omani investment, legal, tax, accounting or other professional advice.
People’s Republic of China (PRC). This document may be distributed by either ANZ or Australia and New Zealand Bank (China)
Company Limited (ANZ China). Recipients must comply with all applicable laws and regulations of PRC, including any prohibitions on
speculative transactions and CNY/CNH arbitrage trading. If this document is distributed by ANZ or an Affiliate (other than ANZ China),
the following statement and the text below is applicable: No action has been taken by ANZ or any affiliate which would permit a public
offering of any products or services of such an entity or distribution or re-distribution of this document in the PRC. Accordingly, the
products and services of such entities are not being offered or sold within the PRC by means of this document or any other document.
This document may not be distributed, re-distributed or published in the PRC, except under circumstances that will result in
compliance with any applicable laws and regulations. If and when the material accompanying this document relates to the products
and/or services of ANZ China, the following statement and the text below is applicable: This document is distributed by ANZ China in
the Mainland of the PRC.
Qatar. This document has not been, and will not be:
• lodged or registered with, or reviewed or approved by, the Qatar Central Bank (QCB), the Qatar Financial Centre (QFC) Authority,
  QFC Regulatory Authority or any other authority in the State of Qatar (Qatar); or
• authorised or licensed for distribution in Qatar,
and the information contained in this document does not, and is not intended to, constitute a public offer or other invitation in respect
of securities in Qatar or the QFC. The financial products or services described in this document have not been, and will not be:
• registered with the QCB, QFC Authority, QFC Regulatory Authority or any other governmental authority in Qatar; or
• authorised or licensed for offering, marketing, issue or sale, directly or indirectly, in Qatar.
Accordingly, the financial products or services described in this document are not being, and will not be, offered, issued or sold in
Qatar, and this document is not being, and will not be, distributed in Qatar. The offering, marketing, issue and sale of the financial
products or services described in this document and distribution of this document is being made in, and is subject to the laws,
regulations and rules of, jurisdictions outside of Qatar and the QFC. Recipients of this document must abide by this restriction and not
distribute this document in breach of this restriction. This document is being sent/issued to a limited number of institutional and/or
sophisticated investors (i) upon their request and confirmation that they understand the statements above; and (ii) on the condition
that it will not be provided to any person other than the original recipient, and is not for general circulation and may not be
reproduced or used for any other purpose.
Singapore. This document is distributed in Singapore by the Singapore branch of ANZ solely for the information of “accredited
investors”, “expert investors” or (as the case may be) “institutional investors” (each term as defined in the Securities and Futures Act
Cap. 289 of Singapore). ANZ is licensed in Singapore under the Banking Act Cap. 19 of Singapore and is exempted from holding a
financial adviser’s licence under Section 23(1)(a) of the Financial Advisers Act Cap. 100 of Singapore.
United Arab Emirates (UAE). This document is distributed in the UAE or the Dubai International Financial Centre (DIFC) (as
applicable) by ANZ. This document does not, and is not intended to constitute: (a) an offer of securities anywhere in the UAE; (b) the
carrying on or engagement in banking, financial and/or investment consultation business in the UAE under the rules and regulations
made by the Central Bank of the UAE, the Emirates Securities and Commodities Authority or the UAE Ministry of Economy; (c) an
offer of securities within the meaning of the Dubai International Financial Centre Markets Law (DIFCML) No. 12 of 2004; and (d) a
financial promotion, as defined under the DIFCML No. 1 of 200. ANZ DIFC Branch is regulated by the Dubai Financial Services
Authority (DFSA) ANZ DIFC Branch is regulated by the Dubai Financial Services Authority (DFSA). The financial products or services
described in this document are only available to persons who qualify as “Professional Clients” or “Market Counterparty” in accordance
with the provisions of the DFSA rules. In addition, ANZ has a representative office (ANZ Representative Office) in Abu Dhabi
regulated by the Central Bank of the UAE. The ANZ Representative Office is not permitted by the Central Bank of the UAE to provide
any banking services to clients in the UAE.
United States. Except where this is a FX- related document, this document is distributed in the United States by ANZ Securities, Inc.
(ANZ SI) which is a member of the Financial Regulatory Authority (FINRA) (www.finra.org) and registered with the SEC. ANZSI’s
address is 277 Park Avenue, 31st Floor, New York, NY 10172, USA (Tel: +1 212 801 9160 Fax: +1 212 801 9163). ANZSI accepts
responsibility for its content. Information on any securities referred to in this document may be obtained from ANZSI upon request.
This document or material is intended for institutional use only – not retail. If you are an institutional customer wishing to effect
transactions in any securities referred to in this document you must contact ANZSI, not its affiliates. ANZSI is authorised as a broker-
dealer only for institutional customers, not for US Persons (as “US person” is defined in Regulation S under the US Securities Act of
1933, as amended) who are individuals. If you have registered to use this website or have otherwise received this document and are
a US Person who is an individual: to avoid loss, you should cease to use this website by unsubscribing or should notify the sender and
you should not act on the contents of this document in any way. Non-U.S. analysts: Non-U.S. analysts may not be associated persons
of ANZSI and therefore may not be subject to FINRA Rule 2242 restrictions on communications with the subject company, public
appearances and trading securities held by the analysts. Where this is an FX-related document, it is distributed in the United States
by ANZ's New York Branch, which is also located at 277 Park Avenue, 31st Floor, New York, NY 10172, USA (Tel: +1 212 801 916 0
Fax: +1 212 801 9163).
Vietnam. This document is distributed in Vietnam by ANZ or ANZ Bank (Vietnam) Limited, a subsidiary of ANZ.

This document has been prepared by ANZ Bank New Zealand Limited, Level 26, 23-29 Albert Street, Auckland 1010, New Zealand,
Ph 64 9 357 4094, e-mail nzeconomics@anz.com, http://www.anz.co.nz

ANZ New Zealand Property Focus | June 2020                                                                                             17
You can also read