Epidemiology of Sepsis in Australian Public Hospitals
←
→
Page content transcription
If your browser does not render page correctly, please read the page content below

TRIM: D20-3828

February 2020

Epidemiology of Sepsis in
Australian Public Hospitals:
A Mixed Methods, National Longitudinal Study
(2013-2018)

Ling Li, Neroli Sunderland, Kasun Rathnayake and Johanna I Westbrook from the Centre for
Health Systems and Safety Research, Australian Institute of Health Innovation, Faculty of
Medicine and Health Sciences, Macquarie University, Sydney, Australia, have prepared this
report on behalf of the Australian Commission on Safety and Quality in Health Care.
Published by the Australian Commission on Safety and Quality in Health Care
Level 5, 255 Elizabeth Street, Sydney NSW 2000

Phone: (02) 9126 3600
Fax: (02) 9126 3613

Email: accreditationACSQHC@safetyandquality.gov.au
Website: www.safetyandquality.gov.au

ISBN: 978-1-925948-68-4

© Australian Commission on Safety and Quality in Health Care 2020

All material and work produced by the Australian Commission on Safety and Quality in
Health Care (the Commission) is protected by copyright. The Commission reserves the right
to set out the terms and conditions for the use of such material.

As far as practicable, material for which the copyright is owned by a third party will be clearly
labelled. The Commission has made all reasonable efforts to ensure that this material has
been reproduced in this publication with the full consent of the copyright owners.

With the exception of any material protected by a trademark, any content provided by third
parties and where otherwise noted, all material presented in this publication is licensed
under a Creative Commons Attribution–NonCommercial–NoDerivatives 4.0 International
licence.

Enquiries about the licence and any use of this publication are welcome and can be sent to
communications@safetyandquality.gov.au.

The Commission’s preference is that you attribute this publication (and any material sourced
from it) using the following citation:

       Li L, Sunderland N, Rathnayake K, Westbrook JI. Epidemiology of Sepsis in
       Australian Public Hospitals. Sydney: ACSQHC; 2020

Disclaimer

The content of this document is published in good faith by the Commission for information
purposes. The document is not intended to provide guidance on particular healthcare
choices. You should contact your health care provider for information or advice on particular
healthcare choices.

This document includes the views or recommendations of its authors and third parties.
Publication of this document by the Commission does not necessarily reflect the views of the
Commission, or indicate a commitment to a particular course of action. The Commission
does not accept any legal liability for any injury, loss or damage incurred by the use of, or
reliance on, this document.

Epidemiology of Sepsis – Preface & Report – February 2020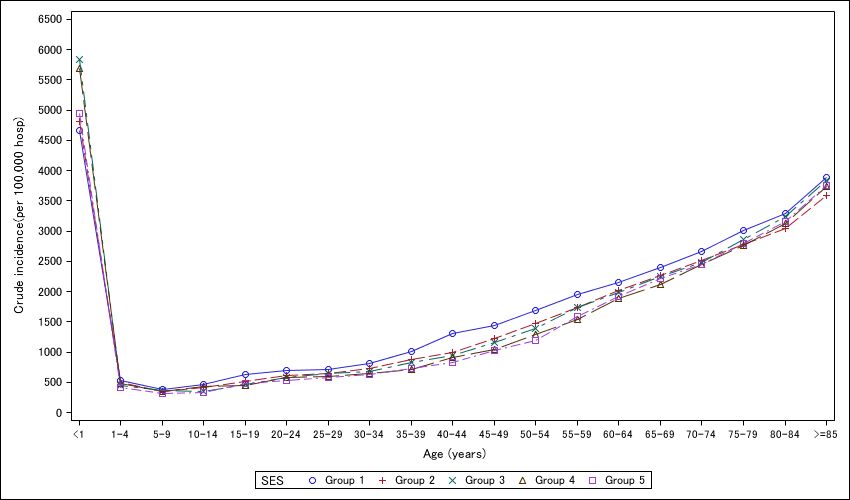
Preface
The Australian Commission on Safety and Quality in Health Care (the Commission) has
commenced a program of work to improve early recognition, treatment and outcomes for
patients with sepsis in Australia.
In consultation with internal and external stakeholders, the Commission has identified a
series of actions that will be implemented over 2020-22.
The program of work to improve outcomes in patients with sepsis in Australia includes:
Epidemiological analysis of national inpatient sepsis data to ascertain veracity (this
report)
Conducting a retrospective medical chart audit of records belonging to patients with
sepsis. The findings from the audit could inform the development of sepsis coding
Developing materials relevant to Standard 3 and Standard 8 of the National Safety
and Quality Health Service (NSQHS) Standards (2nd edition) to ensure health
service organisations are required to demonstrate the use of evidence based practice
in the early detection, treatment and monitoring of sepsis
Revising the Antimicrobial Stewardship Clinical Care Standard to strengthen Quality
Statement 1 with regard to the role that prompt treatment with intravenous antibiotics
has in preventing sepsis in patients who have a suspected severe infection
Developing national clinical guidance materials to support improvements in the
delivery of sepsis care
Partnering with the Australian Government, states and territories and the George
Institute for Global Health to lead a multi-modal public awareness campaign
Scoping the need to establish a coordinated approach to improving services to
address the high rates of disease recurrence and associated morbidity and disability.
Aims and methodology
This report was commissioned as a first step, in the Commission’s work to develop a
national approach to improving outcomes for patients with sepsis across Australia.
The aims of this report were to:
1. Determine the incidence and mortality of sepsis in public hospitals
2. Investigate variations in incidence and mortality related to patient and hospital stay
characteristics.
3. Investigate sepsis-related practice and initiatives across states/territories
A mixed methods approach was used to complete the study including;
a) Epidemiological analysis of national inpatient data from all Australian public hospitals
b) Semi-structured interviews with clinicians, patient safety professionals and sepsis
researchers from states and territories
Overview of findings
The report’s main findings were:
An observed 27% increase in the age standardised sepsis incidence between 2013-
14 and 2017-18. The timeframe of this reported increase in sepsis incidence
correlates with ICD-10-AM coding changes of inpatient data.
Epidemiology of Sepsis – Preface & Report – February 2020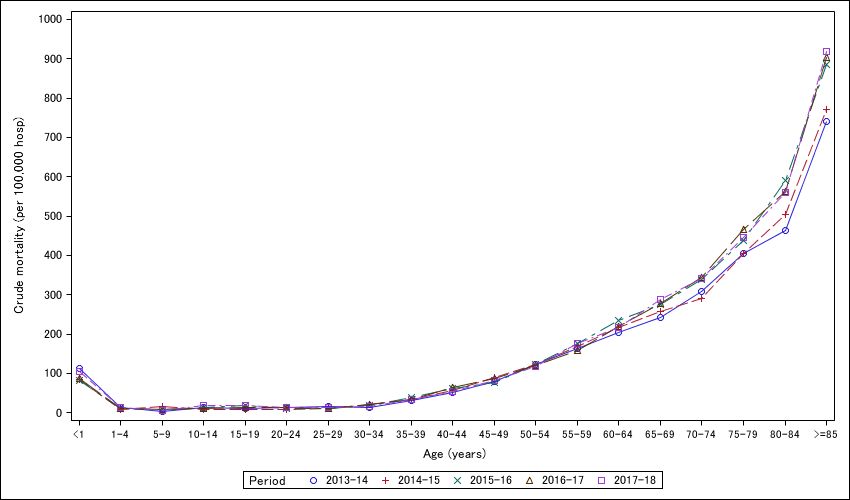
Despite the apparent increase in sepsis incidence, sepsis mortality rates remained
relatively stable.
During the period 2013-14 to 2017-18, there have been multiple prominent sepsis
awareness campaigns. These have contributed to improved recognition, treatment
and documentation of sepsis.
The increase in reported incidence and stable mortality rates reflect under reporting
of sepsis incidence prior to, changes in coding rules and awareness campaigns
Coding changes and potential impacts
Clinical coders use both lists of ICD-10-AM diagnosis codes and ‘rules’ for coding contained
in an accompanying manual ‘The Australian Coding Standard’ (ACS) coding of sepsis in
administrative data sets using ICD-10-AM and the information in patients’ clinical records is
complex and challenging. Changing definitions, diagnostic criteria, treatment pathways 1 and
coding rules for sepsis all contribute to the complexity.
There was extensive revision of the Australian Coding Standard (ACS 0110) Sepsis, severe
sepsis and septic shock for ICD-10-AM 9th Edition, which covered the period 01/07/2015 to
30/06/2017, that is, the time period when an increase in the rate of inpatient sepsis was
observed in this study. The changes are complex and include the points below which have
been provided as preliminary advice to the Commission from several clinical and coding
experts (further detail can be provided on request):
Clinical definitions of SIRS (Systemic inflammatory response syndrome), severe
sepsis and septic shock were updated to reflect international expert consensus.
In ICD-10 AM 9th edition, clinical coders did not have to verify the occurrence of
sepsis with a clinician in contrast to ICD-10-AM 8th edition where they did have to
do so. This may have led to potential decrease in ‘down-coding’ i.e. documented
sepsis coded to a localised infection upon clinician review.
There was also national coding advice for sepsis, which noted that sepsis must be
documented to assign a sepsis code. This is irrespective of positive or negative blood
cultures. Clinical coders cannot assign a code for sepsis based on a positive blood
culture without documentation of sepsis.
The increased recognition of sepsis due to sepsis clinical pathways may lead to
increased coding of A41.9 Sepsis, unspecified that may not have been present in the
clinical notes before. Small annual increases in non-specific sepsis codes are likely
heavily related to increased uptake of sepsis pathways nationally.
The following sentence was removed in the 9th edition ‘Where there is
documentation of sepsis, assign a code for the localised and/or generalised
infection….if after seeking clarification from the clinician, it is confirmed that sepsis is
being used to mean localised infection, refer to the index entry infection rather than
Sepsis’. This reflects clinical advice which indicates that the diagnosis of sepsis is
typically a clinical diagnosis based on the early signs of a syndrome, it is a systemic
response which cannot be adequately captured by coding a localised infection alone.
The ACS did not provide specific sequencing guidelines as to which condition should
be sequenced first when both sepsis and an associated localised infection were
present. The sequencing note means that if a patient is admitted with a localised
infection and sepsis, the condition that was chiefly responsible for occasioning the
episode of care is to be assigned as the principal diagnosis.
1Clinical pathways are standardised, evidence-based multidisciplinary management plans, which identify an appropriate
sequence of clinical interventions, timeframes, milestones and expected outcomes for a homogenous patient group.
Epidemiology of Sepsis – Preface & Report – February 2020 In the opinion of an infectious disease expert who reviewed the changes in the ACS
from 8th to 9th edition: “sepsis identified as part of a sepsis pathway may be coded as
sepsis despite not clinically eventuating in either an infection nor a sepsis clinical
diagnosis due to the insensitivity of the pathway identification process - this may not
have occurred in ICD 10-AM 8th edition’. Resulting in an increase of reported sepsis
cases with the implementation of 9th edition.
Conclusion and next steps for the Commission
Using hospital administrative data, this epidemiological study shows an increase in the rate
of sepsis for the period 2013-14 to 2017-18. Initial exploration with advice from clinical and
coding experts suggests that the increase could be explained by a combination of the
changes in the Australian Coding Standards used by clinical coders, local level
interpretations of the coding standards relevant to sepsis and prominent sepsis awareness
campaigns. Encouragingly the study has shown mortality rates of patients with sepsis have
been stable.
To obtain a clearer understanding of the key contributing factors of the observed reported
increase in rates of sepsis but stable mortality rates, the Commissions will:
Undertake a medical record audit of sepsis cases and further consultation with
clinical experts
In light of this report, consider if further investigation of available data will provide
additional insights
Epidemiology of Sepsis – Preface & Report – February 2020Epidemiology of Sepsis in Australian Public Hospitals: A Mixed Methods, National Longitudinal Study (2013-2018)
Research team:
Ling Li, Neroli Sunderland, Kasun Rathnayake, Johanna I Westbrook
Centre for Health Systems and Safety Research,
Australian Institute of Health Innovation,
Faculty of Medicine and Health Sciences, Macquarie University, Sydney,
Australia

The Australian Institute of Health Information was engaged by the
Australian Commission on Safety and Quality in Health Care to
undertake this project.

Epidemiology of Sepsis – Preface & Report – February 2020            2
Contents
Acknowledgements................................................................................................................................. 5

Executive summary ................................................................................................................................. 6
1      Introduction .................................................................................................................................... 8
2      Aims and scope of this report ......................................................................................................... 8
3      Sepsis hospitalisations .................................................................................................................. 10
4      Sepsis incidence ............................................................................................................................ 13
    4.1        Age and sex ........................................................................................................................... 13
    4.2        Change over time .................................................................................................................. 14
    4.3        Sepsis recorded as the principal or an additional diagnosis ................................................. 17
    4.4        Sepsis with organ dysfunction .............................................................................................. 19
    4.5        Septic shock .......................................................................................................................... 21
    4.6        Population groups ................................................................................................................. 23
    4.7        Clinical characteristics ........................................................................................................... 26
    4.8        Hospital characteristics ......................................................................................................... 30
5      Sepsis patient outcomes ............................................................................................................... 33
    5.1        Overall sepsis mortality rates................................................................................................ 33
    5.2        Changes in mortality over time ............................................................................................. 34
    5.3        Length of stay (LOS) .............................................................................................................. 38
6      Sepsis related practice and initiatives........................................................................................... 40
7      Discussion...................................................................................................................................... 42
    7.1        The burden of sepsis ............................................................................................................. 42
    7.2        Variation in incidence and mortality over time .................................................................... 42
    7.3        Variation in practice and health initiatives ........................................................................... 43
    7.4        Interpretation of findings and way forward ......................................................................... 43
    7.5        Conclusion ............................................................................................................................. 44
Appendix: Data and additional results.................................................................................................. 46
    Data source and exclusions............................................................................................................... 46
    Sepsis coding over time .................................................................................................................... 46
    Population group .............................................................................................................................. 51
    Hospital characteristics ..................................................................................................................... 52
    Mortality ........................................................................................................................................... 53
    Guide for interviews on sepsis related practice and health initiatives............................................. 55
Abbreviations ........................................................................................................................................ 56
Glossary ................................................................................................................................................. 57

Epidemiology of Sepsis – Preface & Report – February 2020                                                                                                  3
List of tables .......................................................................................................................................... 59 List of figures ......................................................................................................................................... 60 References ............................................................................................................................................ 61 Epidemiology of Sepsis – Preface & Report – February 2020 4
Acknowledgements

This report was prepared with support and valuable input from: Suraj Rasakulasingam, Fiona Horn,
Herbert Down, Amanda Walker, Chris Leahy, Jing Song, Tammy Cowell, and Casey Van Reyk at the
Australian Commission on Safety and Quality in Health Care.

We appreciate the contributions of the following interview participants from around Australia:

        Dr Bronwyn Avard (ACT)

        Dr Sandra Brownlea (NT)

        Prof Kirsty Buising (VIC)

        Dr Louise Cooley (TAS)

        Mary Fullick (NSW)

        Malcolm Green (NSW)

        Louise Hobbs (VIC)

        A/Prof Luregn Schlapbach (QLD)

        Prof Bala Venkatesh (QLD)

        Dr Sanchia Warren (TAS)

Epidemiology of Sepsis – Preface & Report – February 2020                                          5
Executive summary Sepsis is a life-threatening condition that contributes considerably to the global burden of disease in the population. This report, commissioned by the Australian Commission on Safety and Quality in Health Care, presents the first national epidemiological snapshot of sepsis and its impact on Australians. This report aims to i) determine the incidence and mortality of sepsis in public hospitals, ii) investigate variations in incidence and mortality related to patient and hospital stay characteristics, and iii) investigate sepsis-related practice and initiatives across states/territories. A mixed methods longitudinal study was conducted. The epidemiological analysis of national longitudinal data included all patients admitted to all Australian public hospitals during the study period, i.e. between 2013-14 and 2017-18. Data related to these hospitalisations were extracted from the Admitted Patient Care National Minimum Data Set specifically isolating the patients with a diagnosis of sepsis using ICD-10-AM codes – defined in the Classification of Hospital Acquired Diagnoses. Sepsis hospitalisations and deaths were analysed in relation to i) patient demographics (e.g., sex, age, remoteness of residence, socioeconomic disadvantage and Indigenous status), ii) patient clinical characteristics (e.g., organ dysfunction, comorbidity, ICU admission, surgical procedure etc.), and iii) hospital characteristics (e.g., remoteness of hospital location, public hospital peer group and state/territory). Age standardised incidence and mortality rates were calculated. An advanced statistical modelling approach was applied to examine changes in mortality with consideration of the cluster effect of hospitals and important risk factors, such as patients’ age, sex and comorbidities etc. Semi-structured interviews with clinicians, patient safety professionals and sepsis researchers around the country were conducted regarding changes in clinical practice, sepsis awareness and clinical initiatives that may have contributed to the observed variations during the study period. The key findings below highlight the substantial number of hospitalisations of patients with sepsis and related inequalities that exist in the Australian population. This report draws attention to a large increase in sepsis incidence over the study period, which could be explained by coding changes and increased awareness and clinical initiatives. Burden of disease Between 2013-14 and 2017-18, a total of 23,827,061 hospitalisations were included in this study. Out of these hospitalisations, 437,354 were recorded with a sepsis diagnosis in 739 public hospitals in Australia. Overall age standardised sepsis incidence was 1,162.8 cases per 100,000 resident population. Of these sepsis hospitalisations, 12.0% (n=52,297) died in hospital, which was 10.9 times higher than non-sepsis patients (1.1%). The median hospital length of stay for sepsis patients was seven times as long as the median LOS for non-sepsis patients (7.0 days vs 1.0 days respectively). About 22.3% of hospitalisations with sepsis had an ICU stay while only 2% of hospitalisations without sepsis with an ICU stay. Nearly half of all sepsis patients had at least one comorbidity recorded with poor clinical prognosis. Related inequalities The youngest patients (
1.7 times higher than among other Australians. Sepsis incidence was 1.2 times higher for those living
in the lowest socioeconomic areas compared with the highest socioeconomic areas.

Variation over time

Between 2013-14 and 2017-18, age standardised sepsis incidence increased by 27% - with the
sharpest increase of 24% in 2015-16. Despite the large increase in sepsis incidence, sepsis mortality
rates remained relatively stable over the study period after adjusting for relevant risk factors and
hospital clustering. The death rates for sepsis patients with organ dysfunction and septic shock
patients also remained relatively stable over this period.

The reported increased incidence of sepsis, in the context of static mortality rates for the same
period, reflects improved reporting and changes to coding guidance made during this period, and
not an increase in sepsis. Prior to 2015-16, when changes in coding rules were promulgated
together with awareness campaigns, sepsis was being underreported.

The overall increase in sepsis cases between 2013-14 and 2017-18 can be explained by the increase
in a small number of ICD-10-AM codes, especially the most frequently used code A419 (Sepsis,
unspecified). Further investigation of sepsis coding guidelines and practices may assist in
understanding reasons for the increases observed.

Clinical awareness and initiatives

Around the period of 2013-14 to 2017-18, there were multiple prominent sepsis awareness
campaigns, such as “Sepsis Kills” in NSW and “Think Sepsis, Act Fast” in Victoria. These campaigns,
along with general attention on sepsis in the medical literature and medical education, may have
contributed to improved recognition, documentation and subsequently increased coding of sepsis
over the time period. Although the availability of electronic record systems was variable across
different hospitals, some jurisdictions are currently designing and testing more sophisticated
decision support systems to improve early recognition and treatment of sepsis.

Epidemiology of Sepsis – Preface & Report – February 2020                                               7
Introduction
Sepsis, defined in 2016 as “life-threatening organ dysfunction caused by a dysregulated host
response to infection” (1), contributes considerably to the burden of disease in the population. The
global incidence of sepsis is conservatively estimated at over 30 million cases and 5.3 million deaths
annually (2). It imposes significant economic burdens on healthcare systems (3) and individuals.
Sepsis is a significant cause of death and disability, particularly in children (4, 5). The World Health
Organisation (WHO) in 2017 adopted a resolution on sepsis urging action to reduce the burden of
sepsis worldwide (6).
There is currently no published population-level epidemiologic data for the incidence and mortality
of sepsis in Australia. Studies from Australia have focused on the incidence or mortality of sepsis
and/or severe sepsis in the Intensive Care Unit (ICU) setting (5, 7-11). These studies indicate that up
to around one quarter of all patients in Australian ICUs have sepsis (8); and almost 10% of ICU
patients had ‘severe sepsis’, with a mortality rate over 24% (11). Post-operative sepsis incidence
rates in Australia increased over the period 2002-2009, from 12.7 to 15.8 cases per 1000 admissions
(12). Although mortality rates decreased (from 27% to 20%), the increase in incidence resulted in no
change in the number of post-operative sepsis-related deaths (3.4 vs 3.2 deaths per 1000
admissions) (12).
Indigenous Australians experience sepsis at significantly higher rates than non-Indigenous
Australians. In the Northern Territory, the annual population-based incidence of sepsis in 2007-8 was
reported at 11.8 admissions per 1000 people, but 40.8 admissions per 1000 Indigenous people (13).
In paediatric patients, the incidence of sepsis and septic shock is 4.4 cases per 100, 000 Indigenous
children compared with 0.6 cases per 100,000 non-Indigenous children (10).
Sepsis incidence is considered to have traditionally been underreported (6, 14). Sepsis incidence and
mortality rates may vary according to the definition used (8); and some authors report a mismatch
between clinically diagnosed sepsis and sepsis captured using International Classification of Diseases
(ICD) codes (9, 15). There has also been significant variation in the WHO ICD codes used to define
sepsis in epidemiological studies using administrative data (16). Adding to the complexity in
determining the incidence of sepsis over time are the continually evolving condition definitions, the
most recent being the introduction of the Third International Consensus Definitions for Sepsis and
Septic Shock (Sepsis-3) in 2016 (1).
Aims and scope of this report
This report was commissioned by the Australian Commission on Safety and Quality in Health Care
(ACSQHC) as the first strategy in a national program of work to improve patient outcomes from
sepsis.
The aims of this report were to
1. Determine the incidence and mortality of sepsis in public hospitals
2. Investigate variations in incidence and mortality related to patient and hospital stay
characteristics.
3. Investigate sepsis-related practice and initiatives across states/territories
These aims were achieved through a mixed methods research approach:
Epidemiological analysis of national inpatient data from all Australian public hospitals (Aims
1 and 2). The analysis included all patients admitted to all Australian public hospitals from
2013-14 to 2017-18. Data related to these hospitalisations were extracted from the
Epidemiology of Sepsis – Preface & Report – February 2020 8Admitted Patient Care National Minimum Data Set (APC NMDS; (17)), specifically isolating
the patients with a diagnosis of sepsis using ICD-10-AM codes – defined in the Classification
of Hospital Acquired Diagnoses (CHADx; (18)). Patients with a sepsis ICD code recorded
during hospitalisation were referred to as a sepsis patient in this report. The same
definitions applied to sepsis hospitalisations and deaths in this report.
Sepsis hospitalisations and deaths were analysed in relation to i) patient demographics (e.g.,
sex, age, remoteness of residence, socioeconomic disadvantage and Indigenous status), ii)
patient clinical characteristics (e.g., organ dysfunction, comorbidity, ICU admission, surgical
procedure etc.), and iii) hospital characteristics (e.g., public hospital peer group, remoteness
of hospital location and state/territory). Age standardised incidence and mortality rates
were calculated. Generalised estimating equations were applied to examine the changes in
mortality rates over time account for hospital level clustering and to adjust for relevant risk
factors.
Semi-structured interviews with clinicians, patient safety professionals and sepsis
researchers around the country (Aim 3) regarding changes in clinical practice, sepsis
awareness, promotion and other initiatives that may have contributed to the observed
variations during the study period (i.e. between 2013-14 and 2017-18).
Epidemiology of Sepsis – Preface & Report – February 2020 9Sepsis hospitalisations
The 2013-2018 study cohort included 23,827,061 hospital separations (‘hospitalisations’) from 739
public hospitals in Australia. There were 437,354 hospitalisations of patients with sepsis (overall
crude incidence: 1,835.5 per 100,000 hospitalisations). The demographics and clinical characteristics
of these sepsis separations are reported in Table 1. For simplicity, ‘hospital separations’ will be
referred to as ‘hospitalisations’ (see Glossary for definition) in this report but note that as the data
are not available at patient level, one patient could have multiple hospitalisations.
The average age of patients hospitalised with sepsis was 60.1 years and 54.7% were males. More
than one third (38.9%) had sepsis recorded as the principal diagnosis (see Glossary for definition) for
their hospital stays. A similar proportion of these sepsis hospitalisations (37.3%) had a diagnosis of
organ dysfunction. Nearly half of them (46.6%) had a comorbidity recorded with more than a
quarter (26.7%) having Charlson Comorbidity Index (CCI; (19))≥3, indicating these patients had poor
clinical prognosis.
A higher proportion of sepsis hospitalisations were from low socioeconomic status (SES) groups;
about a quarter (24.2%) from the lowest SES group, which represents one fifth (20%) of the
Australian residential population. Indigenous people accounted for 5.4% of sepsis hospitalisations,
yet constitute only 3.3% of Australian residential population (20).
The majority of sepsis hospitalisations (85.3%) were in acute care (see Glossary for definition).
Nearly one tenth required ventilatory support with a median duration of 97.0 hours (inter-quartile
range [IQR]: 38.0 - 215.0). Overall, 22.3% of sepsis hospitalisations had an ICU admission. Median
ICU length of stay (LOS) was 3.3 days (IQR: 1.6-7.7) and median hospital LOS was 7.0 days (IQR: 3.0 -
14.0).
Table 1: Demographics and clinical characteristics of patient hospitalisations with sepsis (n=437,354)
Characteristics Patient hospitalisations
with sepsis, N (%)
Total number of hospitalisations with sepsis 437,354
Age, years Mean (SD) 60.1 (27.0)
Median (IQR) 68.0 (48.0 -80.0)
Sex Male 239,264 (54.7%)
Female 198,085 (45.3%)
@
Diagnosis as Principal 170,084 (38.9%)
Additional 267,270 (61.1%)
With organ dysfunction^ Yes 163,138 (37.3%)
No 274,216 (62.7%)
@
Remoteness (patients) Major cities 285,167 (65.2%)
Inner regional 92,293 (21.1%)
Outer regional 43,058 (9.8%)
Remote 6,276 (1.4%)
Very remote 7,557 (1.7%)
Unknown 3,003 (0.7%)
@
Socioeconomic group Group 1 (lowest SES) 105,768 (24.2%)
Group 2 89,569 (20.5%)
Group 3 91,809 (21.0%)
Epidemiology of Sepsis – Preface & Report – February 2020 10Characteristics Patient hospitalisations
with sepsis, N (%)
Group 4 74,932 (17.1%)
Group 5 (highest SES) 72,235 (16.5%)
Aboriginal and Torres Indigenous 23,621 (5.4%)
Strait Islander Status Other Australians 413,733 (94.6%)
Acute care@ 372,894 (85.3%)
Ventilation required 41,787 (9.6%)
Duration of ventilatory Mean (SD) 189.4 (325.6)
support, total hours (for Median (IQR) 97.0 (38.0 - 215.0)
those with ventilation)
Involved a surgical procedure@ during hospital stay 78,657 (18.0%)
With a comorbidity# 203,694 (46.6%)
Charlson Comorbidity Mean (SD) 1.9 (2.5)
Index (CCI) Median (IQR) 1 (0-3)
CCI groups CCI=0 192,630 (44.0%)
CCI=1, 2 127,994 (29.3%)
CCI≥3 116,757 (26.7%)
ICU admission 97,494 (22.3%)
ICU length of stay, days Mean (SD) 7.5 (14.0)
Median (IQR) 3.3 (1.6-7.7)
Hospital length of stay, Mean (SD) 12.4 (21.7)
days Median (IQR) 7.0 (3.0 - 14.0)
In-hospital mortality 52,297 (12.0%)
State/territory South Australia (SA) 21,422 (4.9%)
(hospitals) Tasmania (TAS) 9,701 (2.2%)
Northern Territory (NT) 7,742 (1.8%)
New South Wales (NSW) 150,796 (34.5%)
Queensland (QLD) 80,783 (18.5%)
Victoria (VIC) 122,377 (28.0%)
Western Australia (WA) 35,820 (8.2%)
Australian Capital Territory 8,713 (2.0%)
(ACT)
Remoteness (hospitals) @ Major cities 319,095 (73.0%)
Inner regional 78,046 (17.8%)
Outer regional 32,100 (7.3%)
Remote 6,300 (1.4%)
Very remote 1,813 (0.4%)
Hospital peer group@ Principal referral 173,283(39.6%)
Public acute group A 158,101(36.2%)
Public acute group B 48,285(11.0%)
Public acute group C 25,619(5.9%)
Women’s and/or children’s 16,418(3.8%)
Epidemiology of Sepsis – Preface & Report – February 2020 11Characteristics Patient hospitalisations
with sepsis, N (%)
Public acute group D 6,833(1.6%)
Non-acute/subacute 5,051(1.2%)
Other* 3,764(0.9%)
^ organ dysfunction includes following conditions: cardiovascular (R570, I509), respiratory
(J80, J95, J960), renal (N17, N990), Hematologic (D65, D69), hepatic (K72), and metabolic
(E872).
# Comorbidity includes: pulmonary disease (J40- J47, J60-J67), cancer (C0-C3, C40, C41, C43,
C45-C49, C5, C6, C70- C76, C80-C85, C883, C887, C889, C900, C901, C91-C93, C940-C943, C9451,
C947, C95, C96), diabetes (E109, E119, E139, E149, E101, E111, E131, E141, E105, E115, E135,
E14, E102, E112, E132, E142 E103, E113, E133, E143 E104, E114, E134, E144), HIV/AIDS (B20-
B24), liver disease (K702, K703, K73, K717, K740, K742, K746, K743, K744, K745) and renal
disease (N03, N052-N056, N072- N074, N01, N18, N19, N25).
@
definition see Glossary.
*Other includes: Very small, Psychiatric, Outpatient hospital, and Other hospital peer groups,
and hospitals with no peer group information)
Epidemiology of Sepsis – Preface & Report – February 2020 12Sepsis incidence Age and sex The number of sepsis hospitalisations and incidence were highest for the youngest (
Figure 2: Age specific sepsis incidence by sex

Change over time
Overall trend
Between 2013-14 and 2017-18, there was a considerable increase in the number and rate of
hospitalisations where sepsis was recorded as a diagnosis (Table 2). The number of sepsis cases
recorded increased 59%, from 66,062 to 104,912, an average increase of around 9,712
hospitalisations (or 15%) per year over this period. The largest increase occurred in 2015-16, 23,144
more cases recorded than that in 2014-15 (a 33% increase).

Similarly, the age standardised incidence increased over the same period – by 27% (from 994.1 to
1,260.5 per 100,000 population), an average annual increase of 7% (Table 2). A sharp increase also
happened from 2014-15 to 2015-16 (24% increase). The sepsis incidence stabilised after 2015-16,
with only a 2% increase from 2015-16 to 2016-17.

Table 2: Sepsis cases and age standardised incidence over time

 Year        Number of sepsis cases Age standardised incidence,
                          recorded    per 100,000 pop (95% CI)
 2013-14                    66,062       994.1 (984.5 – 1,003.8)
 2014-15                    70,383     1,007.3 (997.7 – 1,016.8)
 2015-16                    93,527   1,246.2 (1,236.0 – 1,256.4)
 2016-17                   102,470   1,272.2 (1,262.2 – 1,282.1)
 2017-18                   104,912   1,260.5 (1,250.8 – 1,270.3)

Trends in sepsis hospitalisations by Age and sex
Sepsis hospitalisation rate increased every year among the youngest patients (
standardised incidence was consistently higher among males than females over the whole study period (Figure 4). Figure 3: Age-specific sepsis incidence by year Figure 4: Change over time – age and sex standardised sepsis incidence by year, including the 95% CI for each year and sex Epidemiology of Sepsis – Preface & Report – February 2020 15
Sepsis ICD-10-AM coding changes over time
A set of 43 sepsis ICD-10-AM codes, from the Classification of Hospital Acquired Diagnoses (CHADx),
were used to identify sepsis diagnosis (Appendix Table 7). The number of sepsis cases recorded
increased by 38,850 over 5 years, from 66,062 in 2013-14 to 104,912 in 2017-18 (see Table 2).

Sepsis cases identified by each individual ICD code were investigated and changes in these different
diagnosis codes over time were presented in Appendix Table 7. The top seven most common sepsis
ICD codes accounted for 96% (n=419,758) of all sepsis cases recorded. Figure 5 shows sepsis cases
recorded in these seven codes have increased since 2013-14, ranging from 24% to 114%.

ICD code A419 (sepsis, unspecified) was the most common sepsis code recorded – 232,757 cases
(53% of all 437,354 sepsis cases; Figure 5). It accounted for 83% of the increase over 5-year study
period – an increase of 32,201 cases. The sharpest increase of this code occurred from 2014-15 to
2015-16 (31,032 cases vs 53,885, respectively; a 74% increase). These 22,853 cases increase of A419
coded sepsis from 2014-15 to 2015-16 accounted for almost all sepsis cases increase (99%) over this
time period (70,383 compared with 93,527, respectively).

There were 19 ICD codes (44% of all 43 codes) with less than 1000 sepsis cases recorded for each
code over 5-year period in all study hospitals, including four codes that were never used at all
(Appendix Table 7).

The use of two sepsis codes have reduced dramatically in the period from 2013-14 to 2017-18
(Appendix Table 7): 1) Systemic inflammatory response syndrome (SIRS) of infectious origin without
acute organ failure (R650) – from 2625 to 0 cases (100% decrease); and 2) Severe sepsis (R651) –
from 2365 to 942 (60% decrease). The sharpest reductions for both codes occurred in 2015-16.

                Sepsis, unspecified (A419)
              Overall: ↑32201 cases, ↑114%
  70000
                                                            1200
  60000                                                            Cases, N (left axis): Number of sepsis cases
                                         ↑9%      ↑3%       1000
  50000                        ↑74%                                Rate (right axis): Incidence per 100,000
                                                            800    hospitalisations
  40000
                                                            600
  30000                                                            Annual percentage changes are shown inside the
                     ↑10%
  20000                                                     400    bars.

  10000                                                     200    Overall changes in number of cases and
                                                                   percentage were calculated based on sepsis cases
      0                                                     0
           2013 -     2014 -   2015 -    2016 -   2017 -           from 2013-14 to 2017-18.
            2014       2015     2016      2017     2018

                        Septic shock (R572)                                 Sepsis due to Escherichia coli (A4151)
                    Overall: ↑4229 cases, ↑44%                                  Overall: ↑3477 cases, ↑47%
   16000                                                    300    16000                                                  300

   14000                                                           14000
                                                            250                                                           250
   12000                                           ↑6%             12000
                                          ↑7%
                               ↑12%                         200                                                           200
   10000                                                           10000                                         ↑2%
                      ↑13%                                                                     ↑23%     ↑10%
    8000                                                    150     8000                                                  150
                                                                    6000              ↑7%
    6000                                                                                                                  100
                                                            100
                                                                    4000
    4000
                                                                                                                          50
                                                            50      2000
    2000
                                                                        0                                                 0
       0                                                    0                2013 -   2014 -   2015 -   2016 -   2017 -
           2013 -     2014 -    2015 -   2016 -    2017 -                     2014     2015     2016     2017     2018
            2014       2015      2016     2017      2018

Epidemiology of Sepsis – Preface & Report – February 2020                                                                       16
Bacterial sepsis of newborn, unspecified (P369) Sepsis due to Staphylococcus aureus (A410)
Overall: ↑2663 cases, ↑59% Overall: ↑1028 cases, ↑24%
8000 160 8000 160
7000 140 7000 140
↑5%
6000 ↑19% 120 6000 120
5000 ↑11% 100 5000 100
↑8% ↓3%
↑14% ↑19%
4000 80 4000 80
↑0.1%
3000 60
3000 60
2000 40
2000 40
1000 20
1000 20
0 0
0 0 2013 - 2014 - 2015 - 2016 - 2017 -
2013 - 2014 - 2015 - 2016 - 2017 - 2014 2015 2016 2017 2018
2014 2015 2016 2017 2018
Other specified sepsis (A418) Sepsis due to other Gram-negative
Overall: ↑1564 cases, ↑60% organisms (A4158)
4500 90 Overall: ↑1116 cases, ↑72%
4500 90
4000 80
↑3% 4000 80
↑11%
3500 ↑32% 70
3500 70
3000 60 3000 60
2500 ↑6% 50 2500 50
2000 40 ↑19% ↑2%
2000 ↑32% 40
1500 30 1500 30
↑7%
1000 20 1000 20
500 10 500 10
0 0 0 0
2013 - 2014 - 2015 - 2016 - 2017 - 2013 - 2014 - 2015 - 2016 - 2017 -
2014 2015 2016 2017 2018 2014 2015 2016 2017 2018
Figure 5: Top seven most common sepsis codes, accounting for 96% of all recorded sepsis cases
Sepsis recorded as the principal or an additional diagnosis
Age standardised incidence for sepsis recorded as the principal diagnosis for patients’ hospital stays
was 438.4 per 100,000 population (95% CI: 435.7 – 441.1) and it was 724.4 as an additional diagnosis
(95% CI: 720.9 – 727.8). Sepsis incidence recorded as an additional diagnosis was 65% higher than
that recorded as the principal diagnosis (rate ratio: 1.65, 95% CI: 1.64-1.67).
Sepsis diagnoses were more likely to be coded as an additional diagnosis than the principal
diagnosis, especially for the youngest patients (Figure 6: Age specific sepsis incidence by diagnosis recording as the principal or additional diagnosis For each study year age standardised sepsis incidence was consistently higher for those hospitalisations with sepsis recorded as an additional diagnosis than for those with a principal diagnosis of sepsis (Figure 7). However, the age standardised incidence of sepsis as a principal diagnosis increased by 39% during the study period (average annual increase of 10%) while the increase in sepsis as an additional diagnosis was 20% (average annual increase of 5%). Figure 7: Change over time – age standardised sepsis incidence by diagnosis recording as the principal or additional diagnosis (errors bars indicate 95% CIs) Epidemiology of Sepsis – Preface & Report – February 2020 18
Sepsis with organ dysfunction
A total of 163,138 sepsis hospitalisations had an organ dysfunction also coded. Renal disease was
the most common type of organ dysfunction (80.1%; Figure 8 -Note: as patients may have multiple
organ dysfunctions, total percentage for type of organ dysfunction is higher than 100%). A total of
26.2% of these patient hospitalisations had more than one organ dysfunctions.

    Type of organ dysfunction*
                         Renal                                                                 80.1%
                  Hematologic                    16.6%
                    Metabolic                    15.5%
                   Respiratory                 12.6%
                      Hepatic           6.2%
                Cardiovascular         4.5%
 Number of Organ dysfunctions
                             1                                                            73.8%
                             2                     19.1%
                             3         5.3%
                          >=4        1.8%

                                 0      20000      40000     60000   80000   100000   120000   140000
                                                         Number of sepsis cases

Figure 8: Sepsis with organ dysfunction

Age standardised incidence for sepsis with an organ dysfunction was 403.2 per 100,000 population
(95% CI: 400.7 – 405.7). Age standardised incidence for sepsis without an organ dysfunction was 88%
higher (incidence: 759.6 per 100,000 populations, 95% CI: 756.0 – 763.2).

The youngest patients (
Figure 9: Age specific sepsis incidence for those with and without organ dysfunction Age standardised sepsis incidences increased for both groups, i.e. those with and without organ dysfunction, from 2013-14 to 2017-18 (a 28% increase for sepsis with an organ dysfunction and a 26% for those without), at similar annual increase rates (7% for those with an organ dysfunction and 6% for those without; Figure 10). The sharpest annual increase occurred in 2015-16 for both groups (a 21% increase for those with an organ dysfunction and a 25% increase for those without). Epidemiology of Sepsis – Preface & Report – February 2020 20
Figure 10: Change over time – age standardised sepsis incidence for those with and without organ
dysfunction (errors bars indicate 95% CIs)

Septic shock
Between 2013-14 and 2017-18, 59,011 septic shock (ICD-10-AM: R572) hospitalisations were
identified (Appendix Table 7). The youngest patients (
Figure 11: Number of septic hospitalisations and crude incidence of septic shock (R572) by age group

Age standardised incidence for septic shock was 162.9 per 100,000 population (95% CI: 161.2-164.5)
and it was 999.9 for all other sepsis (95% CI: 995.8-1,004.0). Sepsis incidence recorded as a non-
septic shock diagnosis was 6.1 times higher than that recorded as a septic shock diagnosis (rate
ratio: 6.1, 95% CI: 6.1-6.2).

Age standardised septic shock incidence increased 19% from 2013-14 to 2017-18 while the incidence
for other sepsis increased 28% (Figure 12 and Table 3). The patterns of increases were different.
There was a small increase every year for septic shock incidence – annual increase of 8%, 6%, 1% and
4% over the five-year period. For all other sepsis, a sharpest increase occurred in 2015-2016 – a 27%
increase relative to 2014-2015 – then 2% increase in 2016-17 and followed by 2% decrease in 2017-
18.

Epidemiology of Sepsis – Preface & Report – February 2020                                         22
Figure 12: Change over time – age standardised sepsis incidence rates for septic shock and other
sepsis (errors bars indicate 95% CIs)

Table 3: Age standardised sepsis incidence rates for septic shock and other sepsis over 5-year period

 Year      Septic shock*           Annual change Other sepsis*               Annual change
 2013-14 145.8 (142.2 - 149.4)           -             848.3 (839.3 - 857.3)              -
 2014-15 157.7 (154.0 - 161.4)         +8%             849.5 (840.7 - 858.3)            0%
 2015-16 166.6 (162.9 - 170.3)         +6%         1,079.7 (1070.1 - 1089.2)          +27%
 2016-17 167.5 (163.9 - 171.1)         +1%         1,104.7 (1095.4 - 1113.9)           +2%
 2017-18 173.9 (170.3 - 177.6)         +4%         1,086.6 (1077.6 - 1095.7)           -2%
* Age standardised incidence (per 100,000 population; with 95% CI)

Population groups
Remoteness
People living in inner/outer regional area had the lowest age standardised incidence rate compared
to those living elsewhere (Figure 13 and Appendix Table 8). Those living in very remote areas had
sepsis hospitalisations 1.7 times higher than those living in major cities. Hospitalisation rates for
people living in very remote areas were highest across all age groups
Remoteness
               Major cities
            Inner Regional
            Outer Regional
                   Remote
              Very Remote
 Socioeconomic group (SES)
      Group 1 (lowest SES)
                   Group 2
                   Group 3
                   Group 4
      Group 5 (highest SES)
                ATSI status
         Other Australians
                Indigenous

                          1000      1200         1400         1600         1800          2000
                                             Incidence per 100,000 population

Figure 13: Age standardised incidence rates and 95% CIs by selected population characteristics

Figure 14: Age specific sepsis incidence by remoteness of patients’ place of residence

Epidemiology of Sepsis – Preface & Report – February 2020                                        24
Socioeconomic status (SES) Living in an area with socioeconomic disadvantage (see Glossary) was associated with higher hospitalisation rates for sepsis (Figure 13 and Appendix Table 8). The age standardised sepsis incidence rate based on the area of usual residence was 1.2 times as high in the lowest SES group compared with the highest SES group. The difference in sepsis incidence between lowest SES group and the other SES groups was greatest for those patients aged 40-59 (Figure 15). Figure 15: Age specific sepsis incidence by patient SES (Group 1 – lowest) Aboriginal and Torres Strait Islander (ATSI) Indigenous people accounted for 5.4% (n=23,621) of all sepsis hospitalisations. However, age standardised incidence rate was 1.7 times higher among indigenous people than other Australians (1,878.4 compared with 1,119.5 per 100,000 population, respectively; Figure 13 and Appendix Table 8). The rates were higher among Indigenous people for all age groups apart from the youngest patients (
Figure 16: Age specific sepsis incidence by ATSI status

Clinical characteristics
Hospitalisations with an ICU admission
Age standardised incidence rate of sepsis was 14.9 times higher for hospitalisations with an ICU
admission (Defined in https://meteor.aihw.gov.au/content/index.phtml/itemId/327234) during their
stay than those without an ICU admission (13,241.0 sepsis hospitalisations per 100,000 population
compared with 885.9 per 100,000 population, respectively). The rates were higher for all age groups
among patients with an ICU stay than those without (Figure 17).

Epidemiology of Sepsis – Preface & Report – February 2020                                       26
Figure 17: Age specific sepsis incidence for those with and without an ICU admission

Ventilation
Similarly, the age standardised incidence rate of sepsis was 16.5 times higher among patients who
received ventilation than those who did not (17,081.2 compared with 1037.3 per 100,000
population, respectively). The rates were higher for those who had ventilation than who did not for
all age groups (Figure 17).

Figure 18: Age specific sepsis incidence by ventilation usage during hospital stay
Epidemiology of Sepsis – Preface & Report – February 2020                                         27
Acute care
The majority of sepsis hospitalisations were recorded as acute care (85.3%, n=372,984; see Glossary
for definition). Age standardised incidence rates were similar between those in acute care and non-
acute care – 1,122.0 per 100,000 population (95% CI: 1,117.5 – 1,126.5) versus 1101.3 (95% CI:
1,073.9 – 1,128.7), respectively; rate ratio: 1.02, 95% CI (0.99-1.04). The highest hospitalisation
sepsis rate for non-acute care was among the youngest age group (
Figure 20: Age specific sepsis incidence for patients with and without a surgical procedure during
their hospital stays

With a comorbidity
Five common comorbidities in sepsis patients were examined in this report (Table 4). Of 203,694
hospitalisations of patients who had a comorbidity, more than half had diabetes and one third had
renal disease.

Table 4: Number of sepsis patients with comorbidities

 Comorbidity                     N (% of all 203,694 patients
                                         with a comorbidity)
 Diabetes                                     104,656(51.4%)
 Renal disease                                 68,262 (33.5%)
 Cancer                                        57,736 (28.3%)
 Chronic pulmonary disease                      35,81(17.6%)
 Liver disease                                   8,404 (4.1%)
 HIV or AIDS                                       627(0.3%)

Age standardised sepsis incidence was 5.5 times higher among those with a comorbidity than those
without – 6,279.3 per 100,000 population (95% CI: 5,942 – 6,616.6) versus 1,139.3 (95% CI: 1,134.8 –
1,143.8) respectively; rate ratio: 5.5, 95% CI: 5.2-5.8. The sepsis incidence rate among those with a
comorbidity was consistently higher than those without for all age groups (Figure 21. Note: only 10
under 1-year old patients were recorded with a comorbidity during their hospital stays and 4 of
them were diagnosed with sepsis. Age groups
Figure 21: Age specific sepsis incidence with/without a comorbidity Hospital characteristics Between 2013-14 and 2017-18, hospitalisations from a total of 739 public hospitals were included in this study. More than two-thirds of hospitalisations were from principal referral and public acute group A hospitals in 2017-18 (Table 6). Table 5: Number of hospitals and hospitalisation by peer group in 2017-18 Peer group Number of hospitals Number of hospitalisations Principal referral 31 (4.5%) 1,868,660 (36.3%) Public acute group A 62 (9.0%) 1,722,931 (33.4%) Public acute group B 43 (6.2%) 601,370 (11.7%) Public acute group C 141 (20.5%) 427,467 (8.3%) Women’s and/or children’s 12 (1.7%) 268,738 (5.2%) Public acute group D 188 (27.3%) 92,750 (1.8%) Other 21 (3.0%) 89,329 (1.7%) Non-acute/subacute 37 (5.4%) 46,771 (0.9%) Psychiatric 29 (4.2%) 14,946 (0.3%) Very small 110 (16%) 9,194 (0.2%) Outpatient hospital 2 (0.3%) 226 (
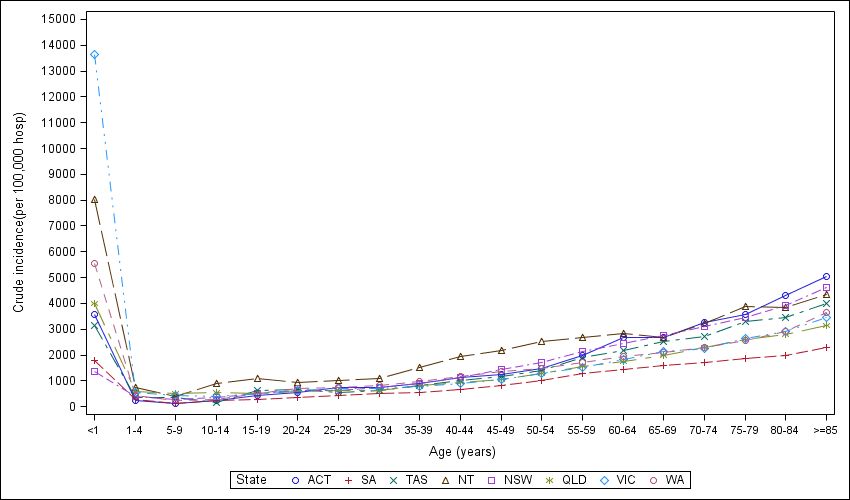
period (Figure 22 and Appendix Table 9). Sepsis hospitalisation rate for the youngest patients varied
dramatically between states/territories - the highest sepsis rate occurred for VIC (Figure 23). SA was
consistently lower for all age groups and NT experienced the highest sepsis incidence rates for
patients aged 10-59 years.

 State/territory (hospital)
                        NT
                     NSW
                      ACT
                       VIC
                       WA
                       TAS
                      QLD
                        SA
   Remoteness (hospital)
              Major cities
           Inner Regional
           Outer Regional
                  Remote
             Very Remote
                              700   900         1100        1300       1500      1700       1900
                                              Incidence per 100,000 population

Figure 22: Age standardised incidence rates and 95% CIs by selected hospital characteristics

Figure 23: Age specific sepsis incidence by states/territories
Epidemiology of Sepsis – Preface & Report – February 2020                                          31
Remoteness (hospital) Age standardised incidence was 1.4 times higher for patients admitted to a remote hospital than for those patients in an inner regional hospital – 1,431.4 per 100,000 population compared with 998.0 (Figure 22 and Appendix Table 9). The sepsis rate was 1.2 times higher among patients admitted to a major city hospital than those in an inner regional hospital. For those patients aged 75 and over, the sepsis incidence rate was higher for those who were admitted to a major city hospital compared to those patients in other hospitals (Figure 24). Figure 24: Age specific sepsis incidence by geographical remoteness of hospitals Epidemiology of Sepsis – Preface & Report – February 2020 32
Sepsis patient outcomes
Overall sepsis mortality rates
A total 305,368 patients died out of all 23,827,061 hospitalisations between 2013-14 and 2017-18.
Of 437,354 hospitalisations of patients with sepsis, 52,297 patients died in hospital. In this report,
mortality was calculated based on in-hospital deaths. Two types of mortality rates are presented:
Case mortality rate (also referred as case fatality rate) is the proportion of deaths of sepsis
patients within all sepsis hospitalisations.
Crude case mortality was 119.6 per 1000 sepsis hospitalisations, i.e. 52,297 deaths of sepsis
patients out of 437,354 patients in hospital with sepsis. Sepsis case mortality was much
higher than case mortality for non-sepsis conditions, which was 10.8 per 1000 non-sepsis
hospitalisations. Age standardised case mortality was 57.7 per 1000 population, 95% CI:
56.5-58.8.
Mortality rate is the proportion of deaths of sepsis patients relative to all hospitalised
patients.
Crude hospital sepsis mortality was 219.5 per 100,000 hospitalisations, i.e. 52,297 deaths of
sepsis patients out of 23,827,061 hospitalisations. Age standardised mortality was 98.7
deaths per 100,000 population, 95% CI: 97.6-99.7.
Although those in the youngest age group (Figure 26: Age specific incidence and morality Changes in mortality over time Deaths of sepsis patients increased by 39% from 8,628 in 2013-14 to 11,993 in 2017-18 – an average annual increase of 10% (Table 6). During the same time period, overall hospitalisations increased by 17% (an average annual increase of 4%) and hospitalisations with sepsis increased by 59% (an average annual increase of 15%). Age standardised sepsis case mortality rate (i.e. the proportion of sepsis deaths relative to all sepsis hospitalisations) decreased over time. This can be partly explained by the relatively large increase in the number of sepsis hospitalisations (i.e. the denominator) over the time period, especially after 2015-16. On the other hand, age standardised mortality rates (i.e. the proportion of sepsis deaths out of all hospitalisations) increased. This may also be due to the large increase in the number of sepsis hospitalisations coded, increasing the proportion of hospitalised patients who had sepsis and subsequently die (i.e., the numerator). Although the two mortality rates indicated potentially different trends, both can be largely explained by the overall increase in sepsis hospitalisations coded. Epidemiology of Sepsis – Preface & Report – February 2020 34
Table 6: Age standardised mortality rates over time

 Year       Hospitalisations Sepsis             Deaths of Case mortality*      Mortality^
                               hospitalisations sepsis
                                                patients
 2013-14          4,393,539             66,062       8,628   63.2(60.5 – 65.9) 91.6(89.2 – 94.0)
 2014-15          4,531,488             70,383       9,308   65.0(62.2 – 67.9) 94.7(92.2 – 97.1)
 2015-16          4,757,601             93,527     10,856    55.1(52.7 – 57.5)       102.1(99.6 –
                                                                                            104.5)
 2016-17          4,993,249            102,470     11,512    53.8(51.2 – 56.4)       101.6(99.2 –
                                                                                            104.0)
 2017-18          5,151,184            104,912     11,993    55.9(53.3 – 58.5)       102.0(99.7 –
                                                                                            104.4)
 Total           23,827,061            437,354     52,297 57.7(56.5 – 58.8) 98.7(97.6 – 99.7)
* Age standardised case mortality per 1,000 population and ^age standardised mortality per 100,000
population. Their 95% CIs are in brackets.

To interpret the changes in mortality rates over time, other relevant risk factors must be considered.
Generalised estimating equations were applied to account for hospital level clustering and to adjust
for hospital characteristics (state/territory, availability of 24-hour emergency department [yes/no],
and hospital geographical remoteness) and patient case mix (median age, proportion of ICU vs total
hospitalisations, average Charlson Comorbidity Index, proportion of males, and proportion of
Indigenous people).

Adjusted overall sepsis mortality rates
There was an average annual decrease of 3% in case mortality from 2013-14 to 2017-18, with
adjusted sepsis case mortality 61.8 deaths per 1000 sepsis hospitalisations (95% CI: 49.4-77.2) and
53.9 (95% CI: 44.1-65.8), respectively (Figure 27 and Appendix Table 10). The adjusted mortality
rates over time were very similar with overlapping confidence intervals.

The adjusted mortality rate of sepsis deaths relative to all hospitalisations increased from 130.4 per
100,000 hospitalisations (95% CI: 110.1 - 154.4) in 2013-14 to 155.1 (95% CI: 130.5 - 184.4) – an
average annual increase of 5% (Figure 27 and Appendix Table 10). The sharpest increase of 13%
occurred in 2015-16 compared with the previous year. Similar to the changes in case mortality, the
rates over time were very similar with overlapping confidence intervals as shown in Figure 27 and
Appendix Table 10.

Epidemiology of Sepsis – Preface & Report – February 2020                                             35
You can also read