The Undercount of Young Children - February 2014 - Census Bureau
←
→
Page content transcription
If your browser does not render page correctly, please read the page content below
The Undercount of Young Children
February 2014
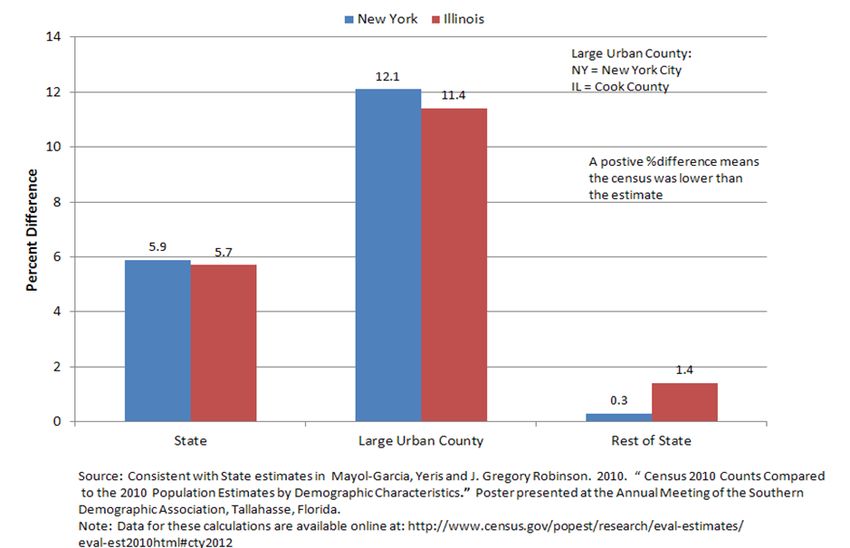
TABLE OF CONTENTS

EXECUTIVE SUMMARY ........................................................................................................................... i
BACKGROUND .......................................................................................................................................... 1
INTRODUCTION ........................................................................................................................................ 4
POSSIBLE CAUSES .................................................................................................................................... 5
Specification errors ....................................................................................................................................... 5
Frame errors .................................................................................................................................................. 5
Nonresponse errors ....................................................................................................................................... 5
Measurement errors ...................................................................................................................................... 6
Processing errors ........................................................................................................................................... 7
SELECTED INVESTIGATIONS................................................................................................................. 7
Age edits, allocations, and substitutions ....................................................................................................... 7
Nonresponse and Proxies .............................................................................................................................. 8
Census Substitutions and PNUM .................................................................................................................. 9
Census Coverage Measurement .................................................................................................................. 11
Vintage 2010 Population Estimates ............................................................................................................ 12
Continuation forms ..................................................................................................................................... 13
Case Studies ................................................................................................................................................ 13
Coverage Follow-up.................................................................................................................................... 14
Duplicate Study........................................................................................................................................... 14
Ethnographic Research ............................................................................................................................... 15
Complex Households .................................................................................................................................. 15
Qualitative Testing ...................................................................................................................................... 16
Statistics Canada Research ......................................................................................................................... 17
Reverse Record Check ................................................................................................................................ 17
Match Study Results ................................................................................................................................... 17
RESEARCH RECOMMENDATIONS ...................................................................................................... 17
Characteristics of Missed Young Children ................................................................................................. 18
Complex Households and Hard-to-Count Areas......................................................................................... 18
Measurement Errors .................................................................................................................................... 19
Nonresponse and Processing Errors............................................................................................................ 19
DISCUSSION ............................................................................................................................................. 20
CONCLUSIONS AND RECOMMENDATIONS ..................................................................................... 20
REFERENCES ........................................................................................................................................... 22
Appendix A ................................................................................................................................................. 25
Appendix B ................................................................................................................................................. 26
Appendix C ................................................................................................................................................. 29
LIST OF TABLES AND FIGURES

Table 1. Demographic Analysis Estimates for 2010 by Single Year of Age, for Children .......................... 2
Table 2. State Differences between 2010 Decennial Counts and Vintage 2010 Population Estimates by
Age Group - State Population Quintiles ....................................................................................................... 3
Table 3. Dual-System Estimates of Net Coverage for Children: 2010 and 2000 Censuses.......................... 4
Table 4. Selected Ages by Person Number and Age Assignment Flag ........................................................ 8
Table 5. Selected 2010 Age Edits, Allocations, and Substitutions by Form Type ....................................... 9
Table 6. Persons Lacking PNUM by Form Type........................................................................................ 10
Table 7. Components of Census Coverage by Age and Sex Groupings ..................................................... 11
Table 8. Age of Duplicates Compared to Age of All Enumerated Persons – 2010 Census........................ 15

Figure 1. Demographic Analysis Estimates of Percent Net Undercount by Race, Sex, and Age: 2000....... 1
Figure 2. Comparison of Census and DA Counts for Adults and Young Children: 1950 to 2010 ............... 3
Figure 3. Percent Difference of 2010 Census Counts and 2010 Estimates by State for the Population Ages
0-4 ............................................................................................................................................................... 12
Figure 4. Percent Difference between 2010 Census Counts and Vintage 2010 Estimates for Population
under Age 5: New York and Illinois ........................................................................................................... 14
EXECUTIVE SUMMARY

This report includes a high-level review of the issue of the undercount of children age 0-4 in censuses and
surveys. It summarizes possible causes for that undercount and highlights areas that the task force was
able to investigate to assess the validity of some of our hypotheses. The primary product is a list of
recommended research (pages 17 - 19). This executive summary includes a broad set of observations and
suggestions for Census Bureau managers; suggestions that we feel could move us in the right direction in
addressing this problem in the future.

1. The undercount of children under age five in the decennial census, and in surveys like the American
   Community Survey (ACS), is real and growing. The task force believes that Demographic Analysis
   (DA) provides the best measure of this undercount in the 2010 Census at 4.6 percent, nationally. This
   is not a new problem and has been present in decennial censuses for many decades. The
   differential undercount of this population across geography and demographics makes this a larger
   problem for some racial and ethnic groups and some parts of the country.

2. Both DA and Census Coverage Measurement (CCM) are valuable tools to measure coverage and
   managers should use both sets of results to understand the areas warranting improvement in future
   censuses. In 2000, DA found that children age 0-4 had higher levels of undercoverage than most
   populations with the exception of black males age 20-59, a group historically recognized as having
   high levels of coverage error. These results should have led to efforts to address coverage of young
   children in the same spirit as efforts to address coverage of black men.

3. The task force found that many of the managers working on the development of methods and the
   design of experiments and evaluations in 2010 were largely unaware of this undercount problem and
   especially the degree to which the problem existed in 2000. This may be due in part to a reliance on
   CCM to identify coverage concerns. As a result, the methods employed in 2010 did not address the
   issue in ways that might have been possible and the 2010 research and evaluation program provides
   no formal or even informal assessments of the likely causes. Staff responsible for designing the 2020
   evaluation program should embed appropriate evaluations and experiments specific to the quality of
   the enumeration of young children. After 2020, we should not find ourselves in the position we are
   today, with limited knowledge of what happened.

4. Census Bureau managers need to understand and communicate the reality of this problem with staff
   responsible for data collection operations in both the census and in surveys such as the ACS. Staff
   working on 2020 planning need to ensure that development work this decade includes a more
   conscious effort to address this problem. Testing in the next few years should reflect a greater
   understanding of how to reduce this undercount. Ideally, 2020 managers should establish a planning
   group with this as their focus and possibly with an external advisory group to support this effort. At
   the very least, there should be someone in the 2020 Research and Planning Office designated to be
   the point person for this issue.

5. The task force is convinced that there is no single cause for this undercount, so there will be no single
   solution. Planners should explore multiple avenues to be confident that we can reduce the undercount
   of young children in 2020 from the levels found in 2010. Demographic and decennial surveys should
   be a part of the discussion and work with 2020 to research the problem and develop improved
   methods.

                                                                                                           i
6. There is a strong relationship between observed differences in population estimates for young
children and census counts of young children in the largest and most densely populated areas.
Minority children in these areas are most at risk of being undercounted. Additional analysis of these
correlates of undercoverage can help us to understand possible sources and solutions.
7. The census requires substitution methods to account for households that enumerators cannot
interview. Research suggests that areas with the lowest levels of cooperation have higher levels of
coverage and nonresponse error. The growing number of hard-to-count households, as evidenced by
increases in household substitutions, can contribute to the risk of miscounting young children.
Without a plan to reduce the noninterviews and proxies and collect better data for these hardest-to-
enumerate populations, the 2020 Census will include nonresponse error that will add to the
undercount of young children. In particular, research that will document, profile, and target the
growing number of “complex households” can set a strong foundation for new methods to improve
their enumeration.
8. Additional research using existing 2010 datasets, such as DA, population estimates, the planning
database, census control and response files, and CCM, holds promise to provide greater insights into
causes and possible solutions. Staff involved in 2020 planning should be mining these data to
understand this problem. This work must look below the national level to determine if certain areas,
populations, or census operations were more likely to have these errors. Our report makes several
specific suggestions. It also notes areas unlikely to be a significant cause (e.g., missed housing units).
9. Administrative records matching with 2010 census data and ethnographic research are other valuable
tools that we believe could shed light on the characteristics of these missed young children and their
households.
10. The task force believes there could be value in directing outreach and promotion for the 2020 Census
to agencies working with parents and young children, especially minority children. It is possible that
advertising that highlights the importance of all children being included in the census could have a
positive impact.
iiBACKGROUND
There is a well-documented undercount of young children (defined here as ages 4 and under) in decennial
censuses (Robinson et al, 1993; O’Hare, 1999; West & Robinson, 1999; Edmonston, 2001; Adlakha et al,
2003; Daponte & Wolfson, 2003; Pitkin & Park, 2005; Zeller, 2006; O’Hare, 2009; Hernandez & Denton,
no date). Societies as varied as China, South Africa, Laos, the former Soviet Union, and Canada
experience this high net undercount of young children (Anderson & Silver, 1985; Anderson, 2004;
Statistics Canada, 2004 and 2010; Goodkind, 2011). This coverage error is not unique to decennial
censuses. Evaluations have shown that Census Bureau surveys like the American Community Survey, the
Current Population Survey, and the Survey of Income and Program Participation also undercount young
children, which can result in biased survey estimates. In addition, these surveys will never fully correct
for this undercoverage, given the use of decennial census counts with known undercoverage as inputs to
final survey controls.
Federal agencies, state and local governments, and advocacy groups make critical assessments of the
well-being of children and distribute funds to support programs for young children based on these
surveys’ estimates (e.g., The Annie E. Casey Foundation, 2012.) Census undercoverage for this
population therefore, has far-reaching implications.
Census Coverage Measurement (CCM) and Demographic Analysis (DA) rely on different approaches to
evaluate coverage and each can provide insight into both historical and current issues surrounding our
success in counting young children in decennial censuses. Vintage 2010 population estimates are an
additional source of information that is useful for evaluating coverage by age, especially for young
children.
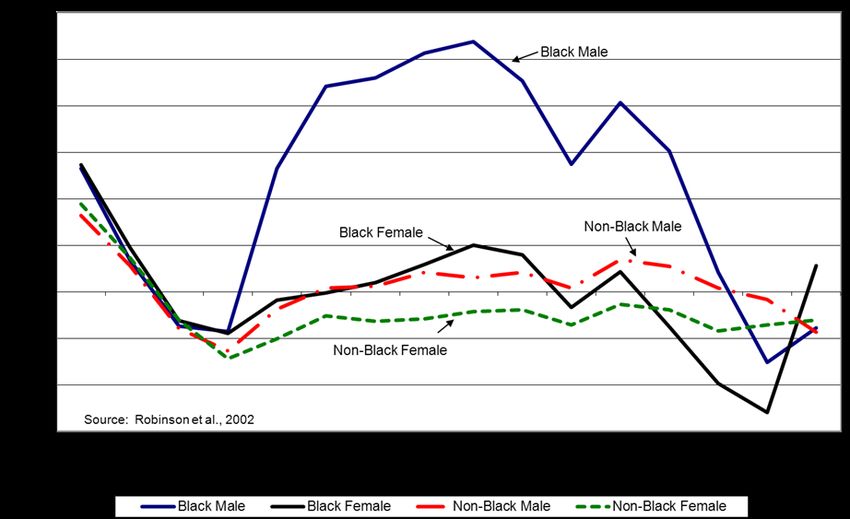
Population Division bases DA estimates for this population group entirely on estimated births, deaths, and
migration, so we expect those estimates to be accurate. Figure 1 shows selected 2000 net undercount rates
based on DA by race, sex, and age.
Source: Robinson, 2010
Figure 1. Demographic Analysis Estimates of Percent Net Undercount by Race, Sex, and Age: 2000
1This figure clearly demonstrates that young children share some of the highest net undercounts with
young black males, a group that has received a lot of attention in coverage measurement and
improvement efforts in the past several decades. Despite these high rates of undercoverage for young
children, this problem has not received the same attention as the undercount of black males. Decennial
censuses have developed special coverage improvement procedures to address the coverage of black
males, something needed for young children.
In 2010, DA estimated an undercount of almost 1 million children, ages 0 to 4 (about 4.6 percent). Table
1 summarizes these results by single year of age highlighting that the youngest ages have some of the
greatest estimated undercounts among all children.
Table 1. Demographic Analysis Estimates for 2010 by Single Year of Age, for Children
Revised
2010 Census Demographic Net
Population Analysis Estimate Undercount Percent Net
Age (000s) (000s) (000s) Undercount
0 3,944 4,083 139 3.4
1 3,978 4,210 232 5.5
2 4,097 4,338 241 5.6
3 4,119 4,326 207 4.8
4 4,063 4,214 151 3.6
Total 0 to 4 20,201 21,171 970 4.6
5 4,057 4,170 113 2.7
6 4,066 4,190 124 3.0
7 4,031 4,126 95 2.3
8 4,046 4,133 87 2.1
9 4,148 4,185 37 0.9
Total 5 to 9 20,348 20,804 456 2.2
10 4,173 4,206 33 0.8
11 4,114 4,155 41 1.0
12 4,106 4,119 13 0.3
13 4,118 4,112 -6 -0.1
14 4,166 4,142 -24 -0.6
15 4,243 4,170 -73 -1.8
16 4,316 4,246 -70 -1.6
17 4,395 4,322 -73 -1.7
Total 10 to 17 33,631 33,472 -159 -0.5
Total 0 to 17 74,180 75,447 1,267 1.7
U.S. Total 308,746 308,346 -400 -0.1
Source: U.S. Census Bureau, 2012
Notes: Middle Series DA Estimate. A positive estimate denotes a net undercount and a negative estimate
denotes a net over count.
O’Hare (2012) shows that the net undercount rate for young children has increased substantially since
1980, while the net undercount rate for adults has decreased to the point that there were net over counts in
the 2000 and 2010 U.S. Decennial Censuses (Figure 2). The net undercount rates for young children in
the U.S. Decennial Census increased from 1.4 percent in 1980 to 4.6 percent in 2010, while the net
undercount rate for the adult population (age 18+) went from an undercount of 1.4 percent in 1980 to an
over count of 0.7 percent in 2010. The rapid rise in the undercount rate of young children underscores the
importance of examining this population in more detail.
2Source: O’Hare, 2012
Figure 2. Comparison of Census and DA Counts for Adults and Young Children: 1950 to 2010
While DA can point to national-level undercoverage, we need to use population estimates to look at lower
levels of geography. Here we see the problem become especially concerning. Table 2 summarizes state-
level differences between Vintage 2010 population estimates and 2010 Census counts, distinguishing
between children 0-4 and children age 5 and older. From this comparison, we see that relatively large
differences exist for young children in nearly every state. Pages 12-13 include additional details on state-
level differences based on Vintage 2010 population estimates.
Table 2. State Differences between 2010 Decennial Counts and Vintage 2010 Population Estimates by Age Group - State
Population Quintiles
Difference Between Population Estimates and Census Counts
(Census-Estimates)
Numeric Percent Difference
Age 0–4 Age 5 and older Age 0–4 Age 5 and older
Smallest Quintile -8,538 143,811 -1.5 1.7
Second Smallest Quintile -60,414 179,549 -3.6 0.9
Middle Quintile -88,402 253,790 -3.5 0.7
Second Largest Quintile -193,210 136,685 -4.0 0.2
Largest Quintile -705,111 643,089 -6.1 0.4
Total -1,055,675 1,356,924 -5.0 0.5
Source: O’Hare, 2013.
Dual system estimates from the CCM program also provide coverage estimates for young children. CCM
estimated the 2010 net undercount for children aged 0-4 to be about 146,000 (see Table 3). Despite
reductions in net coverage error as measured by CCM for some population groups in the 2010 Census,
CCM estimates that the undercount of children aged 0-9 grew from an overcount of 0.46 percent in 2000
to an undercount of 0.20 percent in 2010. In 2010, when CCM derived separate estimates for the youngest
children, CCM estimated that group to have an undercount of 0.72 percent. CCM staff believes that
correlation bias in the CCM could overstate true coverage for young children, suggesting that DA
estimates are a better measure of coverage for this population. Pages 11-12 include additional CCM
results that the task force reviewed.
3Table 3. Dual-System Estimates of Net Coverage for Children: 2010 and 2000 Censuses
Census Net
Characteristic Count Undercount Standard Percent Net Standard
(000s) (000s) Error Undercount Error
2010 Census
U.S. Total 300,703 -36 429 -0.01 0.14
Aged 0 – 17 73,902 -242 164 -0.33 0.22
0 – 9a 40,472 80 119 0.20 0.29
0–4 20,158 146 81 0.72 0.40
5–9 20,315 -67 62 -0.33 0.31
10 – 17 33,430 -322 96 -0.97 0.29
2000 Census
U.S. Total 273,643 -1,332 542 -0.49 0.20
Aged 0 – 17 71,905 NA NA NA NA
0 – 9a 39,588 -180 130 -0.46 0.33
0–4 19,138 NA NA NA NA
5–9 20,450 NA NA NA NA
10 – 17 32,318 -422 129 -1.32 0.41
Source: Davis and Mulligan, 2012 and U.S. Census Bureau, 2000 - Table PCT013.
Notes: A positive estimate denotes a net undercount and a negative estimate denotes a net overcount. Estimates are
presented in thousands and are rounded. The 2010 census population count in this table excludes persons in Group
Quarters and persons in Remote Alaska.
a. For the 2000 Census Accuracy and Coverage Evaluation Revision II, the “0-9” Age/Sex group was a single group.
NA = not available.
BOLD - Estimate is significantly different from zero at the 90-percent confidence level.
INTRODUCTION
In 2013, staff at the Census Bureau with an interest in the issue of undercoverage of young children
assembled as an informal task force to review existing information about the undercount of young
children in the decennial census, identify possible causes of this problem, and investigate available
information within the Bureau that might allow us to evaluate those causes. Bill O’Hare, a Census Bureau
Fellow, also was a member of this group.
This report is the only deliverable from the task force and it includes a list of ideas identified as possible
causes, the results of several investigations undertaken by the task force, a set of research
recommendations, and a summary. We hope that 2020 planners will consider this set of research
recommendations as they define the research agenda leading to the 2020 Census. There was strong
agreement within the task force that the Census Bureau has several untapped data sources that would
allow us to understand this problem. Mining those data is critical to developing strategies to reduce these
coverage errors in the 2020 Census.
4POSSIBLE CAUSES
The task force brainstormed possible causes of a net undercount of young children in the 2010 Census.
Net undercount is the product of two different forms of coverage error – over counting and under
counting. Most of the possible causes that the task force identified involved under counting –
explanations for why the census misses young children. It may be useful for additional brainstorming to
identify causes of erroneous enumerations such as duplicates that may mask total coverage error. While
our primary concern was the 2010 Census, we tried not to focus on unique 2010 issues given that surveys
and past censuses also include this undercoverage problem. Appendix B includes the results of
brainstorming about causes.
In this section, we organize the possible causes by source of survey error. We used the following five
major sources of nonsampling error defined by Biemer & Lyberg (2003) –
• specification error – when the concept implied by the survey question and the concept that
should be measured in the survey differ;
• frame error – error that arises from the construction of the sampling (or in the case of the census,
enumeration) frame;
• nonresponse error – error introduced when a sampling unit does not respond to any part of the
survey, partially completes the survey, or provides incomplete responses to open-ended
questions;
• measurement error – when respondents deliberately or unintentionally provide incorrect
information, interviewers falsify, influence, or misrecord responses, or questionnaires are poorly
designed and lead to misunderstood questions; and
• processing error – errors that arise during editing, data entry, coding, weighting, or tabulation.
Specification errors would be a source of undercounted children if the choice of methods, such as the
rostering instructions, did not match the intended design concept that the census should include the total
resident population, including young children. We did not identify any possible causes due to
specification errors. While greater clarity in the rostering instructions may reduce error, we account for
those under measurement errors.
Frame errors contribute to this undercount when we do not include the place where a child is living on
the frame used for data collection. We identified the following potential causes of undercounting young
children due to frame errors:
• The Master Address File (MAF) does not fully represent all Group Quarters (GQ) facilities that
include young children. The census is more likely to miss small GQs, for example. If young
children are living in these small GQs, we may miss them.
• Housing units with young children are not included on the MAF. This might be true for single-
unit structures in rural areas or units within multi-unit structures in more urban areas.
• Our "frame" is a list of addresses and does not always correspond to housing units.
Nonresponse errors can cause an undercount of young children when we are unable to collect complete
data for an address with a child. Processing errors occur when the methods we use to correct for unit or
item nonresponse fail to account for the child (see below). We identified the following possible causes
due to nonresponse error:
• Addresses with young children are census noninterviews (due to access problems or lack of
cooperation).
• A proxy provides incomplete information about household members and their ages.
5Measurement errors contribute to the undercount of young children when we collect data for an address
but the methods we used resulted in excluding a child who should have been included. Measurement
errors include respondent, interviewer, and questionnaire design errors. We identified the following
potential causes of undercount due to measurement error, and summarize them by these three specific
sources.
Respondent error:
• The distinction between addresses and living quarters and a respondent’s interpretation of these
concepts can result in misreporting.
• Unclear or counter-intuitive residence rules result in respondent error in creating an accurate
roster that includes all children. Household respondents complete the roster in error due to the
complexity of the residence rules for complex and large households that may include young
children.
• If census questionnaires with incomplete addresses are misdelivered, the wrong household may
receive and complete the questionnaire, leaving uncounted the intended household with a child.
• If a child is living in a household that moves around the time of the census, the respondent may
neglect to include them.
• If a child is living with a parent who has joint custody, they may not be included on the roster.
(More likely, though, they will have been included on both rosters – a potential source of
overcount.)
• Fear of government, political factors, or respondent fatigue may cause a household respondent to
intentionally leave a child off the roster (this may include completed mail forms without young
children or uncooperative respondents during nonresponse follow-up).
• Large households choose to report only the first six people who will fit on the form and they
leave off the youngest children (who they traditionally list last).
• Language or literacy limitations cause the respondent to report in error, leaving young children
off the form.
• Respondents misreport complex households (doubled up families, temporary living
arrangements) especially subfamilies with young children.
• Household respondents misreport ages of young children due to recall error or due to a
misunderstanding of how to answer the age question for children under 1 (e.g., entering 11 for 11
months).
Interviewer error:
• If interviewers conduct follow-up interviews at the wrong address, they may miss the intended
household that included a child. Initial misdelivery of census questionnaires can cause this type of
error.
• Interviewer falsification contributes to this undercount if the actual household included a child
and the interviewer fabricated a case without a child.
• Interviewer misunderstanding of rules of who to include (especially in complex households) and
no incentive to probe for additional persons could result in an interviewer erroneously leaving a
child, or a subfamily with a child, off the form.
• Reliance on proxies when repeated attempts cannot contact a household member may result in
incorrect or incomplete information about young children living in the household.
Questionnaire design error:
• If a child is born before census day, but after the respondent completed the mail form (given the
early mailing of forms), we will undercount the newborn child.
• The design of the questionnaire with limitations of space for large households could lead a
respondent to truncate a household, leaving the youngest children off.
6• We optimize the questionnaire design for traditional families and it may not work well when
multiple families live at the same address or when subfamilies with young children are temporary
residents.
Processing errors will contribute to the undercoverage of young children when children who are
enumerated (mail forms, nonresponse follow-up, coverage follow-up) are lost during capture or
processing of census materials. This can also occur if the imputation or substitution methods used in the
census fail to account for young children correctly. We identified the following as possible causes due to
processing error:
• Children listed on continuation forms that we do not properly link are lost.
• Local Census Office staff mishandles nonresponse follow-up forms resulting in lost
questionnaires requiring substitution methods.
• Addresses that cannot be interviewed in the census and require whole household substitution may
use substitution methods that undercount young children.
• When the primary selection algorithm detects multiple forms, it may choose the wrong form,
leaving a child uncounted.
• Efforts to improve coverage using coverage follow-up identify potentially missed young children
but we cannot confirm them due to coverage follow-up limitations.
• If we use administrative records data for young children in GQs, ages may be incorrect.
• Our imputation methods (allocating for missing ages, missing person characteristics) are based on
traditional household structures and relationships and do not properly account for young children
living in complex households.
• A young child’s age or date-of-birth is missing from the record and the imputed age is over four.
• Imputation of age in GQs is limited due to lack of relationship data. If we enumerate young
children in GQs without ages, imputation may not account for them.
SELECTED INVESTIGATIONS
This section summarizes some of the investigations that the task force pursued to learn more about
available sources of information about possible causes of undercoverage. We did not intend this to be an
exhaustive list of potential investigations, only those we were able to explore given our limited available
resources.
Age edits, allocations, and substitutions
Staff from the Population Division briefed the task force on the age edits and summarized 2010 allocation
rates and imputed age distributions. Population Division also created a detailed spreadsheet with
additional information that might shed light on operations with high age allocations and where allocated
age distributions for young children are especially high or low. Specifically, the files include counts and
distributions of age, age allocation, person number crossed by the field operations code and form type and
unedited reported age crossed by person number and field operations code.
The 2010 Census used a two-part age question, which asked, “what is your age and what is your date of
birth?” The 2010 Census age edit evaluated the reported information and determined a final age for each
enumerated individual. For most of the population, minimal editing, if any, was necessary to determine a
final age. When this was not the case, we used hot deck allocation to determine a final age. In the 2010
Census, hot deck allocation accounted for 3.6 percent of final ages. Note the discussion below does not
include any of the 1.9 percent of final ages that we assigned when all household members were missing
and the data required substitution.
7Looking at the 2010 Census age distribution by allocation status (allocated final age/not allocated final
age) does not point to a systematic non-assignment of ages 0-4 when allocation was necessary. Table 4
shows that for persons listed on the form as the first six persons (persons 1-6) the age distributions for
those with a not allocated age and those with an allocated age show similar patterns, although younger
ages are slightly under-allocated relative to the reported distributions. While 6.3 percent of the not
allocated ages were 0-4, only 5.0 percent of the allocated ages were 0-4. For both groups most persons
were age 18+ and of those below 18, children 5-13 accounted for the largest group followed by ages 0-4
and 14-17.
For persons listed as the 7th person, 8th person, etc. on the form (persons 7 and greater), a slightly different
pattern emerged in that about 1.6 times as many persons with an allocated age were age 18+ compared to
those with a reported age. For the under 5 population the reported distribution was over 30 percent while
less than 10 percent of the allocated ages were 0-4. This, at first glance, seems to imply a possible
allocation issue. However, looking at the hot deck allocation matrix for some of these 39,403 persons
with an allocated age of 18+ revealed that they primarily came from a matrix that handled persons that
were non-relatives and persons that were family other than the householder. The relationships of these
persons were roommate, boarder, housemate, aunt/uncle, and grandparents and thus an age 18+ may be
reasonable.
These findings showed no evidence that the hot deck systematically allocated ages other than 0-4 thus
contributing to an undercount. Further, it was determined that the size of the one group in question,
39,403 persons allocated an age of 18+ with person numbers 7 and greater, was not of the magnitude of
the estimated undercount. The task force posed the question of whether finding similar distributions is
sufficient to rule out age imputation error. Is it possible, for example, that young children are more likely
to have a missing age? Some amount of age imputation error may exist and the task force suggests
further research to understand the true age characteristics of the persons with missing ages (perhaps a
matching study) and the optimal imputation method and allocation rules.
Table 4. Selected Ages by Person Number and Age Assignment Flag
Person Number 1-6 Person Number 7 and greater
NOT Allocated Allocated NOT Allocated Allocated
Age Number Percent Number Percent Number Percent Number Percent
(000s) (000s) (000s) (000s)
0-4 18,167 6.3 537 5.0 1,057 30.3 6 9.6
5-13 34,274 11.9 925 8.7 929 26.6 9 15.9
14-17 16,167 5.6 418 3.9 212 6.1 4 6.9
18+ 219,840 76.2 8,800 82.4 1,296 37.1 39 67.6
Total 288,449 100.0 10,681 100.0 3,494 100.0 58 100.0
Source: 2010 Census CUF/CEF, special tabulation by POP
Nonresponse and Proxies
Population Division provided information about imputation rates, noninterviews, proxies, and other
nonresponse problems. Table 5 summarizes national-level distributions of records with missing age data,
by type of form and type of allocation for the total population and for the population age 0-4. The task
force made the following observations:
• The inconsistent and “missing data” rates are not disproportionately high for the young child
population (compare first and second rows.). For example, hot deck allocation accounts for 2.7
8percent of children under age 5—compared to 3.5 percent for the total population. Records
substituted or imputed by edit represent 2.1 percent for children under 5 and 1.9 percent for all
records. These 6 million “dummy records” where the demographic data were substituted with
essentially no information to work with are perhaps the most suspect records regarding the accuracy
of the imputed characteristics. We questioned if the rates should be higher for young children,
especially for the substituted by edit (“dummy”) records. More detailed classification of the data
might be able to shed more light on this issue.
• Two-thirds of all records come from mail return forms (204.6 million) and the inconsistent/missing
data rates are relatively low (e.g., overall hot deck allocation of 0.7 percent compared to 3.5 percent
for all records). The edit/allocation rates for Coverage Follow-up Interviews (16.1 million, or 5
percent of all records) are also low. The possibility of under allocation of young children may be less
suspect in these “higher quality” census forms.
• Enumerators in the nonresponse follow-up (NRFU) operation completed almost 70 million census
forms. The overall missing data rates are significantly higher than for mail or coverage follow-up.
Hot deck allocation of age accounted for 12.3 percent of all NRFU records—more than three times
higher than the rate of 3.5 percent for all records. In terms of numbers of allocations, the records with
age hot decked in NRFU account for 79 percent of all hot deck allocations. In geographic areas with
lower levels of mail response and higher NRFU workloads, we would expect to see higher rates of
imputed ages.
• While the overall hot deck allocation rates are high for NRFU records, the rates are not
disproportionately high for young children (e.g., the hot deck allocation is 7.7 percent for children
under 5 and 12.3 percent for the overall population). The task force questioned this and suggested
that more detailed classification of the data such as the NRFU records classified by person number,
race and Hispanic origin, and “hard-to-count” characteristics may explain why this rate appears low.
Table 5. Selected 2010 Age Edits, Allocations, and Substitutions by Form Type
Age/DOB Hot Deck Imputed or
Consistent Allocation Substituted
Operation/Form Type Population Total (%) (%) by Edit (%)
ALL Records Total 308,745,538 89.2 3.5 1.9
0-4 20,201,272 89.4 2.7 2.1
Mail Returned Forms Total 204,599,181 95.7 0.7 NA
0-4 12,023,046 94.5 0.6 NA
Nonresponse Follow-up Forms Total 69,602,342 77.7 12.3 NA
0-4 5,977,733 84.3 7.7 NA
Coverage Follow up Interview Total 16,104,842 95.4 0.5 NA
0-4 1,367,102 95.4 0.2 NA
Group Quarters Total 7,434,076 76.2 6.3 NA
0-4 35,029 67.3 14.9 NA
Source: Tabulations from the 2010 CUF/CEF by Julie Meyer.
NA – Distribution of substitutions by form type is not available
Census Substitutions and PNUM
Staff from the Population Division and the American Community Survey Office discussed information
with the task force about the persons with no person number in the POP tallies by age. The Decennial
Systems and Contract Management Office was the primary source of information about these cases. In the
92010 Census, about 6 million person records lacked a person number (no PNUM value). These are
“dummy records” created for GQs and households that were either noninterviews or cases with lost data.
The census uses a substitution process to determine the number of persons in occupied households
without a population count and in households allocated as occupied when the status also could not be
determined. Table 6 summarizes some basic information about these persons. We estimate that we
substituted about 4.6 million persons into households with a known population size and substituted about
1.2 million persons when we also had to impute the status and/or the household size. From Table 6 we see
that the greatest number of persons with no person number were on forms with incomplete enumerations
(missing person records). We created close to 5 million of these persons and imputed their ages.
Table 6. Persons Lacking PNUM by Form Type
Percent of
Count of Total PNUM
Form Type/Origin persons Missing
No return received, count determined from OCS pop
count or from OCS and status variables (530 and 531) 35,592 0.6
GQ ICR, MCR, SCR included in GQE universe, no
return received (532) 19,351 0.3
MAFID count imputed as vacant or occupied and all
persons imputed (534) 1,210,954 19.7
Dummy person records created when determined to
have incomplete number of person records; e.g., pop
count is 3 with 1 person record means 2 dummy
records created (537) 4,784,612 77.9
Dummy person records created when reconciling
GQPOP (count review adds) (539) 50,682 0.8
Dummy person records created for continuation form
linking fix (540) 42,200 0.7
Total PNUM missing 6,143,491 100.0
Source: Preliminary data in email from Dan Philipp, DSCMO
Note: Numbers in parentheses under form type/origin correspond to outcome codes
Published tables for 2010 (Table P44) indicate that 5,770,791 persons (1.9 percent) were substituted in
the 2010 head count; in Census 2000 3,441,154 persons required substitution (Table P039) a rate of 1.2
percent (U.S. Census Bureau, 2013). County-level tabulations of population substitutions indicate the
variability in substitution rates across the nation. The areas with rates above 5 percent (e.g., Blanco
County, TX at 9.9 percent and Rio Arriba, NM at 9.6 percent) may be especially prone to undercounts of
young children. Census staff could determine if there is a relationship between areas with high rates of
substitutions and areas with suspected undercoverage of young children.
10Census Coverage Measurement
Staff from the Decennial Statistical Studies Division briefed the task force on the CCM results and
provided answers to many questions about potential uses of CCM data to explore this undercount
problem. In 2010, the CCM program used Duel System Estimation (DSE) to produce population
estimates and estimates of the net coverage of the household population. The CCM estimates do not
cover the GQ population, but this should have little impact on the coverage estimates for young children
since so few young children live in GQs. For the 2010 Census, the CCM program estimated a small net
undercount (0.72 percent) for children aged 0 to 4. This estimate is noticeably lower than that from DA. A
possible explanation for the difference is correlation bias in the DSE. Correlation bias can lead to an
underestimate of the true population level if persons missed in the census are more likely to be missed in
the CCM survey than persons captured in the census (i.e., the assumption of independence between the
census and CCM survey fails).
For 2010, the CCM program also produced estimates of the components of census coverage, shown in
Table 7. The estimate of duplication for children 0 to 4 (3.2 percent) and rate of whole-person imputations
(2.2 percent) are consistent with those of the total population (3.0 percent and 2.0 percent, respectively).
The rate of omissions is 6.6 percent. The task force saw value in understanding the characteristics of these
omissions.
Table 7. Components of Census Coverage by Age and Sex Groupings
Age and Sex Census Correct Erroneous Enumerations (%) Whole-Person Percent Omissions
Group Count Enumerations Duplication Other Reasons Census Undercount (%)
(000s) (%) Imputations (%)
(%)
U.S. Total 300,703 94.7 2.8 0.5 2.0 -0.01 5.3
(0) (and whether there was a whole household or partial household of person nonmatches. These and other
explorations of the CCM data could provide useful information regarding the undercount of young
children; however, the Census Bureau has not conducted any such analyses.
The CCM data also contain a sample of movers and shows that young children make up a larger
proportion of the mover population than the nonmover population. Given differences in coverage error
for movers and nonmovers, this could have an impact on the coverage of young children in the census.
We should examine this aspect further.
Vintage 2010 Population Estimates
We can compare Vintage 2010 Population Estimates with 2010 Census Counts for young children at
lower geographic levels to study the distribution of undercoverage. These yearly population estimates
from the Census Bureau provide estimates of young children that are independent of the previous census
using a methodology very similar to that used in DA. As is true with the DA method, the Census Bureau
bases the yearly population estimates on a simple demographic accounting equation that uses number of
births, deaths, and net migration. A review and analysis of subnational results, supplemented with other
geographic characteristics can reveal potential correlates of undercoverage.
Staff from the Population Division shared research using these population estimates to assess differential
undercounts of young children across states. Figure 3 sorts the states on the size of the estimated percent
net undercount.
Source: Appendix A.
Figure 3. Percent Difference of 2010 Census Counts and 2010 Estimates by State for the Population Ages 0-4
O’Hare (2013) uses these population estimates to examine county-level and state-level differences, noting
that the national net undercount rate for the population age 0 to 4 varies substantially across counties.
12Appendix A provides state-level undercount estimates for young children indicating that AZ, CA, FL,
TX, and GA have some of the highest estimated undercounts of young children (O’Hare, 2013). O’Hare
finds that larger counties account for the vast majority of the national net undercount for the population
age 0 to 4. This analysis identifies major undercounts of young children in places such as Los Angeles
County, CA and Miami-Dade County, FL. The 128 counties with more than a half million total
population in 2010 account for more than 90 percent of the national net undercount of the population age
0 to 4.
This type of information serves two important purposes – (1) it can help us to focus our attention on the
areas most affected by undercoverage and (2) it can reveal characteristics that can point to causes and
potential solutions.
Continuation forms
One concern was that young children enumerated on continuation forms in Nonresponse Follow-up or
Update Enumerate fieldwork might have been lost if the continuation forms were not properly completed
or linked to the parent questionnaire. A staff member from the Decennial Statistical Studies Division
shared research by Jackson (2013) that showed that unlinked continuation forms were included in the
final census counts for 717 housing units, enumerating 1,252 people. It is unknown exactly how many
unlinked continuation forms were not included in the final census count. It is also unknown how many
continuation forms were lost and not data captured, thus requiring imputation of the lost person records.
Anecdotal evidence suggests that this may have been an issue in some local census offices.
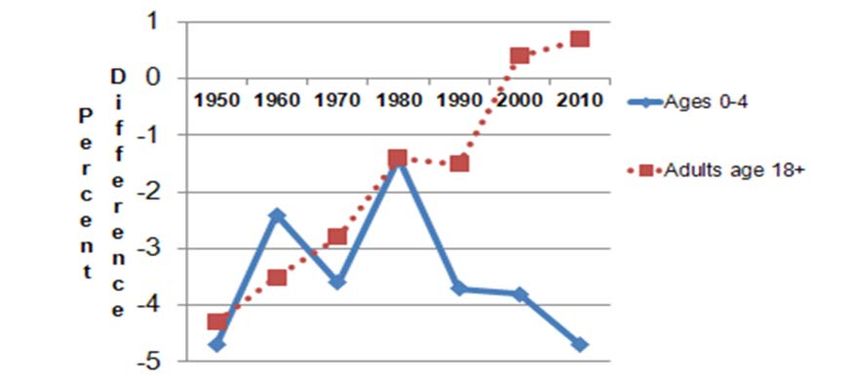
Case Studies
A staff member from the Population Division also summarized some research that reveals strong
differentials in the net undercount of young children across geographic areas. One example (see Figure 4)
illustrates the striking differences between the 2010 census counts and population estimates in two urban
areas (New York City and Cook County, IL) and the rest of each state. He found the overall state
average (5.9 for NY, 5.7 percent for IL) masks large within-state variations just like the national averages
in Table 1 masks wide variations across states shown in Figure 3 and Appendix A. Previous research
demonstrates that these large net undercounts of young children in urban areas like New York City, Cook
County (Chicago), Philadelphia, and Wayne County (Detroit) are longstanding over recent censuses
(Robinson et al, 1993).
The pattern of the percent differences within each state is highly correlated with the minority
concentration in the state, as is the association with the mail return rate. Over two-thirds of children
under age 5 in New York City and Cook County are minority, compared to less than one-third in the “rest
of state.” But perhaps more relevant are the much higher rates of “hard-to-count” attributes in the two
urban counties compared to state averages, such as poverty rates, percent of households in renter-
occupied units, and percent in “not husband-wife” families. The Planning Database contains these and
other “hard-to-count” variables that can aid the investigation of factors affecting coverage of young
children (Robinson et al, 2007).
The data for these places would provide useful “case studies” to examine the components of error that
may bear on the undercount of young children in the census and surveys. Appendix C presents a
prototype of such a case study, using the New York City and rest of New York state data as the example.
In addition to documenting the hard-to-count characteristics that may contribute to the differential
undercount of young children in New York City, the case study also examines the differences in the
13imputation and substitution rates across the geographic areas (related to the discussion on pages 7-10).
Robinson noted the possibility that the allocation procedures under-assign ages to young children in a
“hard-to-count” area like New York City.
Figure 4. Percent Difference between 2010 Census Counts and Vintage 2010 Estimates for Population under
Age 5: New York and Illinois
Coverage Follow-up
The task force identified the Coverage Follow-up (CFU) operation as one special effort to improve the
coverage of young children in the 2010 Census. A staff member from the Decennial Statistical Studies
Division reported that in 2010 the CFU added a total 350,901 persons to the final census count, of which
15.6 percent (54,695) were age 0 to 4. This suggests that the CFU operation is useful in reducing the
undercount of young children. The 2010 evaluation also found that we could have added additional
young children to the census if more cases had completed CFU interviews. Of the 396,330 cases sent to
CFU because they marked the ‘children’ undercount category, only 164,975 completed a CFU interview
(Source: Govern et al, 2012; Table 44, and Tables 13 & 26).
Duplicate Study
One theory regarding the undercount of young children is that the undercount could be due to a lack of
duplication of young children. By design, the 2010 Census did not remove the majority of identified
person duplicates. A staff member from the Decennial Statistical Studies Division shared results from the
Duplicate Person identification operation, an evaluation undertaken in 2010 to understand the
characteristics and scale of person duplication reflected in final census data.
The Duplicate Person Identification algorithm found 7,454,171 million duplicates in the census. Table 8
displays age distributions for these duplicates and for the total 308,745,538 person records enumerated in
14the final 2010 Census records. Note that this study used the age data reported on the questionnaire without
imputation or editing for the duplicates, and the ages for the final census results after edit and imputation,
so there are no inconsistent or missing data for that column. There is a large over-representation of
persons aged 15 to 24 among the population of duplicates, as compared to the population at large. The
population aged 0 to 4 years old does not appear to suffer from a ‘lack of duplicates’ as much as other age
groups, such as persons in their 30s and 40s.
Table 8. Age of Duplicates Compared to Age of All Enumerated Persons – 2010 Census
Age in Years Duplicates Found All Persons Enumerated
in the Census in the Census
Number Percent Number Percent
Under 5 years 447,959 6.0 20,201,362 6.5
5 to 9 years 526,291 7.1 20,348,657 6.6
10 to 14 years 580,662 7.8 20,677,194 6.7
15 to 19 years 853,916 11.5 22,040,343 7.1
20 to 24 years 878,278 11.8 21,585,999 7.0
25 to 29 years 465,653 6.2 21,101,849 6.8
30 to 34 years 353,585 4.7 19,962,099 6.5
35 to 39 years 325,561 4.4 20,179,642 6.5
40 to 44 years 335,884 4.5 20,890,964 6.8
45 to 49 years 383,374 5.1 22,708,591 7.4
50 to 54 years 399,302 5.4 22,298,125 7.2
55 to 59 years 378,233 5.1 19,664,805 6.4
60 to 64 years 354,145 4.8 16,817,924 5.4
65 to 69 years 280,943 3.8 12,435,263 4.0
70 to 74 years 212,999 2.9 9,278,166 3.0
75 to 79 years 170,811 2.3 7,317,795 2.4
80 years and over 323,127 4.3 11,236,760 3.6
Inconsistent 171,474 2.3 NA NA
Missing 11,974 0.2 NA NA
Total 7,454,171 100.0 308,745,538 100.0
Source: Heimel & King, 2012
Ethnographic Research
A staff member from the Center for Survey Measurement gave the task force an overview of the
ethnographic studies she conducted as part of the 2010 Census. This research determined that across all
test sites, the 0-4 age cohort had some of the highest proportions of persons with possible coverage error.
The research also had reviewed a few case studies to see if they might shed any light on the reasons for
these potential errors. Many of the coverage errors appeared to be due to whole household omissions,
rather than rostering errors within a household. For more details on this research, see Schwede & Terry
(2013).
Complex Households
A staff member from the Center for Survey Measurement shared 1990 and 2000 census data on “complex
households.” She worked with staff in Population Division to define a set of household types based on the
relationship data reported for all persons living within a housing unit. This categorization distinguished
between “noncomplex” and “complex” households and identified the following types of complex
households:
• Complex family households –
o Blended families (with spouse)
o 2-generation ascending
o 2-generation in-law descending
15o 3-generation: own kin only
o 3-generation: includes in-laws
o Skip generation (e.g., householder plus grandchild)
o Laterally extended (e.g., householder plus sibling)
o Family household with nonrelatives
• Complex nonfamily households
• Other combinations
This tabulation showed, for example, that “complex” households grew from 18.4 percent to 21.0 percent
of all households between 1990 and 2000 (a 2.7 percent increase). She also explained that she was
working with Population Division to produce similar distributions based on the 2010 Census. The task
force discussed the value of these data and proposed that if she requested this type of tabulation that it
would be useful to identify complex households with young children.
Since her briefing to our task force she has received preliminary tabulations of 2010 data by complex
household types and race and is beginning to review it. She is expecting a further breakdown of these
data by the presence/absence of young children in early 2014.
Qualitative Testing
A staff member from the Center for Survey Measurement had several observations from her cognitive
testing of coverage questions on census forms and from the NRFU qualitative evaluations. She felt that
this line of research could help to identify causes for undercoverage of young children. She noted that she
was aware of instances with multiple families, for example, where the household respondent did not
include children in the second family. It may be possible to oversample these types of households for
future cognitive testing. She commented that no one had highlighted this issue of undercounted young
children as something worth studying so researchers did not optimize previous work to answer these
questions.
Staff from the Center for Survey Measurement identified the following general factors that they have seen
while conducting qualitative work over the years that could contribute to errors in counting young
children – respondent and interviewer behavior, question wording, housing unit nonresponse, imputation,
cultural factors, and language factors. They provided the task force with the following list of specific
ideas:
• respondents deliberately not mentioning kids for fear of some reprisals or bad outcomes from
landlords, immigration agencies, social service agencies, etc.,
• respondents not identifying young kids because the roster question asks for “people” and babies and
infants may be considered too young to include,
• nonrelative or proxy respondents who don’t know the ages and birthdates of the kids in household
(some of these proxy people have also reported feeling that they don't have "permission" to give
personal information about other people's minor children),
• greater mobility and difficulty of counting families with kids ages 0-5, but better counting of them
when the kids are more tied to a household due to school,
• totally missed households,
• enumerators not reading questions as worded in Nonresponse Follow up and Update Enumerate,
• cultural factors, such as delays in naming babies until they are a certain age to make sure they live,
• cultural patterns of calculating age (e.g., a newborn baby is 1 year old, not 0), and the lunar calendar
is used, and
• general distrust of the government – none of the government’s business.
16You can also read