IMT spectrum demand - Coleago Consulting Ltd Estimating the mid-bands spectrum needs in the 2025-2030 timeframe
←
→
Page content transcription
If your browser does not render page correctly, please read the page content below
IMT spectrum demand

Estimating the mid-bands spectrum needs in the
2025-2030 timeframe

A report by

Coleago Consulting Ltd

14th of December 2020

              The GSMA endorses the findings and
              conclusions of this report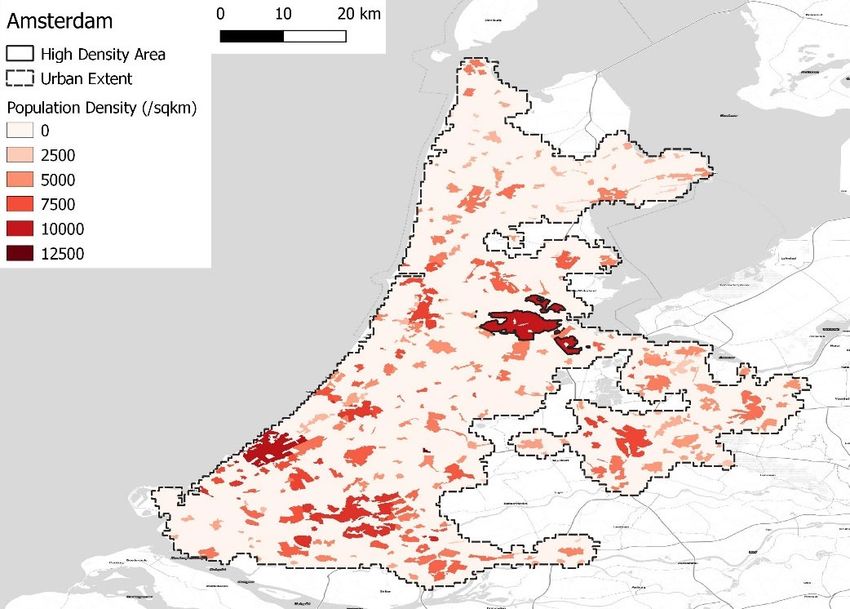
Content

1           Executive summary .............................................................................. 1

2           The requirements for 5G drive the need for IMT spectrum .................. 4
2.1         Spectrum to deliver the 5G vision ........................................................ 4
2.2         Low, mid, and high frequency bands.................................................... 5
2.3         Spectrum used for mobile in the European Union ................................ 5

3           Estimating spectrum requirements in the context of 5G ....................... 6

4           Spectrum for citywide speed coverage ................................................ 8
4.1         Mix of spectrum to deliver 5G .............................................................. 8
4.2         Spectrum demand model linked to the ITU-R IMT-2020 requirements 9
4.2.1       The 100 Mbit/s DL user experienced data rate requirement ................ 9
4.2.2       The area traffic demand side – key assumptions ............................... 10
4.2.3       The area traffic capacity supply side – key assumptions ................... 13
4.3         Spectrum supply model to meet the DL area traffic demand in cities. 16
4.3.1       Introduction ........................................................................................ 16
4.3.2       Paris, France ...................................................................................... 19
4.3.3       Amsterdam – The Hague region, Netherlands ................................... 20
4.4         The 50 Mbit/s uplink requirement and combined spectrum needs ..... 21
4.5         Key findings ....................................................................................... 22

5           Mid-band spectrum for 5G “fibre-like speed” FWA ............................. 23
5.1         Introduction ........................................................................................ 23
5.2         Wireless is the fastest growing fixed broadband access technology .. 23
5.3         5G FWA to close the urban-rural digital divide in Europe................... 25
5.3.1       The European broadband 2025 target ............................................... 25
5.3.2       Subsidies to deliver the broadband target in rural areas .................... 26
5.3.3       Improving the FWA economics with additional mid-bands spectrum . 27
5.3.4       Relevance of FWA for speeds above 100 Mbit/s ............................... 28
5.3.5       Comparing the cost of FTHH and “fibre like speed” 5G FWA ............ 29
5.4         Simultaneous FWA and mobile use of mid-bands spectrum .............. 32

6           Mid-bands spectrum to deliver 100 Mbit/s along motorways .............. 33

7           The role of high bands ....................................................................... 35
7.1         High bands are required to achieve 10 Mbit/s/m2............................... 35
7.2         High bands for mobile capacity .......................................................... 35
7.3         High bands spectrum for rural FWA ................................................... 36

8           The need for a wide band assignment ............................................... 37
8.1         Introduction ........................................................................................ 37
8.2         Economic benefit of 100 MHz channel bandwidth.............................. 37
8.3         Per operator contiguous allocations in excess of 100 MHz ................ 38
8.4         Spectral efficiency benefit of a 100 MHz wide band allocation ........... 39
8.5         Wide band allocation vs. carrier aggregation ..................................... 39
8.6         Assessing Ofcom’s SUT model .......................................................... 40

Appendices ...................................................................................................... 42
Appendix A:            High density areas in sample cities ......................................... 42
Appendix B:            Spectrum needs depending on urban population density ....... 48
Appendix C: ITU-R definition of the user experienced data rate ................. 49
Appendix D: ITU-R definition of area traffic capacity ................................... 50
Appendix E: Selected use cases requiring citywide speed coverage .......... 50
Exhibits
Exhibit 1: IMT 2020 requirements .................................................................. 4
Exhibit 2: Typical spectrum used by mobile in Europe by 2023 ..................... 6
Exhibit 3: New use cases and applications drive 5G spectrum needs ........... 7
Exhibit 4: Mix of spectrum for 5G ................................................................... 8
Exhibit 5: Traffic demand and capacity supply model .................................. 10
Exhibit 6: Key 5G modelling assumptions for future urban environment ...... 15
Exhibit 7: Population and areas of sample cities .......................................... 16
Exhibit 8: DL area traffic demand and spectrum needs................................ 17
Exhibit 9: Additional mid-bands spectrum need (MHz) to meet DL
requirement .................................................................................. 18
Exhibit 10: Paris: Population density and central region ................................ 19
Exhibit 11: Paris: DL traffic demand and capacity supply ............................... 20
Exhibit 12: Amsterdam: Population density and central regions..................... 20
Exhibit 13: Amsterdam: DL traffic demand and capacity supply..................... 21
Exhibit 14: Additional mid-bands spectrum needs (MHz) to meet UL
requirement .................................................................................. 22
Exhibit 15: Additional mid-bands spectrum needs (MHz) to meet DL and UL
requirement .................................................................................. 22
Exhibit 16: Growth of fixed broadband subscribers by technology in 2019 .... 24
Exhibit 17: FWA connections ......................................................................... 24
Exhibit 18: European broadband policy .......................................................... 25
Exhibit 19: BEREC Very High Capacity Networks Criterion 4 ........................ 25
Exhibit 20: Broadband coverage of homes in the EU 28 ................................ 26
Exhibit 21: FWA covered homes per site model............................................. 28
Exhibit 22: FWA households supported depending on speed and spectrum . 29
Exhibit 23: Fibre cost per home passed ......................................................... 29
Exhibit 24: Fibre activation cost per home ..................................................... 30
Exhibit 25: Rural FWA cost assumptions ....................................................... 30
Exhibit 26: Cost per rural household connected using FTTH ......................... 31
Exhibit 27: Cost per rural household covered using FWA .............................. 31
Exhibit 28: FWA deployment cost saving vs. FTTH in rural areas.................. 31
Exhibit 29: Spectrum and area traffic capacity ............................................... 35
Exhibit 30: 3GPP FR-1 bands with 100 MHz wide channel ............................ 37
Exhibit 31: Cost per bit depending on channel bandwidth .............................. 38
Exhibit 32: Cost per bit with per operator allocation of over 100 MHz ............ 39
Exhibit 33: 5G NR utilisation of channel bandwidth ........................................ 39
Exhibit 34: Comparison 100 MHz contiguous vs two 50 MHz blocks ............. 40
Exhibit 35: Paris High Density Area ............................................................... 42
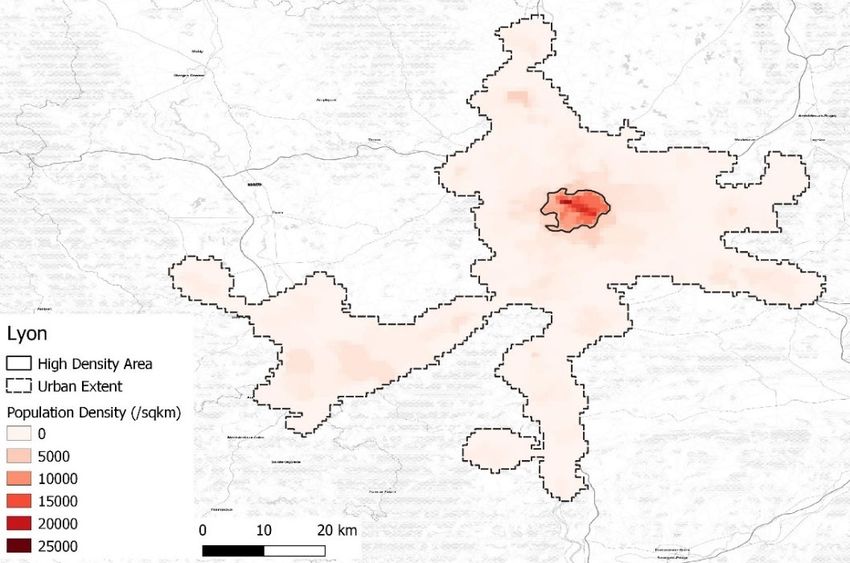
Exhibit 36: Lyon High Density Area ................................................................ 42
Exhibit 37: Marseille High Density Area ......................................................... 43
Exhibit 38: Rome High Density Area .............................................................. 43
Exhibit 39: Milan High Density Area ............................................................... 44
Exhibit 40: Madrid High Density Area............................................................. 44
Exhibit 41: Barcelona High Density Area ....................................................... 45
Exhibit 42: Amsterdam – The Hague High Density Area ................................ 46
Exhibit 43: Berlin High Density Area .............................................................. 46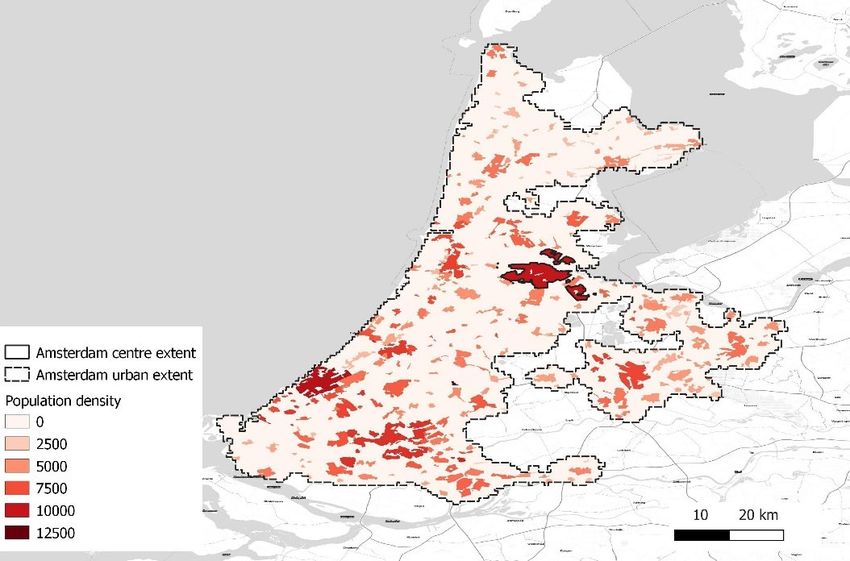
Exhibit 44: Munich High Density Areas .......................................................... 47
Exhibit 45: Hamburg High Density Area ......................................................... 47
Exhibit 46: Additional mid-bands spectrum needs (MHz) to meet DL
            requirement .................................................................................. 48
Exhibit 47: Additional mid-bands spectrum needs (MHz) to meet DL & UL
            requirement .................................................................................. 49
Exhibit 48: Speed requirement for video ........................................................ 51
Exhibit 49: Data rates for car automation sensors.......................................... 51

Contact

       Stefan Zehle, MBA                                              David Tanner, MA (Hons), MSc,
       CEO,                                                           MIET, CEng
       Coleago Consulting Ltd                                         Managing Consultant,
                                                                      Coleago Consulting Ltd
       Tel: +44 7974 356 258
       stefan.zehle@coleago.com                                       Tel: +44 7974 356 258
                                                                      david.tanner@coleago.com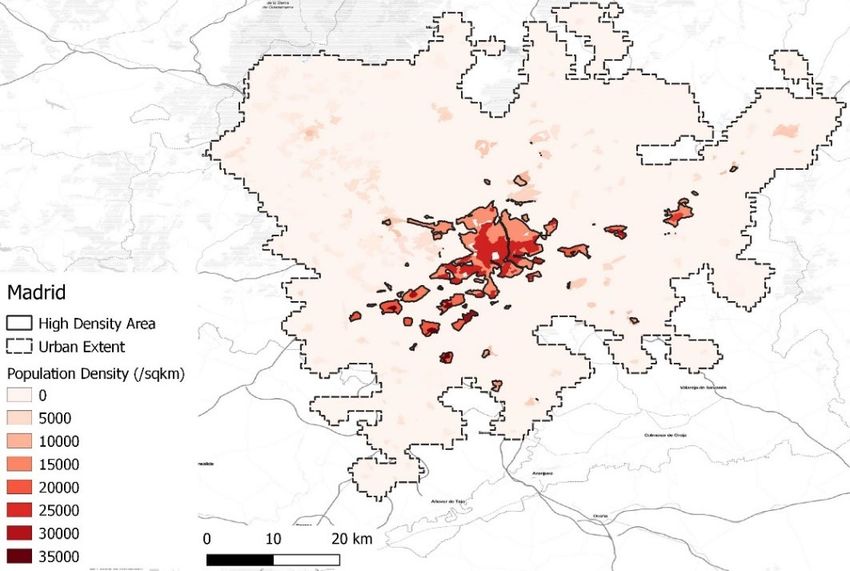
IMT spectrum demand

                                         1        Executive summary
                                         The big picture
                                         5G will bring major benefits to end users over the coming years. Starting with the
                                         existing trends and anticipating further evolution in the longer term, this report
                                         elaborates on the importance of making more mid-bands spectrum available for IMT as
                                         an essential means to achieve the 5G vision.
                                         The report provides an analysis of the future spectrum needs based on area traffic
                                         density demand for the 2025-2030 timeframe, accounting for the 5G target minimum
                                         performance requirements. This report considers the spectrum needed to fulfil the user
                                         experienced data rates of 100 Mbit/s on the downlink, and 50 Mbit/s on the uplink,
                                         defined by the ITU-R for IMT-2020.

  Additional 1000 to 2000 MHz in the     Additional mid-bands spectrum for 5G would enable mobile operators to deliver the
      upper mid-bands would enable       ITU-R IMT-2020 specifications, notably the user experienced data rates of 100 and 50
mobile operators to deliver the ITU-R    Mbit/s on the downlink and uplink in cities, in an economically feasible manner. This
 IMT-2020 requirements, notably the      report provides an analysis for eleven cities with a population density of 9,000 people
   user experienced data rate of 100     per km2 or more, namely Paris, Lyon, Marseille, Berlin, Munich, Hamburg, Madrid,
   Mbit/s in DL and 50 Mbit/s in UL in   Barcelona, Rome, Milan, and the Amsterdam – The Hague region. Our analysis
    cities in an economically feasible   concludes that in addition to building many more small cells, 1000 to 2000 MHz of
                              manner.    additional mid-bands spectrum is required to deliver the 5G vision of downlink user
                                         experienced data rate of 100 Mbit/s across the city, i.e. citywide “speed coverage”, and
                                         also to satisfy the 50 Mbit/s uplink target. The selected cities have characteristics that
                                         also apply to a broad number of other larger cities.
                                         In urban areas with a population density below 9,000 people per km2, mobile operators
                                         will also have to densify the network with small cells to deliver the 5G downlink and
                                         uplink user experienced data rates, but additional upper mid-band spectrum would
                                         reduce the need for cell site densification, thus delivering an environmental benefit.
Using additional mid-bands spectrum      Making available 1000 to 2000 MHz additional mid-bands spectrum for 5G-NR can
for 5G FWA would reduce the cost of      also make a major contribution to achieving the European Union’s 2025 connectivity
       delivering the European 2025      goal. The cost of reaching the European target of making 100 Mbit/s broadband
       broadband goal by €42 billion     available to 100% of households with FTTH amounts to €123 billion, with an estimated
                                         €53 billion of this in rural areas. If FWA using this additional 1000 to 2000 MHz of mid-
                                         bands spectrum is used in rural Europe instead of FTTH, this would result in a saving
                                         of €42 billion. Importantly, this additional spectrum would provide sufficient bandwidth
                                         to ensure that fibre-like speed FWA will also be able to address the needs for fixed
                                         connectivity as a long-term solution for rural areas.
                                         The development of automated driving systems and connected vehicles is still in its
                                         infancy. The safety and environmental benefits that automated driving and connected
                                         vehicles will bring to society are significant but, to realise this vision, reliable high
                                         speed connectivity and capacity are required. Additional mid-band spectrum would
                                         materially reduce the cost of providing the required area traffic capacity along
                                         motorways.

                                                                                                            © copyright Coleago 2020   1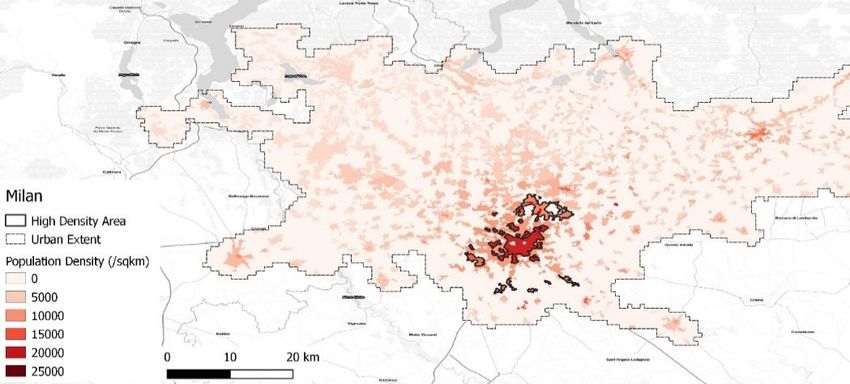
IMT spectrum demand
Modelling additional spectrum needs
Our model focuses on the user experienced data rate of 100 Mbit/s on the downlink
and 50 Mbit/s on the uplink in a city, i.e. ensuring citywide speed coverage. The
relevant metrics are area traffic demand and area traffic capacity (supply) in terms of
Gbit/s/km2. We examine the area traffic capacity requirement against the background
of increased concurrent bandwidth demand from human users and other use cases.
Aiming at a realistic estimate for spectrum needs in the 2025-2030 timeframe, the
report accounts for the following conservative assumptions in respect of area traffic
capacity (supply):
Taking into account spectrum already used by mobile operators in the EU and
assignments to take place during 2021-2023, by the end of 2023 mobile operators
typically will have 190 MHz of low bands spectrum, 460 MHz of mid-bands
spectrum, and 400 MHz of upper mid-bands spectrum with some variation between
countries. In addition, high-bands (mmWave) spectrum will be available.
The report assumes that all the available spectrum is used for 5G-NR at all
available sites by the mobile operators. This is a simplified and optimistic
assumption and appropriate for the purposes here because it maximises the use of
spectrum and is therefore a conservative assumption in the context of assessing
the spectrum needs for 5G-NR.
Site densification in cities will make a significant contribution to reach the 100
Mbit/s downlink requirement. We assumed that in cities, upper mid-bands spectrum
will additionally be deployed on three outdoor small cells for each macro site. We
also assume that high-bands (mmWave) will be deployed.
On the demand side, we look at area traffic demand in cities in the 2025-2030 time
frame:
We use population density in cities as a proxy for area traffic demand density. This
is appropriate because traffic generated by connected vehicles, cameras and video
based sensors occurs where people are, and is in addition to the traffic generated
by human users. Hence tying traffic demand per capita to the 100 Mbit/s downlink
and 50 Mbit/s uplink requirements generates a realistic estimate for future area
traffic demand which takes account of all use cases.
We examine the area traffic capacity requirement against the background of
increased concurrent bandwidth demand from human users and other use cases.
This is presented in form of an activity factor ranging from 5% to 25%, the latter
being representative for the 2025-2030 time frame.
The area traffic density demand is the net demand after deducting offloading traffic
to high bands sites and indoor small cells.
Key findings
The analysis of future needs clearly shows the importance of additional mid-bands
spectrum for 5G-NR and its evolution. The findings of our study point towards the
following conclusions:
In areas with a population density greater than 9,000 per km2, using an additional
1000 to 2000 MHz of upper mid-bands spectrum would enable operators to deliver
the required citywide “speed coverage” with a 100 Mbit/s user experienced
downlink data rate and a 50 Mbit/s uplink data rate in an economically feasible
manner.
Today’s mobile networks cannot deliver the 100 Mbit/s downlink and 50 Mbit/s
uplink user experienced data rates. However, it is economically feasible to deliver
these data rates if the additional upper mid-bands spectrum is made available to
mobile operators and mobile operators also make substantial investments in MIMO
upgrades, upper mid-bands small cells, and high bands.
© copyright Coleago 2020 2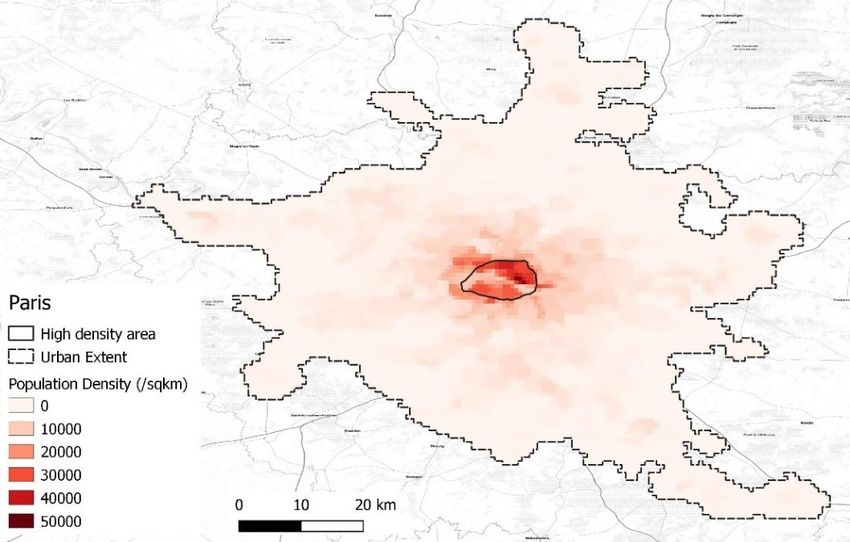
IMT spectrum demand
In areas with a population density below 9,000 per km2, using the additional
spectrum would still deliver benefits. The benefit would either be a lower site
density or a higher experienced data rate. A lower site density translates into a
lower cost per bit which in turn will translate into lower retail prices.
Using these 2000 MHz of additional mid-bands spectrum for 5G FWA would reduce
the average cost of bringing 100 Mbit/s connectivity to the remaining unconnected
rural households in Europe by 79% compared to FTTH. It would also ensure that
fibre-like speed FWA is a long-term solution capable of supporting Very High
Capacity Networks (VHCN) at speeds above 100 Mbit/s.
Substantial capacity is required on roads to serve the connected car and smart
road use cases. Additional mid-bands spectrum would substantially reduce the
number of sites that would otherwise be required to cover Europe’s extensive
motorway network.
© copyright Coleago 2020 3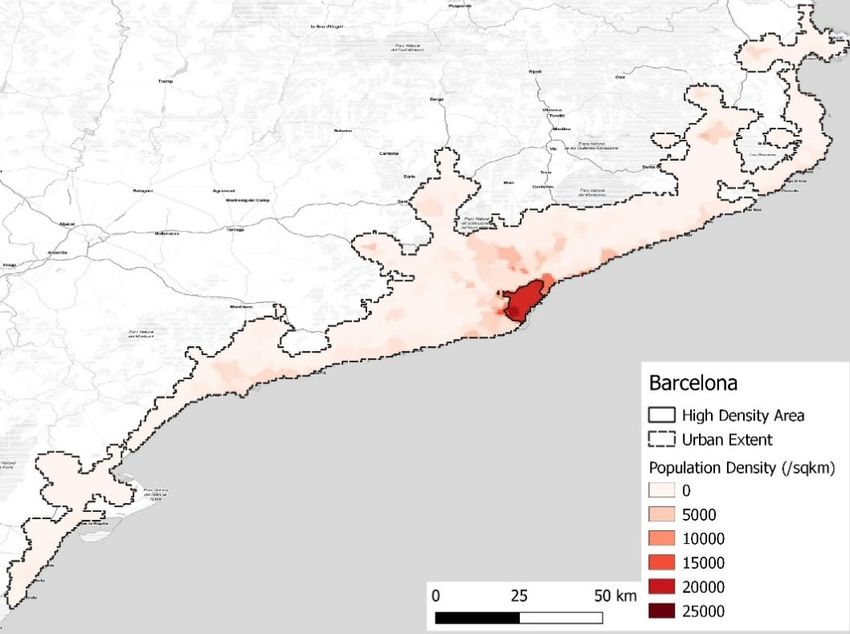
IMT spectrum demand
2 The requirements for 5G drive the need
for IMT spectrum
2.1 Spectrum to deliver the 5G vision
One of the pillars in the vision for 5G is to provide ubiquitous high-speed wireless
connectivity to mobile and fixed users. “IMT-2020 is expected to provide a user
experience matching, as far as possible, that of fixed networks”1. The need for IMT
spectrum is driven by the requirements for 5G as set out in the ITU-R requirements for
IMT-20202.
5G requirements focus on area traffic Exhibit 1 shows the IMT-2020 (5G) requirements compared to LTE-A. The
capacity, near guaranteed data rates, requirements for 5G compared to LTE-A are not just an incremental percentage
low latency, and reliability and this improvement but a multiple improvement, i.e. a revolution rather than an evolution. In
drives the need for spectrum. assessing the need for additional IMT spectrum we are focusing on two of these new
5G requirements:
The user experienced data rate jumps from 10Mbit/s to 100Mbit/s - a factor 10
increase (see Appendix C: for a more detailed description); and
Area traffic capacity moving from 0.1Mbit/s/m2 to 10Mbit/s/m2 – a 100 fold increase
(see Appendix D: for a more detailed description).
Exhibit 1: IMT 2020 requirements
Source: Report ITU-R M.2441-0 (11/2018)
Radio frequencies are the key ingredient to deliver these requirements. Therefore the
step change in the IMT requirements means there is also a step change in the need for
IMT spectrum. Of course improved spectral efficiency associated with higher orders of
MIMO, the 5G radio interface, and densification will enable mobile operators to
squeeze more capacity out of existing spectrum resources, but this is not remotely
sufficient to deliver the capacity requirements of 5G.
1
Report ITU-R M.2441-0 (11/2018), “Emerging usage of the terrestrial component of
International Mobile Telecommunication (IMT)”
2
Report ITU-R M.2441-0 (11/2018), “Emerging usage of the terrestrial component of
International Mobile Telecommunication (IMT)” and Report ITU-R M.2410, “Minimum
requirements related to technical performance for IMT-2020 radio interface(s)”
© copyright Coleago 2020 4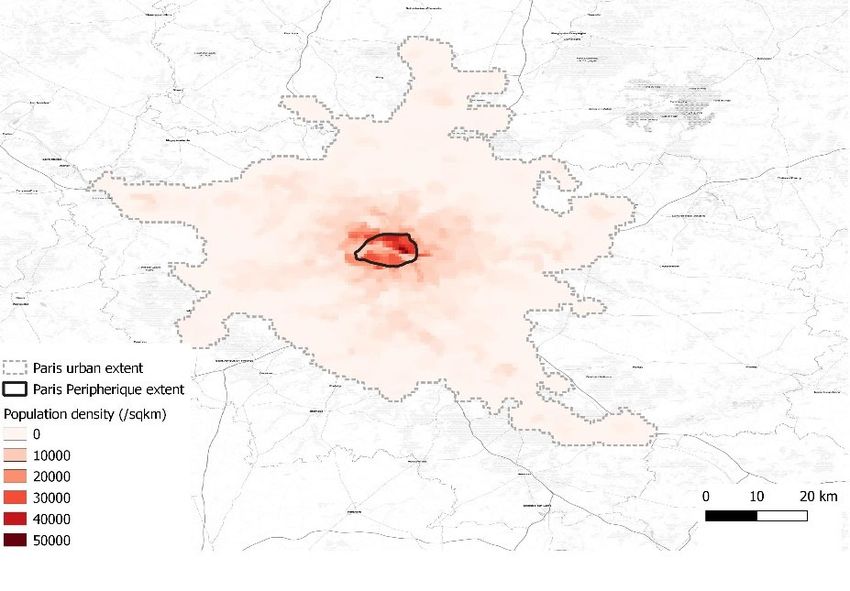
IMT spectrum demand
2.2 Low, mid, and high frequency bands
Spectrum in the range of 450MHz to above 24GHz is used for IMT and band plans
exist in many frequency ranges. Depending on the frequency range and the amount of
spectrum in the range, different frequency bands serve different purposes. The large
number of frequency bands can be categorised into four groups: sub-1GHz, lower mid-
bands, upper mid-bands, and high bands.
Low bands (e.g. 600, 700, 800, 900, 1500 MHz) are effective at addressing very
wide area coverage and deep indoor coverage given their good propagation
characteristics. However, there is very little spectrum available and hence the
channel bandwidth does not provide much capacity.
Lower mid-bands (e.g. AWS, 1800, 1900, 2100, 2300, 2600 MHz) are already used
for IMT for 2G, 3G, 4G and 5G. The lower mid-bands are the capacity layer for 4G
data traffic and in most countries the spectrum is used in FDD mode. China is an
exception to this, with the world’s biggest 5G deployment in the 2600MHz band
with a TDD band plan. The use of this band for 5G will certainly grow over time.
Upper mid-bands (e.g. 3.3-4.2 GHz, Upper mid-bands (e.g. 3.3-4.2, 4.5-4.99, 6 GHz) are newer to IMT and offer a much
4.5-4.99 GHz, 6 GHz) are newer to wider bandwidth. This is a key 5G capacity resource. As of mid-2020, upper mid-
IMT and offer a much wider bands spectrum used in most countries is in 3.4-3.8GHz. This report looks at
bandwidth. This is a key 5G capacity additional mid-bands spectrum up to 7GHz. Upper mid-bands offer a good
resource. The upper mid-bands offer combination of propagation and capacity for cities. Whilst lower mid-bands have
a good combination of propagation better propagation characteristics, lower mid-bands have limitations in regard to
and capacity for cities. available bandwidth. By contrast, the upper mid-bands have significant bandwidth
and reasonable propagation characteristics. The larger amount of spectrum
available in upper mid-bands corresponds to larger channel bandwidth supported
by 3GPP standards, currently allowing for a 100 MHz wide channel and for
maximum bandwidth of 400 MHz in carrier aggregation mode.
High bands (e.g. 26, 28, 40, 66 GHz, also referred to as mmWaves) are effective at
addressing areas with very high traffic density and with extreme peak data rates.
However, high bands are not suitable for contiguous wide area coverage given the
large number of sites this would require
5G will be introduced in legacy bands, namely low bands and lower mid-bands.
However, the introduction of 5G is inseparable from making large amounts of new
spectrum available for mobile in upper mid-bands, as well as high bands. Exhibit 2
below shows the typical spectrum used by mobile networks in a European country in
mid-2021. Upper mid-bands and high bands each serve distinct purposes and hence
both are required:
Upper mid-bands are key to make available a citywide 100 Mbit/s user experienced
downlink (DL) data rate and the 50 Mbit/s uplink (UL) data rate.
High bands are required to create the area traffic capacity of 10 Mbit/s/m2 at
selected locations in urban, suburban, and rural areas where there is a very high
traffic density.
2.3 Spectrum used for mobile in the European Union
Our spectrum demand model shall ascertain how much additional mid-bands spectrum
will be required in the 2025-2030 time frame. Taking into account spectrum already
used by mobile operators in the EU and assignments to take place during 2021-2023,
by the end of 2023 mobile operators typically will have 190 MHz of low-bands
spectrum, 460 MHz of lower mid-bands spectrum, and 400 MHz of upper mid-bands
spectrum with some variation between countries. Exhibit 2 summarises the spectrum
bands and bandwidths which we use as the baseline spectrum from which the need for
additional spectrum is calculated.
© copyright Coleago 2020 5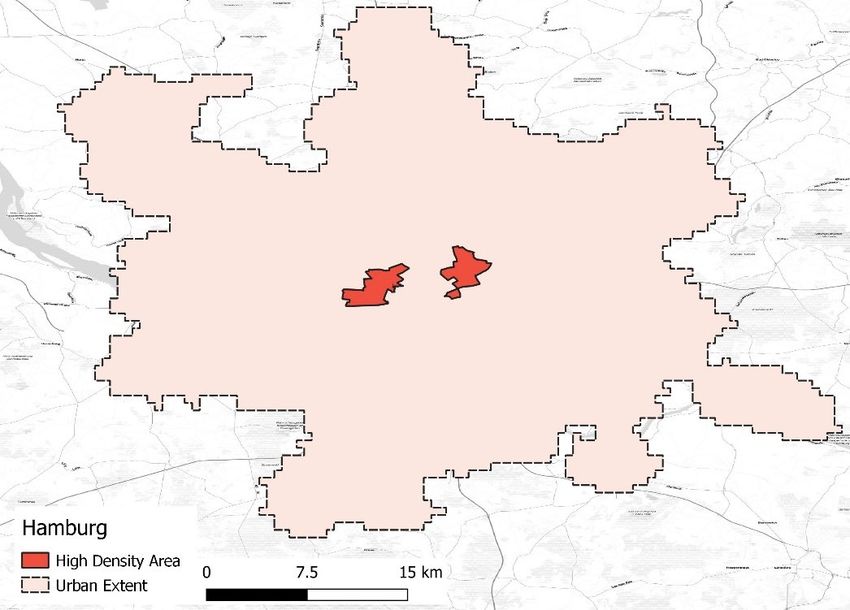
IMT spectrum demand
In 10 years’ time, we can anticipate that the vast majority of the baseline spectrum will
have been refarmed to 5G. Since we are considering spectrum needs over a 10 year
time frame, for simplicity we have assumed that the totality of the spectrum is used for
5G at that point. This assumption maximises the capacity available from existing low
and lower mid-bands.
Exhibit 2: Typical spectrum used by mobile in Europe by 2023
Legacy bands New “5G” bands
Low bands Upper mid-bands
700MHz 2x30 MHz 3.5GHz 400 MHz
800MHz 2x30 MHz User experienced data
900MHz 2x35 MHz rate 100 Mbit/s
Total 190 MHz FDD
Lower mid-bands High bands
1800MHz 2x75 MHz 26GHz 1000 to 3000 MHz TDD
2100MHz 2x60 MHz Area traffic capacity of
2600MHz 2x70 MHz 10 Mbit/s/m2
2600MHz 50MHz
Total 410 MHz FDD, 50 MHz
TDD
Based on typical situation in Europe in 2021
Source: Coleago Consulting
3 Estimating spectrum requirements in
the context of 5G
The ITU-R methodology for calculating spectrum requirements is set out in the report
“Recommendation ITU-R M.1768-1(04/2013), Methodology for calculation of spectrum
requirements for the terrestrial component of International Mobile
Telecommunications”. Input parameter values to be used in this methodology have
been updated from those employed in Report ITU-R M.2078 in order to reflect the
developments in mobile telecommunication markets. The ITU-R “Report ITU-R
M.2290-0 (12/2013) Future spectrum requirements - estimate for terrestrial IMT”
applies this methodology to arrive at a forecast for 2020. This methodology proved to
be useful to forecast spectrum requirements in the medium term in the context of
WRC-15 and WRC-19.
The methodology was driven by traffic volume which was a reasonable approach
because LTE is essentially used for “best effort” smartphone connectivity. In contrast
the 5G vision is for a ubiquitous high speed user experience and connectivity for a wide
range of new uses coupled with new features. Therefore a key factor in driving the
demand for capacity is the vision that 5G should provide the 100 Mbit/s user
experienced data rate anytime, anywhere, while “on the move”. While fundamentally in
a mobile network a particular speed cannot be guaranteed, there is a quasi-guarantee
which translates into a high probability of experiencing this data rate. This means
networks will be designed to deliver a data rate (Mbit/s) rather than data volume
(Gbytes / month). As a result, as we transition to 5G, the need for capacity will grow
faster than traffic volume.
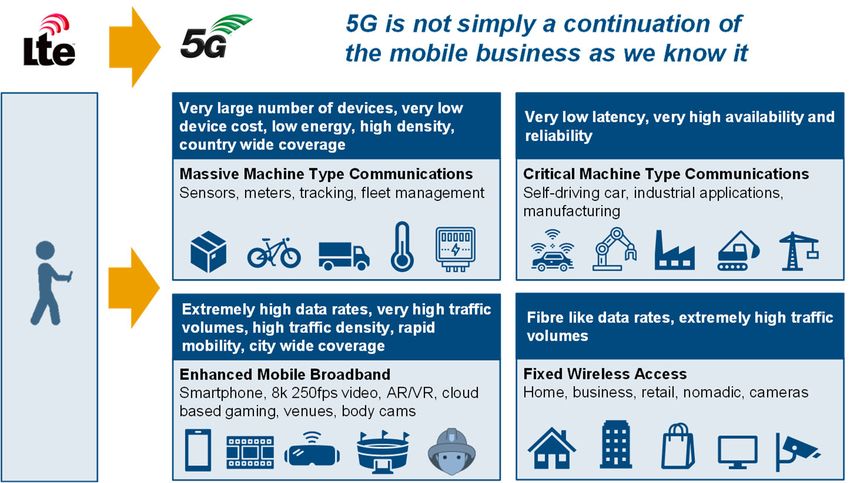
5G is not simply a continuation as we 5G enables the Internet of Things (IoT) with Massive Machine Type Communications
know it. The 5G vision is for a (mMTC) and Ultra Reliable and Low Latency Communications (uRLLC). 5G end to end
ubiquitous fibre-like speed user features such as making available a slice of the network for specific use cases bring a
experience and connectivity for a new dimension to how wireless communications can be used.
wide range of new uses coupled with
new features.
© copyright Coleago 2020 6IMT spectrum demand
Exhibit 3 illustrates that 5G spectrum needs are driven by a vastly expanded set of
applications and use cases, all enabled by the enhanced capabilities of 5G compared
to 4G. With these capabilities 5G is an enabling platform for what has been described
as the “4th industrial revolution”3. While appearing futuristic today, connected vehicles,
smart deliveries with drones and robots and smart cities will generate traffic volumes
far higher than todays’ smartphone driven data usage rates.
Exhibit 3: New use cases and applications drive 5G spectrum needs
Source: Coleago Consulting
Not only are there many new Not only are there many new applications and use cases, but many future applications
applications and use cases, but many require higher speeds. These developments show that there is a need for “speed
future applications require higher coverage”. The 100 Mbit/s requirement of 5G is a reflection of this. For applications
speeds. and use cases which require a minimum speed, not having the required speed is the
same as not having coverage at all.
With 5G the focus is on user Given the step change from 4G to 5G, forecasting spectrum needs based on the
experienced data rates and area historic trend in traffic volume per smartphone needs to be adapted. The focus on
traffic capacity as set out in the ITU’s traffic volume per smartphone is a 4G paradigm. With 5G the focus is on user
IMT 2020 requirements. experienced data rates and area traffic capacity as set out in the ITU-R’s IMT 2020
requirements. Driven by these requirements, we have based our analysis of the need
for additional upper mid-bands spectrum in delivering near guaranteed user
experienced data rates of 100 Mbit/s on the DL and 50 Mbit/s on the UL, anytime,
anywhere in cities while “on the move”. Additionally, we also examine how the
requirement to deliver the area traffic capacity of 10 Mbit/s/m2 can be delivered.
3
Klaus Schwab, The Fourth Industrial Revolution, Magazine of Foreign Affairs, 12 Dec 2015
© copyright Coleago 2020 7IMT spectrum demand
4 Spectrum for citywide speed coverage
4.1 Mix of spectrum to deliver 5G
The user experienced data rate of As regards the user experienced data rate of 100 Mbit/s this needs to be delivered at
100 Mbit/s needs to be delivered at least in all urban and sub-urban areas4. This is economically feasible, even in the high
least in all urban and sub-urban density cities we have analysed provided that, in addition to the available mid-band
areas. This is economically feasible, spectrum, a further 1,000 to 2,000 MHz of mid-bands spectrum is made available for
provided that 1,000 to 2,00 MHz of IMT. Without this additional spectrum, a denser network would be required and thus
additional mid-bands spectrum is the number of cell sites required in those cities to provide the “speed coverage” would
made available for IMT. increase network cost to a point where it may not be possible to offer a wireless
broadband service at a price point that is economically feasible.
Secondly, 5G is designed to cater for extremely high traffic densities of 10 Mbit/s/m2.
These occur in specific geographical areas, both outdoors and indoors. Legacy
spectrum and new upper mid-bands are not sufficient to deliver this requirement. The
10 Mbit/s/m2 goal can only be reached if high bands are deployed. However, the
propagation characteristics of the high bands are such that high bands alone cannot be
a citywide contiguous coverage solution, because the number of cell sites required
would be too high from an economic perspective. High bands are therefore not a
substitute to upper mid-bands.
Exhibit 4: Mix of spectrum for 5G
Source: Coleago Consulting
Below we provide an analysis of these issues for several cities which all lead to a
common conclusion:
Using 1,000 to 2,000 MHz of upper mid-bands spectrum in addition to the 400MHz
in the 3.5GHz band would deliver the required citywide “speed coverage” with a
100 Mbit/s user experienced downlink data rate.
The 50 Mbit/s UL user experienced data rate may drive additional spectrum
demand, depending on the adopted TDD configuration and on the specific use
cases.
Today’s mobile networks cannot deliver the 100 Mbit/s user experienced data rate.
However, it is economically feasible to deliver this 100 Mbit/s data rate if the
additional upper mid-bands spectrum is made available to mobile operators and
4
“For wide area coverage cases (e.g. in urban and suburban areas), a user experienced data rate
of 100 Mbit/s is expected to be enabled. In hotspot cases, the user experienced data rate is
expected to reach higher values (e.g. 1 Gbit/s indoor).” Source: Report ITU-R M.2441-0
(11/2018), Emerging usage of the terrestrial component of International Mobile
Telecommunication (IMT), page 7.
© copyright Coleago 2020 8IMT spectrum demand
mobile operators also make substantial investments in MIMO upgrades, upper mid-
bands small cells, and high bands small cells.
High bands are necessary to deliver the 10 Mbit/s/m2 goal, however, these cannot
substitute the mid-bands. This is discussed in detail in Chapter 7 below.
4.2 Spectrum demand model linked to the ITU-R IMT-2020
requirements
4.2.1 The 100 Mbit/s DL user experienced data rate requirement
We have developed a concise and The need for spectrum is driven by traffic density. Therefore to examine future
easily verifiable model to examine the spectrum needs for IMT, we need to analyse traffic demand in areas with high
need for mid-bands spectrum in an population densities, i.e. cities. With this in mind, we have developed a concise and
urban environment to deliver the ITU- easily verifiable model to examine the impact of mid-bands spectrum in a city to deliver
R requirement for IMT-2020 of a 100 the ITU-R requirement for IMT-2020 (or 5G) of a 100 Mbit/s user experienced data rate
Mbit/s user experienced data rate in in the downlink.
downlink.
“Traditional usage” models employ individual user consumption figures coupled with
various factors to derive overall capacity needed. Instead our model examines the
capacity needed over a wide area in a city consistent with the ITU-R IMT-2020 capacity
focussed requirements, notably the requirement to deliver a user experienced DL data
rate of 100 Mbit/s.
In the development of the ITU’s IMT-2020 requirements, the user experienced data
rate relates to human users but this will account for only part of the traffic. Connected
cars, cameras, and IoT devices will generate substantial amounts of traffic. Hence one
of the requirements of 5G is to support 10 million devices per km2. The uncertainty
over how much simultaneous capacity will be required for all of these use cases in a
given area is very large and bottom up-models of future traffic are speculative. Our
approach is to use population density in cities as a proxy for traffic density to estimate
the minimum or floor capacity requirement. This is conservative, since traffic generated
by connected vehicles and video based sensors could be a multiple of traffic generated
by human users. Hence tying traffic demand per capita to the 100 Mbit/s requirement
generates a conservative estimate for future spectrum needs.
The advantage of focusing on the 5G The advantage of this approach is that the model is easy to validate because it relies
requirements for a minimum data rate on a small number of key assumptions around typical cell sizes and average spectral
is that the model is easy to validate efficiencies that are representative of future 5G deployments.
because it relies on a small number of
The 100 Mbit/s date rate requirement is not the same as a guaranteed data rate. The
key assumptions.
economics of mobile networks are driven by the fact that radio access network
resources are shared between users. This is the key reason why per Gbyte retail
prices for mobile data services have declined substantially and, with the introduction of
5G, continue to decline at a fast rate. In a shared network, the user experienced data
rate is dependent on the probability of simultaneous demand from multiple users in a
given cell. Providing a guaranteed data rate for all users would not be feasible from an
economic perspective. The area traffic capacity supply is derived from an average
spectral efficiency which cannot guarantee that the user experienced data rate is
delivered consistently at all times. Therefore it would be inappropriate to turn the ITU-R
IMT 2020 requirement for a 100 Mbit/s user experienced rate into a regulatory
obligation. One of the features of 5G is network slicing. This enables mobile operators
to deliver a guaranteed data rate, but at a higher price
© copyright Coleago 2020 9IMT spectrum demand
Exhibit 5: Traffic demand and capacity supply model
Concurrent demand Concurrent demand
from human users from new use cases
ITU Requirement Offload to indoor
User experienced Population Density Activity factor (%) small cells and
data rate 100 Mbit/s mmWave sites (%)
Traffic demand per
km2 (Gbit/s/km2)
Capacity supply per
km2 (Gbit/s/km2)
Macro site inter-site Macro site MHz of spectrum on Spectral efficiency
distance meters sectorisation macro site bit/s/Hz macro site
Number of outdoor
Small cell MHz of spectrum on Spectral efficiency
small cells relative to
sectorisation outdoor small cell bit/s/Hz small cell
macro sites
Source: Coleago Consulting
4.2.2 The area traffic demand side – key assumptions
With regards to the demand for capacity in a city with a particular population density,
the four drivers in our model are listed below and described in the following
paragraphs:
the IMT-2020 requirement for a DL user experienced data rate of 100 Mbit/s and a
50 Mbit/s uplink data rate;
the population density;
an assumption of concurrent demand from human users and new use cases (the
activity factor);
an assumption of how much of the traffic demand would be satisfied by high bands
(24GHz and above) sites; and
an estimate of the percentage of traffic offloaded to indoor upper mid-bands small
cells.
These assumptions are applied to population densities. The objective is to compare the
traffic demanded in a city with the capacity delivered, depending on the amount of
spectrum deployed.
100 Mbit/s user experienced data rate in the downlink
The ITU-R requirement is that 5G The ITU-R requirement is that IMT-2020 must deliver a DL user experienced data rate
must deliver a DL user experienced of 100 Mbit/s. This is the starting point for the demand analysis. This requirement was
data rate of 100 Mbit/s. This is the developed some time ago in 2013 and may therefore increase. 5G is an IMT-2020
starting point for the demand technology and thus is expected to deliver such speed.
analysis.
© copyright Coleago 2020 10IMT spectrum demand
The user experienced data rate of 100 Mbit/s needs to be delivered across an entire
city, i.e. anytime anywhere high speed experience. Thus, mobile operators must cater
for “speed coverage” across the entire city area. This implies that the traffic per square
kilometre over an entire city area is a function of the population density in that city. This
results in an average traffic demand per square kilometre (Mbit/s/km2).
Citing an average implicitly assumes that traffic demand is evenly distributed across
the city area. In reality traffic is not evenly distributed across a city area, but for our
approach to demand modelling, the simplified assumption that traffic which would be
carried by low bands and lower / upper mid-bands can be treated as relatively evenly
distributed is reasonable, considering the following:
As explained below, data usage and the duration of usage is increasing and hence
high bandwidth demand extends over longer periods of time.
Today’s traffic distribution relates largely to traffic demand from smartphones. In a
mid-term future traffic demand by new use cases and new applications will occur in
locations within a city where previously there may not have been a need for much
capacity, for example on urban transport routes. This tends towards a more even
demand for capacity across a city area.
There are always areas with a very high area traffic capacity requirement. Our
model takes account of this by assuming that high bands will provide capacity in
those areas. This will effectively take care of localised peaks in area traffic demand
thus leaving traffic demand in the remaining area more evenly distributed. In other
words, localised traffic demand peaks are offloaded to high band sites.
Population density
Our approach is to use population Our approach is to use population density in cities as a proxy for traffic density to
density in cities as a proxy for traffic estimate the minimum or floor capacity requirement. This is very conservative, since
density to estimate the minimum or traffic generated by connected vehicles and video based sensors could be a multiple of
floor capacity requirement. traffic generated by human users. Hence tying traffic demand per capita to the 100
Mbit/s requirement generates a conservative estimate for future spectrum needs.
From a network dimensioning perspective, administrative city boundaries are irrelevant
and what matters are areas with a high population density. Population density should
be looked at over a reasonably large urban area which may or may not be within the
administrative boundaries of a city or encompass the whole city. Given that population
density is an average over an area, one must define the level of analysis and it is
appropriate to look at population density clusters rather than dividing a city’s population
by the area within its administrative boundary. The area considered needs to be
reasonably large, i.e. not just a 1 km2 hotspot, for the issue to be material. From a
materiality perspective, Coleago considers that the minimum size is 25 km2 in a single
area or several such areas within an urban area.
Demand for area traffic capacity is of course only a problem in areas with a high
population density. In our analysis (based on publicly available data5) of specific cities
we focus on areas within a city with a population density of at least 9,000 people per
km2. In principle, the higher the density, the greater the demand per km2.
Concurrent demand for capacity - the activity factor
As stated above, the key driver to determine the traffic demand per km2 within a city
area is population density. However, not all users would require 100 Mbit/s at the same
time. We need an assumption with regards to the concurrent or simultaneous demand
for capacity during the busy period. In our model this is captured in the form of an
“activity factor” to represent concurrent use in a cell from human users with
smartphones and other devices, and new use cases such as connected cars, sensors,
and cameras.
5
https://sedac.ciesin.columbia.edu/data/set/grump-v1-urban-extents
© copyright Coleago 2020 11IMT spectrum demand
It is reasonable to use population density as a proxy for demand from human users
with smartphones and other devices as well as new use cases because many new use
cases occur where people are. Traffic from new use cases occurs in addition to traffic
generated by human users. In other words it adds to the human activity factor. As an
illustration, let’s consider the case of 5G enabled cameras. Most cameras are where
people are. The higher the population density, the higher the density of cameras is
likely to be.
As regards the activity factor for human users in urban environments, this is likely to be
in the range of 5 to 10% today. This estimate is based on Coleago’s work with mobile
operators in the context of spectrum auctions world-wide. In other words, in the busy
period for a particular cell up to 10% of the population present in a cell may be using
their devices simultaneously in that cell and hence their demand for capacity is
additive.
Today’s mobile network usage is dominated by smartphones and is increasing rapidly.
In 2019, the average usage per smartphone was 7.0 Gbytes / month6. In Finland
average usage is already nearly five times higher than this: “Mobile data usage grew to
34 gigabytes per Finn per month during the first half of 2019, which is 21 per cent more
than the year before”7. Looking specifically at 5G users in South Korea, monthly data
usage is three times8 higher compared to 4G users. This is driven by the fact that users
opt for 5G plans which offer unlimited data usage and do not throttle speed above a
certain limit. Increased use means people are using more data for longer periods. The
higher the usage, the more concurrent use there will be. This is evident from FTTH,
xDSL, and cable broadband which have a busy period lasting several hours rather than
the peaky traffic pattern associated with today’s mobile use. The high concurrent usage
for FTTH, xDSL and cable is in no small part due to the fact that unlimited use plans
are common. Unlimited data plans are becoming common for 5G mobile. This
translates into a higher activity factor for human users, i.e. more people use their
devices at the same time in the same cell.
Not only is average usage per Not only is average usage per smartphone increasing rapidly, but traffic demand from
smartphone increasing rapidly, but non-human usage is just at the beginning of the growth curve. Therefore when
traffic demand from non-human assessing the activity factor, we need to take account of new use cases.
usage is just at the beginning of the
In the development of the ITU’s IMT 2020 requirements, the user experienced data
growth curve.
rate relates to human users. However, as shown in Exhibit 3 above, 5G enables new
use cases and has features not available in 4G, all of which increase the demand for
capacity and this is discussed in Chapter 3 above. Connected cars, cameras, and a
high density of IoT devices will generate substantial amounts of new data traffic.
There is considerable uncertainty over how much of the demand for the new use cases
in a given area will be simultaneous. Our approach is to use population density in cities
as a proxy for traffic density in order to estimate the minimum or floor capacity
requirement. This approach is very conservative, since traffic generated by connected
vehicles, cameras, and video based sensors could be a multiple of traffic generated by
human users. For example, connected cars today generate hardly any traffic. However,
over a 10 year time frame a connected car may generate about as much data as 3,000
people as explained in Chapter 6 of this report9, On this basis Coleago estimates that
today’s average data usage per capita from smartphones, IoT, smart city, connected
cars and other use cases is less than 5% of what we will see once 5G is mature.
6
Source: Ericsson Mobility Report, June 2020
7
Source: Traficom, Finish Transport and Communications Agency, 2.11.2019
8
Source: MITC, December 2019 traffic
9
Brian Krzanich, CEO, Intel, 2019
© copyright Coleago 2020 12IMT spectrum demand
It is with this in mind that we analyse the need for additional mid-bands spectrum for a
range of activity factors. This range represents how the activity factor will grow over
time. An activity factor of 5% to 10% is likely to be representative of the mobile
bandwidth demand in 2020. We expect that the activity factor will reach 25% within the
2025-2030 time frame considered by this report. This takes account of both of human
users as well as other uses such as connected vehicles, smart city, cameras, and
network slices.
High bands offloading factor
As of December 2020, high bands are not yet deployed in Europe. However, it is
expected that they will be by the time additional spectrum in mid-bands is made
available.
High bands will not provide continuous coverage in a city but will be deployed to serve
indoor and outdoor locations with an extremely high traffic density. While the number of
high bands sites will vary substantially from city to city and thus coverage and traffic
captured will differ. In the analysis below we use a high band offload of 10%, 20%, and
30% respectively.
The role of high bands discussed in more detail in Chapter 7.
Offloading to indoor small cells
In some locations upper mind-bands small cells are expected to be installed indoors to
provide speed coverage. We assume that 10% traffic will be offloaded to upper mid-
band indoor cells.
4.2.3 The area traffic capacity supply side – key assumptions
The variables in the city capacity supply per km2 availability model are:
the number of macro cell sites per km2, driven by the inter-site distance;
the role of mid-bands small cells;
base station design margin;
the site sectorisation;
the spectral efficiency; and
the amount of existing spectrum and additional spectrum required.
Number of macro cell sites
A key assumption is the number of A key assumption is the number of macro base station sites per km2 across a city at
macro base station sites per km2 which the spectrum is used. For this we have not made operator specific assumptions,
across a city at which the spectrum is but for the sake of simplicity we model this as if all operators share the same sites.
used. For this we have not made Since not all physical sites are multi-tenant, the real number of physical sites would be
operator specific assumptions, but for higher but not all spectrum would be used at each site. The capacity calculation does
the sake of simplicity we model this not depend on this issue because total capacity is the number of sites multiplied by the
as if all operators share the same amount of spectrum on each site. Our simplified approach is therefore representative.
sites.
In a typical city, sub-1 GHz and lower mid-bands are deployed mostly on macro sites,
while upper mid-bands are deployed on macro sites and small cells. The typical inter-
site distance for macro sites is ca. 400m.
In cities, the inter-site distance is driven by the need to provide capacity rather than
range. We validated this assumption by comparing the number of macro sites
predicted by the model with the number of actual sites.
The role of mid-bands small cells
We need to take account of future site build with 2025-2030 in mind. 5G will rely on
small cell deployment to ensure speed coverage and hence the number of cell sites is
expected to increase substantially.
© copyright Coleago 2020 13IMT spectrum demand
Small cells would not provide contiguous coverage but would be deployed to fill in
“speed coverage holes”. These speed coverage holes are locations where, for example
due to blockage by buildings, upper mid-bands used at macro sites do not provide
coverage. In other words, outdoor small cells provide consistency of area traffic
capacity by in-filling any speed coverage holes at the macro layer.
The precise number of outdoor small cells required to fill in speed coverage holes
depends on the topology of a particular city. Based on Coleago’s work with operators10,
in a typical urban area in a 15 years’ time frame the number of outdoor small cells for
upper mid-band deployment would be two to three times the number of marco sites. In
our model, we conservatively assume that the number of upper mid-band outdoor
small cells in cities would grow to be three times the number of macro sites.
For example, the macro site raster in Paris consists of 616 macro sites (assuming
100% co-location by all operators) and we assume that 1,848 (616 x 3) outdoor small
cells will be added. This assumes 100% co-location by all operators but in practice
there are likely to be many more small cells sites because not all sites will have 100%
colocation. Whether small cells are colocated or not does not matter from the area
traffic capacity modelling perspective.
In theory mobile operators could build many more small cells. However there are two
constraints, economic and environmental. It is significantly more cost effective to add
spectrum to an existing site because this reduces capital expenditure and operational
expenditure. In a competitive market this translates into lower retail prices, i.e. a
consumer surplus. Secondly, local authorities are keen to limit mobile sites to the
number necessary to provide a good 5G service because a very large number of sites
is not desirable from an environmental perspective.
Design margins
In practice in the busy period a base station site capacity cannot be fully utilised. In
order to manage interference a design margin of at least 15% is required. In other
words, in practice 15% of the nominal capacity cannot be used. The assessment of the
spectrum needs in this report is based on the busy period when Base Stations are
heavily loaded. This approach allows not to overestimate the need for additional
spectrum. Overestimation may occur if a higher design margin is considered, which is
equivalent to less loaded Base Stations.
Site sectorisation
A typical urban macro-cell deployment uses three sector sites which increase the
capacity per site. However, small cells will have predominantly only one sector. Our
model is consistent with these assumptions.
Spectral efficiency
We have used appropriate assumptions with regards to the downlink and uplink
spectral efficiency for the different types of spectrum in an urban environment. While
currently 2G, 3G and 4G are deployed in low bands and lower mid-bands, in time these
will all be refarmed to 5G. Therefore we used the higher spectral efficiency for 5G with
an appropriate MIMO configuration as shown in Exhibit 6.
The spectral efficiency values used are based on values typically used by many mobile
operators for whom Coleago has carried out long-term network dimensioning work as
well as simulations carried out by vendors. In some cases the values are lower than
those published by the ITU-R.
10
Source: Coleago Consulting work with several operators in Europe and North America.
© copyright Coleago 2020 14IMT spectrum demand
The ITU-R spectral efficiency values are achievable under ideal conditions in a dense
urban environment, but here we are modelling a real world deployment and consider
average spectral efficiency not only over a cell area but over an entire city. The high
population density areas include both dense urban and urban environments. For
example, the ITU-R target for dense urban eMBB is 7.8 bit/s/Hz and could be achieved
by using 64-element MIMO at the base stations. However, across a city in upper mid-
bands a mix of MIMO configurations will be used and hence we used a blended
average spectral efficiency. For other environments we used vendor simulation results
because M.2410 either does not cover these or does not cover these with the same
assumptions as we used.
Spectrum used and additional spectrum requirement
We assume that all available low- We assume that all available low-bands, lower mid-bands, and upper mid-bands will be
bands, lower mid-bands, and upper deployed on all macro sites. As regards small cells, we assume that upper mid-bands
mid-bands will be deployed on all spectrum will be used on all small cells. In addition, we also assume that high bands
macro sites. As regards small cells, (mmWaves) will be deployed in the city and thus part of the traffic will be absorbed by
we assume that upper mid-bands the mmWave sites (i.e. offload to high bands).
spectrum will be used on all small
We have modelled how much spectrum would be required to deliver the experienced
cells.
data rate of 100 Mbit/s in the downlink in an urban environment, where the variable
which drives spectrum demand is the population density in the urban environment. We
also similarly modelled the requirement to deliver a 50 Mbit/s uplink user experienced
data rate.
The last column in Exhibit 6 below shows the baseline spectrum which we expect to be
assigned and deployed in the near term, i.e. from 2021 to 2024. In the spectrum
demand model, the baseline spectrum resources deliver the baseline area traffic
capacity. When area traffic demand exceeds this baseline capacity, additional
spectrum is required.
Exhibit 6: Key 5G modelling assumptions for future urban environment
Band Category Average Number Average Baseline
inter-site of sectors DL/UL spectrum
distance spectral available
(m) efficiency
(bit/s/Hz)
700, 800, Macro site; 400 3 1.8 / 1.8 190 MHz
900 MHz Low bands
1800, Macro site; 400 3 2.2 / 2.5 460 MHz
2100, Lower mid-bands
2600 MHz
3.5 GHz Macro site; 400 3 6.0 / 4.1 400 MHz
Upper mid-bands
Additional Macro site; 400 3 6.0 / 4.1 Spectrum
mid-bands Mid-bands demand
model output
3.5 GHz Small cell; n/a* 1 3.7 / 2.6 400 MHz
Upper mid-bands
Additional Small cell; n/a* 1 3.7 / 2.6 Spectrum
mid-bands Mid-bands demand
model output
* For small cells this does not assume contiguous coverage because small cells are deployed to
fill in speed coverage holes rather than providing contiguous coverage. Hence the inter-site
distance is irrelevant.
Source: Coleago Consulting
© copyright Coleago 2020 15IMT spectrum demand
4.3 Spectrum supply model to meet the DL area traffic demand in
cities
4.3.1 Introduction
Without practical examples, the population density figures can be somewhat academic.
We have therefore used eleven city examples to illustrate the impact more specifically:
Paris, Lyon, Marseille, Berlin, Munich, Hamburg, Madrid, Barcelona, Rome, Milan, and
the Amsterdam – The Hague urban extend.
Below we show the analysis for Paris and the Amsterdam – The Hague region with
maps illustrating the resulting specific high population density regions identified. The
appendix contains additional maps showing the high population density areas for
Marseille, Lyon, Rome, Milan, Madrid, Barcelona, Munich, Berlin, and Hamburg. The
urban extent11 of each city is also shown on each map in the Appendix to give some
context to the size of regions identified. Urban extents and population densities are
sourced from SEDAC12 13. As explained in Section 4.2.2, when looking at population
density it is appropriate to look at population density clusters rather than dividing a
city’s population by the area within its administrative boundary. In each city, we have
identified a similar reasonably sized high density area as shown in Exhibit 7.
Exhibit 7: Population and areas of sample cities
City High density Population in Population density
area (km2) high density in high density
area area (pop/km2)
Paris 85.3 2,134,035 25,018
Lyon 72.6 769,242 10,595
Marseille 43.2 390,489 9,035
Berlin 85.6 1,191,421 13,917
Hamburg 23.6 304,065 12,884
Munich 47.2 517,045 10,952
Rome 68.6 1,086,670 15,839
Milan 61.9 942,746 15,226
Madrid 113.1 2,741,249 24,246
Barcelona 110.0 2,030,121 18,456
Amsterdam – The Hague 72.3 707,220 9,788
Sources: (1) For Paris, https://en.wikipedia.org/wiki/List_of_largest_cities
(2) Coleago GIS analysis based on data from,
https://sedac.ciesin.columbia.edu/data/set/grump-v1-urban-extents
11 From SEDAC: “Urban extents distinguish urban and rural areas based on a combination of
population counts (persons), settlement points, and the presence of night-time lights. Areas
are defined as urban where contiguous lighted cells from the night-time lights or approximated
urban extents based on buffered settlement points for which the total population is greater
than 5,000 persons”
12 Center for International Earth Science Information Network - CIESIN - Columbia University,
International Food Policy Research Institute - IFPRI, The World Bank, and Centro
Internacional de Agricultura Tropical - CIAT. 2011. Global Rural-Urban Mapping Project,
Version 1 (GRUMPv1): Urban Extents Grid. Palisades, NY: NASA Socioeconomic Data and
Applications Center (SEDAC). https://doi.org/10.7927/H4GH9FVG. Accessed May 2020
YEAR
13 Center for International Earth Science Information Network - CIESIN - Columbia University.
2018. Gridded Population of the World, Version 4 (GPWv4): Population Density, Revision 11.
Palisades, NY: NASA Socioeconomic Data and Applications Center (SEDAC).
https://doi.org/10.7927/H49C6VHW. Accessed May 2020.
© copyright Coleago 2020 16You can also read