A non-destructive method to determine the neutron production rate of a sample of spent nuclear fuel under standard controlled area conditions - Eurad
←
→
Page content transcription
If your browser does not render page correctly, please read the page content below

A non-destructive method to determine
the neutron production rate of a sample
of spent nuclear fuel under standard
controlled area conditions
 Schillebeeckx, P., Verwerft, M., Žerovnik, G.,
 Parthoens, Y., Pedersen, B., Alaerts, G., Cools, G.,
 Govers, K., Paepen, J., Varasano, G., Wynants, R.

 2020

 EUR 30379 EN
This publication is a Technical report by the Joint Research Centre (JRC), the European Commission’s science and knowledge service. It
aims to provide evidence-based scientific support to the European policymaking process. The scientific output expressed does not imply a
policy position of the European Commission. Neither the European Commission nor any person acting on behalf of the Commission is
responsible for the use that might be made of this publication. For information on the methodology and quality underlying the data used
in this publication for which the source is neither Eurostat nor other Commission services, users should contact the referenced source. The
designations employed and the presentation of material on the maps do not imply the expression of any opinion whatsoever on the part
of the European Union concerning the legal status of any country, territory, city or area or of its authorities, or concerning the delimitation
of its frontiers or boundaries.

EU Science Hub
https://ec.europa.eu/jrc

JRC121586

EUR 30379 EN

 PDF ISBN 978-92-76-22349-8 ISSN 1831-9424 doi:10.2760/614853

Luxembourg: Publications Office of the European Union, 2020

© European Atomic Energy Community, 2020

The reuse policy of the European Commission is implemented by the Commission Decision 2011/833/EU of 12 December 2011 on the
reuse of Commission documents (OJ L 330, 14.12.2011, p. 39). Except otherwise noted, the reuse of this document is authorised under
the Creative Commons Attribution 4.0 International (CC BY 4.0) licence (https://creativecommons.org/licenses/by/4.0/). This means that
reuse is allowed provided appropriate credit is given and any changes are indicated. For any use or reproduction of photos or other
material that is not owned by the EU, permission must be sought directly from the copyright holders.

All content © European Atomic Energy Community, 2020

How to cite this report: Schillebeeckx, P., Verwerft, M., Žerovnik, G., Parthoens, Y., Pedersen, B., Alaerts, G., Cools, G., Govers, K., Paepen, J.,
Varasano, G. and Wynants, R., A non-destructive method to determine the neutron production rate of a sample of spent nuclear fuel under
standard controlled area conditions, EUR 30379 EN, Publications Office of the European Union, Luxembourg, 2020, ISBN 978-92-76-
22349-8, doi:10.2760/614853, JRC121586.
Contents

1 Introduction..................................................................................................................................................................................................................................................... 4
2 Theoretical considerations on neutron production by spent nuclear fuel........................................................................................... 5
3 Characteristics of the analysed spent fuel segment .............................................................................................................................................. 8
4 Neutron detection system .............................................................................................................................................................................................................10
5 Sample transfer containers and procedure ..................................................................................................................................................................12
6 Dose rates .....................................................................................................................................................................................................................................................14
7 Operating and performance characteristics of the detection system ................................................................................................17
 7.1 High voltage ..................................................................................................................................................................................................................................17
 7.2 Time dependence .....................................................................................................................................................................................................................20
 7.3 Dead time ........................................................................................................................................................................................................................................21
 7.4 Gate fraction and detection efficiency ................................................................................................................................................................21
8 Neutron production rate measurements of the SNF segment sample ..............................................................................................25
9 Estimation of the neutron production rates of the spent fuel segment ...........................................................................................29
 9.1 Model....................................................................................................................................................................................................................................................29
 9.2 Results ................................................................................................................................................................................................................................................36
10 Summary and outlook .......................................................................................................................................................................................................................39
References .............................................................................................................................................................................................................................................................40
List of abbreviations and definitions ...........................................................................................................................................................................................43
List of figures .....................................................................................................................................................................................................................................................44
List of tables ........................................................................................................................................................................................................................................................47

 i
Foreword
This work is part of the Work Package "Spent Fuel Characterisation and Evolution Until Disposal" of the European
Joint Programme on Radioactive Waste Management (EURAD). It is part of deliverable 8.4 describing a system
for non-destructive characterisation of nuclear spent fuel samples. The project leading to this deliverable has
received funding from the European Union’s Horizon 2020 research and innovation programme under grant
agreement No 847593.

 1
Acknowledgements
This work was partly funded by the European Union's Horizon 2020 Research and Innovation Programme under
grant agreement No 847593. We are also indebted to the technical staff of the Laboratory for High and Medium
level Activity of the SCK CEN for their assistance during the measurements and to Dr. P. Jansson (Uppsala
University), Dr. M. Seidl (Preussen Elektra) and Dr. G. Van den Eynde (SCK CEN) for a careful review of the
manuscript.

Authors
Peter Schillebeeckx, Marc Verwerft, Gašper Žerovnik, Yves Parthoens, Bent Pedersen, Gery Alaerts, Gerry Cools,
Kevin Govers, Jan Paepen, Giovanni Varasano and Ruud Wynants

 2
Abstract
A method to determine the neutron production rate of a sample of spent nuclear fuel by means of non-
destructive analysis conducted under controlled-area conditions is described, validated and demonstrated. A
standard neutron well-counter designed for routine nuclear safeguards applications is applied. The method
relies on a transfer procedure that is adapted to the hot-cell facilities at the Laboratory for High and Medium
level Activity of the SCK CEN. The sample transfer and measurement procedures are described together with
results of Monte Carlo simulations. Experiments with radionuclide sources were carried out at the Joint Research
Centre to test the procedures and to determine the performance characteristics of the detection device. Finally,
measurements of a segment of a spent nuclear fuel rod were carried out at the SCK CEN to validate and
demonstrate the method.

 3
1 Introduction
Characterisation of spent nuclear fuel is essential in supporting a safe, secure, ecologic and economic handling,
transport, interim storage and final disposal of spent nuclear fuel assemblies [1]-[4]. From operational safety
perspectives, several quantities are of high importance: the source terms of interest for radiation protection are
the neutron and -ray emission rates and spectra, the decay heat (due to all decay mechanisms) is required for
spent nuclear fuel thermal performance and ageing assessment and the fissile inventory is one of the main
drivers for criticality safety considerations and nuclear safeguards. Similar concerns drive the source term for
the long-term safety assessment of disposal facilities. These source terms are determined by a complex
inventory of nuclides with strongly varying characteristics [1]-[5]. Such an inventory and an evaluation of its
evolution over the next thousands of years can only be obtained by theoretical calculations. Evidently, the
theoretical calculations need to be validated and realistic confidence limits have to be determined [4], [6]. Both
the validation and estimation of confidence limits require high quality experimental data. At present such data
are primarily based on a combination of destructive chemical and radiochemical analysis methods [7]-[10],
involving a series of steps including the dissolution of the sampled material [11]. Data obtained by Non-
Destructive Analysis (NDA) are rather scarce. One of the objectives of the Work Package 8 Subtask 2 of the
European Joint Programme on Radioactive Waste Management (EURAD) is to develop and improve state-of-
the-art NDA methods to characterise Spent Nuclear Fuel (SNF) samples and assemblies [12]. These methods
will be applied to provide accurate data for code validation and to provide recommendations for nuclear data
that need to be improved [12].

In this report a procedure to measure non-destructively the neutron production rate of a SNF sample outside a
hot cell under standard controlled area conditions is described, validated and demonstrated. The procedure
relies on the hot cell infrastructures at the Laboratory for High and Medium level Activity (LHMA) of the Belgian
nuclear research centre (SCK CEN). The procedure can be applied to any neutron counter that is optimised for
neutron correlation measurements. The characteristics of the detection system together with the expected dose
rates were estimated by Monte Carlo (MC) simulations. The results of the simulations were verified by
experiments performed at the Joint Research Centre (JRC) and the SCK CEN) The results of this exercise serve
as a first case demonstration that an SNF sample can be characterised by NDA methods outside a hot cell
under standard controlled area conditions avoiding risks of contamination and excessive dose rates.

Theoretical estimations and examples of neutron production by SNF starting from UO2 fresh fuel are discussed
in section 2. The characteristics of the SNF segment sample that was measured are specified in section 3.
Details about the detection system are given in section 4. The transfer container together with the procedures
applied at the LHMA of SCK CEN are specified in section 5. Dose rates estimates based on measurements at
JRC Ispra and the LHMA of SCK CEN are compared with results of calculations in section 6. The operating and
performance characteristics of the detection system based on measurements with radionuclide sources are
specified in section 7. The results of the measurements of the SNF segment sample are given in section 8. In
section 9 the model that is used to analyse the data is explained and the final results are discussed. Section 10
provides a summary of the report and perspectives.

 4
2 Theoretical considerations on neutron production by spent nuclear fuel Neutron emission of SNF is due to spontaneous fission (sf) of actinides and (, ) reactions in light nuclei. The total spatial-dependent neutron production rate ( ⃗, t) as a function of cooling time (or time after end of irradiation) can be written as: ( ⃗, t) = ∑ ( , + , ) ( ⃗, ) , (1) with ( ⃗, ) the spatially dependent number of nuclei (inventory) of nuclide , , the specific neutron production rate per nucleus due to spontaneous fission of nuclide and , the specific neutron production rate due to (, ) reactions following the -decay of nuclide . The specific production rate due to spontaneous fission is given by: , = < > , , (2) where < > is the average total number of neutrons produced per spontaneous fission of nuclide and sf,j the decay constant for spontaneous fission of nuclide . The specific neutron production rate due to -decay of nuclide is determined by: , = , ∑ ∑ ( , ) ( , ) , (3) where , is the decay constant for −decay of nuclide , ( , ) is the probability that an -particle is produced with an energy , and ( , ) is the total number of neutrons produced per incident -particle with energy , interacting with nuclide . The production of neutrons by (, ) reactions is mostly treated under the assumption of an infinitely thick target, i.e. the thickness is sufficient to stop -particles and prevent them from escaping the sample. Under these conditions the neutron yield can be calculated by: ( ) ( ) = ∫0 , (4) where ( ) is the microscopic neutron production cross section for an -particle with energy interacting with a target nucleus with a number volume density and ⁄ is the linear stopping power of an - particle in the target material. Figure 1 shows the neutron production rate as a function of cooling time for a simulated UO 2 fuel sample with an initial 235U enrichment of 4.8 wt%, which was irradiated in conditions typical for a Pressurised Water Reactor (PWR) to a Burnup (BU) of 50 GWd/t. The total production rate is plotted together with the contribution from spontaneous fission and (, ) reactions. For cooling times below hundred years neutron emission in spent UO 2 fuel is dominated by spontaneous fission, mainly spontaneous fission of 244Cm. For cooling times between 100 years and 500 years there is a relatively strong contribution from (, ) reactions. This can also be concluded from Figure 2, which plots the relative contributions as a function of cooling time. The relative contributions to the total neutron production rate originating from spontaneous fission and (, ) reactions due to the decay of specific nuclides, i.e. 238, 239, 240, 242Pu, 241Am and 242, 244Cm, are plotted in Figure 3 and Figure 4, respectively. Neutron production due to spontaneous fission of 244Cm represents the largest contribution for cooling times shorter than 80 years. The contribution from (, ) reactions due to the decay of 238Pu, 242Cm and 241Am is relatively small for such cooling times. For cooling times longer than 100 years, neutron emission is mainly due to spontaneous fission of 240, 242Pu and 246Cm and (, ) reactions following the decay of 241Am and 238, 239, 240Pu. 5
Neutron production rate, Sn / (s-1 cm-3) Relative neutron production rate Sn = Ssf + S 1.0 Ssf 1 S Ssf / Sn 0.8 S/ Sn 103 0.6 102 0.4 0.2 101 0.0 1 10 100 1000 1 10 100 1000 Cooling time / a Cooling time / a Figure 1. Total neutron production rate of a SNF sample Figure 2. Relative contribution to the neutron production as a function of cooling time together with the rate of prompt fission neutrons and neutrons created by contribution due to spontaneous fission and (, ) (, ) reactions in a SNF sample as a function of cooling reactions in the fuel. The data are for a simulated UO2 time. The data are for a simulated UO 2 fuel sample with an fuel sample with an initial 235U enrichment of 4.8 wt% initial 235U enrichment of 4.8 wt% that was irradiated in that was irradiated in conditions, typical for a PWR, to a conditions, typical for a PWR, to a burnup of 50 GWd/t. Data burnup of 50 GWd/t. Data taken from Ref. [3]. taken from Ref. [3]. 1.0 240 1.0 238 Pu Pu Relative (,n) rate, S / Sn 242 239 Pu Pu Relative (sf) rate, Ssf / Sn 240 Pu 0.8 242 Cm 0.8 244 241 Cm Am 246 242 Cm Cm 244 0.6 0.6 Cm 0.4 0.4 0.2 0.2 0.0 0.0 1 10 100 1000 1 10 100 1000 Cooling time / a Cooling time / a Figure 3. Relative contribution to the neutron production Figure 4. Relative contribution to the neutron production rate of prompt fission neutrons by 240,242Pu and rate of (, ) neutrons due to the -decay of 238,239,240Pu, 242,244,246 Cm as a function of cooling time. The data are for 241 Am and 242,244Cm as a function of cooling time. The data a simulated UO2 fuel sample with an initial 235U are for a simulated UO2 fuel sample with an initial 235U enrichment of 4.8 wt% that was irradiated in conditions, enrichment of 4.8 wt% that was irradiated in conditions, typical for a PWR, to a burnup of 50 GWd/t. Data taken typical for a PWR, to a burnup of 50 GWd/t. Data taken from from Ref. [3]. Ref. [3]. For cooling times in the range of 2 − 50 years, neutron emission of spent UO2 fuel is for more than 80 % dominated by spontaneous fission of 244Cm and the neutron production rate can be used to estimate the 244Cm inventory. Starting from fresh UO2 fuel this curium isotope is produced through a sequence of successive neutron capture reactions and − -decays. The different production paths are shown in Figure 5. The most probable path includes the production of 239Pu by the 238U( , ) reaction and involves six neutron induced capture reactions. The latter explains the strong dependence of the 244Cm inventory of a SNF sample on the burnup, as illustrated in Figure 6. This figure plots the 244Cm inventory starting from a UO2 fresh fuel sample as a function of burnup for an initial enrichment of 4.8 wt%. 6
Due to the strong link between the neutron production rate and the 244Cm inventory, the neutron production rate
can be considered as a burnup indicator and as an experimental observable for nuclear safeguards applications
to verify the plutonium content in spent fuel and reprocessed raffinates [13]. Absolute measurements of the
neutron production rate of a SNF sample are rather scarce, if not, non-existing at all. In this work a procedure
to measure the neutron production rate of a SNF sample relative to the one of a 252Cf(sf) neutron source is
proposed. The objective is to determine the neutron production rate and derive the 244Cm inventory with a
relative uncertainty of 2 %, which is close to or even better than the performance of radiochemical analysis
methods [9], [10], [14]. The results of such neutron measurements are valuable data to validate the 244Cm
inventory derived by theoretical calculations.

Note that in this document uncertainties are quoted as standard uncertainties corresponding to a 68 %
confidence interval.

 Figure 5. Schematic representation of the production path of 244Cm by successive neutron capture reactions and − -
 decays starting from the 238U( , ) reaction. The main path is indicated in green.

 x 10-3
 101
 N = a BUb b = 6.0
 Cm concentration / (g/cm3)

 10 0 N = a BUb b = 4.0

 10-1

 10-2

 10-3

 10-4

 10-5
 244

 10-6

 10-7
 0 10 20 30 40 50 60
 Burn up / (GWd/t)

 Figure 6. Inventory of 244Cm as a function of burnup for a simulated UO2 SNF sample with an initial 235U enrichment of
 4.8 wt% that was irradiated in conditions that are typical for a PWR. The inventory is approximated by two power functions
 with different exponents.

 7
3 Characteristics of the analysed spent fuel segment A segment was taken from a SNF rod irradiated in the Tihange 1 PWR during cycles 20 (April 1998 until August 1999) and 21 (September 1999 until 4 March 2001). The assembly FT1X57 from which the rod D05 was taken, was an AFA 2G assembly type manufactured by Areva. The geometry consists of a 15×15 array of fuel rods with 21 unfuelled locations (guide tubes) for insertion of control rods or instrumentation. It contains 188 UO2 rods (4.5 wt% 235U/U) and 16 (U,Gd)O2 fuel rods (10 wt% Gd2O3/(U,Gd)O2 and 2 wt% 235U/U). Details of the irradiation history, fuel composition and geometry are reported in Ref. [15]. The rod average burnup, which was reconstructed from core mapping calculations and reactor power history, was calculated as slightly above 50 GWd/t. The axial variation of the burnup is evident from the results of a -ray scan performed as part of the post-irradiation examinations (see Figure 7 (a)). The burnup is almost independent of the position in the region between 750 mm and 3000 mm, apart from the regular depressions at grid positions (every 700 mm). As a representative fuel rod for modern, high duty fuels, rod D05 has been used in various research and applied research projects, with samples taken for different types of investigations. The sampling in the axial region between 1750 mm and 2100 mm is represented in Figure 7 (b). Several leaching samples were used to investigate instant release of fission products under repository conditions [16], [17]. The results of microstructural analyses using a sample that was taken from the region between 1843 mm and 1854 mm are reported in Ref. [18]. A sample for a burnup analysis was taken from the region between 1819 mm and 1842 mm. The results of the BU analysis are reported in Ref. [19] and reproduced in Table 1. The uncertainty of the weighted average burnup is the combined standard uncertainty due to the sampling, weighing, dilution processes and nuclide inventory analysis. In the calculation of the weighted average of the burnup and its uncertainty the presence of common uncertainty components were taken into account. The sample for the neutron measurements was taken from the region between 2056 mm and 2104 mm. The characteristics of this sample are reported in Table 2. The main uncertainty of the net mass of the fuel material is due to the uncertainty on the state of the cladding: uncertainty of the wall thickness, degree of oxidation and presence of deposits. Table 1. Results of a radiochemical analysis of a SNF segment sample taken in the region between 1819 mm and 1842 mm. The nuclide inventory is expressed relative to the total weight of the fuel, i.e. including the oxygen. The burnup is expressed relative to the total amount of heavy metal, i.e. the fraction of heavy metal in the fuel. The cumulative fission yields used to calculate the BU are specified in the third column. The BU values are derived from the inventory assuming 200 MeV/fission The uncertainties of the BU are only due to those of the nuclide inventory. Details about this analysis are given in Ref. [20]. BU indicator Date of analysis Nuclide inventory Cumulative fission yield Burnup mg/g (x 100) GWd/t 137 Cs 10/21/2013 1.288 (28) 6.334 52.6 (11) 143 Nd + 144Nd 02/05/2014 3.029 (32) 10.158 53.95 (56) 145 Nd + 146Nd 02/05/2014 1.962 (21) 6.479 53.05 (56) 148 Nd 02/05/2014 0.534 (12) 1.724 53.3 (12) 150 Nd 02/05/2014 0.257 (11) 0.836 52.2 (23) Average: 52.78 (37) Table 2. Characteristics of the SNF segment sample that was used for the neutron measurements at the LHMA facilities of SCK CEN. Parameter Length 52.01 (4) mm Segment weight 42.616 (1) g Cladding weight 6.71 (4) g Net fuel weight 35.91 (4) g 8
(a) Result of -ray measurements 3000 Counts 2000 Sampling zone 1000 0 0 1000 2000 3000 4000 Position / mm 3000 (b) Grid affected zone 2500 Counts 2000 Neutron measurements Radiochemical analysis (BU analysis) Microstructural Analysis Leach tests (low O2) Leach tests (high O2) 1500 1700 1800 1900 2000 2100 Position / mm Figure 7. (a) Result of a total -ray scanning measurement of rod D05. The measurements were performed 2 years after the end of irradiation / end of life. The regular peaking pattern observed in the high BU part of the rod, between 750 mm and 3250 mm, is due to local migration of Cs to the pellet-pellet interfaces. Grid positions are clearly distinguished every 700 mm. (b) Results of a -ray scanning measurement in the axial region between 1700 mm and 2150 mm. The samples taken for different types of investigations are indicated with colours. The pellet-pellet interfaces and grid affected zone are clearly distinguished. The axial positions are relative to the bottom end of the fuel rod. 9
4 Neutron detection system
The neutron detection system was a transportable neutron well-counter that is routinely used for nuclear
safeguards verification measurements. The detector was constructed in the 90s at JRC-Ispra for the assay of
bulk samples containing uranium. The design was based on an Active Well Coincidence Counter (AWCC) device
developed at the Las Alamos National Laboratory (LANL) [21]. Unfortunately, technical drawings, design
specifications and data sheets of e.g. the neutron detectors are not available.

The counter has an overall length of 71.5 cm and an external diameter of 47.7 cm. The sample cavity has a
diameter of 22.5 cm and height of 25.4 cm. The top and bottom plugs are made from polyethylene. The sample
cavity is covered with a 0.4 mm thick sleeve of cadmium. Another cadmium sleeve is placed on the outside of
the detector to reduce background contributions from ambient neutrons. A schematic representation of the
counter is shown in Figure 8.

Figure 8. Schematic representation of the neutron counter which was designed and constructed at JRC-Ispra based on an
AWCC device developed at LANL [21].

The detector consists of two concentric rings of 42 3He proportional counters embedded in polyethylene that is
used as a neutron moderator. The counters are arranged in two concentric rings containing each 21 3He gas
proportional counters. They are divided into six groups of seven counters. Each group is connected to one Amptek
A111 hybrid charge sensitive preamplifier, discriminator and pulse shaper board [22]. Three boards are
connected to three counters of the inner ring and four of the outer ring and three boards are connected to four
counters of the inner ring and three of the outer ring, as illustrated in Figure 9.

The logic output of each board is sent to a counter/timer device and to an OR gate. The output of the OR gate
can be used as an input for any shift register type of instrumentation or data acquisition system that registers
the time of arrival of each detected event. For the measurements reported in this work a CAEN DT5751 digitiser
[24] and a JSR-12 shift register [25] were used. The former produced list mode data of the time of arrival of
each detected event and was used to register Rossi-alpha spectra. The JSR-12 shift register is based on a
concept developed by Böhnel [26]. It records the total number of detected events together with the number of
events that are detected in two time windows with an equal width, which are opened by each detected event.
The width of these windows, referred to as the gate width, is denoted by . The first gate is opened at a short
time after each detected event. This time or predelay is represented by . Its content, mostly referred to as
‘Reals + Accidentals’ or ‘R+A’, is due to a contribution of real coincident events (e.g. in case of a fission source)
and accidental coincident events. The second gate is opened at a very long time delay after the first gate. Its
content provides a direct measure of the accidental coincident events. The totals and reals rate, denoted by
and , respectively, are also known as singlets and doublets (see e.g. Refs. [27]-[30]).

 10
to preamp 3
 to preamp 4

 to preamp 2

 to preamp 5

 to preamp 1
 to preamp 6

Figure 9. Schematic representation of the grouping of the detectors and their connection to an Amptek A111 hybrid charge
sensitive preamplifier, discriminator and pulse shaper board (figure taken from Ref. [23]).

 11
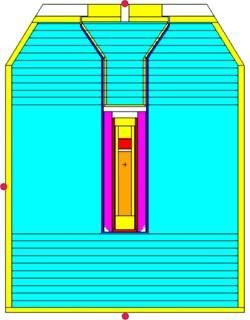
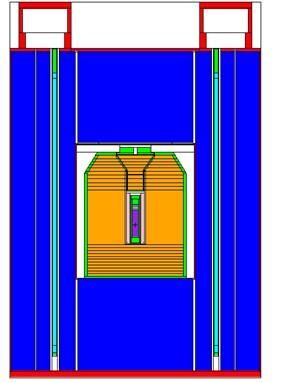
5 Sample transfer containers and procedure Hot cell facilities are often not suited to accommodate a detection system as described in the previous section. Therefore, a dedicated procedure was developed to transfer a SNF sample from a hot cell to the neutron detection system eliminating the risk of contamination and minimising the radiation exposure of staff. A series of mandatory requirements had to be respected: ₋ the SNF sample should be large enough such that the data does not suffer from limited counting statistics; ₋ -ray shielding should be sufficient to allow a clear separation between the events resulting from the detection of a neutron and a -ray (-pile up); ₋ -ray shielding should be sufficient such that loading and unloading operations can be performed without exposure risk of staff performing these operations; ₋ the SNF sample should be encapsulated such that release of radionuclides to the environment is impossible; ₋ the encapsulated sample should be free of surface contamination; ₋ the entire process (sampling, encapsulation, loading in the neutron detector, measurement, and unloading) should be fully compliant with applicable safety regulations. Additional optional requirements are to minimise additional countermeasures during data acquisition and to allow repeated background, calibration and sample measurements. It was decided to work out a simple, yet effective multi-barrier encapsulation, consisting of four layers: two layers to minimise risks of spreading contamination and two other barriers to reduce the impact of the -ray radiation. The fuel rod segment was first loaded in a stainless steel capsule with tight sealing, enabling ultrasonic cleaning of the outer surface. After cleaning and verification of residual surface contamination, the capsule was loaded in a second aluminium can with a magnetic screw cap enabling easy manipulation to load the sample in and remove it from a GT-75 transport container of the SCK CEN. To increase the -ray shielding, the GT-75 container was pre-loaded with a sleeve made of a high-density tungsten base alloy (DENAL®). A schematic illustration of the multi-barrier encapsulation is shown in Figure 10. (a) (b) Figure 10. Part (a) is a technical drawing of the GT-75 transport container of SCK CEN loaded with the SNF sample placed in the stainless steel and aluminium container. Part (b) represents the different encapsulation and shielding layers. The colour coding is as follows: orange/red for the SNF sample; green for the stainless steel capsule; blue for the aluminium capsule; grey for the DENAL® sleeve and black for the lead shielding. The GT-75 container, equipped with lifting eye bolts, was adapted to fit in the cavity of the neutron detector, as shown in Figure 11. Dimensioning of all components was performed such that optimal measurement conditions were met in terms of dose rates, compatibility with the neutron counter cavity, safety of the handling operations and compliance with operation restrictions. Prior to any operation, the expected dose rate for all handling operations and the dose rates during the measurements, were calculated on the basis of a SNF nuclide inventory and design data of the detection device and transfer containers. The results of these calculations together with results of dose rate measurements are discussed in the next section. 12
The handling sequence consisted of:
 ₋ precise cutting of a SNF segment sample to the required length;
 ₋ accurate weighing of the SNF segment sample;
 ₋ loading of the SNF segment sample in the stainless-steel capsule, cleaning and contamination control;
 ₋ loading in the aluminium capsule and contamination control;
 ₋ loading in the lead shielded container, foreseen with DENAL® sleeve and radiation level control during
 manipulation;
 ₋ loading of the container in the neutron detector cavity and control of static radiation level during data
 acquisition.
Unfortunately, only one GT-75 container was available such that it was not possible to perform a sequence of
repeated background, calibration and SNF segment sample measurements.

Figure 11. Schematic representation of the final configuration for the measurements of a SNF segment sample under
standard controlled area conditions with the SNF segment sample in the transfer and GT-75 transport container.

 13
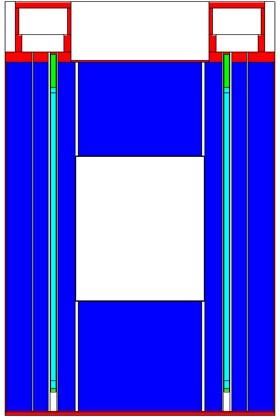
6 Dose rates
The effectiveness of the multi-barrier encapsulation described in the previous section was verified by
measurements with a 137Cs radionuclide source at the PERLA laboratory of JRC-Ispra. The source, with a claimed
nominal activity of 8 GBq, was put in a tungsten container before it was the transferred into the GT-75 container.
The latter was placed inside the AWCC device as shown in Figure 12. The position of the 137Cs source is indicated
with a green dot. Due to the external dimensions of the tungsten container there was not enough space to place
the Pb tap that closes the GT-75 container. Dose rate measurements were carried out at the outer surface of
the device, as indicated by the red dots in Figure 12, and at 1 m distance from the side. The results of these
measurements are compared in Table 3 with dose rates derived from Monte Carlo (MC) simulations with MCNP
[31]. The dose rates were estimated using the photon fluence to absorbed dose conversion factors
recommended by the International Commission on Radiological Protection (ICRP) [32], and assuming a weighting
factor 1 between the equivalent dose and absorbed dose. The calculated dose rates are about a factor 2 lower
compared to the measured ones. This systematic difference is most likely due to the declared activity of the
source. Unfortunately, no activity certificate was available for the 137Cs source. Evidently, differences due to
limitations of the calculations cannot be excluded.

Figure 12. Schematic representation of the conditions for the dose rate estimations with a 137Cs source. The source is
placed in a tungsten container and the GT-75 container. The position of the source is indicated with a green dot and the
measurement positions with red dots. Note that there was no place to close the GT-75 container with the Pb tap.

Table 3. Comparison of the measured (E) and calculated (C) dose rates at the outer surface of the neutron detector device
and at 1 m distance from the side. The data are for a 137Cs radionuclide source with a declared activity of 8 GBq placed in
a tungsten container and the GT-75 container. Uncertainties due to number of simulated events can be neglected.

 Position Measured dose rate (E) Calculated dose rate (C) C/E
 top 180 μSv/h 90 μSv/h 0.50
 side 1.5 μSv/h 0.80 μSv/h 0.53
 bottom 1.5 μSv/h 0.75 μSv/h 0.50
 side at 1 m 0.5 μSv/h 0.35 μSv/h 0.70

 14
The results of the measurements and calculations were used to define an ALARA procedure for measurements with a SNF segment sample at the LHMA laboratories of SCK CEN. In the ALARA procedure, conservative dose rates were considered by multiplying the calculated dose rates by a factor 2. The procedure covered the transport of the SNF sample from the hot cell to the neutron counter using the GT-75 container and subsequent measurements following the procedures described in the previous section. Dose rates were calculated for a UO2 SNF sample of 36 g that was irradiated in conditions, typical for a PWR, to a burnup of 50 GWd/t with a cooling time of 17.5 years. These conditions are based on the fuel irradiation history of the SNF sample described in section 3. The calculated dose rates were derived from a combination of stochastic calculations with SERPENT [33], [34] and MCNP [31]. SERPENT was used to calculate the nuclide inventory of the SNF sample and MCNP to perform the -ray transport. Dose rates were calculated at the outer surfaces of the container and detection device and at a 1 m and 5 m distance from the container and detection device. The results are summarised in Table 4. Permission to perform the operations and measurements with the SNF segment sample was granted on the basis of these data. Table 4. Calculated dose rates at the outer surface of the GT-75 container and neutron detector device (top, side and bottom) and at 1 m and 5 m distance from the side for a SNF sample with similar characteristics as the one described in section 3. Uncertainties due to number of simulated events can be neglected. Position GT-75 container Neutron detection device Calculated dose rate Calculated dose rate Top 90 μSv/h 1.2 μSv/h Side 270 μSv/h 7.0 μSv/h Bottom 500 μSv/h 9.0 μSv/h at 1 m (side) 0.45 μSv/h 0.20 μSv/h at 5 m (side) 0.02 μSv/h 0.01 µSv/h A measurement campaign with the SNF segment sample described in section 3 was organised at the LHMA laboratory of the SCK CEN. The experiments to determine the neutron emission rate lasted about three days. The results of these measurements are reported in section 8. The dose rates at the outer surface of the GT-75 container containing the sample were verified before the container was placed in the neutron detection device. The measurement points are shown in Figure 13. The results, which are reported in Table 5, are in good agreement with the calculated data. The dose rates are mainly due to -rays following the decay of 137Cs and 154 Eu. The data in Table 5 show that at 1 m distance from the device the dose rates are well below 2 μSv/h such that no extreme dose-mitigating measures were required. When the experiments to determine the neutron emission rate of the SNF sample were finalised the SNF segment sample was transported back to the hot cell. The GT-75 container was removed from the hot cell and swipe tests were performed at the inside and outside of the GT-75 transport container. The results of these tests did not show any evidence of a residual contamination of the GT-75 container. Hence, this measurement campaign demonstrated that NDA experiments with a SNF sample can be carried out under standard controlled area conditions without exposure risks of staff performing the operations or measurements, avoiding release of radionuclides to the environment and keeping the outside of the aluminium container free from surface contamination. 15
Figure 13. Schematic representation of the dose rate measurements with the SNF segment sample placed in the transfer
and GT-75 transport containers. The measurement positions are indicated by a red dot.

Table 5. Measured and calculated dose rates at the outer surface of the GT-75 container. The conservative dose rates
adopted in the ALARA procedure for the SNF sample measurements at the LHMA laboratories of SCK CEN are also given.
The dose rates are for a SNF sample with similar characteristics as the one described in section 3.

 Position Measured dose rate Calculated dose rate Conservative dose rate

 top 120 μSv/h 90 μSv/h 180 μSv/h

 side 300 μSv/h 270 μSv/h 540 μSv/h

 bottom 1000 μSv/h 500 μSv/h 1000 μSv/h

 16
7 Operating and performance characteristics of the detection system
Experiments with radionuclide sources were carried out at JRC-Geel and JRC-Ispra to determine the operating
and performance characteristics of the neutron detection device including the transfer and transport containers
described in section 5. Measurements were performed using AmBe( , ) sources with certified intensities,
252
 Cf(sf) sources and a 137Cs source with a nominal activity of 8 GBq. Operating characteristics

 7.1 High voltage
The performance of each 3He proportional counter was verified by recording the pulse height spectrum taken
with a 241AmBe( , ) source. Experiments were carried out connecting each counter to a conventional electronics
chain consisting of a pre-amplifier, spectroscopic amplifier and analog-to-digital convertor to verify both the
performance of each proportional counter and the settings of the Amptek A111 board. The conventional
electronics chain was connected to a data acquisition system developed at JRC-Geel [35].

The operating voltage was set at 2100 V. The source was placed in the centre of the detector cavity in the
conditions of Figure 8, i.e. without transfer and GT-75 transport containers. The pulse height spectra taken in
these conditions are very similar, as shown in Figure 14. This suggests that all counters have similar
characteristics, i.e. anode wire diameter and 3He gas pressure. The spectra obtained by summing the results for
counters that are connected to the same Amptek A111 board are compared in Figure 15. This figure illustrates
that for a fixed amplification the detectors can be operated with the same high voltage and discriminator
conditions.

The optimum operating voltage with the counters connected to the Amptek A111 board was verified by
recording the counts as a function of high voltage using the same AmBe source. The results are compared in
Figure 16. The figure reveals for each group a clear plateau between 2000 V and 2200 V and suggests an
optimum high voltage of about 2100 V for each group of counters. The results obtained with the A111 board
are fully consistent with those obtained with the conventional electronics chain, which are obtained in almost
ideal operating conditions. This is illustrated in Table 6 which compares the total counts obtained with the two
systems for the same measurement conditions with the counters operated at 2100 V. The counts for the
measurements with the conventional electronics are derived by integrating the amplitude spectrum applying a
lower amplitude limit as indicated in Figure 15.

 17
Group 1 Group 2
 102 102
 Detector number Detector number
 1 1
 2 2
 3 3
 101 4 101 4
 5 5
 Counts

 Counts
 6 6
 7 7
 100 100

 10-1 10-1

 10-2 10-2
 0 200 400 600 800 1000 0 200 400 600 800 1000
 Amplitude Amplitude

 Group 3 Group 4
 102 102
 Detector number Detector number
 1 1
 2 2
 3 3
 101 4 101 4
 5 5
 Counts

 Counts

 6 6
 7 7
 100 100

 10-1 10-1

 10-2 10-2
 0 200 400 600 800 1000 0 200 400 600 800 1000
 Amplitude Amplitude

 Group 5 Group 6
 102 102
 Detector number Detector number
 1 1
 2 2
 3 3
 101 4 101 4
 5 5
 Counts

 Counts

 6 6
 7 7
 100 100

 10-1 10-1

 10-2 10-2
 0 200 400 600 800 1000 0 200 400 600 800 1000
 Amplitude Amplitude

Figure 14. Amplitude spectra for each of the 42 3He proportional counters. The spectra are taken with an AmBe( , )
neutron source in the centre of the cavity of the device in the configuration of Figure 8. Each figure shows the spectra for
a set of counters that are connected to the same A111 board. All spectra were taken with the same total measurement
time.

 18
103 5000 Group number Group number 1 1 2 2 102 3 4000 3 4 4 5 5 Counts Counts 6 6 101 3000 100 2000 10-1 1000 10-2 0 0 200 400 600 800 1000 1600 1800 2000 2200 2400 Amplitude High voltage / V Figure 15. Amplitude spectra for the six groups of 7 Figure 16. Total count rate as a function of operating high proportional counters. The spectra are taken with an voltage for the six groups of 7 proportional counters taken AmBe( , ) neutron source in the centre of the cavity of with an AmBe( , ) neutron source in the centre of the the device in the configuration of Figure 8. The arrow cavity of the device in the configuration of Figure 8. All data indicates the lower integration limit used to calculate the were taken with the same total measurement time. total detected counts. All spectra were taken with the same total measurement time. Table 6. Total counts for each group of seven proportional counters obtained from measurements with a conventional electronics chain ( 1 ) and with the A111 board ( 2 ). The last column is the ratio. All data were taken with the same total measurement time. Detector group Conventional electronics A111 board 1 / 2 1 2 1 260922 259587 0.995 2 278080 277364 0.997 3 261963 261689 0.999 4 272135 272326 1.001 5 256596 255123 0.994 6 271366 271179 0.999 Figure 17 compares the total count rate as a function of the high voltage resulting from measurements with a 252 Cf source and measurements with the same 252Cf source combined with a 8 GBq 137Cs source. The data were taken with the source inside the transfer containers and GT-75 container, as in Figure 12. The data in Figure 17 confirm that for measurements with the A111 board the optimum high voltage in low -ray background conditions is around 2100 V. However, they also reveal the reduction of the width of the high voltage plateau due to the increasing -ray background. 19
20000 252 Cf 252 Cf + 137Cs Total count rate / s-1 10000 0 1600 1800 2000 2200 2400 High Voltage / V Figure 17. Total count rate as a function of operating high voltage. The results for measurements with a 252Cf(sf) source are compared with those resulting measurements with a 252Cf source and a 137Cs source with a nominal activity of 8 GBq. 7.2 Time dependence Measurements with a 252Cf(sf) source inside the transfer and GT-75 containers using the CAEN DT5751 digitiser were carried out to determine the time dependence of the response of the neutron detection device. Figure 18 shows a Rossi-alpha distribution from measurements in the configuration of Figure 11 with the 252Cf(sf) source positioned at the bottom of the internal container. The data in Figure 18 show that at least two exponential decay components are needed to describe the time dependence: a main component with a decay constant of 50.6 (2) µs and a second component with decay constant of 119 (4) µs. The relative contributions of these components to the total response are 0.884 (8) and 0.116 (8), respectively. These parameters were derived from a least-squares adjustment to the experimental data. The uncertainties are due to propagating only uncertainties due to counting statistics. Exp. Exp. 104 PR(t) = G1(t) + G2(t) 104 PR(t) = Eq. 10 G1(t) = N a1 1 e-1t Rossi- distribution, PR(t) PR(t) from MC simulations Rossi- distribution, PR(t) G2(t) = N (1-a1) 2 e-2t) 103 103 102 102 21000 Exp. PR(t) = Eq. 10 20000 PR(t) from MC simulations Rossi- distribution, PR(t) 19000 18000 1 10 101 17000 16000 15000 0 2 4 6 8 10 12 14 Time, t / ms 0 10 100 0 100 200 300 400 500 0 100 200 300 400 500 Time, t / ms Time, t / ms Figure 18. Rossi-alpha distribution from measurements Figure 19. Rossi-alpha distribution from measurements with a 252Cf(sf) neutron source placed in the detection with a 252Cf(sf) neutron source placed in the detection device in the conditions of the configuration in Figure 11. device in the conditions of the configuration in Figure 11. The experimental data are compared with the results of a The experimental data are compared with the results of a least-squares adjustment to the data using a sum of two least squares adjustment to the data using a sum of two exponential decay components. exponential decay components and the distribution derived from Monte Carlo simulations combined with the autocorrelation function of Eq. 5. 20
The deviation from a single exponential decay was confirmed by results of MC simulations. The Rossi-alpha
distribution ( ) was derived by applying an autocorrelation function:
 ( ) = ∫ ( ′ ) ( ′ + ) ′ , (5)
with ( ′ ) ′ the probability to detect a neutron at a time between ′ and ′ + ′ after its creation. The latter
was obtained from simulation with MCNP [31]. The energy distribution of prompt fission neutrons from 252Cf(sf)
recommended by neutron standards project [36] was used for the calculations. The results of this calculation
are shown in Figure 19 and compared with the experimental date after applying a normalisation factor derived
from the integrated response between 4.5 µs and 68.5 µs.

 7.3 Dead time
To determine the parameters for dead-time corrections, measurements were performed with the output of the
detection device connected to a JSR-12 shift register. The shift register was operated with a pre-delay of =
4.5 µs and a gate width of = 64 µs. Parameters to apply the empirical dead time correction proposed in Ref.
[37] were derived from measurements with a set of 252Cf(sf) sources with different intensities. Applying this
empirical correction, the measured and dead time corrected totals and reals rates are related by:
 0 ≈ ( 1+ 2 ) (6)
 0 ≈ 4 ( 1+ 2 ) (7)
with and the measured totals and reals rates, respectively, and 0 and 0 the corresponding dead-time
corrected rates. The results of these measurements are shown in Figure 20. The experimental data can be
reproduced using only the linear term of the exponential exponent, that is, with 2 = 0 (µ )2 . The dead-time
parameter 1 = 0.250 (5) µs was derived from a least-squares adjustment to the data. The uncertainty
results from propagating only uncorrelated uncertainties due to counting statistics.
 0.29

 0.28

 0.27
 Exp. data
 0.26 (R/T) = (R0/T0) e - 3/4 d1 T
 (R/T)

 0.25

 0.24

 0.23

 0.22
 1000 10000 100000
 Total count rate, T / (1/s)
Figure 20. Ratio of the reals and totals rate as a function of the totals rate obtained from measurements in the
configuration of Figure 11 using 252Cf sources with different intensities. All sources are sealed in an A3024 capsule type of
Eckert & Ziegler [38]. The data are described by combining Eq. 6 and Eq. 7 with 1 = 0.250 (5) µs and 2 = 0 (µ )2 .

 7.4 Gate fraction and detection efficiency
The detection efficiency of the AWCC counter with the detectors operated at 2100 V and the output connected
to the JSR-12 shift register was determined for neutrons originating from an 241AmBe( , ) source. The source
was placed in the centre of the device in the configuration of Figure 8, without the transfer and GT-75 transport
containers. Results derived from measurements at JRC-Ispra and JRC-Geel are reported in Table 7. The
efficiencies derived from these measurements are within the uncertainty of the declared intensity in very good
agreement. The average efficiency = 0.2116 (21) derived from the experimental data is about 15 % lower
compared to the detection efficiency = 0.249 derived from Monte Carlo simulations using MCNP. The energy
distribution for 241AmBe( , ) recommended by ISO 8529-1:2001 [39] was used for the simulations.

 21
Table 7. Detection efficiency for neutrons emitted by a 241AmBe(, ) radionuclide source placed in the centre of the neutron detection device for the configuration shown in Figure 8 with the 3He detectors operating at 2100 V. The detection efficiency is derived from the net total count rate and certified neutron emission rate of the sources. The uncertainties of the experimental efficiencies are dominated by those of the certified intensities. Source Laboratory / s-1 0 / s-1 Detection efficiency 4442NK JRC-Ispra 2.122 (30) × 104 4537 (10) 0.2138 (30) Am 405/13 JRC-Geel 7.711 (110) × 104 15102 (30) 0.2090 (30) 0.2116 (21) Unfortunately, 252Cf(sf) sources with a certified neutron output were not available at the time of the measurements reported in this work. Therefore, the detection efficiency for prompt fission neutrons from 252 Cf(sf) was obtained from a combination of the net totals and reals rate applying the point model presented by Hage and Cifarelli [27]-[30] and Böhnel [40]. Applying this model the detection efficiency and the production rate for prompt fission neutrons from spontaneous fission can be derived from [41]: 0 = (1 + , ) (8) (1) (1) 0 = 2 (9) (2) with (1) the first order and (2) the second order normalised factorial moments of the neutron multiplicity distribution. The total number of delayed fission neutrons are denoted by and the ratio of the detection efficiency for delayed and prompt fission neutrons by , . The factorial moments and number of delayed neutrons that are recommended for 252Cf(sf) are reported in Table 8. The gate fraction is the number of detected correlated events within a gate width that is opened at a time after each detected event relative to the number of detected events in the time interval [0, ), with = 0 and → ∞. Eq. 8 and Eq. 9 are valid for a point source with neutrons produced by spontaneous fission without any neutron multiplication in the source. Table 8. Half-lives [42], fraction for spontaneous fission [42], normalised factorial moments derived from the multiplicity distribution of the prompt fission neutrons for 244Cm(sf) and 252Cf(sf) in Refs. [43], [44] and delayed neutron emission data from Ref. [45]. The average total number of prompt fission neutrons for 252Cf(sf) resulting from the neutron standards project [36] is also given. Nuclide 1/2 (sf) fraction (1) (2) / (1) 244 Cm 18.11 (3) a 1.36 (1) 10-6 2.710 (10) 2.971 (37) 0.0033 (10) 1.22 (36) 10-3 252 Cf 2.6470 (26) a 3.086 (8) 10-2 3.757 (10) 5.9759 (95) 0.0086 (10) 2.29 (27) 10-3 252 Cf 3.7551 (18) [36] The gate fraction can be derived from measurements with 252Cf(sf) sources that are certified for their neutron production rate as discussed in Ref. [46]. Unfortunately, at the time the experiments were carried out such sources were not available. Two approaches were applied to estimate the gate fraction. In a first approach the Rossi-alpha distribution was parameterised by a sum of two exponentials: ( ) = [ 1 1 −1 + (1 − 1 ) 2 −2 ] (10) with the parameters ( , 1 , 1 , 2 ) derived from a least-squares adjustment to the experimental data. The gate fraction resulting from such a parameterisation is defined by: = 1 −1 (1 − −1 ) + (1 − 1 ) −2 (1 − −2 ) (11) Note that Eq. 10 is used to parameterise the distribution ( ), while in the approaches of e.g. Refs. [47], [48] the probability to detect a neutron at a time after its creation (i.e. ( ) in Eq. 5) is parameterised by a double exponential decay. 22
In a second approach the gate fraction was derived directly from the experimentally observed Rossi-alpha distribution as the ratio of integrated counts in the time interval [ , + ] and the integrated counts in the interval [0, ). The contribution of the interval [0, 4 µ ] to the counts in the interval [0, ) cannot be determined accurately due to dead time effects (see the insert in Figure 19). This contribution, which is about 7 %, was obtained from the parameterised and simulated Rossi-alpha distribution both normalised to the experimental one in the region between 4.5 µs and 68.5 µs. The results of the different approaches are compared in Table 9. Based on these data a gate fraction = 0.6195 (30) and = 0.6278 (10) was adopted for the configurations without (Figure 8) and with transfer and transport containers (Figure 11), respectively. Table 9. Results of different approaches to evaluate the gate fraction for measurements with a 252Cf(sf) point source in the configuration of Figure 8 and Figure 11 and for measurements with the SNF segment sample in the configuration of Figure 11. The uncertainties are only due to propagating uncorrelated uncertainties due to counting statistics. Analysis approach Gate fraction, Cf 252 252 Cf SNF segment sample Configuration Configuration Configuration Figure 8 Figure 11 Figure 11 Analytical (Eq. 11) 0.6240 (15) 0.6268 (5) 0.6317 (5) Numerical integration exp. data + 0.6196 (30) 0.6277 (10) 0.6338 (10) simulated data for [0, 4 µ ] Numerical integration + 0.6195 (30) 0.6278 (10) 0.6338 (10) Eq. 11 for [0, 4 µ ] Adopted 0.6195 (30) 0.6278 (10) 0.6338 (10) The detection efficiency was determined for the configuration without (Figure 8) and with transfer and transport containers (Figure 11). Measurements were carried out at JRC-Ispra using two 252Cf(sf) sources with different intensities. For the analysis a relative detection efficiency , = 1.10 was assumed. This relative detection efficiency was derived from MC simulations using the energy distribution recommended in Ref. [36] for prompt fission neutrons and the one of ENDF/B-VIII.0 [49] for the delayed neutrons. It should be noted that the impact of the delayed neutrons is extremely small. By neglecting their contribution, the neutron production rate for prompt fission neutrons is overestimated by about 0.2 % and the detection efficiency for prompt fission neutrons underestimated by about 0.1 %. The results of the analysis are given in Table 10. They are compared with the detection efficiencies derived by MC simulations. The experimental detection efficiency for the conditions of Figure 11 (with the transfer and transport container) is increased by about 4 % compared to the one in the configuration of Figure 8 (without containers). The difference in absolute detection between the experimental and simulated data confirms the overestimation of the detection efficiency derived from MC simulations for neutrons emitted by an AmBe( , ) neutron source. Previous experiences in modelling such detection devices, see e.g. Ref. [50], shows that relative differences between experimental and calculated detection efficiencies are mostly less than 5 %. Unfortunately, the present detector was constructed in the 90s and documentation to verify the design parameters and technical details about the 3He detectors could not be retrieved. Therefore, it was difficult to identify the origin of the systematic differences [51]. Figure 21 shows the axial dependence of the detection efficiency derived from the totals rate for the measurement conditions of Figure 11. There is an increase in detection efficiency as a function of axial position with a maximum increase of about 3.5 %. There is a good agreement between the axial dependence derived from experimental and simulated data. Due to the axial dependence, the detection efficiency depends on the type of source container and the position of the active material within the container. The detection efficiency for a 252Cf(sf) source in an A3024 capsule type of Eckert and Ziegler [38] changes by 1 % when it is rotated by 180°. 23
You can also read


