The OECD STAN Database for industrial analysis: Sources and methods - Peter Horvát, Colin Webb
←
→
Page content transcription
If your browser does not render page correctly, please read the page content below

OECD Science, Technology and Industry Working Papers
                                                 2020/10

The OECD STAN Database
                                                 Peter Horvát,
     for industrial analysis:
                                                    Colin Webb
     Sources and methods
                                      https://dx.doi.org/10.1787/ece98fd3-en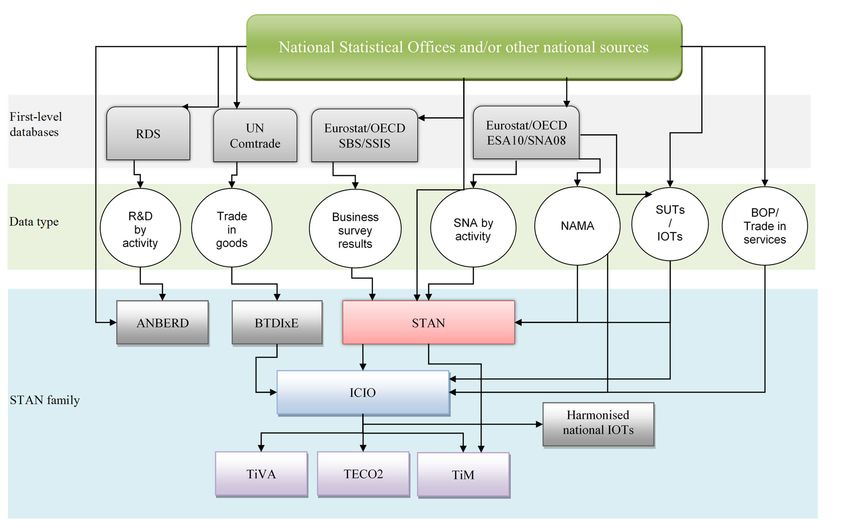
2 THE OECD STAN DATABASE FOR INDUSTRIAL ANALYSIS
OECD Science, Technology and Industry Working Papers
OECD Working Papers should not be reported as representing the official views of the
OECD or of its member countries. The opinions expressed and arguments employed are
those of the authors.
Working Papers describe preliminary results or research in progress by the author(s) and
are published to stimulate discussion on a broad range of issues on which the OECD works.
Comments on Working Papers are welcomed, and may be sent to the Directorate of
Science, Technology and Innovation, OECD, 2 rue André-Pascal, 75775 Paris Ce-------dex
16, France.
This document, as well as any data and map included herein, are without prejudice to the
status of or sovereignty over any territory, to the delimitation of international frontiers and
boundaries and to the name of any territory, city or area.
The statistical data for Israel are supplied by and under the responsibility of the relevant
Israeli authorities. The use of such data by the OECD is without prejudice to the status of
the Golan Heights, East Jerusalem and Israeli settlements in the West Bank under the terms
of international law.
© OECD 2020
The use of this work, whether digital or print, is governed by the Terms and Conditions to
be found at http://www.oecd.org/termsandconditions.
OECD SCIENCE, TECHNOLOGY AND INDUSTRY WORKING PAPERS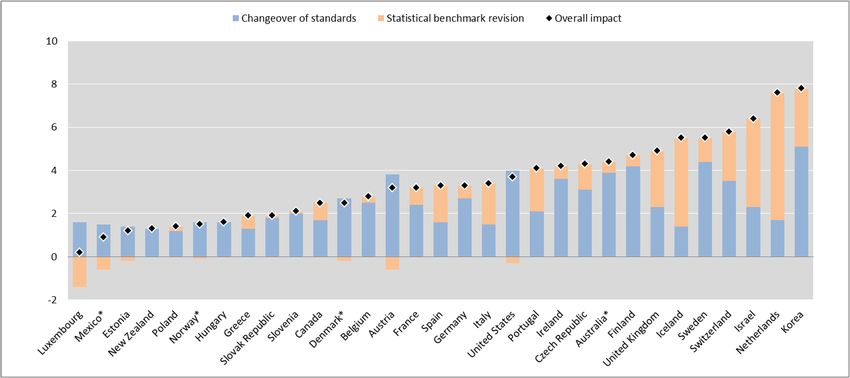
THE OECD STAN DATABASE FOR INDUSTRIAL ANALYSIS 3
Table of Contents
The OECD STAN Database for Industrial Analysis .......................................................................... 5
Introduction ........................................................................................................................................... 6
1. The origins and evolution of the STAN database ........................................................................... 7
1.1. STAN ISIC Rev. 2 SNA93 ........................................................................................................... 7
1.2. STAN ISIC Rev. 3 SNA93 ........................................................................................................... 8
1.3. STAN ISIC rev. 4 SNA93 ............................................................................................................ 8
1.4. STAN ISIC rev. 4 SNA08 ............................................................................................................ 9
1.5. STAN ISIC rev. 4 SNA08 with 2015 benchmark revisions ........................................................10
2. Data sources and links with other OECD databases .....................................................................11
2.1. Principal data sources ..................................................................................................................11
2.2. Old SNA93/ISIC Rev.3/4 databases as sources ...........................................................................14
2.3. Databases linked to STAN - the STAN family ............................................................................14
2.4. Apparent inconsistencies across OECD industrial data sets ........................................................16
3. STAN industry list ............................................................................................................................17
4. Variables in STAN............................................................................................................................21
4.1. Variable definitions......................................................................................................................21
4.2. Derived variables and indicators ..................................................................................................28
4.3. Variable coverage ........................................................................................................................28
4.4. Units .............................................................................................................................................29
5. Estimations in STAN ........................................................................................................................30
5.1. Current price ................................................................................................................................30
5.2. Volumes measures .......................................................................................................................31
5.3. Quality control checking ..............................................................................................................32
6. Country notes and data notes in the STAN application................................................................34
6.1. Country notes ...............................................................................................................................34
6.2. Data notes ....................................................................................................................................36
7. Recommended uses, limitations and next steps .............................................................................37
References .............................................................................................................................................38
Appendix ...............................................................................................................................................40
OECD SCIENCE, TECHNOLOGY AND INDUSTRY WORKING PAPERS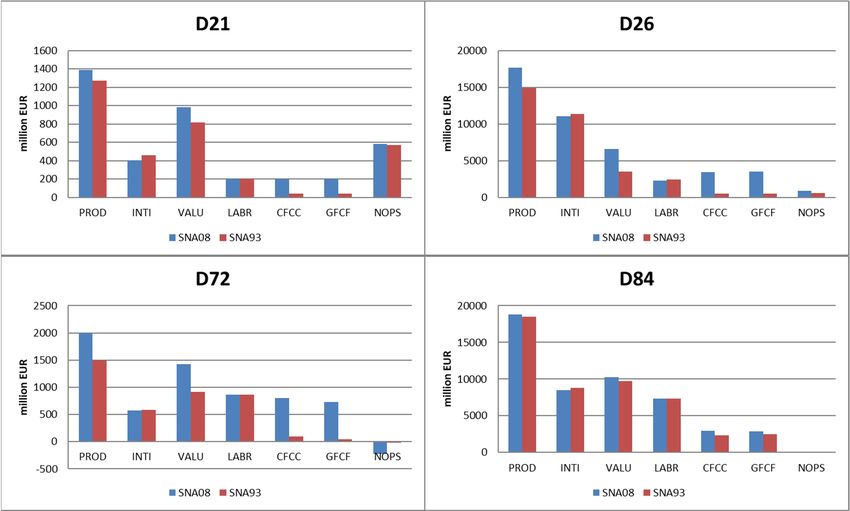
4 THE OECD STAN DATABASE FOR INDUSTRIAL ANALYSIS
Tables
Table 1.1. Overview of STAN evolution ................................................................................................ 7
Table 3.1. Non-standard ISIC rev. 4 aggregates used in STAN and their rough equivalents in previous
versions of ISIC ..............................................................................................................................17
Table 3.2. Alternative ISIC rev. 4 aggregates provided in STAN database ...........................................18
Table 4.1. Valuation of Gross Value Added ..........................................................................................22
Table 4.2. Summary of the production account variables provided in STAN .......................................24
Table 4.3. Summary of the income account variables provided in STAN .............................................25
Table 4.4. Summary of employment related variables provided in STAN ............................................26
Table 4.5. Summary of the capital account variables provided in STAN ..............................................28
Table 4.6. Derived variables...................................................................................................................28
Table 5.1. Calculation of balancing variables ........................................................................................31
Table 5.2. Calculation of different volume measures .............................................................................32
Table 5.3. Checking- List of ratios .........................................................................................................33
Table 6.1. Data notes ..............................................................................................................................36
Figures
Figure 1.1. The overall impact of the benchmark revision on GDP levels for the year 2010* ..............10
Figure 2.1. STAN family databases .......................................................................................................15
Figure 4.1. Different valuation of capital stock ......................................................................................27
Figure 6.1. Country note example for Austria ........................................................................................35
Boxes
Box 2.1. Differences between National Accounts, Industrial Surveys and SUTs ..................................13
Box 3.1. STAN industry list ISIC rev.4 .................................................................................................19
Box 4.1. Valuation of Value Added .......................................................................................................23
OECD SCIENCE, TECHNOLOGY AND INDUSTRY WORKING PAPERS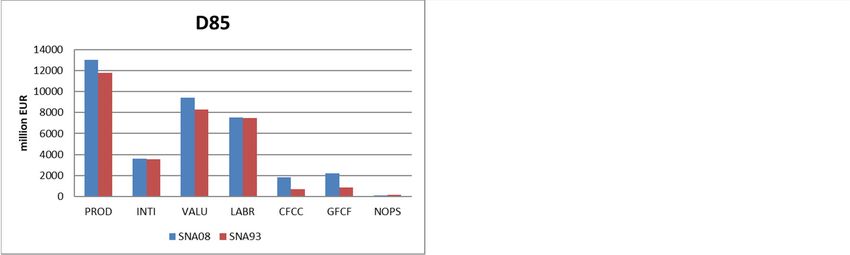
THE OECD STAN DATABASE FOR INDUSTRIAL ANALYSIS 5
The OECD STAN Database for Industrial Analysis
Sources and methods
Peter Horvát and Colin Webb
OECD Directorate for Science, Technology and Innovation (STI)1
This paper summarises and describes the variables, industries, methods and sources used
in the construction of the STructural ANalysis (STAN) industry database. The STAN
database serves as a tool for analysing industrial performance at a relatively detailed level
of industrial activity. It includes annual measures of output, value added and its
components, as well as labour input, investment and capital stock from 1970 onwards. This
allows for a wide range of comparative cross-country analyses focusing on, for example,
productivity growth, competitiveness and economic structural change. A standard industry
list allows for comparisons across countries and provides sufficient detail to focus on, for
example, high R&D-intensive activities, high digital-intensive activities or detailed ICT
industries. The industry list is compatible with those used in related OECD industry
databases.
1
All comments and suggestions are appreciated and should be addressed to stan.contact@oecd.org.
OECD SCIENCE, TECHNOLOGY AND INDUSTRY WORKING PAPERS
6 THE OECD STAN DATABASE FOR INDUSTRIAL ANALYSIS
Introduction
The STAN database for STructural ANalysis (STAN) provides analysts and researchers
with a comprehensive tool for analysing industrial performance at a relatively detailed level
of activity. It includes annual measures of output, value added and its components; labour
input, investment and capital stock for total assets including ICT assets, from 1970
onwards, allowing users to construct a wide range of analyses focusing on, for example,
productivity growth, competitiveness and general structural change. A standard industry
list allows comparisons across countries and provides sufficient detail to enable users to
focus on, for example, high R&D intensive activities, high digital intensive activities or
detailed ICT industries. The industry list is compatible with those used in related OECD
databases.
STAN is based primarily on member countries' annual National Accounts by activity tables
and uses data from other sources, such as national industrial surveys/censuses, to estimate
missing detail or, previous vintages or different versions of either National Accounts or
STAN or other harmonised datasets to extend series back to 1970s. Many of the data points
in STAN are estimated; they do not represent official member country submissions.
Estimates are distinguished from official data through the use of flags or metadata. The
purpose of estimation in STAN is twofold: to provide the longest time series possible based
on available data, overcoming breaks in series across different vintages of official statistics,
mostly due to changes in methodology; and to provide consistent estimates for detailed
industries not available in official National Accounts. The current version of STAN is based
on the International Standard Industrial Classification of all Economic Activities, Revision
4 (ISIC Rev. 4) and the System of National Accounts 2008 (SNA08) or European System
of Accounts 2010 (ESA10) for European countries. Earlier versions of STAN were based
on ISIC Rev. 3 and ISIC Rev. 4 combined with SNA93/ESA95.
STAN is updated on a 'rolling basis' - new tables are made available as soon as they are
ready via OECD’s online statistics dissemination tool OECD.STAT (for direct access go
to http://oe.cd/stan). From OECD.STAT main page (http://stats.oecd.org), STAN is
grouped under “Industry and Services” together with related data sets such as R&D
expenditure (ANBERD), Bilateral Trade by Industry and End-Use (BTDIxE) and
harmonised national Input-Output Tables (IOTs). STAN is maintained by the Directorate
for Science, Technology and Innovation under the auspices of OECD's Committee on
Industry, Innovation and Entrepreneurship (CIIE). The database is published on the
responsibility of the Secretary-General of the OECD.
This paper is organised as follows. In the first section, the motivation behind the creation
and evolution of the STAN database over time is described. Section two presents the
primary and secondary sources used to generate the STAN database and how it links with
other OECD databases. Sections three and four describe the industry breakdown and the
definitions of variables. The estimation methodology used to populate the STAN database
is explained in section five, while section six presents examples of metadata. In the last
section, recommended uses, some possible limitations and planned future extensions of the
database are outlined.
OECD SCIENCE, TECHNOLOGY AND INDUSTRY WORKING PAPERSTHE OECD STAN DATABASE FOR INDUSTRIAL ANALYSIS 7
1. The origins and evolution of the STAN database
The STAN industry database was conceived in the early 1990s as one of a suite of four
databases designed with the aim of measuring and analysing international technology
diffusion and its impact on productivity (Papaconstantinou, Sakurai and Wyckoff, 1996,
and Sakurai, Ioannidis and Papaconstantinou, 1996). The other three databases were i)
industry R&D expenditures (ANBERD) used as a proxy to estimate “technology intensity”,
ii) harmonised national Input-Output tables (for 10 countries) to track inter-industry flows
of embodied R&D, and iii) estimates of exports and imports of goods by industry (BTD)
to help track inter-country flows of embodied R&D. Since its first publication, the STAN
database has evolved significantly. Not only has it followed changes in international
standards (e.g. SNA) and activity classifications but its country, industry and variable
coverage has increased significantly. The first version of STAN was based on ISIC rev. 2
and the 1968 System of National Accounts (SNA68) and only covered manufacturing
activities, seven measures of industrial activity and 12 countries. In the beginning, the
database represented an annual snapshot of industrial statistics and to improve timeliness,
nowcasting methods were developed based on quarterly data. The latest version of STAN
is based on the 2008 System of National Accounts (SNA08) and ISIC Rev. 4 classification.
The STAN database is published on a rolling basis for all OECD countries, nearly all ISIC
Rev.4 2-digit Divisions of economic activity (and additional detail) and covers 46
measures. The following section and Table 1.1present a brief, non-exhaustive, overview of
the different versions and changes over time.
Table 1.1. Overview of STAN evolution
Version/coverage Countries Industries Variables SNA Year Key changes
1.1.STAN 49 ISIC Rev. 2 1968/ 1970- Introduction of basic prices;
22 8
ISIC Rev.2 SNA93 Manufacturing only 1993 1998 capitalisation of software
Industry coverage extended to
1.2 STAN 1970-
34 107 ISIC Rev. 3 30 1993 all activities; rolling updates;
ISIC Rev.3 SNA93 2009
and chain-linked volumes
1.3 STAN 1970-
15 121 ISIC Rev. 4 32 1993 Industry classification change
ISIC Rev.4 SNA93 2011
1.4 STAN 1970-
38 138 ISIC Rev. 4 36 2008 Capitalisation of R&D
ISIC Rev.4 SNA08 2016
1.5 STAN
1970-
ISIC Rev.4 SNA08 27* 153 ISIC Rev. 4 46 (+ ICT assets) 2008 Benchmark revisions
2018
(2015 benchmark)
Note: *at the time of publication of this paper
1.1. STAN ISIC Rev. 2 SNA93
Implementation of the recommendations of the 1993 System of National Accounts
(SNA93, or ESA95 in Europe) led to two main changes in the time-series presented in
STAN database. Firstly, SNA93 introduced the recommendation that gross output and
value added by industry should be provided at basic prices. Previously, countries used the
concept of producer's prices, or factor costs, recommended under SNA68 (also, SNA93
recommended the use of purchaser’s prices for Input-Output Tables). Secondly, SNA93
recommended that intangible assets such as software and mineral exploration should be
capitalised. The change of treatment of software purchases had a significant effect on
OECD SCIENCE, TECHNOLOGY AND INDUSTRY WORKING PAPERS8 THE OECD STAN DATABASE FOR INDUSTRIAL ANALYSIS
STAN estimates. With software now considered as an investment rather than current costs,
estimates of Gross Fixed Capital Formation (GFCF) were much higher than before,
particularly in heavy ICT using sectors. Removal of software from Intermediate
consumption led to an increase in Gross value added. However, the range of the revisions
were significantly different across countries and investigations revealed that differences in
estimation procedures contributed significantly to the differences in software capitalisation
rates (see Ahmad, 2003). Harmonised methods for estimating software were devised for
implementation by countries from the mid-2000’s (see next version of STAN, 1.2
below).The last update of this ISIC Rev.2 version of STAN was published in 1998.
1.2. STAN ISIC Rev. 3 SNA93
During the transition of the STAN database to ISIC Rev. 3, the STAN database changed
its coverage to incorporate all economic activities for the first time, most notably services.
More and more countries adjusted their national accounts to SNA93 and thus the definitions
of variables changed:
Use of chained volumes - Previously, most countries calculated output (and
investment) volumes by using fixed base Laspeyres aggregation (hence the term
"GDP at constant prices"). The majority of countries now provide annually re-
weighted chained volumes.
Capital Stock estimates - Asset type breakdowns were expanded in many countries
(e.g. to separate ICT and software goods) which affected the estimation of capital
stocks by industry. Also, many countries refined their methodologies (for
example, introducing new estimates of retirement patterns or average service
lives).
Use of quality-adjusted or "hedonic" deflators (see Triplett, 2006) - the
increasing use of such deflators for ICT products significantly altered the profile
of output deflators in ICT industries compared with using prices of ICT products
based on traditional deflating methods.
Financial intermediation services indirectly measured (FISIM - formerly
known as “Imputed bank service charges”) were allocated to Intermediate
consumption by activity. Previously, FISIM was deducted from Gross value added
at the total economy level to arrive at total Gross Domestic product (GDP).
Output of services - There was a general effort in many countries to improve
direct measurement of the output of services. For example, the practice of
estimating real output for services using input measures (such as employment),
particularly for the public sector, greatly limited the validity of productivity
indicators for the industries concerned.
This version of STAN was updated, and published, between 1999 and 2011. The final
edition presented time series up to 2009.
1.3. STAN ISIC rev. 4 SNA93
In line with preparation for the implementation of SNA08 many countries (mainly in
Europe) adopted ISIC Rev.4 (NACE Rev. 2) to classify their economic activities. Although
there are many similarities in the industry descriptions of ISIC Rev.4 and ISIC Rev. 3 (the
standard for SNA93), there are quite a number of significant differences in the detailed
OECD SCIENCE, TECHNOLOGY AND INDUSTRY WORKING PAPERSTHE OECD STAN DATABASE FOR INDUSTRIAL ANALYSIS 9
activities included (for an illustration see Annex 2). Therefore, even without changes in
definitions of variables, differences were apparent between the two versions of national
accounts based data sets such as STAN. Only a handful of countries produced SNA93
series with ISIC Rev.4 / NACE Rev.2 and this version of STAN was relatively short-lived:
only updated between 2012 and 2014.
1.4. STAN ISIC rev. 4 SNA08
From 2009, OECD Member Countries revised their National Accounts to conform to
recommendations outlined in SNA08 or, in Europe, ESA10 (EU, 2013). By the end of
2014, most OECD countries had implemented the new standards. Australia was the first in
2009, followed by Canada in 2012, and Israel, Mexico and the United States, in 2013.
During 2014, implementation was completed by EU countries and Iceland and Switzerland
(in line with EU legislation on the implementation of the ESA 2010) as well as by Korea,
Norway and New Zealand. Chile, Japan and Turkey published SNA08 statistics in the
following two years.
The changes in the international standards (SNA93 to SNA08), that had the most impact
on headline indicators such as GDP, concerned the “capitalisation” of expenditures on
Research and Development (R&D) and, to a much lesser extent, military weapons systems:
Research and development- purchases of R&D are now recorded as investments
whereas previously they were treated as intermediate consumption (c.f. change in
treatment of software under SNA93). This change increases value added and
GFCF. However, a considerable part of R&D is not purchased but conducted
within an enterprise. This increases output with the own-account production of
R&D-assets, thus also increasing value added and GFCF.
Military weapons systems – military vehicles, warships, submarines, tanks,
aircrafts and missile carriers are also reclassified as fixed assets. Most single-use
weapons are classified as military inventories until they are used. They enter
intermediate consumption, except some particular types of ballistic missiles with
high destructive capabilities that may meet the criteria to be classified as fixed
assets. This revision influences mostly Value Added and Fixed capital formation
of the “Public Administration” (ISIC rev. 4 Division 84) activity.
Figure 1.1 shows, by country, the overall impact on total GDP of the changeover to SNA08
and the concurrent statistical benchmark revisions to National Accounts. The revision had
a significant impact on the overall level of income. The unweighted average of the impact
on all available OECD member countries was a 3.4% increase in the level of GDP. See
Van de Ven (2015) for a discussion on the macroeconomic impact of the change from
SNA93 to SNA08 and, Annex 4 for an example of the impact from an industry perspective.
OECD SCIENCE, TECHNOLOGY AND INDUSTRY WORKING PAPERS10 THE OECD STAN DATABASE FOR INDUSTRIAL ANALYSIS
Figure 1.1. The overall impact of the benchmark revision on GDP levels for the year 2010*
Percentage increase in GDP due to changeover to SNA 2008 standards and to statistical benchmark revisions
*Australia: 2007 data; Denmark: 2008 data; Mexico: 2008 data; Norway: 2011 data.
Source: van de Ven, P.(2015)
This version of STAN was updated, and published, between 2015 and 2019. The final
edition presented time series up to 2016.
1.5. STAN ISIC rev. 4 SNA08 with 2015 benchmark revisions
The latest version of STAN incorporates the most recent statistical benchmark revisions to
National Accounts (notably, by European Union member countries). The most apparent
difference to the previous STAN is the change in reference year for volume and price series
to 2015 (previously, 2010). This change should not have any effect on the growth rate of
volume series because all series presented in STAN are now based on chain-linked
methodology. But there are differences between the two latest versions of STAN mainly
due to the benchmark revisions (improvements in methodology, new sources of data or
reallocation of firms to new industries based on more recent information which can affect
the industry composition) and, mostly for the last three years, the revision of preliminary
data. This version of STAN has been updated since 2019.
OECD SCIENCE, TECHNOLOGY AND INDUSTRY WORKING PAPERSTHE OECD STAN DATABASE FOR INDUSTRIAL ANALYSIS 11
2. Data sources and links with other OECD databases
2.1. Principal data sources
In general, STAN attempts to combine the comparability of National Accounts time series
with the detail of annual industrial surveys or national Supply and Use Tables (SUTs)/
Input- Output Tables (IOTs) to provide a comprehensive data set for analytical use.
2.1.1. Annual National Accounts
Annual National Accounts provide balanced accounts to describe a nation's economy
(usually according to international standards such as SNA08). The contents of most tables
are not directly measured but are compiled from a wide range of data sources with
adjustments and estimations made by national experts. For activity data, much use is made
of the information from annual industrial surveys and/or censuses and short-term indicators
of industrial activity (see below) as well as labour force surveys, business registers, income
surveys, SUTs and benchmark IOTs. National Accounts are considered to be more
internationally comparable than industrial survey data.
STAN is based primarily on Annual National Accounts by activity tables (OECD, 2020a).
Member countries officially submit SNA08 statistics for inclusion in OECD's Annual
National Accounts database (ANA) via a joint OECD/Eurostat questionnaire. Eurostat
collects and processes the statistics for EU countries, and a selection of other European
countries2, before passing them on to OECD. Eurostat publishes National Accounts at the
relatively aggregate “A64” level of the industry classification NACE Rev.23 (which is fully
compatible with ISIC Rev.4 at the full 2-digit level of activity, “A88”). While provision of
SNA statistics at A64 is mandatory for EU member states, they are encouraged to provide
full 2-digit industry statistics on a voluntary basis. Member economies not covered by
Eurostat receive the request directly from OECD’s Statistics and Data Directorate asking
for full 2-digit ISIC Rev.4 detail (the “A88 list”) for as many variables as possible. This
information is particularly important for countries that publish data using national or
regional industry classifications4 to maximise harmonisation with sector definitions in ISIC
Rev.4.
If national statistical offices publish SNA08 data at a more detailed level of activity than
submitted officially to OECD or Eurostat (e.g. below 2-digit ISIC Rev.4) then the national
source information is incorporated into the STAN database.
2
Albania, Bosnia and Herzegovina, Iceland, Liechtenstein, Montenegro, Norway, North Macedonia,
Serbia, Switzerland and Turkey.
3
See https://appsso.eurostat.ec.europa.eu/nui/show.do?dataset=nama_10_a64&lang=en.
4
For example, NAICS in Canada, Mexico and the United States, ANZSIC in Australia and New
Zealand, JSIC in Japan and KSIC in Korea.
OECD SCIENCE, TECHNOLOGY AND INDUSTRY WORKING PAPERS12 THE OECD STAN DATABASE FOR INDUSTRIAL ANALYSIS
2.1.2. Annual Survey Data
Most countries carry out Annual Industrial (or Business) Surveys, many supplementing
them with less frequent censuses. In the past, these have been mainly concentrated on the
Mining, Manufacturing and Construction sectors. Currently, almost all OECD countries
now have well established comprehensive surveys covering service sectors. The OECD
collects such data via a joint OECD/Eurostat questionnaire and publishes them as Structural
Business Statistics-SSIS (OECD, 2020b). It contains industry data at the most detailed level
(4-digit) of ISIC, for a wide range of variables. In most OECD countries, agricultural
activities and/or public enterprises and services are not included in the survey, but might
be included in separate surveys. SSIS can be very useful for the analysis and indicator
development at a very detailed level of ISIC classification within countries. However,
because of differing survey practices across countries (see Box 2.1) it has often been
perceived to have limited international comparability. STAN uses data present in SSIS, or
detailed enterprise statistics from Eurostat’s Structural Business Statistics (SBS) database,
to make estimates for detailed sectors not available in National Accounts. Volume and price
data are generally not available from annual industrial surveys.
Another limitation is comparability over time. Due to changes in industry classifications,
most countries have comparable datasets starting from the mid-2000s. Few, if any, attempts
are made to convert previous survey results based on old national or international
classifications to the latest ISIC Rev. 4, so long time-series are not generally available.
2.1.3. Supply and Use tables and Input- Output tables
The majority of OECD countries compile Supply and Use tables (SUTs5). SUTs are used
as a key harmonising framework using balancing techniques to ensure coherence across
different methodological approaches to the calculation of GDP (e.g. production account
versus expenditure account). The SUTs provide an additional dimension to industry
analysis. Input Output analysis and industrial analysis based on SUTs helps to shed light
not only on productivity and industrial structure but also diverse aspects of globalisation;
for example, measurement of Trade in Value Added (TiVA: http://oe.cd/tiva) and other
trade-related applications such as Trade in Embodied CO2 (TECO2: http://oe.cd/io-co2)
and Trade in Employment (TiM: http://oe.cd/io-emp). With much improved dissemination
of SUTs or Input-Output tables (IOTs) by national statistical offices, the importance of this
source has become more significant in the latest version of STAN. The potential use of
SUTs in STAN is twofold:
1. Detail industry estimation: often SUTs provide more detailed industry information
than National Accounts although, not necessarily consistent over time.
2. Variable estimation: SUTs in previous year or constant prices are sometimes the
only source of price information. For example, some countries do not provide
Output (Production) by industry in National Accounts. If SUTs are not adjusted to
the latest benchmark revisions, it is possible to use Output over Gross Value Added
ratios from SUTs applied to Gross Value Added from National Accounts to obtain
National Accounts aligned estimates of Output It is preferable to use SUTs in the
form of ratios rather than directly, due to issues outlined in Box 2.1.
5
Since 2017, OECD has made official requests for SUTs using standard format (89 ISIC Rev. 4
industries and corresponding CPA products) as a supplement to the official SNA08 questionnaire.
See https://www.oecd.org/sdd/na/supply-and-use-tables-database.htm
OECD SCIENCE, TECHNOLOGY AND INDUSTRY WORKING PAPERSTHE OECD STAN DATABASE FOR INDUSTRIAL ANALYSIS 13
Box 2.1. Differences between National Accounts, Industrial Surveys and SUTs
Coverage - industrial surveys typically cover enterprises (European union member
countries) and/or establishments (mostly non-EU countries) above a certain size limit.
The threshold is usually defined as a certain number of employees or with a turnover
above a certain level. Thresholds vary across countries. Some countries perform further
adjustments, for example, (i) for years when full censuses are not performed, survey
results may be adjusted upwards based on the last census (ii) the surveys may be
supplemented with information from business registers or other sources to cover small
firms. Establishments with no employees are generally not covered. Also,
manufacturing surveys based on establishments often do not include other
establishments in the same enterprise such as head offices, R&D and transport divisions
and other services which may be part of separate surveys. Where an
establishment/enterprise performs activities that cover more than one industry, it is
allocated to industry according to its primary activity (typically determined by Gross
Value Added contribution or Number of Employees). In National Accounts, attempts
are made to get a more complete picture of industrial activity consistent with other SNA
2008 accounts (e.g. expenditure GDP) through the use of data coming from a variety of
alternative sources. For example, National Accounts includes adjustments for the non-
observed economy such as underground production and the informal sector - mainly
unincorporated household enterprises (see OECD et al., 2002).
Variable definition- in view of the above, Employment figures for a particular industry
are typically lower in SSIS than in National Accounts where labour force surveys may
be used to determine employment for total and broad activities. Gross Value Added
from manufacturing surveys, on the other hand, can be greater than that on a National
Accounts basis since at an establishment level only materials and energy may be
recorded as Intermediate consumption - it is difficult to determine the costs of services
such as finance, transport, IT and communications, usually only known at the enterprise
level. In addition, the valuation of Gross Value Added measured in surveys may differ
from that shown in National Accounts. In National Accounts, Gross Value Added is
recorded at basic prices while for industry surveys in many countries (especially in
European SBS) Gross Value Added is expressed at factor costs (the difference being
“other taxes, less subsidies, on production”, such as payroll taxes), If surveys have good
coverage, Output (Production) can match that given in national accounts quite closely.
Relevance- the compilation of SUTs is a complex process and it is common for SUTs
or Input- Output tables (IOTs) to be published for a limited number of years, the
periodicity of publication might be longer than annual and, the latest tables can lag
behind National accounts by more than two years. After publication, historical series of
Industrial Surveys and SUTs are often not revised to comply with the latest standards
that may limit the comparability over time. National Accounts, on the other hand, are
revised annually and in many countries (mostly European) even twice a year. Also,
major benchmark revisions are carried out by OECD countries every five years or so.
With the change of methodology or classification, national offices tend to revise
historical series of National Accounts.
OECD SCIENCE, TECHNOLOGY AND INDUSTRY WORKING PAPERS14 THE OECD STAN DATABASE FOR INDUSTRIAL ANALYSIS
2.2. Old SNA93/ISIC Rev.3/4 databases as sources
When making estimates in STAN, useful sources of data are the last published ISIC Rev. 4
(SNA93) versions of STAN and OECD Annual National Accounts (ANA). Since the
introduction of SNA08, some countries (particularly in Europe) have only provided revised
National Accounts back to the mid-1990s. The old SNA93/ISIC Rev.3/4 databases can be
used to estimate historical data, particularly for aggregate sectors. In addition, detailed 3-
digit or 4-digit ISIC Rev.4 survey data (in SSIS) are usually available from 2008 while data
in SNA93/ISIC Rev.3/4 is available from mid-1990s for nearly all countries. In many cases,
data from the 2005 (ISIC rev.3) version of STAN are used to estimate more detail after first
converting them to ISIC Rev. 4 using the approximate correspondence shown in Annex 2.
2.3. Databases linked to STAN - the STAN family
2.3.1. Bilateral trade by industry
The Bilateral Trade Database by Industry and End-Use – BTDIxE (http://oe.cd/btd)
includes detailed trade flows by manufacturing industry between OECD declaring
countries and a selection of partner countries and geographical regions. Data are derived
from the UNSD Comtrade database by means of a standard conversion key. The latest
version covers the period 1990-2018 and uses an ISIC Rev.4 industry list consistent with
STAN covering about 72 detailed and aggregate goods-producing activities (mainly
manufactures).
2.3.2. Input-Output and the Inter Country Input-Output databases
OECD’s Inter-Country Input-Output (ICIO) tables (http://oe.cd/icio) decompose the global
flows of intermediate and final goods and services between countries and industries.
OECD's “harmonised” national Input-Output tables (http://oe.cd/i-o) show the inter-
industrial transaction flows of goods and services (domestically produced and imported)
between the sales and purchases (final and intermediate) of industry outputs. The 2020
edition of OECD Input-Output and ICIO tables consists of matrices in current prices, for
all OECD countries and 29 non-member OECD countries covering the years 1995 to 2018.
The tables are based on an ISIC Rev. 4 industry list and SNA08. The STAN database
provides inputs such as Output (Production) and Gross Value Added by industry for the
construction of ICIO tables (and hence harmonised national IOTs) and, Employment by
industry for the Trade in eMployment (TiM) database. For an illustration of the
relationships between databases see Figure 2.1.
2.3.3. R&D expenditure by industry
The Analytical Business Enterprise Research and Development- ANBERD database
(http://oe.cd/anberd) is a database estimated with the objective of creating a consistent data
set of R&D expenditures, which attempts to overcome problems of international
comparability and time discontinuity associated with the official business enterprise R&D
data provided to the OECD by its Member countries. ANBERD contains R&D
expenditures from 1987 for all OECD countries and six non-member countries using an
ISIC Rev.4 industry list consistent with STAN.
OECD SCIENCE, TECHNOLOGY AND INDUSTRY WORKING PAPERSTHE OECD STAN DATABASE FOR INDUSTRIAL ANALYSIS 15
Figure 2.1. STAN family databases
Note: RDS, refers to Research and Development Statistics; SNA: System of National Accounts; NAMA: National Accounts Main Aggregates; and, BOP: Balance of Payments
statistics
OECD SCIENCE, TECHNOLOGY AND INDUSTRY WORKING PAPERS16 THE OECD STAN DATABASE FOR INDUSTRIAL ANALYSIS
2.4. Apparent inconsistencies across OECD industrial data sets
The notes above describe other data sets that contain the same variables as STAN according
to industrial activity. When comparing different published OECD data sets, users may find
significant differences in data that they may expect to be similar. The reasons for these
"apparent inconsistencies" include:
Sources and methods. For the reasons outlined in Box 2.1, industrial survey data
(such as Gross Value Added and Employment), even at aggregate levels of activity
can differ significantly from National Accounts data.
Timeliness. Data in STAN may differ from those published in OECD's National
Accounts of OECD countries (ANA) because of the timing of updates. Activity
tables in ANA are just part of a whole range of accounts and updates may occur at
different times than STAN, which attempts to follow the rhythm of countries'
releases of National Accounts activity-based tables (some countries release them in
Spring while others towards the end of the year). It is worth noting that official
revisions of National Accounts can extend back many years.
Context. Data at the aggregate level in STAN (e.g. for Gross Value Added,
Employment and Investment) may not match the latest aggregate data published by
Member countries. Many countries publish aggregate data some months ahead of
more detailed activity data. The emphasis of STAN is to make use of the latest
consistent National Accounts by activity tables rather than the latest aggregate
figures.
OECD SCIENCE, TECHNOLOGY AND INDUSTRY WORKING PAPERSTHE OECD STAN DATABASE FOR INDUSTRIAL ANALYSIS 17
3. STAN industry list
An important feature of STAN is the use of a standard industry list for all countries to
facilitate international comparisons (See Box 3.1). The list is based on International
Standard Industrial Classification of All Economic Activities Revision 4, ISIC Rev.4
(UNSD, 2008) and is designed for easy comparison with previous industry lists. For the
latter reason, it also includes some non-standard aggregates for referencing and use of
vintage industry data reported with earlier versions of ISIC, the previous ISIC Rev.3
version of STAN and aggregation of manufactures in the old ISIC Rev.2 version of STAN
(for examples see Table 3.1). The list is compatible with the Statistical Classification of
Economic Activities in the European Community, NACE Rev.2 - 2008 (EC, 2008).
Table 3.1. Non-standard ISIC rev. 4 aggregates used in STAN and their rough equivalents in
previous versions of ISIC
Description ISIC rev. 4 ISIC rev. 3 ISIC rev. 2
Chemical, rubber, plastics, fuel products and Divisions 19-23 Divisions 23-25 Division 35
other non-metallic mineral products
.Chemical and pharmaceutical products Divisions 20-21 Division 24 Major Groups 351-352
Electrical, electronic and optical equipment Divisions 26-27 Divisions 30-33 Major Group 383
Total services Divisions 45-99 Divisions 50-99 Divisions 61-96
Business sector services Divisions 45-82 Divisions 50-74 Divisions 61-83
Real estate, renting and business activities Divisions 68-82 Divisions 70-74 Division 83
The STAN industry list includes alternative aggregates for use when comparing Gross
Value Added, Employment or Gross fixed capital formation or derived indicators (such as
productivity) across countries. “Non-agriculture business sector excluding Real estate”
(STAN industry code D05-82X) and “Business sector services excluding Real estate” (code
D45-82X) do not include “Real Estate Activities” (ISIC Rev. 4 Division 68). Real estate
activities contribute over 10% of total OECD area Gross Value Added - a significant
proportion of which consists of rental income, both actual rent and “Imputed rent of owner-
occupied dwellings”, with no associated labour input. The inclusion of “Real Estate
Activities” can distort productivity measures, particularly as its volume growth can differ
significantly from that of “Other Business Services.
“Non-agriculture business sector excluding Real estate” also does not include the following
activities that may distort productivity measures:
“Agriculture, Forestry and Fishing” (ISIC Rev.4 Divisions 01-03). Productivity in
agriculture is more affected by weather conditions than other industries. Thus,
observed productivity variations may reflect differences in weather in particular
years. In addition, problems measuring Employment can occur in some countries
where family members are involved in activities but not registered accordingly
(differences in reporting practices related to family members).
“Community, Social and Personal Services” (ISIC Rev. 4 Division 84-99). This
mainly consists of non-market activities such as “Public Administration”,
“Education” and “Health Services”. Measurement of Output and volume measures
of public services is challenging and varies across countries. Many countries use
labour input (such as Employment) growth to estimate Output volume growth in
“Public Administration”, which may undermine the validity of indicators such as
OECD SCIENCE, TECHNOLOGY AND INDUSTRY WORKING PAPERS18 THE OECD STAN DATABASE FOR INDUSTRIAL ANALYSIS
productivity. In most countries, “Education” and “Health Services” volume
estimates are based on output indicators but challenges remain related to
adjustments to account for changes in the quality of service provided. In addition,
the extent to which these services are public varies across countries. In this context,
one should note that this is not the only area where some assumptions are made
regarding productivity. Some countries for example use wage based indices
adjusted for (estimated) productivity changes as deflators in service industries.
Significant assumptions about Gross Value Added per employee rates may also be
used to estimate the output of unregistered employees
Further discussion on the measurement of Output and volume measures in public sector
services can be found in Chapter 1 of OECD's Handbook on Measurement of the Volume
Output of Education and Health Services, Schreyer, P. (2010).
The industry list is also designed to provide users with enough detail to focus on detailed
ICT activities (based on a taxonomy developed by OECD, 2011); R&D-intensive activities
based on taxonomy introduced by Galindo-Rueda and Verger (2016); and a new taxonomy
of digital intensive sectors (Calvino, F. et al., 2018), while taking into consideration general
data availability across countries.
Table 3.2. Alternative ISIC rev. 4 aggregates provided in STAN database
Description ISIC rev. 4
Business sector services excluding Real estate Divisions 45-66,69-82
Non-agriculture business sector excluding Real estate Divisions 05-66,69-82
Information industries Divisions 26, 58-60 ,61, 62-63
ICT industries- detail definition Divisions 61, 62, Groups 261-264, 268,
582, 631, 951 and Classes 4651, 4652
ICT industries- 2 digit definition Divisions 26, 61, 62-63
Energy-producing activities Divisions 05-06, 19, 35
Manufacture of goods for medical purposes Division 21 and Groups 266, 325
High R&D intensive activities (2-digit definition) Divisions 21, 26, 72
Medium-high R&D intensive activities (2-digit definition) Divisions 20 ,27, 28, 29-30, 58, 62-63
High- and Medium-high R&D intensive activities (2-digit definition) Divisions 20-21, 26-28, 29-30, 58, 62-63,
72
High R&D intensive activities (3-digit definition) Divisions 21 ,26, 72 and Groups 303, 582
Medium-high R&D intensive activities (3-digit definition) Divisions 20, 27, 28, 29, 62-63 and Groups
252, 302, 304, 309, 325
High- and Medium-high R&D intensive activities (3-digit definition) Divisions 20-21, 26-28 ,29, 62-63, 72 and
Groups 252, 302, 303, 304, 309, 325, 582
Low digital intensive industries Divisions: 01-03, 05-09, 10-12, 35-39, 41-
43, 49-53, 55-56, 68, 97-98
Medium- low digital intensive industries Divisions: 13-15, 19-23, 24-25, 85, 86-88
Medium- high digital intensive industries Divisions: 16-18, 26-28, 31-33, 45-47, 58-
60, 84, 90-93
High digital intensive industries Divisions: 29-30, 61, 62-63, 64-66, 69-82,
94-96
Also taken into account is compatibility with related OECD data sets such as ANBERD
and OECD’s Input-Output tables (see 2.3.2) and, the level of detail requested in the joint
OECD/Eurostat official Annual National Accounts questionnaire.
OECD SCIENCE, TECHNOLOGY AND INDUSTRY WORKING PAPERSTHE OECD STAN DATABASE FOR INDUSTRIAL ANALYSIS 19
Box 3.1. STAN industry list ISIC rev.4
Description ISIC Rev.4
TOTAL [A-U] 01-99 x
Agriculture, hunting, forestry and fishing [A] 01-03 x
Agriculture, hunting and forestry 01-02 o
Crop and animal production, hunting and related service activities 01 o
Forestry and logging 02 o
Fishing and aquaculture 03 o
Industry including energy [B-E] 05-39 x
Mining and quarrying [B] 05-09 x
Mining and quarrying of energy producing materials 05-06
Mining and quarrying except energy producing materials 07-08
Mining support service activities 09
Manufacturing [C] 10-33 x
Food products, beverages and tobacco [CA] 10-12 x
….Food products and beverages 10-11
……..Food products 10
……..Beverages 11
….Tobacco products 12
Textiles, wearing apparel, leather and related products [CB] 13-15 x
….Textiles and wearing apparel 13-14
……..Textiles 13
……..Wearing apparel 14
….Leather and related products 15
Wood and paper products, and printing [CC] 16-18 x
….Wood and products of wood and cork, except furniture 16 o
….Paper and paper products 17 o
….Printing and reproduction of recorded media 18 o
Chemical, rubber, plastics, fuel products and other non-metallic mineral products 19-23
….Coke and refined petroleum products [CD] 19 x
….Chemical and pharmaceutical products 20-21
……..Chemicals and chemical products [CE] 20 x
……..Basic pharmaceutical products and pharmaceutical preparations [CF] 21 x
….Rubber and plastics products, and other non-metallic mineral products [CG] 22-23 x
……..Rubber and plastics products 22 o
……..Other non-metallic mineral products 23 o
Basic metals and fabricated metal products, except machinery and equipment [CH] 24-25 x
….Basic metals 24 o
……..Iron and steel 241+2431
……..Non-ferrous metals 242+2432
….Fabricated metal products, except machinery and equipment 25 o
……..Manufacture of weapons and ammunition 252
…….. Manufacture of other fabricated metal products; metalworking service activities 25X
Machinery and equipment 26-28
….Electrical, electronic and optical equipment 26-27
……..Computer, electronic and optical products [CI] 26 x
………….ICT manufacturing 261-264+268
………….Manufacture of irradiation, electromedical and electrotherapeutic equipment 266
………….Other electronic and optical products 265+267
……..Electrical equipment [CJ] 27 x
….Machinery and equipment n.e.c. [CK] 28 x
Transport equipment [CL] 29-30 x
….Motor vehicles, trailers and semi-trailers 29 o
….Other transport equipment 30 o
……..Building of ships and boats 301
……..Air and spacecraft and related machinery 303
……..Military fighting vehicles 304
……..Railroad equipment and transport equipment n.e.c. 302+309
Furniture; other manufacturing; repair and installation of machinery and equipment [CM] 31-33 x
….Furniture, other manufacturing 31-32 o
……..Manufacture of medical and dental instruments and supplies 325
….Repair and installation of machinery and equipment 33 o
Electricity, gas and water supply; sewerage, waste management and remediation
35-39
activities [D-E]
….Electricity, gas, steam and air conditioning supply [D] 35 x
….Water supply; sewerage, waste management and remediation activities [E] 36-39 x
……..Water collection, treatment and supply 36 o
……..Sewerage, waste collection, treatment and disposal activities; materials recovery; remediation
37-39 o
activities and other waste management services
Construction [F] 41-43 x
x: present in the SNA A*10, A*21 or A*38 lists; o: present in the SNA A*64 list
OECD SCIENCE, TECHNOLOGY AND INDUSTRY WORKING PAPERS20 THE OECD STAN DATABASE FOR INDUSTRIAL ANALYSIS
OECD SCIENCE, TECHNOLOGY AND INDUSTRY WORKING PAPERSTHE OECD STAN DATABASE FOR INDUSTRIAL ANALYSIS 21
4. Variables in STAN
4.1. Variable definitions
To meet the basic requirements of international research and analysis in areas such as
productivity, competitiveness and general structural change, STAN covers a variety of
variables. The notes below provide general descriptions of the variables based on the
System of National Accounts 2008 (SNA08) definitions. Where national practices are
known to differ, appropriate information is provided in the STAN Country Notes.
4.1.1. The production account
The production account is a cornerstone of industry analysis, which allows the construction
of industry performance indicators – essentially based on the aggregation of production
accounts of enterprises or establishments allocated to the same industrial activity. It should
be noted that productive activities are included, if they are within the definition of the
production boundary of the SNA08 framework. In SNA08, the production as an economic
activity is defined as “an activity, carried out under the responsibility, control and
management of an institutional unit, that uses inputs of labour, capital, and goods and
services to produce outputs of goods and service” (SNA08 para. 6.2). This definition
excludes almost all production of services by households for own use except the own-
account production of housing services by owner-occupiers and the production of domestic
and personal services by employing paid domestic staff.
Output or Production (PROD) is defined as the value of goods and services (including
knowledge capital products) produced in a year, whether sold or stocked.
The related measure Turnover (not present in STAN) corresponds to the actual sales in a
given period and can be greater than Output (Production) if all produced goods and services
are sold together with unsold output from previous periods (i.e. drawing on inventories) or,
can be smaller when some produced goods are not sold in the accounting period and
recorded as inventories. While Output and Turnover will be different in a year, their
averages over a long period of time should converge (depending on how perishable the
stock is).
Intermediate consumption (INTI) represents the value of inputs of goods and services into
processes of production that are used up within the accounting period – these include
energy, materials, services (including any rentals for machinery and equipment but not
capital services from own machinery and equipment, which are included within Value
Added and recorded as a Consumption of fixed capital (see 4.1.2).
Gross Value added (VALU) for a particular industry represents its contribution to national
GDP. It is sometimes referred to as GDP by industry. It is not directly measured. In general,
it is calculated as the difference between Output (and Intermediate consumption (SNA08
para. 6.70).
Gross Value added comprises:
Labour costs (compensation of employees, see 4.1.2),
Consumption of Fixed Capital,
OECD SCIENCE, TECHNOLOGY AND INDUSTRY WORKING PAPERS22 THE OECD STAN DATABASE FOR INDUSTRIAL ANALYSIS
Taxes less Subsidies (the nature of which depends on the valuation used – see
Table 4.1, but according to SNA08 basic prices are recommended - all OECD
countries publish Gross Value Added in basic prices with exception of Japan and
New Zealand in producer’s prices), and
Net Operating Surplus and Net Mixed Income (see 4.1.2).
Some care should be taken with the interpretation of Output (Production), since it includes
Intermediate consumption. Any output of intermediate goods and services consumed
within the same sector is also recorded as output of the sector. For this reason, Gross Value
Added is often considered a better measure of output.
Valuation of Gross Value Added
Three types of Gross Value added measures are presented in STAN depending on the extent
to which taxes and subsidies are included. Estimates of Gross Value Added at Factor costs
are available for almost all countries (except Israel and Switzerland), Gross Value Added
at Basic prices is preferred but for some countries Gross Value Added at Producer’s prices
is the only measure available by industry. Gross Value Added at Purchasers or Market
prices are not presented in STAN. Table below summarises different valuations of Value
Added and the relationships between them.
Table 4.1. Valuation of Gross Value Added
Gross Value Added at Factor costs Consists of Compensation of Employees and Gross Operating Surplus.
+ other taxes less subsidies on These consist mostly of current taxes (and subsidies) on the labour or
production1 capital employed, such as payroll taxes or current taxes on vehicles and
buildings
= Gross Value Added at Basic prices
+ taxes less subsidies on products(not These consist of taxes (and subsidies) payable per unit of some good or
including import duties and VAT) service produced, such as turnover taxes and excise duties
= Gross Value Added at Producer’s
prices
+ taxes less subsidies on imports
+ Trade and transport costs
+ Non- deductible VAT
= Gross Value Added at Purchasers’ Purchasers’ prices are those which purchasers pay for the goods and
prices services they acquire or use, excluding deductible VAT by the purchaser.
Sometimes the term Market prices is used in the context of aggregates
such as GDP
Note: This table draws on the concepts outlined in the 2008 version of the SNA08. All OECD member countries
have now implemented SNA08 (or the EU equivalent, ESA10) which recommends the use of Basic Prices and
Producer's prices (as well as Purchaser's Prices for Input-Output tables).
In STAN, the variable VALU represents Gross Value Added at basic prices following the
SNA08 recommendations. Note that while Output (Production) is also valued in basic
prices, Intermediate consumption by industry is valued at purchasers’ prices; Gross Value
added at basic prices is equal to the difference between Output (Production) at basic prices
and Intermediate consumption at purchaser’s prices. In an Input-Output framework the
separate transactions by type of product can be valued both at basic and at producer’s
prices. Example in Box 4.1 provides a numerical illustration of different valuations of
Gross Value Added using data by activity for Italy.
OECD SCIENCE, TECHNOLOGY AND INDUSTRY WORKING PAPERSYou can also read