E6893 Big Data Analytics Lecture 11: Big Data and AI Applications in Finance Industry - Columbia EE
←
→
Page content transcription
If your browser does not render page correctly, please read the page content below
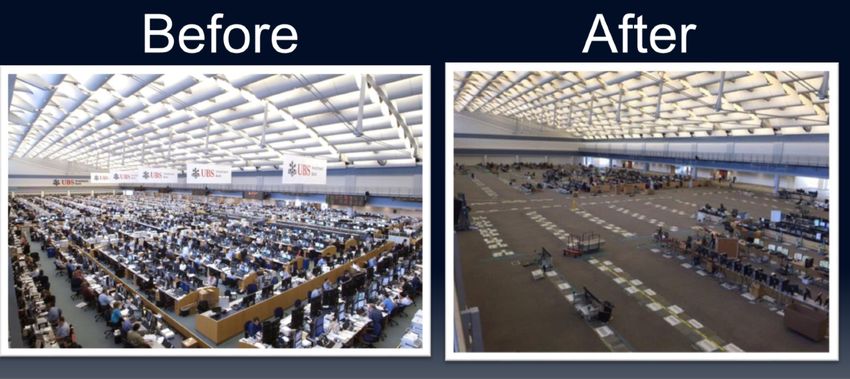
E6893 Big Data Analytics Lecture 11:

   Big Data and AI Applications in Finance Industry

Ching-Yung Lin, Ph.D.
Adjunct Professor, Dept. of Electrical Engineering and Computer Science

                              November 15th, 2019
                          E6893 Big Data Analytics — Lecture 11   © CY Lin, 2019 Columbia University
2 Confidential — Reference for Discussion only; Not for Distribution © 2018 Graphen Inc.
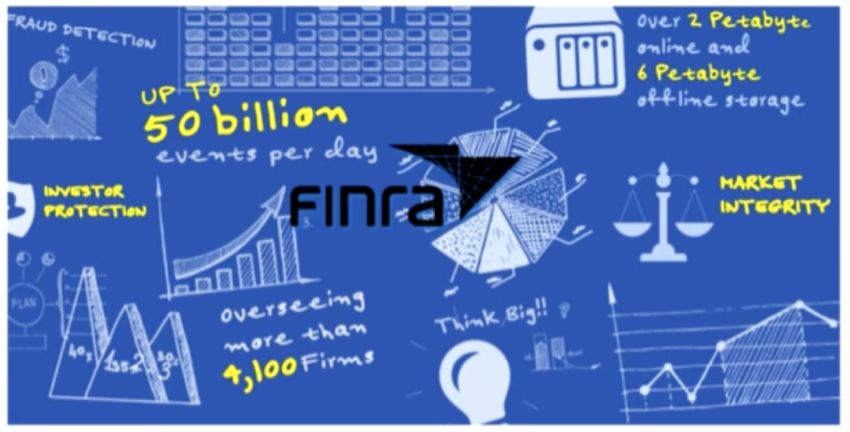
Trader Anomaly Detection

 • How does FINRA analyze ~50B events per day TODAY? – Build a
   graph of market order events from multiple sources [ref]
3
85                   EE6893 Big Data Analytics — Lecture 11   © 2019 CY Lin, Columbia University
Example: Help reduce AML cost

Tremendous Compliance Costs & Workload

                                                             onboarding new customers
                                          48 Days

                                                                                             30
                                                                 Minutes to clear a generated alert

                                                                x            20,000
                                                                                     Alerts per day

                                       =       10,000 =1350 Analysts
                                                Total hours lost per day

4   CONFIDENTIAL: for investment discussion only; copying or forwarding prohibited   © 2018 Graphen Inc.
Money Laundering Detection

• How did journalists uncover the Swiss Leak scandal in 2014 and also Panama
  Papers in 2016? -- Using graph database to uncover information thousands of
  accounts in more than 20 countries with links through millions of files [ref]
 5
 85                       EE6893 Big Data Analytics — Lecture 11   © 2019 CY Lin, Columbia University
Animal Intelligence Evolution

                                               Evolution

                        recognition
           perception

    comprehension                            sensors
    strategy                           representation

                        memory

6                         EE6893 Big Data Analytics — Lecture 11   © 2019 CY Lin, Columbia University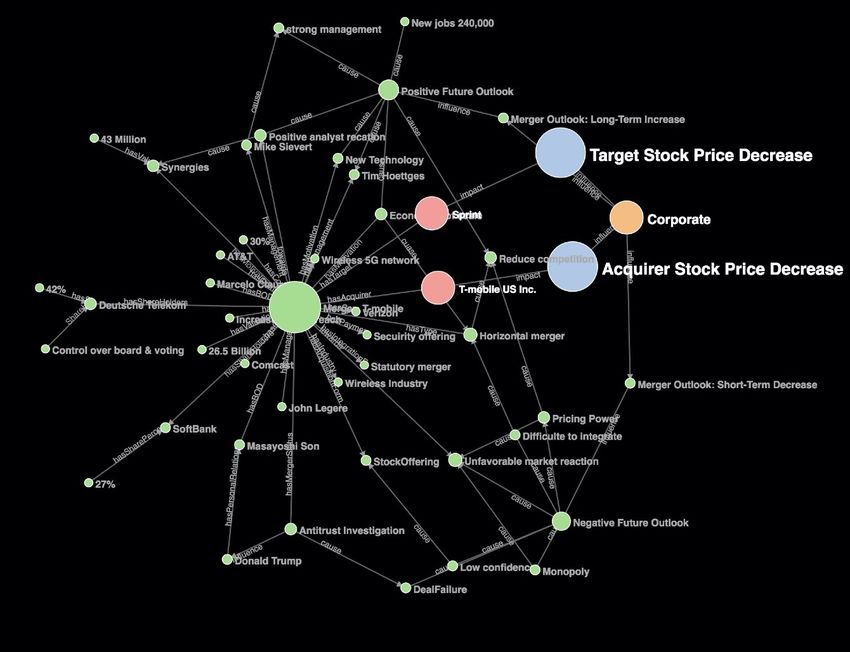
Future of AI ==> Full Function Brain Capability
                                                                                      Most of existing “AI”
                                                                                      technology is only a key
 • Machine Cognition:              • Machine Learning:                                fundamental component.
      • Robot Cognition Tools           • ML and Deep Learning
      • Feeling                         • Autonomous Imperfect Learning
      • Robot-Human
        Interaction                                                                    • Advanced Visualization:
                                                                                            • Dynamic and
• Machine Reasoning:                                  recognition                             Interactive Viz.
     • Bayesian                                                                             • Big Data Viz.
                                 perception
       Networks
     • Game Theory                                                                      • Graph Analytics:
       Tools           comprehension                                        sensors          • Network Analysis
                        strategy                                         representation      • Flow Prediction

                                                    memory

                                                                                          • Graph Database:
                                                                                               • Distributed
                                                                                                 Native Database

  7                             EE6893 Big Data Analytics — Lecture 11                  © 2019 CY Lin, Columbia University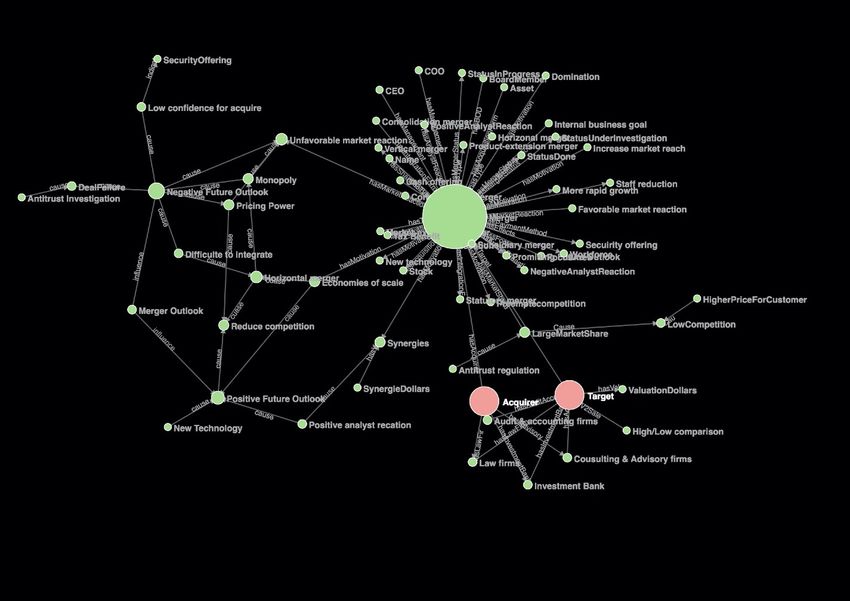
Layers of Artificial Intelligence

                                                                      Advanced / Future AI

Cognition
Layer

Semantics
Layer

Concept
Layer

Feature
Layer

Sensor
Layer

          : observations      : hidden states
                                                                      Most of Today’s AI

  8                          EE6893 Big Data Analytics — Lecture 11     © 2019 CY Lin, Columbia University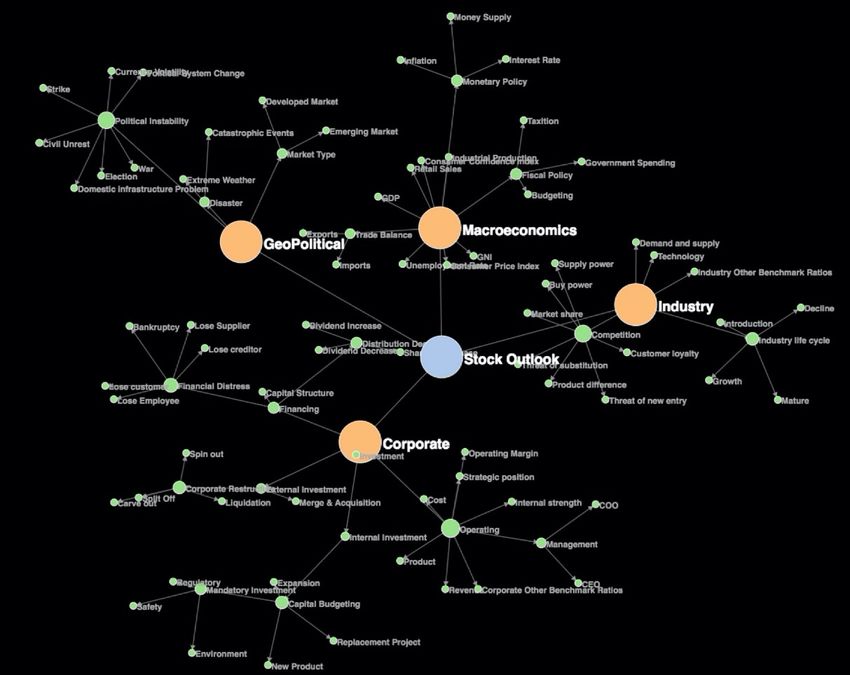
AI Makes Safer, more Intelligent,
    and more Efficient Banks

9            EE6893 Big Data Analytics — Lecture 11   © 2019 CY Lin, Columbia University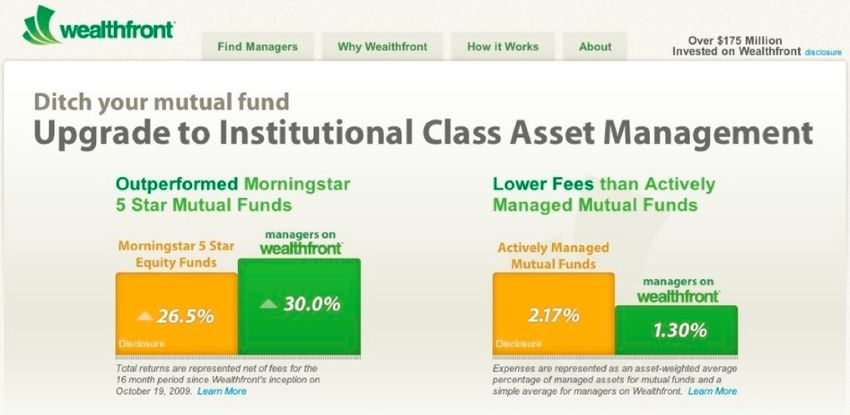
Example of AI Finance Platform (Graphen Ardi Platform)
                              Examples of Finance AI Solutions
                                                                               Regulation
     Core-Banking Non-Performing Anti Money    Fraud                                            Market      AI
                                                                              Reasoning &
      Monitoring Loans Prediction Laundering Detection                                       Intelligence Trader
                                                                              Compliance

                                AI Financial Industry Platform
               Multimodal Analysis                                             Risk Modeling
             Behavioral                                              Anomaly
                           Network Analysis                                               Risk Assessment
              Analysis                                              Detection
             Time-Series                                             Bayesian
                              Flow Analysis                                               Risk Propagation
               Analysis                                             Inference

                                       Advanced AI Platform
               Computation Engine                                               Visualization Engine
                              Statistical
        Graph Analytics                                                       Graph Vis      Statistical Charts
                              Computing
           Machine                                                       Machine Learning
                           Machine Reasoning                                                       Cognitive Vis
           Learning                                                            Vis

                                               Data Engine
                                                                                     Data               Data
       Graph Database Index File Storage Other Data Storage
                                                                                   Ingestion          Retrieval
                                         Confidential (c) 2017, Graphen Inc
10                            EE6893 Big Data Analytics — Lecture 11                          © 2019 CY Lin, Columbia University
Graphen AI FinTech Examples • Significantly improved Non-Performing-Loan accuracy rate in one of the world’s largest banks (from ~20% prediction accuracy to ~60% accuracy). • Advanced Anti-Money Laundering for banks — capable of predicting unknown unknowns. • Detecting Fraud from Real-Time on Transactions in one of the world’s largest transaction platform — on the scale of billions. • Analyzing relationship data for an European bank. • Cyber and Physical Security for another European bank. 11 EE6893 Big Data Analytics — Lecture 11 © 2019 CY Lin, Columbia University
Short Introduction of AI Loan Risk Prediction Solution

12                  EE6893 Big Data Analytics — Lecture 11   © 2019 CY Lin, Columbia University
Predicting Non-Performing Loans

      Utilize AI Platform to predict NPL via:
      • Mining relationship of customers
      • Analyzing all kinds of network topological structure
      • Understanding the entities
      • Predicting the bad loan flows

                        Machine Learning Classifiers                    Ardi Machine Reasoning Tools

                           Dynamic Flow Learning                        Cognitive Reasoning

Ardi
Graph DB and
                               Deep Learning
Graph Analytics

                          Ardi Machine Learning Tools

                  ==> Improving the accuracy from < 20% to near 60%
 13                            EE6893 Big Data Analytics — Lecture 11             © 2019 CY Lin, Columbia University
Debt Performing Analysis to determine the Risk Factors
Transaction circle
Related violation companies
EgoNet Risk
Related violation client
Mutual, guarantee circle
Client
Capability Guarantee Risk
Risk
Related companies mutual
guarantee
Capital return
Investment ratio
Investment Related Risk
Transaction to individuals
Transaction decrease
14 EE6893 Big Data Analytics — Lecture 11 © 2019 CY Lin, Columbia UniversityGraph Analysis to Predict Risk
w
w w
w
w w
x z x w
w w z
Y w w
Graph feature extraction Y w
from multiple relationships W w w
Directional Graph
Weighted Directional Graph
Rick prediction based on Risk Propagation
machine learning and Edge Generation
Trigger dynamic flow.
Trigger edge Trigger
edge x -1 z edge
+1 Trigger x z
Y edge
Risk Prediction
Y Propagation
Directional
Graph
15 EE6893 Big Data Analytics — Lecture 11 © 2019 CY Lin, Columbia UniversityExample of Graph Analytics Library
- Breadth First Search (BFS)
- Centrality Computation
Connected Cycle
- (Strong) Connected Component detection
component
- Cycle Detection D
1
- Ego Net
- Pagerank D
7
- Shortest Path (Dijkstra) Egonet Shortest paths
Collaborative K-neighborhood
EE6893 Big Data Analytics — Lecture filtering
16 11 © 2019 CY Lin, Columbia UniversityIntroduction of AI Anti-Money-Monitoring Solution 17 EE6893 Big Data Analytics — Lecture 11 © 2019 CY Lin, Columbia University
AML Challenges Banks Are Facing Now
   Increased Regulatory Expectations & Enforcement of Current Regulations
● AML laws and regulations keep evolving and become increasingly daunting. AML programs
  and IT systems need to be updated to ensure effectiveness and efficiency.
● Regulated institutions have to address recent regulatory changes to ensure that their
  transaction monitoring and filtering programs are designed to comply with regulatory
  standards and expectations.
 According to a survey conducted by Dow Jones                 According to ACAMS 2017 survey, financial
 and ACAMS on 812 respondents in 2016, 60% of                 institutions in U.S. have had to perform sweeping
 respondents cited this as the greatest AML                   overhauls of their customer screening, monitoring
 compliance challenge. Over 75% of respondents                and reporting processes courtesy of the U.S.
 cited FinCEN’s proposed Beneficial Owner Rules               Treasury’s Office of Foreign Asset Control (OFAC).
 as a contributor to increased workloads and                  Changing OFAC priorities have significantly
 shortage of trained staff, followed by FATCA,                impacted operations for 53 percent of survey
 other tax evasion legislation and Fourth EU Anti-            respondents who regularly engage in sanctions
 Money Laundering Directive.                                  screening.

 On Dec. 21st 2016, the European Commission                   On Jul. 25 2016, the Monetary Authority of
 proposed a series of legislative proposals, hoping           Singapore (MAS) stated that it will step up anti-
 to strengthen the EU’s legal framework for anti-             money laundering controls and take prompt actions
 money laundering, controlling illegal cash flow, and         a g a i n s t t h e b a n k i n g i n d u s t r y. P r e v i o u s
 freezing confiscation of illegal assets, thus                investigations have revealed that several financial
 strengthening the EU’s efforts to fight against              institutions based in Singapore involved funds
 terrorism and organized crime.                               related to the 1MDB scandal.

 18                               EE6893 Big Data Analytics — Lecture 11                       © 2019 CY Lin, Columbia University
2017 AML Penalties -- I
      Date                Punished Agency                          Regulatory Agency               CCY          Amount
                                                           U.S. Treasury Department Overseas
     13-Jan-17     Toronto Dominion Bank of Canada                                                 USD              520,000
                                                                      Control Office
                                                            U.S. Financial Crime Enforcement
     19-Jan-17     Western Union Financial Services                                                USD         184,000,000
                                                                         Agency
                                                            New York State Financial Services
     30-Jan-17          German Deutsche Bank                                                       USD         425,000,000
                                                                         Bureau
     30-Jan-17          German Deutsche Bank                  UK Financial Conduct Authority       GBP         163,000,000
                                                               British Prudential Regulation
      9-Feb-17    Japan Mitsubishi Tokyo Union Bank                                                GBP           17,850,000
                                                                          Authority
                                                               Australian Trading Report and
     16-Feb-17                  Tabcorp                                                            AUD           45,000,000
                                                                      Analysis Center
                 Australian Trading Report and Analysis
     17-Feb-17                                                   Florence, Italy Prosecutor        EUR              600,000
                                 Center
                                                            U.S. Financial Crime Enforcement
     27-Feb-17         California Merchants Bank                                                   USD            7,000,000
                                                                         Agency
                                                            Hong Kong Securities Regulatory
      7-Mar-17           Guangdong Securities                                                      HKD            3,000,000
                                                                      Commission
                                                            Hong Kong Securities Regulatory
     14-Mar-17     Sino-Thai International Securities                                              HKD            2,600,000
                                                                      Commission
                   Guoyuan Securities Broker (Hong          Hong Kong Securities Regulatory
      5-Apr-17                                                                                     HKD            4,500,000
                              Kong)                                   Commission
     11-Apr-17           British Careers Bank                 Hong Kong Monetary Authority         HKD            7,000,000
     26-Apr-17            Irish Union Bank                     Irish Central Bank                  EUR            2,200,000
               National Bank of Mexico, United States United States Department of Justice
   22-May-17                                                                                       USD           97,440,000
                                Branch
   30-May-17          German Deutsche Bank                  Federal Reserve Board                  USD           41,000,000
   30-May-17
  Source:                     Irish Bank
          http://www.yangqiu.cn/HT-AML/4007141.html            Irish Central Bank                  DUR            3,150,000

19                                     EE6893 Big Data Analytics — Lecture 11                   © 2019 CY Lin, Columbia University
2017 AML Penalties - II
Date Punished Agency Regulatory Agency CCY Amount
Singapore Financial Regulatory
31-May-17 Credit Suisse Bank SGD 700,000
Commission
Singapore Financial Regulatory
31-May-17 Singapore UOB Bank SGD 900,000
Commission
French Prudential Supervision
3-Jun-17 BNP Paribas EUR 10,000,000
Association
Italian tax authorities and the Ministry
16-Jun-17 Bank of China Milan Branch EUR 20,000,000
of Economic Affairs
Luxembourg Financial Supervision
22-Jun-17 Edmund Rothschild Group, Switzerland EUR 9,000,000
Commission
6-Jul-17 Latvian Rito Bank A court in Paris EUR 80,000,000
U.S. Financial Crime Enforcement
27-Jul-17 Bitcoin Trading Platform btc-e USD 110,000,000
Agency
Australian Trading Report and
3-Aug-17 Australian Commonwealth Bank AUD 18,000,000
Analysis Center
New York State Financial Services
7-Sep-17 Habib Bank of Pakistan USD 225,000,000
Agency
29-Sep-17 Real Madrid multibank Panama Banking Authority USD 300,000
U.S. Financial Crime Enforcement
1-Nov-17 Lone Star Bank USD 2,000,000
Agency
27-Nov-17 Italy Union Bank of Sao Paulo Irish Central Bank EUR 1,000,000
U.S. Securities and Exchange
21-Dec-17 Merrill Lynch USD 13,000,000
Commission
New York State Financial Services
21-Dec-17 Korea Agricultural Association Bank USD 11,000,000
Agency
Danish Severe Economic and
21-Dec-17 Danske Bank DKK 12,500,000
International Crime Control Agency
Source: http://www.yangqiu.cn/HT-AML/4007141.html
20 EE6893 Big Data Analytics — Lecture 11 © 2019 CY Lin, Columbia UniversityAML Challenges Banks Are Facing Now
Legacy/Outdated Systems & Inaccurate Results
● Financial institutions are saddled with legacy AML compliance systems that were built
piecemeal and can no longer meet current needs and regulatory expectations.
● The work flow involves multiple separate IT systems and databases and thus requires
significant manual work for data integration and retrieval.
● Previous AML systems have limited capability to uncover hidden relationships among
customers and accounts.
● Rules are often created based on
specific scenarios but don’t consider
different contexts of individuals,
resulting in many false positives
which make alert review labor-
intensive and time consuming.
Average time to clear a generated alert
requires 19 mins in 2016. For a bank
reporting 10,000 alerts per day, it’s a lost
of 3,167 hours.
Source: Dow Jones & ACAMS 2016
21 EE6893 Big Data Analytics — Lecture 11 © 2019 CY Lin, Columbia UniversityAML Challenges Banks Are Facing Now
New Money Laundering Techniques – Unknown Unknowns
● Money launderers change techniques over time, and FATF has to update its
recommendations every couple of years.
● The use of proxy servers and anonymizing software makes the third component of
money laundering, integration, almost impossible to detect, as money can be
transferred or withdrawn leaving little or no trace of an IP address.
● The use of the internet allows money launderers to easily avoid detection. The rise
of online banking institutions, anonymous online payment services, peer-to-peer
transfers using mobile phones and the use of virtual currencies such as Bitcoin
have made detecting the illegal transfer of money even more difficult.
● Adding rules to cover newly discovered money laundering techniques and patterns
requires a lot of manual work.
● Rule-based transaction screening system can only identify suspicious transactions
with known patterns; however, there are always new money laundering techniques.
It is very important for banks to catch the “unknown unknowns (things we don’t
know we don’t know)”.
22 EE6893 Big Data Analytics — Lecture 11 © 2019 CY Lin, Columbia UniversityHow does Graphen AI Help AML?
• Automatically considers features from multiple aspects to more accurately
assess the risk of each party.
• Automatically builds activity-based behavior models, analyzes every party’s
current behavior in the context of self-history and the behavior of peers, and
identify behavior outliers.
• Known entity risk • Related individual risk
• Industry/occupation risk • Related company risk
• Geo location risk • Transacting individual risk
• Watch list hit • Transacting company risk
Entity
• Negative news hit Network Riskchange
• Network
Risk
Aggregate Risk
• Rejected transactions Known • Profile change
• Alert/case/SAR history Suspicious Behavior
• Abnormal transaction type, geography,
Anomalies
• Rules triggered in alerts from Patterns/
existing amount, frequency, purpose
systems Red Flags • Behavior deviation from self-history and
peers
23 EE6893 Big Data Analytics — Lecture 11 © 2019 CY Lin, Columbia UniversityWhere Can AI Help AML?
Traditional AML System
SAR No SAR
● Finds “unknown unknowns” by
detecting outliers and identifying
AI-Powered AML System
abnormal patterns.
SAR ● Both systems agree on SAR.
● Reduces the risk of AML
compliance failure.
● Reduces “false positives” via
automatic EDD and in-context
analysis of accounts and parties.
● Reduces manual workload to
No ● Both systems agree on no SAR.
SAR
filter false alarms.
● Improves efficiency with
aggregate risk ranking and
automatic retrieval of case-
relevant data for investigation
24 EE6893 Big Data Analytics — Lecture 11 © 2019 CY Lin, Columbia UniversityUse Case Story
Jose Rose is a drug dealer from Central America living in New York. In order to send his
money to US, he set up a Company – Garden Paradise in New Jersey. Its legal
representative and managers are Mr. Rose and his relatives. He opened an account at a
local C Bank in Jersey City. However, the company’s book seemed to have failed to
explain Mr. Rose’s huge annual income. So he needed a money laundering plan,
executed in five steps:
1. Over a few years, he slowly transported huge sums of money to Panama through
various means to Bank A (via mail, shipping, entrained in various goods).
2. Mr. Rose flew to Panama to find a lawyer and set up a Company - Canal Dreams, with
an account opened at Bank B in Panama.
3. Mr. Rose represents Garden Paradise to negotiate with Canal Dreams. They ‘discussed’
selling a service contract of Smart Healthcare software to Garden Paradise and
finally signed a contract of 3 million US dollars.
4. At this point, Mr. Rose’s secretly authorized lawyer transferred the money he has
deposited in Bank A to Canal Dreams’ account in Bank B.
5. Wait until the legal procedures were completed. The money was then transferred from
Bank B account to Mr. Rose’s C Bank account in New Jersey.
25 EE6893 Big Data Analytics — Lecture 11 © 2019 CY Lin, Columbia UniversityUse Case Story
brother wife
sister
lawyer Garden Paradise
Smart Healthcare Software
$3M
Canal Dreams
$3M
26 EE6893 Big Data Analytics — Lecture 11 © 2019 CY Lin, Columbia UniversityUse Case Story AI: How they related
to each other?
brother wife
sister
AI: Who are their
AI: What are employees?
their
relationships? Garden Paradise AI: What did they sell?
Any other ‘related’
What did they
discuss in legal customers?
Smart Healthcare Software
documents? AI: Is this company capable of
$3M
creating expensive software?
Canal Dreams
AI: Is it related to
Healthcare business?
$3M
27 EE6893 Big Data Analytics — Lecture 11 © 2019 CY Lin, Columbia UniversityUser Interface Demo (I) • Highlight the most suspicious case, including the involved entities, 28 EE6893 Big Data Analytics — Lecture 11 © 2019 CY Lin, Columbia University
User Interface Demo (II)

•   Show top anomaly features of the four categories: entity, network, pattern, and behavior. Highlight
    abnormal relationships in the graphs.
    29                               EE6893 Big Data Analytics — Lecture 11          © 2019 CY Lin, Columbia University
User Interface Demo (III)
• Investigate suspicious individuals
30 EE6893 Big Data Analytics — Lecture 11 © 2019 CY Lin, Columbia UniversityHow Can AI Help Reduce False Positives?
Example
A party has 5 international wire transfers of $10K+ each time within last month.
Traditional Rule-Based AML
1. Matches the rule of “3+ international wire transfers of at least $10K each within 30 days”.
2. Creates an alert.
AI-Powered AML
1. Computes the answers to the following questions:
• What is the occupation or business nature of this party?
• How often did this party have international wire transfers before?
• Who are the most frequent debit/credit counterparties of this party?
• Has this party had transactions before with the counterparties of these wire transfers?
• Does this party have other relationships (e.g. same account, address, phone, email) with these
counterparties?
• What are the case/SAR histories of this party and the counterparties?
• Do peers of this party (e.g. individuals with the same occupation, or businesses of the same
nature) often have wire transfers of similar frequency and amount?
• …
2. Determines the aggregate risk of this party based on all of the above answers.
• Import/export company with frequent foreign trades ! low risk (false positive).
• A salon worker with small-amount of monthly activities and few wire transfers ! high risk.
31 EE6893 Big Data Analytics — Lecture 11 © 2019 CY Lin, Columbia UniversityIntegrate AI-Powered AML with Current Workflow
Filtered
Alerts
Anomalies/
Outliers
AI-Powered
AML System
Aggregate
Risk Rating
Raw Data
(KYC, Traditional AML Alerts
Accounts, System
Transactions)
32 EE6893 Big Data Analytics — Lecture 11 © 2019 CY Lin, Columbia UniversitySummary -- AI Technologies for AML
Graph Computing
• Flow analysis
• Advanced KYC, including the
Basic Layer related parties of the customers
• Determines true relationships
between accounts and parties
Transaction Patterns • Identifies important parties in
networks and money flows
• General rules Data Mining Grouping/Clustering
• Customized rules for • By industry, business nature,
specific scenarios • Pattern matching
against previous cases region, size, etc.
• Expert-defined rules and • By transaction behavior
thresholds • Uncover links hidden in
texts • By typologies, techniques
Advanced Cognitive Layer
Account Profile
• Know your customer
• Watch list filtering Multi-Modality Analysis Predictive Machine
• Politically exposed
individuals for Anomaly Detection Learning
• Time-series analysis of • Supervised learning to detect
transaction behavior and existing patterns
relationship change • Unsupervised learning to discover
• Behavior outlier detection unknown patterns
against self history and peers • Assesses existing risk and
• Cognitive reasoning with predicts future risk
Bayesian network inference
33 EE6893 Big Data Analytics — Lecture 11 © 2019 CY Lin, Columbia UniversityAI Regulation Reasoning & Compliance Reassurance 34 EE6893 Big Data Analytics — Lecture 11 © 2019 CY Lin, Columbia University
Regulation Overwhelms Financial Institutions

 • The regulatory regime for Financial institutions are tightened worldwide. Banks are
      subjective to regulations such as CFPB, FRB, FinCen and others in U.S.
 • Conventional compliance architecture is entangled in numerous systems, transformations,
      and mappings. At major banks each new compliance program brings more staffs,
      systems, software, warehouse and more documents.
 • Cost fines peaked in 2016 at a total accumulated amount of over $200 billion globally

35                          EE6893 Big Data Analytics — Lecture 11   © 2019 CY Lin, Columbia University
A snapshot of penalties for non-compliance issued recently
Date News Title Penalties Penalty type Issued by
03/07/2018 Bancorp Bank penalized $2M for UDAP $ 2 million plus restitution UDAP/UDAAP FDIC
violations
02/15/2018 U.S. Bank NA paying $598M for BSA/AML $ 598 million BSA-AML Civil Money FinCEN, DOJ, OCC
failings Penalties
2/15/2018 U.S. Bancorp pays $15M for BSA/AML $ 15 million BSA-AML Civil Money FRB
failures Penalties
2/7/2018 Rabobank pays $369M for BSA/AML $ 369 million Forfeiture OCC, DOJ
violations and obstruction
1/17/2018 Mega International Commercial Bank pays $ 29 million BSA-AML Civil Money FRB, State Agency
$29M BSA penalty Penalties
12/27/2017 Citibank earns CMP for non-compliance $ 79 million BSA-AML Civil Money OCC
with BSA C&D order Penalties
11/21/2017 Bureau fines Citibank for student loan $ 2.75 million and consumer UDAP/UDAAP CFPB
servicing failures redress
36 EE6893 Big Data Analytics — Lecture 11 © 2019 CY Lin, Columbia UniversityWhat is RegTech for banks?
• It is a subset of FinTech which utilize AI
technologies such as Nature Language
Processing(NLP), Nature Language Identify and
Understanding (NLU) that may facilitate integrate risks
the delivery of regulatory requirements
more efficient and effectively than
Manage Advanced
existing capabilities. Regtech has change with understanding
ease of regulation
emerged as the result of top-down
institutional demand, in contrast to
bottom-up demand that has
driven FinTech.
Standardized
• For banking industry, RegTech allows real Leverage
advanced
compliance
testing and
time and proportionate regulation that analytics data
structures
identifies risk more efficient
compliance and auditing procedures
including:
• Analyzing and implementing rules
• Extracting, analyzing and storing data
• Monitoring employee and customer
behaviors
37 EE6893 Big Data Analytics — Lecture 11 © 2019 CY Lin, Columbia UniversityRoadmap towards intelligent AI-based governance, risk and
compliance
Phase 1 - Manual
Manual data capture based on cyclical timelines (excel)
Phase 2- Workflow automation
Compliance software establishes consistent workflow
Phase 3- Continuous monitoring
Applying data science to automate the back office
Phase 4 - Predictive analytics
AI and machine learning are proactively identifying and predicting risk
38 EE6893 Big Data Analytics — Lecture 11 © 2019 CY Lin, Columbia UniversityMaster the Complexity of GRC (Governance Regulation
Compliance) with Graph Approach
• Similar to the medical domain, finance can
master the compliance challenge with
graph
• The human genome contains more than 3
billion DNA base pairs. Genes direct the
production of over a million analyzed
proteins. More than 9500 terms define
human phenotype and anomalies which
describe over 10,000 disease. Almost half
a million drugs are approved for
treatment.
• The complexity of Bio/Medical is resolved
with Semantic Web and Ontology, a
graph representation of Triple System
(subject/ predicate/ object) which
facilitated understanding the relationships
of terms.
39 EE6893 Big Data Analytics — Lecture 11 © 2019 CY Lin, Columbia UniversityUnderstanding Regulation by Nature Language Processing
• AI technologies allow compliance professionals to “interpret regulatory meaning,
comprehend what work needs to be done and codify compliance rules” in a fraction of
the time normally required. AI can enhance compliance monitoring, detection, and
response, incorporating forward-looking functions that identify regulatory changes
and enable businesses to update procedures quickly.
• Extracting metadata: NLP identifies important elements of a regulation and helps users to
understand what the document is about.
• If the regulation is relevant
• How the organization may be affected and needs to respond
• Identifying entities: NLP can determine the “who” factors in regulation:
• To whom the document is addressed (such as a firm or department)
• By whom (such as a regulator)
• Who are the key actors (such as customers or market participants)
• “Understanding” content: NLP can help users to
• identify the requirements that are contained within a document
• using the entities and metadata, determine who they apply to and what products,
topics and processes they refer to
40 EE6893 Big Data Analytics — Lecture 11 © 2019 CY Lin, Columbia UniversityExample: AML regulation analysis for auditing 41 EE6893 Big Data Analytics — Lecture 11 © 2019 CY Lin, Columbia University
NLP and Knowledge Graph

                                                                    Summarization Results:

                                                                    Reference Summary: Bafetimbi
                                                                    Gomis collapses within 10
                                                                    minutes of kickoff at tottenham,
                                                                    but he reportedly left the pitch
                                                                    conscious and wearing an oxygen
                                                                    mask. Gomis later said that he
                                                                    was “feeling well” the incident
                                                                    came three years after Fabrice
                                                                    Muamba collapsed at white hart
                                                                    lane .

                                                                    Generated Summary:
                                                                     Bafetimbi Gomis says he is now
                                                                    “ feeling well” after collapsing
                                                                    during Swansea 's 3-2 loss . the
                                                                    29-year-old left the pitch
                                                                    conscious following about five
                                                                    minutes of treatment . The 29-
                                                                    year-old left the pitch conscious
                                                                    following about five minutes of
           News from CNN
                                                                    treatment .
42                         EE6893 Big Data Analytics — Lecture 11                  © 2019 CY Lin, Columbia University
NLP and Knowledge Graph 43 EE6893 Big Data Analytics — Lecture 11 © 2019 CY Lin, Columbia University
NLP and Knowledge Graph
• Graph analysis by Graphen Ardi platform

44                          EE6893 Big Data Analytics — Lecture 11   © 2019 CY Lin, Columbia University
A Comprehensive GRC(Governance Regulation
Compliance) Knowledge Graph
 Challenge: Compliance responsibilities are spread throughout the organization so that risk
     assessment, testing and reporting lacks integrated data with same formats which makes
     internal compliance and audit process efforts slow and expensive
 Solution:
        Integrated Data: Design algorithms to extract and integrate data from banks’ proprietary
            system, third-party data providers, regulations, regulatory announcement and public
            sources including both structured and unstructured data.
        Cognitive learning: Utilize both machine learning and human expertise to continuously
            improve the quality, precision and reliability of data.
        Graph Representation Refine the design the domain and linkage of data, and store the
            data in the powerful graph.

                                                                                    Agility

                                                                                    Speed

                                                                                 Efficiency

                                                                                  Accuracy

45                            EE6893 Big Data Analytics — Lecture 11       © 2019 CY Lin, Columbia University
How can Knowledge Graph help?
Improve Regulation Compliance Key Functions of Graphen RegTech
• Deep understanding of regulation and your
Understanding the Regulation is the organization
key for three lines of defenses • Key issues such as KYC, AML,
Graphical representation of Customer protection services
regulation as the standard graph • Regulatory agencies
• Penalty amounts
Extract information from internal data
• Regulatory requirements (documents,
such as policy controls,
procedures and supporting procedures and controls)
documents corresponding to • Related departments
regulation terms and represent in • Enforcement actions
the internal-data graph
• Monitoring, detecting and response to
Compare the standard graph with
internal-data graph and check the compliance risks
missing requirement and possible • System will find the missing
violations requirements for given issue
• Identify other risks regarding the
Linked data from different domains
increase efficiency and reduce similar problematic internal data
cost of repetitive works • Give recommendation for risk
reporting, and enable feedback to
improve the system
46 EE6893 Big Data Analytics — Lecture 11 © 2019 CY Lin, Columbia UniversityAI-based Auditing Solution
• Key Features:
• Knowledge Graph based advance
regulation comprehension
• Semantic search of related
regulation
• Auditing report ELT and data mining
• Report quality assessment
• Financial data, regulations, reports,
workpapers and metadata can be stored
in a uniform way. A knowledge graph
defines the semantics of concepts, their
relationships and axioms. Compliance
crosses the domains of finance and legal
regulations.
• To improve the quality of the auditor’s
report, the system give recommendation
based on
• Graph comparison of regulation and
internal data
• Other auditor’s behaviors analysis as
benchmark
• The system keep learning by user’s
feedback
47 EE6893 Big Data Analytics — Lecture 11 © 2019 CY Lin, Columbia UniversityAI Powered Risk Defense Mechanism
• Traditional Approach
Graph Adapted from ECIIA/FERMA Guidance on the 8th EU Company Law Directive,
article 41
• Graphen AI risk defense in one-stop
Risk Risk controls and
Risk Detection
Understanding reporting
Prediction, Monitoring and
from both regulation and Analysis With actionable reactions to
business structure identified risks
48 EE6893 Big Data Analytics — Lecture 11 © 2019 CY Lin, Columbia UniversityBeyond Auditing — Example: An Integrated Loan Risk Solution
Risk Risk Analysis,
Risk Detection Controls and
Understanding
e.g. Risk assessment and Reporting
e.g. Case related regulation alert
review e.g. Quality assurance
• Identify related • Advanced Know • Analysis insight of
Your Customer
risks by trends and
technology to
understanding patterns
assess risk score of
regulation • Quality assurance
single customer at
• Label different beginning of loan of risk,
risks to application compliance and
corresponding • Predict and audit reporting by
department, monitor the horizontal
policies, controls, customers’ comparison with
and supporting transactions and other staffs and
document types abnormal by matching
• Machine learn behaviors after regulation
historical risk loan is granted requirements
profile and risk • Continuously • Suggest actions to
control monitoring identified risks
approaches compliance risk of from historical
banking staffs
studies
49 EE6893 Big Data Analytics — Lecture 11 © 2019 CY Lin, Columbia UniversityMarket Intelligence Confidential – Reference for Discussion Only; Not for Distribution
Outline

     • What is Market Intelligence?
     • Market Intelligence Platform Functions
     • How Market Intelligence Platform Analyzes A Single News?
        • Bayesian Network
        • The Science Behind Reasoning
     • Price Impact Prediction
        • How Market Intelligence Platform Aggregates Informatio
             n?
        • Aggregate Information Analysis Framework

51                   EE6893 Big Data Analytics — Lecture 11   © 2019 CY Lin, Columbia University
What is Market Intelligence?
• Personal research analyst
• Provides real-time news information with relevance
rankings according to your individual portfolios and
watchlists
• Generates overall Price Impact Score from all
monitored news sources
52 EE6893 Big Data Analytics — Lecture 11 © 2019 CY Lin, Columbia UniversityMarket Intelligence Platform Functions
• Total impact: calculated from all monitored news Artificial intelligence and Bayesian
source network powered causality reasoning
• Singe News Impact: calculated from selected news graph
What’s in
your
portfolio
Price Chart
Trending
news that
has impact
on your
portfolio
Personalization of
news you care
53 EE6893 Big Data Analytics — Lecture 11 © 2019 CY Lin, Columbia UniversityBayesian Network
Bayesian network is a probabilistic graphical model (a type of statistical model) that
represents a set of variables and their conditional dependencies via a directed acyclic
graph (DAG)
A simple Bayesian network. Rain influences whether the sprinkler is activated, and both
rain and the sprinkler influence whether the grass is wet.
With observed probability, we can answer questions such as what is the probability of
raining, given grass is wet.
Similar causality network can be applied to the market: Rain – Negative Economy
Outlook; Sprinkler – Negative Company Management ; Grass Wet – Stock Price
Decrease
Rain Sprinkler Sprinkler Sprinkler
(True) (False)
Rain (True) 0.01 0.99
Rain (True) Rain (False)
.2 .8 Rain (False) 0.4 0.6
Grass wet Grass Wet Grass Wet
(True) (False)
Sprinkler (F) Rain (F) 0 1
Sprinkler (F) Rain (T) 0.8 0.2
Sprinkler (T) Rain (F) 0.9 0.1
Sprinkler (T) Rain (T) 0.99 0.01
54 EE6893 Big Data Analytics — Lecture 11 © 2019 CY Lin, Columbia UniversityInfluence Graph Example
Ticker Company Industry Sector
002178 延华智能 Information Technology Tech
002230 科⼤讯⻜ Information Technology Tech
002232 启明信息 Information Technology Tech
002439 启明星辰 Internet Service Provider Tech
300297 蓝盾股份 Information Technology Tech
JD 京东 Internet Service Provider Tech
CHL 中国移动 Information Technology Tech
• 延华智能: ⾼端咨询,智能建筑,智慧医疗 ,智慧节能 ,智慧环保 ,数据中⼼。
• 科⼤讯飞: 智能语⾳及语⾔技术、⼈⼯智能技术研究
• 启明信息: 管理软件、汽车电⼦产品、集成服务、数据中⼼
• 启明星辰: 安全⽹关、安全检测、数据安全与平台、安全服务与⼯具、硬件及其他
• 蓝盾股份: ⾼端咨询,智能建筑,智慧医疗 ,智慧节能 ,智慧环保 ,数据中⼼
• 中国移动: 移动语⾳、数据、IP电话和多媒体业务,还提供传真、数据IP电话等增值业务
• 京东: ⼤型综合型电商平台,出售家电、数码通讯、电脑、家居百货、服装服饰、母婴、
图书、食品等商品。
55 EE6893 Big Data Analytics — Lecture 11 © 2019 CY Lin, Columbia UniversityBayesian Network Industry Example 56 EE6893 Big Data Analytics — Lecture 11 © 2019 CY Lin, Columbia University
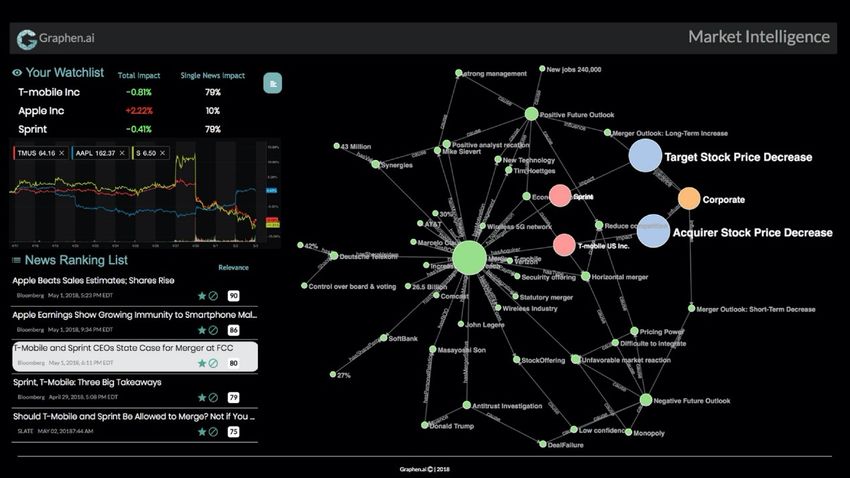
How Market Intelligence Platform Analyze A Singe News?
                Impact score of
                news on each
                stock

News to
be
analyzed

 57                EE6893 Big Data Analytics — Lecture 11   © 2019 CY Lin, Columbia University
Detailed Reasoning Graph
Security offering as acquisition
form, antitrust investigation, and
unfavorable market reaction leads
short-term merger participants
price goes down.
58 EE6893 Big Data Analytics — Lecture 11 © 2019 CY Lin, Columbia UniversityThe Science Behind Reasoning
Event analysis module for each type of events
Collect corresponding information for each module from news and collect historical data
Estimate probability of how a factor of events causes changes in other factors
Use Bayesian Network to estimate the stock future outlook
Event analysis module example: M&A analysis framework
59 EE6893 Big Data Analytics — Lecture 11 © 2019 CY Lin, Columbia UniversityPrice Impact Prediction
Market News
User Portfolio
Company Industry Competitors Macroeconomic Geopolitical
Market Intelligence
Impact Prediction
60 EE6893 Big Data Analytics — Lecture 11 © 2019 CY Lin, Columbia UniversityHow Market Intelligence Platform Aggregate Information?
Assess
aggregate
information of
Apple Inc. stock
• Stock price predicted to be increase by aggregate
all monitored news from four major areas.
• Detailed news reasoning graph of recommended
news from left column.
61 EE6893 Big Data Analytics — Lecture 11 © 2019 CY Lin, Columbia UniversityDetailed Apple Stock Reasoning Graph
After earnings release, Apple's revenue growth,
optimistic financing status and promising industry
outlook drive stock price increase. Major factors
include sales increase from products, services and
wearable, optimistic financing by dividend increase
and share repurchase.
62 EE6893 Big Data Analytics — Lecture 11 © 2019 CY Lin, Columbia UniversityAggregate Information Analysis Framework
• Corporate
• Investing: external investing, internal investing
• Operating: revenue, cost, management, product
• Financing: capital structure, distribution, debt
• Industry
• Lifecycle
• Demand Supply
• Future expectation
• Competition
• Market share
• Product differentiation
• Macroeconomic
• Indicators such as GDP, GNI, Retail Sales, Unemployment Rates, CCI and etc.
• Trade Balance
• Monetary Policy: Inflation, Interest Rate, and etc.
• Fiscal Policy: Taxation, Government budgeting
• Geopolitical
• Market type: Emerging, Developed
• Nature disaster, extreme weather, catastrophic event
• Political instability: war, strike, civil unrest
63 EE6893 Big Data Analytics — Lecture 11 © 2019 CY Lin, Columbia UniversityAggregate Information Analysis Framework 64 EE6893 Big Data Analytics — Lecture 11 © 2019 CY Lin, Columbia University
AI for Robo-Advisory

Confidential – Reference for Discussion Only; Not for Distribution
Robo-Adivosry Examples

                                                                                                                           Robo Advisor Fundraising 30
  Type                   Description              Example                  Others                               300                                              30
                                                                                                                                                287.1
  Robo Advisors Digitalized                                                4Q2015: Top 5                                                         25
  advisors      automatic                                                  Robo Advisors                                                                246.6
                wealth                                                     have combined                        225                                              23
                management                                                 AUM being

                                                                                                                                                                      Number of Deals
                platform                                                   $44.2B.

                                                                                              Deal Value ($M)
                                                                                                                                         16
                                                                                                                               14
                                                                                                                150                                              15

                                                                                                                                        98.5
                                                                                                                 75    6                                          8

  Retail                 New type of                                       Robinhood
                                                                                                                      44.3
  Investment             digital                                           boasts a sign-                                     36.7
                         transaction and                                   up time of 4                          0                                                0
                         investment                                        minutes and                                2011    2012     2013     2014    2015
                         platform, such                                    free trading
                                                                                                                               Deal Value       Deals
                         as theme
                         investment or
                         combined
                         transactions

   Sources: Investmentnews.com,

      66Rising: IBM’s Response to Industry Disruption
Fintech                                                 IBM CONFIDENTIAL
                                                           EE6893 Big Data Analytics — Lecture 11                                    © 2019 CY Lin, Columbia University
What is Robo-Advisor?
Robo-Advisor is a new type of wealth management
service. Based on the risk level and investment
goals provided by the investor, and it uses a series
of ‘smart algorithm’ to calculate the optimal
investment suggestions. ▪ Non-biased
▪ Low investment threshold
Robo-advisors directly managed about $19 billion as of ▪ Low starting entry money
December 2014. By 2020 the global assets under
management of robo-advisers is forecast to grow to ▪ Low agent fee
an estimated US$255B.
Features:
• Strongly depend on technology,
algorithm and financial theory
• Distributed investment, maximum
long-term return
• Personalized portfolio allocation.
Harry Markowitz
67 EE6893 Big Data Analytics — Lecture 11 © 2019 CY Lin, Columbia UniversityExample: Wealthfront——low entry requirement, low fee
• Established in 2008. Formally called ‘Kaching’.
Renamed in Dec 2011. Headquarter at Palo Alto.
• On Sept 2015, the total asset is $2.6B.
• The estimated value of the company is $1B as in
2015.
• Low entry requirement:min
investment value USD $500.
• Low fee:
• Zero annual fee, if account is
lower than $10K.
• 0.25% fee is charged for the
part of asset amount that is
larger than $10K.
• No agent fee
• Based on Wealthfront, in
average, each user only
needs to pay 0.12% fee.
68 EE6893 Big Data Analytics — Lecture 11 © 2019 CY Lin, Columbia UniversityTypical Steps of Robo-Advisory
Most of the robo-advisor platform is built based on the modern investment portfolio theory, using
Exchange Trade Funds (ETFs) to build portfolio.
Customer Construct Tracing Receiving
Rebalance
Profiling Portfolio Portfolio Benefits
- portfolio - Monte Carlo - Saving tax - set tolerance
- design
strategy; Simulation through the loss to level to avoid over
questionnaire;
- type analysis; - Judge whether compensate the adjustment
- Score Risk
- optimum the goal is achieved gains;
Capacity and Risk
allocation; - Suggest - outcome is
Willingness based
adjustments; highly related to
on the answers of
the income;
the questionnaire.
- Investment
income tax (not
applicable in
China)
Based on a survey of Wells Fargo, in US, there is only 16% of population in their 20s and 30s are willing to interact
with investment consultants. The remaining people prefer to use these types of AI consultant.
69 EE6893 Big Data Analytics — Lecture 11 © 2019 CY Lin, Columbia UniversityRobo Advisor Customer Analysis
High
High End Customers(Private Bank /
Special Investment Services)
Mass Affluent
Upper Middle
Targeted Customers (Consumer
Bank Services) : $15K - $1M
Middle
Lower Middle General Public(Consumer Bank
Services)
70 EE6893 Big Data Analytics — Lecture 11 © 2019 CY Lin, Columbia UniversityFour Steps to use Big Data Cognitive Analysis for Robo-Advisor
Investment Market Dynamically Know Your Optimized Personalized Precise Bank-Customer
Analysis Customer Investment Strategy Interaction
• Analyze the market • Customer Profiling, e.g, • Strategy computation and • Create and predict
performance of various based on optimization based on customer interaction
kinds of funds IPQ(Individual Profile personal history strategy, including when,
• Analyze domestic and Questionnaire), • Demonstrate / Simulate method, content to interact
international financial and Feedback, Risk Capacity ‘what ifs’ when the portfolio with customer – to achieve
economic changes and and Risk Willingness has different allocation. max customer and bank
how they may impact CPI, • Understand what the • Explainability of ‘what ifs’ to benefit.
PPI, or GDP. customer really wants customer to the customer.
• Use Machine Learning based on their past
and Deep Learning, behaviors interacting Data Data
based on historical with bank • Customer Data • Customer Data
economic numbers, find • Market Data • Interaction Data
out how factors impact Data • Else?
financial markets. • Customer Data
• Behavior Data /
Data Interaction Data
• Product Data
• Market Data
• Historical Economic
Data
• Industry-related Data
71 EE6893 Big Data Analytics — Lecture 11 © 2019 CY Lin, Columbia UniversityExample: Major Wealth Management
Hundreds of Telesales,
products/campaigns Mail, email,
Combinations with Office, etc…
incompatibilities
Done through which
How much of each product/ channel?
campaign ?
Nightly batch run, Experts doing what-if
select over 1.2M to improve process
To which customers? When?
Select actions for the
Several millions of
next days
customers
72 EE6893 Big Data Analytics — Lecture 11 © 2019 CY Lin, Columbia UniversityAdvanced KYC
• Using customer past investment transactions under different market conditions, determine
customer risk taking sentiment in real time on daily basis. Is customer panicking type
or double down?
• Assess customer financial strength in taking aggressive investment position.
• Suggest portfolio adjustment at a rate that matches customer investment change rate
73 EE6893 Big Data Analytics — Lecture 11 © 2019 CY Lin, Columbia UniversityEnhanced customer view
Recommendation
item
user
Graph Visualizations
Communities Graph Search Network Info Flow Bayesian Networks
Centralities Graph Query Shortest Paths Latent Net
Inference
Ego Net Features Graph Matching Graph Sampling Markov Networks
Middleware and Database
74
23 EE6893 Big Data Analytics — Lecture 11 © 2019 CY Lin, Columbia UniversityCustomer Behavior Sequence Analysis
Markov Latent Bayesian
Network Network Network
• Behavior Pattern Detection
login browsing
• Help Needed Detection
search comparing Checkout
75
53 EE6893 Big Data Analytics — Lecture 11 © 2019 CY Lin, Columbia UniversityDeriving Personality
Big5 Personality (OCEAN)
s. inv
v
s co e n t i
vou nt ns ve
n er fide ist / c
en u r
ive/ con t/ iou
sit re/ ca
n ut s vs
se secu iou .
s
ing/ d
nize
frie vs. col
vs. e t/orga
ndl
o
less
g
y/c d/unki
asy-
care
ie n
omp
effic
assi d
ona
n
te
outgoing/energetic
vs. solitary/
reserved
76 EE6893 Big Data Analytics — Lecture 11 © 2019 CY Lin, Columbia UniversityRecommendation Driven by Influence Flow
Innovator Innovator
a dopt pt??
X. Song, C.-Y. Lin, B. L. Tseng, and M.-T. Sun, “Personalized Recommendation Driven by Information Flow,” ACM SIGIR, Aug. 2006.ado
Early
X. Song, C.-Y. Lin, B. L. Tseng and M.-T. Sun, “Modeling and Predicting adopter
Personal Early
Information Dissemination Behavior,” ACM SIGKDD International Conference adopter
on Knowledge
Discovery and Data Ming, Aug. 2005
Early majority ? Early majority
Late majority Late majority
Laggard Laggard
t
adop
People with People with
similar tastes similar tastes
Influence is not symmetric!
77
EE6893 Big Data Analytics — Lecture 11 © 2019 CY Lin, Columbia UniversityOptimized Personal Investment Strategy
• Project customer existing portfolio performance over a time period vs.
suggested adjustment projected performance over the same period.
• Show past historical similarity and simulated projection.
• Portfolio adjustment should include both conservative and aggressive
bias and let the customer choose change or no change to his
portfolio.
• Give customer the decision making power to make portfolio adjustment
using our personalized recommendation.
78 EE6893 Big Data Analytics — Lecture 11 © 2019 CY Lin, Columbia UniversityRobo-Advisory Techniques suggests better combination
Constrained optimized model
Model Set
Risk Analysis Optimization
Analysis Constraints
Risk-Profit chart Optimized outcome
79 EE6893 Big Data Analytics — Lecture 11 © 2019 CY Lin, Columbia UniversityOptimization is about
Resource efficiency/utilization and allocation
▪ Planning and scheduling activities
Resources Choices to make – Which are subject to complex operating
Capital Invest, allocate constraints (e.g. limited resources, large
volume of data, complex manufacturing
People Hire, assign, schedule
or design processes)
Equipment Acquire, schedule, locate – With multiple business objectives to
reduce time, cost, or increase KPI’s
Facilities Locate, size, schedule, maintain such as productivity
Acquire, route, schedule,
Vehicles
deliver, maintain ▪ While enabling
Acquire, allocate, produce, – Adjustment of changes in operating
Material/Product
deliver, maintain environment
– What-if analysis
Keywords:
• minimize, maximize,
• how many/how much, which, when/where
• decide/choose, plan, schedule, assign, route, source, maintain, locate, trade-off
80 EE6893 Big Data Analytics — Lecture 11 © 2019 CY Lin, Columbia UniversityPortfolio Optimization
• Issue: Portfolio holders and managers seek maximum return from assets while
limiting risks of adverse outcomes.
• Classical formulation by Markowitz has become enriched by several factors.
• Competitive advantage and client preferences lead fund managers to tailor
portfolios to specific regional, sectoral, and other diverse preferences.
• Novel assets have risk characteristics very different from standard stocks and
bonds.
• Scope: Thousands of assets, hundreds of sectors, hundreds of regions. Rebalancing
frequency (daily, weekly,…)
• Decisions: Amount of fund allocated to each asset
• Objectives: Minimize risk as measured by variance of portfolio return, etc
• Requirements:
• Expected return at least achieves target
• Total funds invested does not exceed amount available
• Total funds invested per sector and/or region does not exceed limit
• Limits on leverage
81
EE6893 Big Data Analytics — Lecture 11 © 2019 CY Lin, Columbia UniversityTask 4. Bank-Customer Interaction Strategy 82 EE6893 Big Data Analytics — Lecture 11 © 2019 CY Lin, Columbia University
Bank-Customer Interaction Strategy
• Customers may not immediately accept a
     personalized investment strategy.
   • Customers profile may contain insufficient data
         (e.g. new customers) to fully capture their
         risk profile.
                                                                    commerce
   • Customers may have their own investment
         strategy ideas they want to pursue.
   • Customers desired investment characteristics
         may be impossible to achieve
   • Customers may be willing to accept higher risk
         strategies than they believe.
• A personalized investment strategy may involve a
                                                                                       security
      number of investment stages.
    • What order should these stages be
         presented?
    • Can this order influence a customers risk                     collaboration

         profile?
• How can we can we model interaction with
    customers? As a multi-agent decision process,
    analyzed using game theory.

83                         EE6893 Big Data Analytics — Lecture 11     © 2019 CY Lin, Columbia University
Game Theory and Decision Processes
• Game theory is a system to model behavior of those in conflict, or
with different goals.
• Creates predictions about individuals using assumptions of
rationality (I will make the decision that is best for me).
• We can use an influence diagram to describe a game or decision
process and solve it (e.g. using game theory).
▪ Here we have an influence diagram
representing the ultimatum game
between the Proposer (i.e. a bank)
and a Responder (i.e. a customer).
http://www.eecs.harvard.edu/~gal/tutorial4perPage.pdf
84 EE6893 Big Data Analytics — Lecture 11 © 2019 CY Lin, Columbia UniversityCustomer and Bank Interaction Modeling
• Using influence diagrams, we can model the process of suggesting
investment strategies to customers. This involves decision processes
with potentially multiple interactions between a bank and each client.
• We assume that the bank and the customer each have their own
financial investment characteristics that they find desirable.
• Game theoretic decision processes to settle on an investment strategy
that both find acceptable, involving offers and counter offers.
Customer
Bank Proposal Customer Counter Utility
Bank
Utility
Banks model of customer:
• Graph similarity to other customers based on past
transactions and actions.
• Similar to neighbours in the graph.
• Assume level of game theoretic rationality.
• Update based on counter offers.
85 EE6893 Big Data Analytics — Lecture 11 © 2019 CY Lin, Columbia UniversityAI Trader Confidential – Reference for Discussion Only; Not for Distribution
Personal AI Traders

87                    EE6893 Big Data Analytics — Lecture 11   © 2019 CY Lin, Columbia University
Personality driven AI Trader

88                  EE6893 Big Data Analytics — Lecture 11   © 2019 CY Lin, Columbia University
Personality driven AI Trader

89                  EE6893 Big Data Analytics — Lecture 11   © 2019 CY Lin, Columbia University
Personality Investing
 • Goal
     • Typical portfolio allocation focuses on risk tolerance of investors which measures their ability
           to take risk. While investors CAN take risk, they may not be WILLING to do so. One’s
           persona better reflects their willingness to bear risk.

 • Features
     • OCEAN Personality Inference and Stock recommendation from portfolio and trading
           history
     • Portfolio and trading history rated in 6 quantifiable aspects by Market Intelligence
     • Personality driven trading style classification and suggestion

     • OCEAN Personality
         • Openness
         • Conscientiousness
         • Extraversion
         • Agreeableness
         • Neuroticism

     • Trader Type
          • Careful Investor - John Bogle
          • Patient Investor - Warren Buffett
          • Value Investor - Benjamin Graham
          • Etc.
90                              EE6893 Big Data Analytics — Lecture 11         © 2019 CY Lin, Columbia University
You can also read


