An Overview of Social Media Apps and their Potential Role in Geospatial Research - MDPI
←
→
Page content transcription
If your browser does not render page correctly, please read the page content below
International Journal of
           Geo-Information

Article
An Overview of Social Media Apps and their
Potential Role in Geospatial Research
Innocensia Owuor * and Hartwig H. Hochmair
 Geomatics Program, Fort Lauderdale Research and Education Center, University of Florida, 3205 College Ave,
 Davie, FL 33314, USA; hhhochmair@ufl.edu
 * Correspondence: innocensia.owuor@ufl.edu

 Received: 16 July 2020; Accepted: 29 August 2020; Published: 1 September 2020

 Abstract: Social media apps provide analysts with a wide range of data to study behavioral aspects of
 our everyday lives and to answer societal questions. Although social media data analysis is booming,
 only a handful of prominent social media apps, such as Twitter, Foursquare/Swarm, Facebook,
 or LinkedIn are typically used for this purpose. However, there is a large selection of less known
 social media apps that go unnoticed in the scientific community. This paper reviews 110 social
 media apps and assesses their potential usability in geospatial research through providing metrics on
 selected characteristics. About half of the apps (57 out of 110) offer an Application Programming
 Interface (API) for data access, where rate limits, fee models, and type of spatial data available for
 download vary strongly between the different apps. To determine the current role and relevance
 of social media platforms that offer an API in academic research, a search for scientific papers on
 Google Scholar, the Association for Computing Machinery (ACM) Digital Library, and the Science
 Core Collection of the Web of Science (WoS) is conducted. This search revealed that Google Scholar
 returns the highest number of documents (Mean = 183,512) compared to ACM (Mean = 1895) and
 WoS (Mean = 1495), and that data and usage patterns from prominent social media apps are more
 frequently analyzed in research studies than those of less known apps. The WoS citation database was
 also used to generate lists of themes covered in academic publications that analyze the 57 social media
 platforms that offer an API. Results show that among these 57 platforms, for 26 apps at least some
 papers evolve around a geospatial discipline, such as Geography, Remote Sensing, Transportation,
 or Urban Planning. This analysis, therefore, connects apps with commonly used research themes,
 and together with tabulated API characteristics can help researchers to identify potentially suitable
 social media apps for their research. Word clouds generated from titles and abstracts of papers
 associated with the 57 platforms, grouped into seven thematic categories, show further refinement of
 topics addressed in the analysis of social media platforms. Considering various evaluation criteria,
 such as provision of geospatial data or the number (i.e., absence) of currently published research
 papers in connection with a social media platform, the study concludes that among the numerous
 social media apps available today, 17 less known apps deserve closer examination since they might
 be used to investigate previously underexplored research topics. It is hoped that this study can serve
 as a reference for the analysis of the social media landscape in the future.

 Keywords: API; data access; fee models; Google Scholar; Web of Science; ACM Digital Library

1. Introduction
     Numerous social media apps have evolved in the recent years and significantly enhanced
information sharing and networking capabilities among their users. Undeniably, these apps have
permeated many aspects of modern life in our society.

ISPRS Int. J. Geo-Inf. 2020, 9, 526; doi:10.3390/ijgi9090526                       www.mdpi.com/journal/ijgi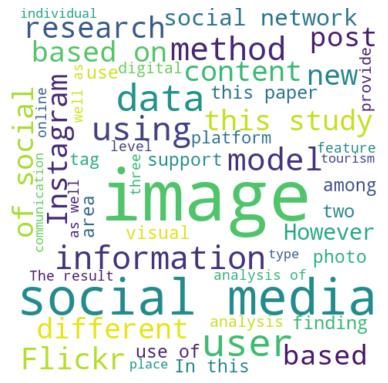
ISPRS Int. J. Geo-Inf. 2020, 9, 526                                                                 2 of 20

      Largely aided by the proliferation of smartphones and their use today, social media apps are
increasingly location-based, providing analysts with access to a wide range of shared spatial data,
such as check-ins, geo-tagged images, video clips or text messages, or reviews of businesses and other
localities. Based on these data, research studies provide valuable insights into spatio-temporal
aspects of marketing, event detection, political campaigning, disaster management, migration,
transport, natural resource management, human mobility, urban planning, tourism, epidemics,
and communication [1–6].
      Although hundreds of social media apps have been developed, only a handful of them are
commonly used in research, including Twitter, Facebook, Flickr, Foursquare, YouTube, LinkedIn,
or Yelp. The presence of user selection bias, based on age, gender, socio-economic status, etc.,
is a well-known phenomenon in social media use. For example, Twitter shows a bias towards male
users and an under-sampling of Hispanic and African American users in certain regions of the United
States [7]. User characteristics also vary between the different social media apps. For example, a survey
conducted in the United States found that Snapchat and Instagram are used primarily by young people,
while YouTube and Facebook are more widely used by older generations [8]. The same study showed
that LinkedIn is more biased towards higher-income users (>$75,000 per year) than other apps such as
WhatsApp or Snapchat. Popularity also varies per region. WeChat, for example, is popular in China [9]
whereas Vkontakte is widely used in Russia [10]. In general, the country where an app has been
developed draws also a strong user base for that app. Examples include Dronestagram (France) [11] or
Mapillary (Sweden) [12]. Different apps vary in the topical focus and therefore attract different users.
For instance, Doximity is popular with medical professionals whereas Dronestagram attracts drone
pilots who like to share airborne imagery. Due to these many facets of user selection bias, analysis
results drawn from a single app may be biased as well. In consequence, having access to data from a
wider range of social media platforms that reach different user groups in different geographic regions
might, therefore, help to reduce user selection bias and its effect on analysis results, if combined in
joint data analysis.
      Analyzing the prominence of different social media apps and existing access options to their
data through application programming interfaces (APIs) provides an important knowledge base for
researchers to potentially expand the range of social media apps used for spatio-temporal research
endeavors. Using this and the need for a better understanding of the social media landscape as a
motivation, this research reviews 110 social media apps and focuses on three objectives:

•     Identification of social media apps with APIs and the provision of location data through the APIs;
•     Determination of the number of research papers published between 1997 and April 2020 on
      Google Scholar, the Association for Computing Machinery (ACM) Digital Library, and the Web of
      Science (WoS) that are related to the different social media apps with APIs;
•     Extraction of research themes in academic literature covered in WoS for social media apps
      with APIs.

     This study’s predominant aim is to bring to light less known apps that provide spatial data, which is
central to geospatial research. Data extracted from these apps may offer researchers information that is
unavailable from other platforms and can be potentially used to tackle new research questions and fill
current research gaps. The characteristics provided about these apps in this study, e.g., API rate limits
or general theme, can guide researchers towards a closer examination of specific apps that align with
their research interests and that may have been previously gone unnoticed.
     Whilst access to location data from social media apps has been beneficial in various ways,
it has broached concerns among social media users about data protection and privacy especially in
the aftermath of the Cambridge Analytica scandal [13]. Many policies that provide guidelines for
safeguarding data privacy of social media users have been instituted by governments and social
media companies alike in the recent past. Examples are the General Data Protection Regulation
(GDPR) [14] and, more recently, the California Consumer Privacy Act (CCPA) [15]. These policies tend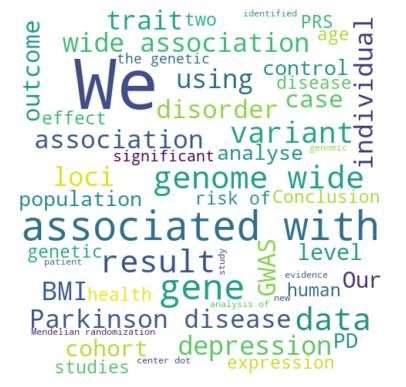
ISPRS Int. J. Geo-Inf. 2020, 9, 526                                                                 3 of 20

to raise challenges for harvesting data from social media apps, as will be discussed for selected apps in
more detail.

2. Literature Review
     Social media is a group of highly interactive platforms that use mobile and Web 2.0-based
technologies to facilitate the creation and exchange of user-generated content [16,17]. Social media apps
can be classified by purpose and function, which include social networking, microblogging, blogging,
photo sharing, or crowdsourcing [18]. One of the first social media apps whose features are mirrored by
today’s popular social networks, such as Facebook, was SixDegrees, which was launched in 1997 and
shut down in 2001 [19]. The wide reach of social media benefits businesses [20], emergency and disaster
management [21], and the tracking of epidemics and diseases [22,23]. Social scientists pioneered the
use of social media data for ethnographic studies that give better insights about people’s behaviors
and opinions [24–26]. Currently, over 9000 tweets are sent out per second and over 1000 photos are
uploaded on Instagram per second [27]. This abundance of generated data is critical for real-time
monitoring especially in emergency management and crisis mapping [22]. Research pertaining to
social media has been largely facilitated by data access through APIs [28]. The availability of APIs
in platforms such as Wikipedia, Twitter, Facebook, or Foursquare led to an increase in data services,
software tools for analysis as well as social media analytics platforms [29]. API documentation provide
detailed information about the API functionality and a description of data retrieval [30]. APIs allow
third parties, such as games or productivity apps, to leverage friendship connections through regulated,
programmatic access to recorded connections between registered users [31]. Access to public data that
is published on the web may require login credentials [32] in order to be able to enforce download
limits and to oversee access to data. For this purpose, social media sites have instituted authentications
using keys and tokens. For example, Flickr allows up to 3600 queries per hour [33] and Twitter has
varying rules for rate limiting on its APIs, such as 15 calls every 15 min [34]. Rate limits prevent
abuse of data access and enhance security although this stifles generativity (i.e., third party use of the
social graph to create innovative products or new insights into data [31]). API rate limiting can be
implemented through request queues, throttling API calls (i.e., disconnect client or reduce bandwidth),
and the implementation of rate limit algorithms [35].
     Because of the Facebook Cambridge Analytica data breach, some social media apps have
deprecated certain API methods or shut them down completely to protect user data and control its
use. For example, Facebook recently further restricted data accessibility [36] and the 500px API is now
available through paid subscription only [37].
     The important role of social media for scientific research becomes evident by the sheer number
of papers analyzing data from social media platforms. Various review studies and meta-analyses
provide an overview of how data extracted from different social media platforms are analyzed,
and how social media apps are used in different contexts and environments. For example, one paper
reviews literature on the use of social media in academia [18]. It distinguishes between several
categories of social media use, including social networking, social data sharing, video, blogging,
microblogging, wikis, rating, and reviewing. It reports that the percentage of scholars who use
social networking apps (e.g., Facebook, LinkedIn) for professional purposes is much lower than the
percentage of scholars who use it for personal reasons. It also points towards a large variability
in usage of different platforms among scholars, with numbers ranging between 10% for Twitter,
46% for ResearchGate, and 55% for YouTube. Another systematic review analyzes social media use
for public health communication among the general public, patients, and health professionals based
on 98 original research studies [38]. These studies included a range of social media tools and apps,
with Facebook, blogs, Twitter, and YouTube being the most often reported tools. A review of 279
research papers describes the emerging role of social media in tourism and hospitality, which has only
a short history [39]. Fewer than 10 papers were published in 2007, followed by a strong increase in the
annual number of papers published. Popular keywords identified in analyzed publications include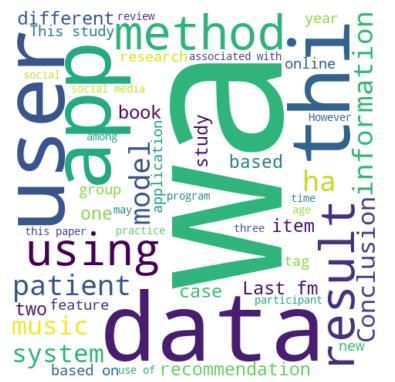
ISPRS Int. J. Geo-Inf. 2020, 9, 526                                                                   4 of 20

marketing, consumer behavior and user-generated content. A review of 48 publications that focused
on the use of social media for the assessment of nature-based tourism showed that images from Flickr
were most often used (36 papers), followed by Panoramio images (10 papers), and Instagram images
(6 papers). Point location data collected from social media platforms were mentioned in 40 papers and
temporal data in 12 papers [40].
      Another study examines the role of social media, in particular, Facebook, as an educational
tool in higher education [41], concluding that Facebook usage comes with benefits such as increased
teacher-student and student-student interaction, improved performance, and the convenience of
learning and higher engagement. A review paper [42] analyzed 412 articles on Facebook in the context
of Social Science to answer various overarching questions, including: (a) Who is using Facebook?
(analysis of users); (b) Why do people use Facebook? (motivation); (c) Why are people disclosing
personal information on Facebook (privacy and information disclosure). An overview of social media
use in college classrooms [43] concludes that LinkedIn is the most used social network by university
faculty. Based on the review of 92 papers, another study analyzed which academic disciplines publish
results from Twitter analysis, showing that 46% of papers come from Computer Science, followed by
30% from Information Science, and 7% from Earth- and Geoscience [44]. Furthermore, it showed that
46% of analyses fall into the category of event detection (disaster/health/disease/traffic management),
14% into social network analysis, and 13% focus on retrieving direct or indirect geolocation information
from Twitter. A detailed list of publications in six leading tourism and hospitality journals that collected
and analyzed online reviews from online platforms, such as Booking.com, Ctrip, Expedia, TripAdvisor,
or Yelp, to address a variety of research questions, such as travel motivation, is provided elsewhere [45].
This study also reveals that online reviews could vary significantly across these platforms in terms
of linguistic characteristics, semantic features, sentiment as well as impact on users of the websites
(e.g., helpfulness). Fitness tracker apps, such as Strava or MapMyFitness, are primarily used to record
an athlete’s sports activities in a digital diary or to draft training plans. However, these apps also
have a social dimension, e.g., by allowing to share trips or photos with peers [46]. Numerous studies
compare trip data from different fitness tracker apps, with the conclusion that the popularity of road
network segments can be best assessed through a combination of data from different platforms [47].
      GIScience has employed social media data in a variety of studies [48], for instance, by exploring ways
of acquiring geospatial information from social media [49]. A systematic literature review of 690 papers in
20 social media platforms that compares methods for location extraction from social media [50] reveals
that the use of social media platforms is heavily skewed towards Twitter (54.2% of papers) and Flickr
(20.3% of papers) with many alternative social media platform being barely used for this purpose. It also
shows that social media information has been extracted in the areas of tourism and recreation (27.2%),
crisis and disaster management (12.6%), transport (9.2%), and health (8.1%), among others. Social media
data is nowadays a vital source of Volunteered Geographic Information (VGI), and due to bias from social
media users, data integrity is a big concern. Therefore, various quality assurance processes for VGI have
been proposed including peer reviews and automated error checking [51].

3. Data and Methods

3.1. Data from Social Media Apps
     A total of 110 social media apps were examined for this study (Table 1). We grouped them into the
following nine thematic categories: general purpose, lifestyle, photo sharing, blogging, video sharing,
business, reunion networks, gaming, and travel. The initial list of social media apps and categories
were adapted from two sources [52,53]. Some of the apps listed in these sources were removed from
the analysis since they were no longer active, namely 43Things, Delicious, Fotolog, Friendster, Kiwibox,
Google+, Path, Sprybirds, StumbleUpon, TravBuddy, Tournac, Tout, Uplike, and Vine. New apps that
were recently launched, such as Tiktok, Bumble, and Medium, were added to the list. Apps with an
API are marked with an asterisk (*) in Table 1. Since the geographic prominence of an app can be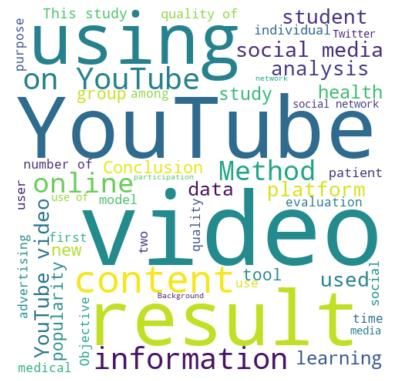
ISPRS Int. J. Geo-Inf. 2020, 9, 526                                                                                5 of 20

influenced by the country in which it was launched, the table also provides the latter information for
the listed apps. If not annotated differently, the default country where an app was launched is the
United States.

      Table 1. Social media apps categorized by theme together with the country of the app launch (AR
      . . . Argentina, CA . . . Canada, CN . . . China, DE . . . Germany, FR . . . France, IL . . . Israel, JP . . .
      Japan, KR . . . Korea, LU . . . Luxembourg, RU . . . Russia, TW . . . Taiwan, UK . . . United Kingdom),
      where * indicates availability of an API.

                                           General Purpose Social Networks
                                             Facebook
      AngelList                 Gab                                    QQ * CN        Skyrock * FR          Twoo
                                            Messenger *
    Badoo *    UK         GirlsAskGuys        Mixi * JP               Quora           Snapchat *           Vero *
  Baidu Tieba * CN         Kickstarter *      Myspace                QZone              Spreely          Viber * LU
      Discord *             LINE * KR        Nextdoor                Reddit *            Tagged        Vkontakte * RU
      Douban                LinkedIn *       Pinboard *              Renren          Telegram * DE      WeChat * CN
     Facebook *              MeetMe          Pinterest *         Sina Weibo * CN       The Dots         WhatsApp *
   Foursquare *              Meetup *      ProductHunt *             Skype *            Twitter *          Yelp *
                                                          Lifestyle
    Academia.edu            CafeMom         English,baby!            Internations     PlentyofFish       Untappd *
    ASmallWorld               Care2           Flixster                Italki.com        Ravelry *      VampireFreaks
     BlackPlanet           CaringBridge         Gaia                 Last.fm * UK    ReverbNation
       Bumble                 Crokes          Glocals                  Minds *      SoundCloud * DE
        Busuu                Cross.tv       GoFundMe*                  MyMFB          Taringa! * AR
       Buzznet              Doximity*        Goodreads*                Nexopia           Tinder
                                                      Photo sharing
      500px * CA          Dronestagram          Fotki             Instagram *         Pixabay * DE       Snapfish
     DeviantArt *            Flickr *          Imgur *           Photobucket *        Shutterfly *       WeHeartIt
                                                          Blogging
   LiveJournal * RU          Medium *        Plurk * TW                Tumblr *         Xanga
                                                     Video sharing
                           FunnyOrDie          Tiktok                 YouTube *           YY
                                                          Business
      eToro * IL               Ryze          Solaborate *             Viadeo * FR      XING * DE
                                                   Reunion networks
                            23andMe *       Ancestry.com              Classmates    MyHeritage * IL
                                                            Gaming
                             Cellufun          Habbo                 MocoSpace *        Zynga
                                                            Travel
                                            CouchSurfing                Wayn

3.2. Number of Related Research Papers
     Three academic paper catalogs (Google Scholar, ACM Digital Library, WoS) were searched to (a)
quantify research efforts related to the different social media platforms that provide an API and to (b)
identify geospatial science topics covered in these research papers. Those three catalogs are commonly
used for paper retrieval in review and meta-analysis studies [38,40,44].
     Google Scholar is the most popular and largest search engine for scientific research books,
articles, theses, abstracts, and court opinions from academic publishers, professional societies,
online repositories, universities, and other web sites [54]. ACM Digital Library gives access to
journals, conference proceedings, technical magazines, newsletters, books, and conference papers
that cover a wide range of research themes but generally focus on computing [55]. WoS is a database
that offers search capabilities for articles written back to 1900 and contains information gathered
from thousands of scholarly journals, books, reports, and conferences [56]. It also has the “analyze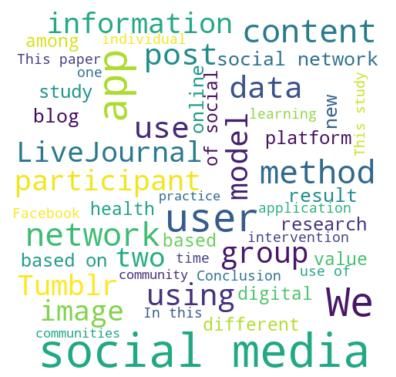
ISPRS Int. J. Geo-Inf. 2020, 9, 526                                                                    6 of 20

results” feature that can be used to get an overview of thematic categories of articles, conference papers,
and books that are returned from a search related to a specific social media app. This “analyze results”
feature provides further information about funding agencies, type of document published (articles,
reviews, or proceedings paper), countries where the research was conducted, and the authors that
have investigated the topic, among others.
     For the search process, the names of the social media apps with APIs (57 apps in total) were used
as search parameter one after another to retrieve papers whose title, abstract, or keyword sections
contained those names. Only in ACM can one conduct searches by exclusively looking up title, abstract,
or keywords. Google enables searches for titles or the entire article whereas in WoS one can use
the “Topic” field, which looks up the title, abstract, and keyword. One challenge in this process is
semantic search limitations, especially with homonyms. For example, social media app names that
are also English words such as “Discord”, “LINE”, and “Medium” led to inflated results from all the
catalogs and especially for Google Scholar. To reduce the number of irrelevant hits in search results,
the search term was combined with the word “app” for “Medium”, “LINE”, and “Minds” for all three
search catalogs.

3.3. Analysis Methods
     This research involves a variety of qualitative and quantitative methods for the analysis of 110
social media apps that are related to the three research objectives mentioned earlier.

3.3.1. Presence and Characteristics of APIs
     Social media data can be acquired through web scraping, data resellers, or APIs. Examining the
presence of an API is critical as it eases the data collection and integration process. API documentation
provides information about data that are accessible through different API endpoints. For this research,
availability of spatial data was one of the aspects of interest examined.
     Through online search and exploration of API directories such as Programmableweb [57], it was
determined which of the 110 apps provide an API. These shortlisted apps were subsequently closely
examined with regards to API characteristics, such as rate limits.
     API rate limiting affects the amount of data that can be accessed within a given time or it limits
the number of requests or calls a client can make, respectively. It is critical for scalability, security,
and sustainment of an API.
     The API documentation was also examined for presence and type of location data that were
collected by the different social media apps. Geographic data provided through social media comes
typically in the form of text (place names, addresses), geographic coordinates (latitude and longitude),
or coordinates of the centroid of an administrative boundary (e.g., city, county, or country). This, in turn,
determines the spatial resolution of the social media data set, which will subsequently affect the type
of research that can be carried out.
     An independent samples T-test was conducted to examine whether apps with a larger user base
were more likely to provide API data access. Similarly, a second T-test was conducted for apps with
APIs to explore the relationship between user numbers and the availability of spatial data through
the API.

3.3.2. Academic Research Extent and Research Themes
      Social media platforms have been the subject of numerous research studies across a wide range of
disciplines. Whereas especially prominent social media apps appear to have attracted the analysis of its
data and users, little is known about the role of less prominent apps on research activities. To narrow
this research gap and to better understand the extent and current trends in research related to these
platforms, two types of analysis are conducted. First, by using the names of social media apps with
APIs (see Table 1) as search criteria on Google Scholar, ACM Digital Library, and WoS, the number of
published documents, as counted by these online catalogs, is retrieved and discussed. An independent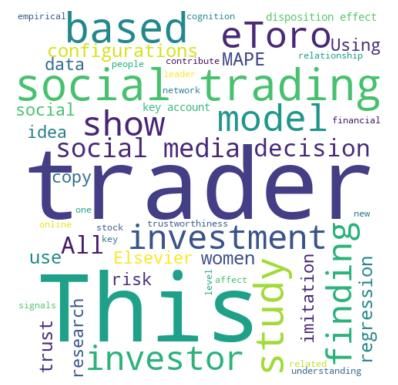
ISPRS Int. J. Geo-Inf. 2020, 9, 526                                                                                                    7 of 20

samples T-Test is conducted for each of the three catalogs to examine whether a larger user base of a
social media app is associated with a larger number of reported research documents. Second, to get an
overview of the geospatial fields that apply social media analysis, the “analyze results” feature in the
WoS platform was used for each social media app that comes with an API. This feature highlights
different themes that the returned documents cover and illustrates, therefore, which social media app is
associated with which discipline, including geospatial fields. The discovery of themes is based on title,
abstract, and keywords of returned papers. The results of these two steps provide both quantitative
and topical information about ongoing research related to a wide range of social media platforms with
APIs. This information is meant to assist researchers with the identification of social media platforms
that offer data related to their geospatial discipline (e.g., transportation) and in conveying a first idea
about the abundance of research already conducted for each platform.
     Furthermore, using title and abstract from each returned paper on WoS, a word cloud was created
for selected categories of social media apps with APIs. This step highlighted terms commonly used in
papers associated with different apps.

4. Results

4.1. User Statistics
     The numbers of registered users for each of the 110 apps were retrieved through online searches.
User statistics for the apps are summarized in Table 2, sorted in alphabetical order, together with
year and month of the count. For 12 apps the number of registered users could not be determined.
Facebook has the largest user base with over 2.4 billion users, followed by YouTube with 2 billion
users. We hypothesize that user numbers can be used as a proxy for the availability of an API
and the abundance of research literature found in relation to a social media app, which will be
subsequently explored.

                                                         Table 2. User statistics.
                                                Social Media Sites with Approximate User Numbers
                     23andMe-10 mio (April 2020)              GoFundMe-70 mio (April 2020)              ReverbNation-4 mio (2017)
                       500px-15 mio (April 2020)               Goodreads-90 mio (April 2020)              Ryze-1 mio (April 2020)
                 Academia.edu-122 mio (April 2020)                  Habbo-120 mio (2019)             Sina Weibo-497 mio (April 2020)
                   Ancestry.com-3 mio (April 2020)               Imgur-300 mio (April 2020)               Shutterfly-10 mio (2018)
                        AngelList-10 mio (2019)                  Internations-3.6 mio (2019)               Skype-300 mio (2019)
                      ASmallWorld-28,500 (2018)                 Instagram-1 bio (April 2020)                 Skyrock-Unknown
                      Badoo-471 mio (April 2020)                Italki.com-5 mio (April 2020)         Snapchat-382 mio (April 2020)
                 Baidu Tieba (Postbar)-1.5 bio (2017)          Kickstarter-18 mio (April 2020)             Solaborate- Unknown
                      BlackPlanet- 15.8 mio (2007)               Last.fm-60 mio (April 2020)        SoundCloud-175 mio (April 2020)
                        Bumble-5.03 mio (2020)                       LINE-600 mio (2017)              Snapfish-100 mio (April 2020)
                         Busuu-100 mio (2020)                  LinkedIn-675 mio (April 2020)                 Spreely-Unknown
                           Buzznet-Unknown                         Live Journal-Unknown                    Tagged-20 mio (2017)
                    Cafemom-146 mio (April 2020)                    Medium-60 mio (2017)               Taringa!-30 mio (April 2020)
                       Care2-55 mio (April 2020)                      MeetMe-Unknown                  Telegram-200 mio (April 2020)
                         Cellufun-2 mio (2017)                     Meetup-25.5 mio (2016)                 The Dots-300,000 (2018)
                       Classmates-70 mio (2015)           Facebook Messenger-1.3 bio (April 2020)      Tiktok-800 mio (April 2020)
                     CaringBridge-500,000 (2013)                      Mixi-14 mio (2013)                    Tinder-50 mio (2018)
                       Crokes-46,000 (April 2020)                   Minds-1.25 mio (2018)                  Tumblr-23 mio (2019)
                     Cross.tv-743,829 (April 2020)                 MocoSpace-2 mio (2017)              Twitter-340 mio (April 2020)
                  Couchsurfing-12 mio (April 2020)             MyMFB (LABYRA)-Unknown                    Twoo-13 mio (April 2020)
                   DeviantArt-48 mio (April 2020)            MyHeritage-106 mio (April 2020)               Untappd-5 mio (2017)
                        Discord-250 mio (2020)                      myspace-50 mio (2015)            VampireFreaks-2 Million (2009)
                      Dronestagram-30,000 (2016)                   Nexopia-1.4 mio (2012)                     Vero-3 mio (2018)
                         Douban-60 mio (2017)                        Nextdoor-Unknown                      Viadeo-50 mio (2017)
                         Doximity-1 mio (2017)                Photobucket-90 mio (April 2020)                Viber-1.1 bio (2019)
                          eToro-4.5 mio (2019)                      Pinboard-22,000 (2013)           VKontakte (VK)-400 mio (2017)
                     English, baby!-1.6 mio (2012)                 Pinterest-322 mio (2020)                 Wayn-20 mio (2017)
                       Facebook-2.449 bio (2020)                      Pixabay-Unknown                    We Heart It-40 mio (2015)
                      Flickr-100 mio (April 2020)            PlentyofFish-150 mio (April 2020)        WeChat-1.151 bio (April 2020)
               Flixster (Fandango)-67 mio (April 2020)               Plurk-100 mio (2013)             Whatsapp-1.6 bio (April 2020)
                            Fotki-Unknown                        ProductHunt-600,000 (2018)                 Xanga-27 mio (2006)
                   Foursquare-50 mio (April 2020)                  QQ-731 mio (April 2020)                  XING-10 mio (2016)
                 Funny or Die-2,830,000 (April 2020)                Quora-300 mio (2018)                    Yelp-176 mio (2019)
                           Gab-200,000 (2017)                    QZone-517 mio (April 2020)             YouTube-2 bio (April 2020)
                      Gaia Online-31 (April 2020)                Ravelry-9 mio (April 2020)                     YY-Unknown
                       GirlsAskGuys-Unknown                      Reddit-430 mio (April 2020)               Zynga-232 mio (2019)
                      Glocals-152,790 (April 2020)                   Renren-31 mio (2018)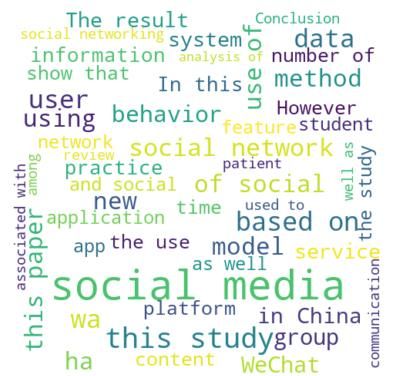
ISPRS Int. J. Geo-Inf. 2020, 9, 526                                                                                      8 of 20

4.2. Availability of APIs and Spatial Data
     APIs, where available, provide a gateway to social media app data either through a REST API or
through GraphQL. The latter has recently become a more widely used alternative to REST APIs. Out
of the 110 apps examined for this study, 57 apps provide an API (compare Table 1). Some apps provide
multiple APIs for accessing different endpoints with specific datasets, as shown in Table 3.

                                      Table 3. Characteristics of APIs and location data.

         Site               Rate Limits               Costs                 API Name(s)                 Location Data
                                                                                                      Collected but not
      23andMe              Not specified               Free                   23andMe
                                                                                                    available through API
                                                                                                      Available after paid
        500px              Pay to access               Paid                     500px
                                                                                                         subscription
        Badoo              Not specified               Free                     Badoo                    Not specified
     Baidu Tieba           Not specified           Not specified             Baidu Tieba                 Not specified
                                                                        DeviantArt & Sta.sh,
     DeviantArt                Varies                  Free                                               Place name
                                                                           oEmbed, RSS
       Discord                 Varies                  Free                    Discord                    Place name
      Doximity        5000 requests per hour           Free                   Doximity              Place name, coordinates
                                                                        Discovery, Metadata,
        eToro              Not specified               Free                                               Place name
                                                                           System, User
                                                                       Graph, Marketing, Live
      Facebook                 Varies                  Free                                         Place name, coordinates
                                                                           Video, Pages
        Flickr         3600 queries per hour           Free                  Flickr Rest                 Coordinates
     Foursquare                Varies              Free and paid                Places              Place name, coordinates
                                                                                                     Place name/query per
     Goodreads             Not specified               Free                  Goodreads
                                                                                                            location
     GoFundMe              Not specified               Free                  GoFundme                     Place name
                                                                                                      Collected but not
        Imgur         12,500 requests per day          Free                     Imgur
                                                                                                    available through API
      Instagram                Varies                  Free             Basic Display, Graph             Coordinates
     Kickstarter           Not specified               Free               Kickstarter Status             Not available
                                                                                                      Collected but not
       Last.fm                 Varies                  Free                    Last.fm              available through API
                                                                                                     (query per location)
        LINE                   Varies              Free and paid             Messaging              Place name, coordinates
      LinkedIn                 Varies                  Free                   LinkedIn                    Place name
     LiveJournal               Varies                  Free                  LiveJournal                  Place name
                                                                                                      Collected but not
      Medium               Not specified               Free                   Medium
                                                                                                    available through API
       Meetup              Not specified               Free                 Meetup Rest             Place name, coordinates
                                                                        Attachment Upload,
                                                                        Broadcast, Customer
                                                                        Matching, Handover
                                                                       Protocol, ID Matching,
     Facebook
                               Varies                  Free               Messenger Code,                Coordinates
     Messenger
                                                                        Messaging Insights,
                                                                     Messenger Profile, Personas,
                                                                      Send, Messaging Feature
                                                                              Review
                                                                       Graph -People, Groups,
                                                                        People lookup, Voice,
                                                                       Updates, Check, Photo,
         Mixi              Not specified               Free                                         Place name, coordinates
                                                                      Message, Diary, Check-in,
                                                                      Profile Image, Persistence,
                                                                               Calendar
ISPRS Int. J. Geo-Inf. 2020, 9, 526 9 of 20
Table 3. Cont.
Site Rate Limits Costs API Name(s) Location Data
MocoSpace Not specified Free MocoSpace Not specified
Minds Not specified Free Minds Not specified
MyHeritage Not specified Free Family Graph Place name
Photobucket Varies Free and paid Photobucket Coordinates
Pinboard 1 call per user every 3 s Paid Pinboard Not specified
Approved app can
Pinterest Free Pinterest Place name
make 100 calls/day
Collected but not
Pixabay 5000 requests per hour Free Pixabay available through API
(query per location)
Plurk Not specified Free Plurk Place Name
Collected but not
ProductHunt Varies Free ProductHunt GraphQL
available through API
User Information,
Relationship Chain,
QQ Not specified Free Not specified
Application promotion,
Payment
Collected but not
Ravelry Not specified Free Ravelry
available through API
Reddit 60 requests per minute Free Reddit Place name
Sina Weibo Rest, Search,
Sina Weibo Varies Free Place name, coordinates
Geo, Test
Collected but not
Shutterfly Not specified Not specified Shutterfly
available through API
Skype Not specified Free Skype Place name
Skyrock Varies Free Skyrock Place name, coordinates
Solaborate Not specified Free Solaborate Not specified
SoundCloud Varies Free SoundCloud Place name, coordinates
Collected but not
Snapchat Not specified Free Snap Kit
available through API
Taringa! Not specified Free Taringa! Rest Not specified
Telegram Varies Free Telegram Rest, Bot Place name
Tumblr Varies Free Tumblr Place name
Ads, Search Tweets,
Twitter Varies Free and paid Streaming, and Direct Place name, coordinates
Message.
Untappd 100 calls per key Free Untappd Place name, coordinates
Collected but not
Vero Not specified Not specified Vero
available through API
Last 50 items of Collected but not
Viadeo Free Viadeo
endpoints available through API
Viber Varies Free Viber Place name, coordinates
VKontakte Varies Free VKontakte Place name
WeChat Not specified Not specified WeChat Place name, coordinates
WhatsApp Varies Paid WhatsApp Business Not specified
XING Varies Not specified XING E-Recruiting Place name
Yelp 5000 API calls per day Free Fusion Place name, coordinates
Iframe Player, Data,
YouTube Varies Free Analytics, Live Streaming, Place name
ReportingISPRS Int. J. Geo-Inf. 2020, 9, 526 10 of 20
Apps with large user numbers are more likely to provide an API than those with smaller
user numbers. An independent samples T-test showed that the 53 out 57 apps with an API
and known user counts had higher user numbers (Mean (M) = 345,582,491, Standard Deviation
(SD) = 540,839,941) compared to the 53 apps without an API (M = 70,684,659, SD = 146,634,689),
t(df) = 96, p < 0.001. Furthermore, among those apps with an API, an independent samples
T-test showed that the mean number of users was higher for apps that provided spatial data in
their API (M = 395,848,485, SD = 574,334,200) than for those apps that did not (M = 262,643,600,
SD = 483,078,816), t(df) = 51, p = 0.015.
All APIs require users to register their apps to obtain API access credentials, such as an ID number
and API key. API access requests for most apps were immediately approved, but for apps, such as
Untappd or Facebook, this process takes some time.
Rate limiting methods were applied to numerous APIs (Table 3). For a few apps, such as
DeviantArt, Discord, Last.fm, and LINE, which do not have a set rate limit, an effective rate limit varies
depending on the frequency at which clients make requests and its effect of the app stability. For others,
such as 23 and Me, eToro, and Goodreads, rate limitations were not disclosed. Doximity, Flickr, Imgur,
Pinboard, and Pinterest have fixed API request rate limits. Besides setting rate limiting per given time,
rate limits can also be implemented through fees. Most of the apps provide free access or a mix of free
and paid subscriptions. For example, Twitter charges for access to its Premium and Enterprise APIs,
whereas the Search and Streaming APIs are free of charge. Foursquare and Photobucket are free for
noncommercial use but charge fees for commercial use of their APIs. As opposed to this, WhatsApp
Business, Pinboard, and 500px APIs provide access through paid subscriptions only.
The apps that collect and share spatial data provide different types of location information, such as
coordinates of the centroid of an administrative boundary. Based on information from the terms of
service and privacy policies of various apps, location data was not provided in the APIs of a few
apps even though it is collected in the background using IP addresses. In summary, 22 apps did
not provide access to spatial data while 35 provided place name, geographic coordinates, or both
through the API according to their API documentation (Table 3). Some APIs, such as that of Last.fm,
allowed only running spatial queries, such as using the geo.getTopTracks or geo.getTopArtists API
methods to query these endpoints using country names. Location data from several apps stems from
user profiles only while a few apps, such as Twitter, Facebook, and Instagram provide spatial data
affiliated with multimedia, such as pictures, videos, or text. 500px provides this information only once
a paid subscription is made. The Flickr API is the only one that reports the accuracy of the coordinates
it provides.
Although Table 3 provides information about rate limits, costs, and location data, additional
limitations as to whose data can be downloaded may apply. In some cases, only one’s own data can
be accessed through the API, or those from other users who gave specific permission as specified,
for example, for the Facebook Graph API or the WeChat API [58,59].
4.3. Research Papers on Google Scholar, ACM Digital Library, and Web of Science
Apps such as Facebook, Instagram, Twitter, and YouTube had the highest numbers of papers
published about them (Table 4), indicating that they are prominent platforms within the research
community. These are also the apps with high user numbers. To quantify these results in more detail,
first, the median of user numbers across social media apps in Table 2 (where available) was computed
as 100,000,000. Next, each app was assigned to one of two groups, namely either the one group that
contained apps with user numbers below the median or the other group with user numbers above
the median. An independent samples T-test showed that in Google Scholar the apps falling into the
upper user group had more paper counts (M = 331,516.9, SD = 543,184.4) compared to those in the
lower user group (M = 75,528.58, SD = 227,738.4), t(df) = 49, p < 0.031. Similarly, in the ACM Digital
Library the apps in the upper user group had more paper counts (M = 3766.5, SD = 6928.3) than those
in the lower user group (M = 283.9, SD = 640.8), t(df) = 49, p < 0.014. Furthermore, in the WoS theISPRS Int. J. Geo-Inf. 2020, 9, 526 11 of 20
apps in the upper user group had more paper counts (M = 3220.3, SD = 8115.4) than those in the lower
user group (M = 139.8, SD = 320.5), t(df) = 49, p = 0.059. In the case of WoS, the level of significance
for the difference in means is slightly above 5%, whereas for the other two search catalogs it is below
that value.
Table 4. Number of research papers associated with the different social media platforms.
Site Google ACM WoS Site Google ACM WoS
23andMe 9590 50 656 Pinterest 274,000 714 214
500px 2910 36 4 Pixabay 25,400 36 24
Badoo 4780 33 17 Plurk 15,600 37 16
Baidu Tieba 1680 1273 8 ProductHunt 332 0 0
DeviantArt 5560 72 12 QQ 1,010,000 2432 37503
Discord 33 4 4095 Ravelry 889 30 0
Doximity 1090 1 68 Reddit 307,000 1353 267
eToro 1280 2 7 Shutterfly 1140 32 6
Facebook 1,830,000 22,108 15,663 Sina Weibo 32,100 1430 392
Facebook Messenger 291,000 24,144 78 Skype 76,700 3333 918
Flickr 139,000 5485 924 Skyrock 4420 8 3
Foursquare 23,000 1846 345 Snapchat 18,500 659 234
Goodreads 14,900 99 46 Solaborate 9 0 0
GoFundMe 3240 29 29 SoundCloud 138,800 154 20
Imgur 4200 58 9 Taringa! 7860 2 204
Instagram 194,000 2503 1492 Telegram 68,000 342 312
Kickstarter 15,500 310 186 Tumblr 229,000 563 183
Last.fm 15,000 826 102 Twitter 1,700,000 17235 12111
LINE 1330 23 11 Untappd 232 3 0
LinkedIn 525,000 2998 603 Vero 556,000 125 8
LiveJournal 24,100 905 73 Viadeo 3590 4 3
Medium 411 3 2 Viber 15,600 149 41
Meetup 11,600 326 50 VKontakte 16,000 69 95
Minds 10 0 158 WeChat 345,000 707 731
Mixi 12,400 129 11 WhatsApp 39,600 1347 954
Mocospace 179 3 0 XING 1,040,000 2773 1540
MyHeritage 14,100 9 10 Yelp 20,500 1342 349
Photobucket 5210 71 2 YouTube 1,360,000 9744 4381
Pinboard 2820 47 14
Minds, Solaborate, Kickstarter, and Mocospace APIs were among the apps with the lowest totals
across the three catalogs when queried for papers. “Discord”, “LINE”, “Medium”, which exist as
English words, resulted in many irrelevant hits. XING, which is an app and a person’s name, led to
unrelated results as the catalogs also tallied papers that were written by authors with that name.
The latter problem could be mitigated by excluding author name in the search criteria from WoS
whose results were also used to create the word cloud. Mocospace, ProductHunt, Ravelry, Solaborate,
and Untappd did not have any papers affiliated with these social media platforms on WoS.ISPRS Int. J. Geo-Inf. 2020, 9, 526 12 of 20
Table 4 reveals strong discrepancies in the number of returned papers between the three search
portals. For each social media app, except for two platforms whose names also resemble an English term
(Discord, Minds), Google Scholar by far outnumbers ACM and WoS search results. Google Scholar is
one of the most widely used tools for researchers to search scientific information, and through parsing
the entire Web its coverage is much more extensive than other multidisciplinary commercial databases
like WoS or Scopus [60]. However, only up to 1000 search results can be displayed on the Google
Scholar Website, and no API is available for additional search. Results from an earlier study show that
55% of the more than 2.6 million sample documents covered by WoS from 2009 and 2014 were freely
available in some form from Google Scholar, e.g., as open access documents from publisher Websites
or through links to other repositories, such as researchgate or arxiv [61]. ACM displays up to 2000
search results, where filters can be used to specify the subset of records to be displayed in cases where
more than 2000 documents are returned upon a query. As opposed to this, the WoS allows to view all
returned records by browsing through the result pages.
4.4. Research Themes
Research themes for papers returned from the WoS search were extracted using the “analyze
results” feature. Out of the 57 apps with an API, 26 apps had spatial themes (Geography, Remote
Sensing, Transportation, and Urban Planning). The frequency of the geospatial themes as found in
the 3095 papers that are associated with those 26 apps are shown in Figure 1. The bars are overlaid
with the number of papers that were found to be associated with each spatial theme for the different
apps. The apps are sorted in descending order of the total number of papers found to be associated
with a spatial theme, starting with XING on top (1113 papers), followed by Twitter (674 papers)
and QQ (532 papers). Several apps had only one paper with a spatial theme, such as Tumblr or
Reddit. The dominating theme is Geography, which can be found in papers for all apps listed in the
chart. The other spatial themes are less frequently discussed in research outlets, i.e., Transportation
for 73% of the apps, Remote Sensing for 62%, and Urban Planning for 69%. Common non-spatial
themes found in papers related to apps with APIs include Materials science, Chemistry, Physics
applied, Biochemistry molecular biology, Engineering electrical electronic, Oncology, Nanoscience,
Communication, Computer science information systems, and Environmental Sciences. These themes
are not listed in Figure 1 though.ISPRS Int. J. Geo-Inf. 2020, 9, x FOR PEER REVIEW 12 of 20
of the apps, Remote Sensing for 62%, and Urban Planning for 69%. Common non-spatial themes
found in papers related to apps with APIs include Materials science, Chemistry, Physics applied,
Biochemistry molecular biology, Engineering electrical electronic, Oncology, Nanoscience,
ISPRSCommunication,
Int. J. Geo-Inf. 2020,Computer
9, 526 science information systems, and Environmental Sciences. These themes13 of 20
are not listed in Figure 1 though.
Geography Remote Sensing Transportation Urban Planning
XING 396 388 279 50
Twitter 349 102 100 123
QQ 186 217 102 27
Facebook 64 11 44 63
Flickr 86 20 2 25
Foursquare 45 16 32 18
Discord 31 7 23
YouTube 22 3 19 12
Medium 17 9 17 9
Instagram 25 5 2 11
Yelp 9 3 8 4
LINE 3 2 17 1
Sina Weibo 9 7 3 3
Skype 12 3
WeChat 5 2 2 4
LinkedIn 3 1 4
Telegram 4 1 2 1
WhatsApp 1 5 1
Kickstarter 1 3
Minds 1 3
Meetup 3 1
Snapchat 1 1
Tumblr 1
Reddit 1
Pinterest 1
Last.fm 1
0% 10% 20% 30% 40% 50% 60% 70% 80% 90% 100%
Figure
Figure 1. Spatialthemes
1. Spatial themesof
ofpapers
papers associated
associatedwith
withsocial media
social apps.
media apps.
The overview
The overview in Figure
in Figure 1 addstotothe
1 adds theexisting
existing body
bodyofofknowledge
knowledge byby
provision
provisionof topical research
of topical research
relevance for wide range of social media apps. As opposed to this, several earlier studies
relevance for wide range of social media apps. As opposed to this, several earlier studies analyzed analyzed
in-depth
in-depth research
research activities
activities associated with
associated with individual
individual social
socialmedia
media apps
appsoneone
at aattime, such such
a time, as as
Twitter [44] or Facebook [42]. These are, as can be seen in Figure 1, among the most widely analyzed
Twitter [44] or Facebook [42]. These are, as can be seen in Figure 1, among the most widely analyzed
social media platforms.
social media platforms.
Figure 2 shows word clouds formed by papers from WoS that are associated with social media
Figure
apps that2 shows
provideword
APIs, clouds formed
where apps by papers
are grouped from WoS
by theme that to
according areTable
associated
1. No wordwithcloud
social
wasmedia
apps that provide APIs, where apps are grouped by theme according to Table 1. No word cloud was
created for the gaming category because Mocospace, which is the only app with an API in that category,
did not yield any papers from WoS. The key terms for each word cloud generally align well with the
theme that the set of corresponding apps was assigned to in Table 1. For example, papers on blogging
revolve around networking, social media, health, and community. Business app-related papers discuss
trading, investment, decision making, and risk, whereas papers on photo sharing networks mention
images, Instagram, Flickr, photo, or visual. The word clouds, therefore, demonstrate the different facets
of activities and concepts that research papers discussing these apps cover in their analyses.with the theme that the set of corresponding apps was assigned to in Table 1. For example, papers on
blogging revolve around networking, social media, health, and community. Business app-related
papers discuss trading, investment, decision making, and risk, whereas papers on photo sharing
networks mention images, Instagram, Flickr, photo, or visual. The word clouds, therefore,
demonstrate
ISPRS Int. the different
J. Geo-Inf. 2020, 9, 526 facets of activities and concepts that research papers discussing these apps
14 of 20
cover in their analyses.
Blogging Business General Purpose
Lifestyle Photo sharing Reunion
Video
Figure
Figure 2. Word
2. Word clouds
clouds fordifferent
for differentcategories
categories of
ofsocial
socialmedia
mediaapps.
apps.
5. Discussion
According to Statista, more than 50% of the world’s population use social media [62].
This demonstrates the important role of social media apps today. Communication and user profile
data as well as the user-generated content shared on these platforms provide a valuable resource
for researchers across numerous disciplines. The user statistics summarized in this study give a
good indication of the popularity of the different apps. Prominence of social apps, as it can be
found, for example, for Facebook, Instagram, and YouTube, also comes with increased interest in the
research community, as reflected in numerous research papers related to particularly prominent social
media apps.
To stimulate innovation and help expand their business services, about half of the analyzed social
media platforms give developers access to some of their data through APIs. This trend began in the
early 2000s with e-commerce companies such as eBay and Amazon leading these efforts [63]. StatisticalISPRS Int. J. Geo-Inf. 2020, 9, 526 15 of 20
tests revealed that social media apps with a large user base also tend to provide APIs more often
compared to those apps with lower user numbers. This is because development and support of an API
require certain developer resources and infrastructure. In turn, provision of an API access may also lead
to growth in user numbers as is the case with e-commerce platforms such as eBay because third-party
developers are able to embed API functions onto their websites. In other words, companies behind
apps with large user numbers have financial resources to develop and maintain APIs. Investment in an
API pays off in the form of increased platform visibility and fees charged for the use of such an API for
business services. For instance, Twitter as of 2011 got 15 billion calls a day on their site, three-quarter of
which came through their API, and Facebook received 5 billion calls a day through its APIs [64]. All the
APIs reviewed in this study required filling out an application form. For most apps, the approval
process occurs almost immediately. However, for some apps, such as Untappd, the process can take
up to three weeks [65] and for Instagram it can take one week or more [66]. The rigorous application
process is aimed at tracking how the data acquired from these apps are used as users are asked to
specify data use intentions during the application process [67]. 500 px and Pinboard are some of the
apps where API users are charged a fee whereas for other apps API use was partially or entirely free.
Foursquare and Twitter APIs are operated in a freemium type of model that offers basic data access for
free for noncommercial use, but increased data access or commercial use are charged for. For instance,
Foursquare provides twice the amount of data on the paid subscription of its API, and the premium
and enterprise versions of the Twitter API give access to the full archive of tweets.
API rate limits express the allowable request per time interval and help with the stability and
security of an app. Rate limiting techniques include maximum allowable requests per given time span,
which, when exceeded, leads to the API calls being disconnected or the bandwidth being reduced.
The Doximity API, for instance, allows its users to make 5000 API requests per hour whereas Flickr allows
3600 queries per hour. Twitter and Viber rate limits depend on the information being requested or the API
call being made. Rate limits control the volume of data a developer can have access to at a given time.
Access to data is also affected by a user’s privacy settings. The Facebook Graph API rate limit varies in
that it implements a user level rate limiting per access token, whereas the app level limits are based on
counts of the app ID being used. API level limits are based on number of API calls per second and IP
level rate-limiting is based on the number of calls assigned to a particular IP address [68].
Since social media apps gather user data, in recent years, a variety of government-mandated
policy changes regarding data privacy were initiated. An example is Europe’s GDPR, which aims at
giving the users more control over how their data is collected, processed, stored, and transferred in
the 28 member states of the European Union [69]. This has led to some social media apps restricting
data access through their APIs as they changed their privacy policies to abide by the new regulation.
This, in turn, affected data accessibility through the APIs. Facebook, for instance, rolled out new API
restrictions in the wake of the Cambridge Analytica data scandal and GDPR which were aimed to close
loopholes in the website privacy policies [36]. 500 px announced in 2018 that it will only provide paid
access to its API in order to protect its data and improve its site performance [70]. Such changes in
policies tend to further reduce the availability of social media app data for geospatial research because
location data is widely considered personal or private data.
Location data is the backbone of geospatial research. APIs provide this data in the form of place
names, geographic coordinates, address, time zone, or IP address, among others. Location data on
social media can be extracted from message context or metadata, user profiles, the social network
of friends and connections, tags, multimedia content (photos, videos), and links to other connected
social media pages [50]. The main location types of data found on APIs in this study were place
names and geographic coordinates, whereas some apps also collected IP address information. In some
apps, location data is not made available through the API. For example, 23andMe, Imgur, and Last.fm
collect location data from IP addresses but do not provide access to this data on their respective
APIs. Additional restrictions hinder access to comprehensive location data through an API. When a
user’s privacy settings do not allow sharing of this data then the information will not be retrievable.ISPRS Int. J. Geo-Inf. 2020, 9, 526 16 of 20
For example, the Facebook Graph API prevents the retrieval of data of a particular user due to their
privacy settings [58]. In addition, a low percentage of social media content has been geotagged with
geographic coordinates, for instance, only about 1-2% of tweets are geotagged [71]. The integrity of the
location information extracted from social media can be questionable in some aspects as studies have
found that some users provide incorrect locations intentionally in their user profiles [72].
Social media data has boosted research in various areas, which becomes evident from the number
of papers retrieved from Google Scholar, the ACM Digital Library, and the WoS. The research themes
on Figure 1, based on the papers retrieved from the WoS, illustrate the geospatial disciplines that have
been researched in relation to the different apps. Among all 89,839 papers retrieved from the WoS
for the 57 apps considered that provide an API, only 3095 are associated with geospatial disciplines.
These 3095 papers are related to 26 out of the 57 apps. This low number of papers relative to the total of
89,839 papers reveals that the role of geospatial research within the entire social media research arena
is a relatively small one. Instead, research in other disciplines, such as communication or computer
science, more often report on social media data analysis.
There is a tendency that only a handful of apps are used for geospatial research even though other
lesser known apps also provide datasets that could potentially drive research and reveal insights about
various phenomena [50]. A total of 17 apps out of the 57 apps with APIs can in this study be identified
as potential data sources for future research as they provide geographic data either from media or
user profile information and come only with a small number of research papers published so far.
These apps include DeviantArt, Discord, Doximity, eToro, Goodreads, Last.fm, LINE, LiveJournal, Mixi,
MyHeritage, Photobucket, Plurk, Sina Weibo, Skyrock, Untappd, Viber, and Vkontakte. As an example
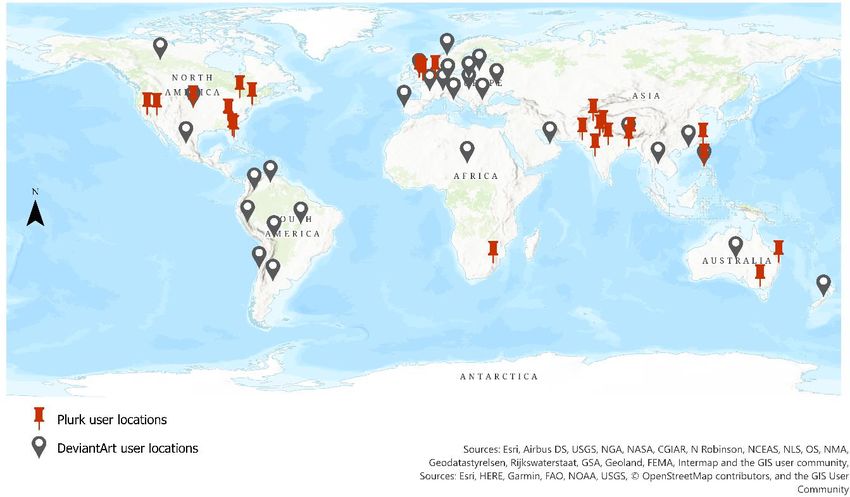
of a successful attempt to retrieve geospatial information, Figure 3 depicts the distribution of location
data obtained from the Plurk and DeviantArt APIs based on user profiles. The Plurk API facilitates
batch processes such as adding friends or fans and getting bookmarks. The API can be also be used to
look for search terms of interest which returns a JavaScript Object Notation (JSON) response with only
the 20 latest plurks. The JSON report includes place names associated with the user profile locations.
The red markers in Figure 3 show the profile locations of users who included the “Coronavirus”
search term in their plurks. This data was accessed through the/APP/PlurkSearch/search endpoint.
The DeviantArt API allows one to get the country names of watchers who are followers or fans of a
DeviantArt user’s page. Using the/user/watchers/{username} endpoint facilitated the extraction of the
location, i.e., the country name, of about 100 watchers of a user with the name boldfrontiers (black
markers in Figure 3).
ISPRS Int. J. Geo-Inf. 2020, 9, x FOR PEER REVIEW 16 of 20
Figure
Figure 3. Locationdata
3. Location datafrom
from Plurk
Plurk andand DeviantArt.
DeviantArt.
6. Conclusions
The overall goal of this study was to explore the potential of less known social media apps for
geospatial research by evaluating 110 social media apps, among which more than half were found to
provide APIs. APIs give developers data access and facilitate examination of the characteristics ofISPRS Int. J. Geo-Inf. 2020, 9, 526 17 of 20
6. Conclusions
The overall goal of this study was to explore the potential of less known social media apps for
geospatial research by evaluating 110 social media apps, among which more than half were found to
provide APIs. APIs give developers data access and facilitate examination of the characteristics of data
availed, including the provision of spatial data. As learned from the different API documentations,
all the APIs considered store location data from their users in one form or another, but this information
may not be available due to government regulations, app privacy policies, or a user’s privacy settings.
Recent governmental policy guidelines, such as GDPR and CCPA, have affected social media
data access as they led to stricter rules in a wide range of social media apps. It will be of interest to
investigate how this impacts data access and consequently research that relies on social media data in
the long run. Facebook, which is one of the biggest social media platforms, introduced restrictions that
curtail full data access in April of 2018 [36] as a result of GDPR. Besides this, another common obstacle
in data extraction from APIs is frequent changes of policies, access regulations, functionality, or user
registration and approval procedures, as well as outdated or missing API documentation. The latter
necessitates substantial and time-consuming exploration, code testing, and internet search to obtain
successful data access.
Among the list of 35 APIs that provide spatial data in form of place names or geographic
coordinates, the spatial granularity of available data varies and, therefore, influences the type of
research that it can be applied for. Spatial accuracy information from apps that provide coordinates
is only given within the Flickr API. Aspects of future work include, therefore, the assessment of the
quality of spatial data accessible in the 17 apps that provide location data through an API, even though
they are rarely featured in geospatial research.
Social media sites collect an ever-increasing amount of data from their users, but privacy concerns
may render access to these datasets impossible unless it is anonymized, and personal information is
removed. Even if so, ethical use of the data is required. Therefore, the future may bring more rigorous
approval procedures of API access requests with even follow-up audits to ensure that data is being
used as intended. Future work will closely examine the consequences of such anticipated changes in
API regulations on the social media analysis.
Author Contributions: Conceptualization, Hartwig H. Hochmair and Innocensia Owuor; methodology, Innocensia
Owuor and Hartwig H. Hochmair; software, Innocensia Owuor; validation, Innocensia Owuor and Hartwig H.
Hochmair; formal analysis, Innocensia Owuor; data curation, Innocensia Owuor; funding acquisition, Hartwig H.
Hochmair; project administration, Hartwig H. Hochmair; resources, Hartwig H. Hochmair; supervision, Hartwig
H. Hochmair; visualization, Innocensia Owuor; writing—original draft, Innocensia Owuor; writing—review and
editing, Innocensia Owuor and Hartwig H. Hochmair. All authors have read and agreed to the published version
of the manuscript.
Funding: We acknowledge financial support through a UF-CALS matching assistantship granted to the first author.
Acknowledgments: The authors thank two anonymous reviewers for their constructive feedback.
Conflicts of Interest: The authors declare no conflict of interest.
References
1. Spyratos, S.; Stathakis, D.; Lutz, M.; Tsinaraki, C. Using Foursquare place data for estimating building block
use. Environ. Plan. B Urban Anal. City Sci. 2017, 44, 693–717. [CrossRef]
2. Noulas, A.; Scellato, S.; Lambiotte, R.; Pontil, M.; Mascolo, C. A tale of many cities: Universal patterns in
human urban mobility. PLoS ONE 2012, 7, e37027. [CrossRef]
3. Han, S.Y.; Tsou, M.-H.; Knaap, E.; Rey, S.; Cao, G. How do cities flow in an emergency? Tracing human
mobility patterns during a natural disaster with big data and geospatial data science. Urban Sci. 2019, 3, 51.
[CrossRef]
4. Lazer, D.M.J.; Baum, M.A.; Benkler, Y.; Berinsky, A.J.; Greenhill, K.M.; Menczer, F.; Metzger, M.J.; Nyhan, B.;
Pennycook, G.; Rothschild, D.; et al. The science of fake news. Science 2018, 359, 1094–1096. [CrossRef]
[PubMed]You can also read


