Montclair State University Digital Commons - Montclair State ...
←
→
Page content transcription
If your browser does not render page correctly, please read the page content below

Montclair State University
                                                          Montclair State University Digital
                                                                                Commons

Theses, Dissertations and Culminating Projects

5-2021

Detecting Bots Using a Hybrid Approach
Edmund Kofi Genfi
Montclair State University

Follow this and additional works at: https://digitalcommons.montclair.edu/etd

   Part of the Computer Sciences Commons

Recommended Citation
Genfi, Edmund Kofi, "Detecting Bots Using a Hybrid Approach" (2021). Theses, Dissertations and
Culminating Projects. 736.
https://digitalcommons.montclair.edu/etd/736

This Thesis is brought to you for free and open access by Montclair State University Digital Commons. It has been
accepted for inclusion in Theses, Dissertations and Culminating Projects by an authorized administrator of
Montclair State University Digital Commons. For more information, please contact digitalcommons@montclair.edu.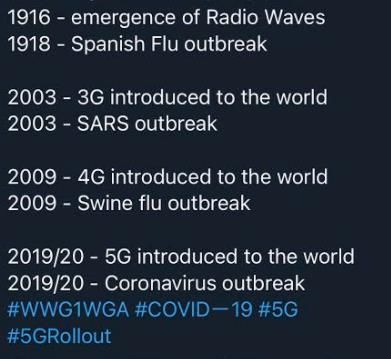
Abstract
Artificial intelligence (AI) remains a crucial aspect for improving our modern lives but it

also casts several social and ethical issues. One issue is of major concern, investigated in

this research, is the amount of content users consume that is being generated by a form of

AI known as bots (automated software programs). With the rise of social bots and the

spread of fake news more research is required to understand how much content generated

by bots is being consumed. This research investigates the amount of bot generated content

relating to COVID-19. While research continues to uncover the extent to which our social

media platforms are being used as a terrain to spread information and misinformation, there

still remain issues when it comes to distinguishing between social bots and humans that

spread misinformation. Since online platforms have become a center for spreading fake

information that is often accelerated using bots this research examines the amount of bot

generated COVID-19 content on Twitter. A hybrid approach is presented to detect bots

using a Covid-19 dataset of 71,908 tweets collected between January 22nd, 2020 and April

2020, when the total reported cases of Covid-19 were below 600 globally.              Three

experiments were conducted using user account features, topic analysis, and sentiment

features to detect bots and misinformation relating to the Covid-19 pandemic. Using Weka

Machine Learning Tool, Experiment I investigates the optimal algorithms that can be used

to detect bots on Twitter. We used 10-fold cross validation to test for prediction accuracy

on two labelled datasets. Each dataset contains a different set (category 1 and category 2)

of four features. Results from Experiment I show that category 1 features (favorite count,

listed count, name length, and number of tweets) combined with random forest algorithm
produced the best prediction accuracy and performed better than features found in category

2 (follower count, following count, length of screen name and description length). The best

feature was listed count followed by favorite count. It was also observed that using category

2 features for the two labelled datasets produced the same prediction accuracy (100%)

when Tree based classifiers are used.

To further investigate the validity of the features used in the two labelled datasets, in

Experiment II, each labelled dataset from Experiment I was used as a training sample to

classify two different labelled datasets. Results show that Category 1 features generated a

94% prediction accuracy as compared to 60% accuracy generated by category 2 features

using the Random Forest algorithm. Experiment III applies the results from Experiment I

and II to classify 39,091 account that posted Coronavirus related content. Using the random

forest algorithm and features identified Experiment I and II, our classification framework

detected 5867 out of 39,091 (15%) account as bots and 33,224 (85%) accounts as humans.

Further analysis revealed that bot accounts generated 30% (1949/6446) of Coronavirus

misinformation compared to 70% of misinformation created by human accounts. Closer

examination showed that about 30% of misinformation created by humans were retweets

of bot content. In addition, results suggest that bot accounts were involved in posting

content on fewer topics compared to humans. Our results also show that bots generated

more negative sentiments as compared to humans on Covid-19 related issues.

Consequently, topic distribution and sentiment may further improve the ability to

distinguish between bot and human accounts.

Keywords: Social Bots, Human, Misinformation, information, Detection Technique, Hybrid

Approach, Social Networking Features, Sentiments Features
Montclair State University

                        Detecting Bots Using a Hybrid Approach

                                         by

                                 Edmund Kofi Genfi

                     A Master Thesis Submitted to the Faculty of

                             Montclair State University

                      In Partial Fulfillment of the Requirements

                                  For the Degree of

                                 Master of Science

                                     May 2021

College of Science and Mathematics                 Thesis Committee:
Department of Computer Science

                                                   Dr. Christopher Leberknight

                                                   Thesis Sponsor

                                                                                 .

                                                   Dr. Bharath Samanthula

                                                   Committee Member

                                                                                 .

                                                  Dr. Boxiang Dong

                                                  Committee Member

                                                                                 ...
DETECTING BOTS USING A HYBRID APPROACH

                      A THESIS

  Submitted in partial fulfillment of the requirements

         For the degree of Master of Science

                          by

                 Edmund Kofi Genfi

              Montclair State University

                    Montclair, NJ

                         2021
Copyright © 2021 by Edmund Kofi Genfi. All rights reserved.

                                                              iii
Acknowledgments

I dedicate this work to God Almighty. I am very delighted for his complete protection and

guidance throughout my Master thesis project. I also dedicate this work to my mother who

has supported me tremendously throughout my university education.               “We must

consistently acknowledge the efforts of people who in one way or another contributed

immensely to the turning point of our lives”- John Osten.

In the light of this statement, I will like to express my deepest and hearty appreciation to

my supervisor – Prof. Christopher Leberknight, Sir, I am very grateful for your complete

supervision and constructive criticism that helped tremendously in the completion of this

work and contributed immensely to my understanding of Computer science research.

My gratitude goes to all lecturers of the department of Cybersecurity for the knowledge

they have imparted in me. Special thanks go to Daniel Chege (Ms. Cybersecurity), Murad

Hasan (Ms. Cybersecurity) and my fiancée, Tiffany Opoku-Antwi for their role in the

research process.

                                                                                           i
Contents

Acknowledgments……………………………………………………………………………………………………………………….i
LIST OF ILLUSTRATIONS................................................................................................................... iv
List of Tables .................................................................................................................................... v
Chapter 1 Introduction .................................................................................................................... 1
   1.1 Background and Motivation .................................................................................................. 1
   1.2 Organization of the study ...................................................................................................... 5
   1.3 Literature Review ................................................................................................................... 6
       1.3.1 Graph Based Social Bot Detection .................................................................................. 6
       1.3.2 Crowdsourcing Social Bot Detection............................................................................... 7
       1.3.3 Feature-based Social Bot Detection................................................................................ 8
Chapter 2 Objectives of the study ................................................................................................... 9
   2.1 Overview ................................................................................................................................ 9
   2.2 Problem Statement .............................................................................................................. 10
   2.3 Hybrid Approach .................................................................................................................. 12
Chapter 3 Methodology ................................................................................................................. 14
   3.1 Datasets ............................................................................................................................... 15
       3.1.1Training Dataset ............................................................................................................. 16
       3.2 Test Datasets .................................................................................................................... 18
   3.3 Hypotheses .......................................................................................................................... 20
   3.4 Experiments ......................................................................................................................... 22
       3.4.1 Experiment I .................................................................................................................. 24
       3.4.2 Experiment II ................................................................................................................. 24
       3.4.3 Experiment III ................................................................................................................ 25
       3.4.4 Experimental Steps ....................................................................................................... 25
Chapter 4 Experimental Results ..................................................................................................... 27
   4.1 Experiment I ......................................................................................................................... 27

                                                                                                                                                   ii
4.2 Experiment II ........................................................................................................................ 33
4.3 Experiment III ....................................................................................................................... 40
4.4 Misinformation and Topic Analysis ...................................................................................... 45
4.4.1 Bots ............................................................................................................................... 45
4.4.2 Humans ......................................................................................................................... 47
4.3 Sentiment Analysis (Bots vs. Humans) ................................................................................. 58
Chapter 5 Conclusions ................................................................................................................... 64
5.1 Introduction ......................................................................................................................... 64
5.2 Summary of Major Findings ................................................................................................. 64
5.3 Concluding Remarks....................................................................................................... 72
5.4 Recommendations ............................................................................................................... 72
Bibliography ................................................................................................................................... 73
iiiLIST OF ILLUSTRATIONS
Figure Page
Figure 1.1: Botnet Architecture (Adapted from Depositphotos) ....................................... 2
Figure 3.2: A graphic displaying our research plan. .......................................................... 26
Figure 4.1.1: Shows RTbust user account features and their performance values. ......... 31
Figure 4.1.2: Shows Social Honeypot user account features and their performance ...... 32
Figure 4.3.1: Covid-19 Trend analysis generated by using the social honeypot dataset . 42
Figure 4.3.2: COVID-19 Trend analysis generated by the RTbust training set. ................ 43
Figure 4.4.2:Shows the most used hashtags by bots in our COVID-19 dataset ............... 46
Figure 4.4.4: Misinformation by humans over time (1000 tweets).................................. 50
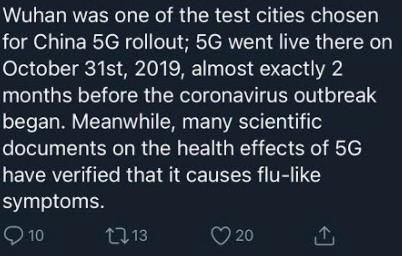
Figure 4.4 5: Shows examples of conspiracy tweets about 5G and Covid-19. ................. 52
Figure 4.4.6: Shows Bot Misinformation and Disinformation Trend Analysis (N=500).... 53
Figure 4.4.8: Shows the probability for misinformation (#Coronavirus, #Covid-19). ...... 58
Figure 4.4.9: shows Human sentiment score on #Coronavirus and #Covid-19 (Left). ..... 59
Figure 4.4.10: Shows Bot sentiment score on #Coronavirus #Covid-19 .......................... 60
Figure 4.4 11: Shows the average sentiment (Bot vs Human). ........................................ 60
Figure 4.4 12: Shows the average sentiment (Bot vs Human). ........................................ 61
Figure 4.4.13: Shows examples of how Bot Sentinel rates a Twitter user Account. ....... 62
Figure 4.4.14: Shows Bot Sentinel rating and score for 900 unique Twitter accounts. ... 63
ivList of Tables
Table Page
Table 3.1: Shows the various months and the keyword used to hydrate the tweets. .................. 14
Table 3.2: Social Honeypot Dataset. .............................................................................................. 17
Table 3.3: Shows statistics about total collected data for testing. ................................................ 19
Table 3.4: Shows the datasets used for our experiment. .............................................................. 20
Table 3.5: Shows the features that will be used in this study. ...................................................... 23
Table 4.1: shows the prediction accuracy of our two baseline datasets. ...................................... 28
Table 4.1.1: Prediction accuracy with same number (4) but different type of features. .............. 30
Table 4.2.1: Confusion matrix for the result from our Social Honeypot testing dataset. ............ 34
Table 4.2.2: Confusion matrix for the results of our RTbust testing dataset.. Error! Bookmark not
defined.
Table 4.2.3: Comparison of accuracy and F1 for classifying Fame for Sale ................................... 36
Table 4.2.4: Confusion matrix for the results of our second testing dataset. ............................... 35
Table 4.2.5: Confusion matrix for the results of our second testing dataset.. .............................. 38
Table 4.2 6: Confusion matrix for the results of our second testing dataset.. .............................. 39
Table 4.3.1: Confusion matrix for the results of our second testing dataset. ............................... 41
Table 4.3.2: Shows the monthly classification of bots from the model ........................................ 44
Table 4.4.1: shows the sample size for topic analysis and misinformation analysis ..................... 45
Table 5.2 1 Total number of detected human tweets used for sentiment analysis. ..................... 67
Table 5.2 2 Total number of tweets used for sentiment analysis ................................................. 69
Table 5.2 3 Total number of detected human tweets used for sentiment analysis ...................... 69
Table 5.2 4 Total number of detected bots tweets used for sentiment analysis. ......................... 69
Table 5.2 5 Fraction of negative and positive sentiment generated by humans .......................... 70
vTable 5.2 6 Fraction of negative and positive sentiment generated by bots ................................ 70
Table 5.2 7: Summary of results .................................................................................................... 71
viChapter 1 Introduction
1.1 Background and Motivation
There has always been the need to study how Bots or network of Bots (Sybils) affects social
media and its impact on politics and national security. If you are an individual that searches
for daily news on social media, like most people do, then you may be exposed to many
types of fake and misleading content (Dunn et al., 2011). For example, hoaxes, rumors,
fabricated stories, conspiracy theories, and click-bait are all forms of misleading content
(Dunn et al., 2011). While malicious social bots often wage disinformation campaigns by
targeting political or economic content, the volume of such campaigns render manual
detection infeasible. Social media users are often unable to identify content created by
social bots. Scrolling through your favorite social media page, it may not be obvious if
you come across a bot account.
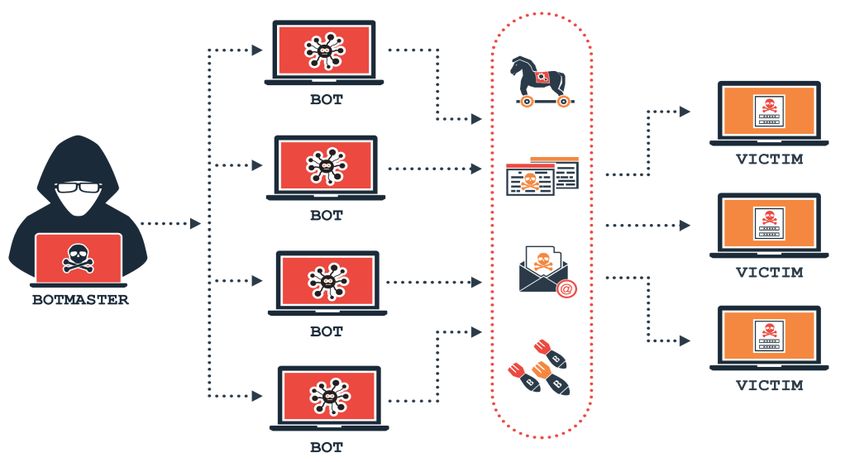
A malicious bot is a compromised computer under the direction of a human operator called
“Botmaster” (Feily et al., 2009). The term “Bot” is derived from the word “Robot”, and
just like Robots, bots are created to perform a specific function in an automated manner
(Feily et al., 2009). These bots are pieces of software programs that run on infected
machines without the user knowing about their existence (Al-Hammadi & Aickelin, 2017).
Botnets or Sybils (network of compromised computers) have become a huge cybersecurity
problem and have been used as a means to carry out most forms of cyber-attack (Eslahi et
al., 2012).
1The presence of these computerized agents has been observed in many sections of social
media applications such as Twitter which has been the most affected (Shao et al., 2018).
These social media bots create a platform for the spreading of several illegal activities
such as launching DDOS attacks against specific targets (Feily et al., 2009). A publication
on MIT Technology Review in 2020 reported that researchers observed that about half of
some 200 million tweets on the novel COVID-19 likely came from bots, with many of
them spreading false information, pushing conspiracy theories, and advocating for the
United States to loosen restrictions in order to reopen America (Nearly Half of Twitter
Accounts Pushing to Reopen America May Be Bots | MIT Technology Review, 2020).
Figure 1.1 shows a typical Botnet architecture.
Figure 1.1: Botnet Architecture (Adapted from Depositphotos)
Though hard to verify, researchers have also put forward claims about how fake news can
change how people think during a pandemic (Evanega et al., 2020; Chen et al., 2020). Yet
we have seen many forms of demonstration of real harm in 2020 caused by the spread of
2misinformation on social media relating to COVID-19 (P. Wang et al., 2018). The
influence of fake news on Twitter during the 2016 US presidential elections is a crucial
example that shows why much attention and research is needed to deal with malicious
social media bots. Using a casual model , the authors used a dataset of about 171 million
tweets to identify 30 million tweets spreading either false information or extremely biased
news from about 2.2 million users (Bovet & Makse, 2019).
Another research study used a dataset with 3.6 million tweets and observed that about
23.6% of those tweets that were examined were spreading hate speech by dividing public
views on issues concerning Brexit or the Catalan referendum (Rosso, 2019). While
misleading content is not something new, many online information platforms do not have
adequate safeguards to control and the spread of misinformation. It is now easy to use
social media to influence public opinion due to the low cost of creating fake websites and
the existence of several software-controlled social media profiles or pages (Dunn et al.,
2011).
Internet users believe in social contracts (Dunn et al., 2011) and can be made to accept and
spread content produced in a certain way (P. Wang et al., 2018). Moreover, the
augmentation of misleading news through social bots overwhelms our fact-checking
capacity because of our definite attention, as well as our propensities to consider what
appears current and to believe information in a social environment. A well worked out
strategy is required to fight against the spread of misinformation online (Dunn et al., 2011).
People need education when it comes to the consumption of news on all internet platforms
by the use of algorithms to widen the exposure to varied views and if malicious social bots
3are the reason for the spread of misinformation, then there is the need to focus our attention
on coming up with techniques to detect these malicious bots.
Mary Papenfuss from the HuffPost reported that there has been ongoing research about
how social media bots are spreading misleading content about the novel Coronavirus
(COVID-19) pandemic in May 2020. Researchers are yet to come up with a conclusion
about the entities or organizations that may be primarily responsible for the bots. The
primary objectives of this study are therefore to find out if the spread of misinformation
during the Coronavirus (COVID-19) pandemic era was done by activities of Bots using a
hybrid Bot Detection model.
False news, extensively disseminated over all internet platforms, can be considered as a
form of computational propaganda (Howard et al., 2017). Social media have provided a
platform for substantial volumes of fake, dramatic and other forms of junk news at delicate
moments in our social setting, though most platforms disclose little about how much of this
content there is or how it impacts those who use the platform (Howard et al., 2017).
The United States Department of Homeland Security reported in 2020 that the World
Economic Forum has identified the spread of disinformation as one of the top 10 threats to
society(COVID-19 Exploited by Malicious Cyber Actors | CISA, 2020). It has been
reported that bots can jeopardize online information platforms as well as our society
(Ferrara et al., 2016). Prior studies have done a sensational job trying to figure out the best
malicious Bot detection technique to help slow down the spread of fake news on all online
information platforms, however the bot strategies continue to evolve to evade detection.
Today, some social bots have been used to penetrate political discourse, control the stock
market and steal private information (Bovet & Makse, 2019). Prior to the 2020 United
4States elections, social media sites especially Twitter was flooded with bots that could
evade most bot detection techniques. In a new study, researchers at University of Southern
California identified thousands of bot accounts on Twitter that were uploading information
related to Donald Trump, President Biden and their political campaigns. Many of these
automated accounts were spreading disinformation and far-right conspiracy theories such
as “pizzagate” and QAnon (Twitter Bots Poised to Spread Disinformation Before Election
- The New York Times, 2020). Although social media platforms such as Twitter and
Facebook have worked effortlessly to control the impact of malicious social bots on their
respective platforms, identifying these bots still remain a difficult task and warrant further
research. The detection of social bots and the motive behind the spread of certain sensitive
and malicious information continues to be a significant research endeavor (Ferrara et al.,
2016).
1.2 Organization of the study
This paper is organized into five (5) chapters. Chapter 1 which is the introductory chapter
includes the background and motivation of the study, organization of the study, literature
review and limitation of the study. The review of literature is an attempt to study prior
studies on social bots to help have a better understanding of the issue or the problem this
research seeks to solve. Chapter two includes the objectives of the study, problem statement
and hypothesis. Chapter 3 describes the methodology, the dataset used in this study as well
as the description of the experiments conducted. Chapter 4 focuses on analysis of the data,
experimental results, misinformation and topic analysis, entities responsible for the spread
of Covid-19 misinformation and sentiment analysis. Chapter five is the summary of the
research findings and recommendations for future research.
51.3 Literature Review
Today, the research computing community is still designing sophisticated methods that can
automatically detect or prevent malicious social bots that spread misinformation on online
platforms. Bot detection techniques can be broadly divided into three distinct groups: (1)
Graph-Based Social Bot Detection, (2) Crowdsourcing Social Bot Detection and (3)
Feature-Based Social Bot Detection (Ferrara et al., 2016).
1.3.1 Graph Based Social Bot Detection
Graph Based Social Bot Detection is an intuitive way of representing network
communications using graphs. A strategy developed known as BotChase presents a two-
phased graph-based bot detection system that controls both unsupervised and supervised
Machine Leaning. The authors application of BotChase could detect several types of bots
and showed toughness to zero-day attacks (Daya et al., 2020). The author also observed
that the BotChase strategy that they implemented was suitable for large-scale data and
different network topologies. The authors in (Chowdhury et al., 2017) also proposed a bot
detection technique based on topological characteristics of nodes within a graph. The
authors administered a self-organizing map clustering method that was applied to establish
clusters of nodes in the network based on these characteristics.
Previous research has also proposed a method that can isolate nodes in clusters of small
size while containing the majority of the normal node in the same big cluster (Daya et al.,
2020). Furthermore, a Graph- based malware activity detection was introduced by this
6technique which makes use of a sequence of DNS queries in order to achieve robustness
against evasion techniques (Lee & Lee, 2014).
While Graph-Based detection can be applied without knowledge of a specific language a
major challenge is the availability of information that captures the complete topology of
the network. The best bot detection technique that applies Graph- Based Social Bot
Detection uses a hybrid analysis of flow-based and Graph- based traffic behaviors (W.
Wang et al., 2020). The authors argued that only using graph-based analysis would result
in false negatives or false positives or can even be eluded by malicious bots (W. Wang et
al., 2020). To address the limitation with graph-based analysis they proposed another
model known as BotMark that uses a hybrid analysis of flow –based and graph-based
network traffic behaviors (W. Wang et al., 2020). The authors technique was able to
characterize the botnets actions thoroughly as compared to other techniques. (W. Wang et
al., 2020) report that one limitation with BotMark is that Botnets can use a legitimate server
as their C&C communication to avoid detection. Since this paper will not be investigating
network communication patterns between nodes, this study will not adopt this technique to
detect malicious Twitter accounts.
1.3.2 Crowdsourcing Social Bot Detection
Wang et.al (2020) looked at the possibility of bot detection by humans. The authors
recommended crowdsourcing of social bot detection to multitudes of workers. An online
Social Turing test platform was created to see if humans can easily detect bot through the
evaluation of conversational nuances like sarcasm or perspective language or to look at
developing patterns and irregularities. The abilities of individuals were tested using data
7obtained from Facebook and Renren which is an online Chinese social networking
platform. The authors observed that the detection accuracy of both “experts” and “turkers”
under various conditions vary tremendously in their effectiveness with experts consistently
producing near perfect results. Though a great technique, crowdsourcing bot detection
method has its drawbacks and might not be cost effective to help achieve the listed
objectives and answer the research questions that this paper seeks to address.
1.3.3 Feature-based Social Bot Detection
Feature-based Social Bot Detection focuses on behavioral patterns that can be easily
encoded in features and adopted with machine learning strategies to observe the patterns
of human-like and bot-like behaviors (Ferrara et al., 2016.). Feature-based Social Bots
Detection makes it easier to categorize accounts based on their detected behaviors (Ferrara
et al., 2016).
The first social bot detection interface for Twitter in 2014 was made public to educate
individuals on online information platforms about the presence of malicious bot activities
(Ferrara et al., 2016). The authors proposed a bot detection algorithm that uses predictive
features that detect a variety of malicious behaviors to deduce if information was created
by a bot or human. A collection of networks, linguistic and application-oriented variables
are used as likely features that associate certain characteristics to humans or bots (Ferrara
et al., 2016). The challenge with using Feature-based bot detection is finding ground truth
dataset that can be used as a training set to classify an unlabeled dataset. Another challenge
is that the characteristics of a bot is increasingly becoming more humanlike so relying on
only user account features may lead to incorrect classifications.
8Chapter 2 Objectives of the study
2.1 Overview
The main objective of this present study is to contribute to an understanding of how
social media bots spread misleading information on online information platforms and
to find out if the spread of misinformation during the Coronavirus (COVID-19)
pandemic era was done by activities of Bots or other individuals/organizations using
hybrid approach that incorporates sentiment features, national language processing and
social networking features to detect bots. The two main objectives for this research are
to:
1. Identify twitter features that provide high discrimination quality for detecting bots
2. Investigate the spread of misinformation by bots during the initial months of the
COVID-19 pandemic
Prior research indicates that the user metadata and user content provide the greatest
discrimination accuracy (Shin et al., 2012). However, details on the specific features
within each category are not reported. To optimize the performance of the classifier,
optimal features within each category will be identified. Also, there is a discrepancy in
prior research regarding the quality of network features. While user meta-data and user
content have shown to perform the best (Shin et al., 2012), other studies suggest network
features provided the highest accuracy for detecting content polluters (Dhital & Gonen,
2019). We aim to use a hybrid approach that incorporates user account features and
sentiment features to detect malicious bot in Twitter.
93. To identify the source (bot or human account) responsible for spreading
misinformation during the Coronavirus (COVID-19) pandemic era.
2.2 Problem Statement
Many studies have been conducted on social media bots to examine how to detect them
and how these bots spread misinformation in online information platforms. Prior research
reviewed techniques that can be used to fabricate misinformation by combining social bots
and fake news to spread misinformation in a social setting (Daya et al.,2019; Wang et. al
in 2018). (Eslahi et.al in 2012), studied the characteristics of the malicious activities of
Bots and Botnets and came up with various detection techniques as well the challenges that
accompanied those techniques. (Shao et al., 2018) studied how social bots spreads fake
news by analyzing 14 million messages that were spreading 400 thousand claims during
the 2016 US presidential elections. The study concluded that social bots played a key role
in the spread of fake news during that time. Another study used a dataset with 3.6 million
tweets with a casual model and observed that about 23.6% of those tweets that were
examined were spreading hate speech by dividing public views on issues concerning Brexit
or the Catalan referendum (Rosso, 2019).
(Ferrara et al., 2016) studied the rise of social bots and its impact on several online
information platforms. Every aspect of our society is impacted heavily by social media
today as it allows users to interconnect and exchange content freely (P. Wang et al., 2018).
(Shin et al., 2012) among others also used a technique known as EFFORT to efficiently
and effectively detect Bot Malware. (Shin et al., 2012) report that EFFORT can detect all
15 real world bots related to their study.
10Recently, as of August 2020, there has been ongoing research about how social media bots
are spreading misleading content about the novel Coronavirus (COVID-19) pandemic. The
authors in (Varol et al., 2017; Rosso, 2019; Shao et al., 2018; Daya et al., 2019; Kudugunta
& Ferrara, 2018) among others have studied the impact of malicious social bots and ways
malicious social bots can be detected or prevented. However, researchers are yet to come
up with a conclusion about what interest/entity may be primarily responsible for the bots.
Although several techniques to detect malicious social bots have been created, there still
remain issues when it comes distinguishing between social bots and human bots that spread
misinformation. Since manual bot detection is infeasible, this study will develop a novel
automated method to identify bots. While many automated methods have been proposed
they have mainly been driven by features available in Twitter and apply single method
approaches based on application specific features (Wang et al., 2019; Shin et al., 2012;
Dhital & Gonen, 2019). To accomplish this task a hybrid approach that combines a variety
of factors to detect bots will be developed. Specifically, the proposed bot detection model
will incorporate user account features, topic analysis and sentiment analysis. It is also our
objective to test different user account features to see which feature or set of features
produces the best classification accuracy. (Varol et al., 2017) for example achieved the best
classification performance by using two user account features i.e., follower count and
friend count while (Wijeratne et al., 2017) observed that favorite count, tweet count and
friend count are top three features that produced the best classification accuracy in their
research. We aim to use, test and rank all Twitter user account features available in our
Covid-19 Twitter dataset to observe their prediction and classification accuracy. The
context for the study of misinformation is Coronavirus (COVID-19) data on social media.
11This research will develop a model to identify bots and provide insights for organizations
or entities who have interest in controlling these bots that have spread of misinformation
during the Coronavirus (COVID-19) pandemic era.
2.3 Hybrid Approach
This research proposes a hybrid method that integrates Twitter user account features,
sentiments features and topic analysis, to detect malicious social bots. A hybrid approach
is a way of combining multiple approaches to improve detection accuracy (Ferrara et al.,
2016). Wang et. al in 2018 developed a practical system using a server-side clickstream
technique that showed effectiveness and high detection accuracy in detecting fake
identities. This present study will rely on a similar approach conducted in prior research
to detect bots by analyzing topical content (Morstatter et al., 2016). In a prior study it was
observed that the content posted by bots can be a solid indicator that can help detect them
(Morstatter et al., 2016). The authors used Latent Dirichlet Allocation (LDA) to attain
topic representation of each user. However, the issue with using content for bot detection
is that the nature of the text features is sparse and have high dimensionality (Morstatter et
al., 2016).
Based on the review of prior bot detection studies, while many bot detection methods have
been proposed, the feature-based detection appears to be most promising method and is
therefore the focus of this research. This research will investigate new features and features
that have been underexplored in previous studies. Many studies have examined bot
detection accuracy using specific Twitter user account features (Lee, Eoff, and Caverlee,
2011). We aim to use, test and rank all Twitter user account features and analyze their
12prediction and classification accuracy compared to features from a previous study (Lee,
Eoff, and Caverlee, 2011). In this paper, we investigate the following three features: (1)
topic distribution, (2) listed count, and (3) favorite count. These three user account features
have been rarely used in prior research. Topic distribution on Twitter has to do with the
variety of sentiments expressed by users on any given issue. listed count is a curated group
of Twitter accounts, and favorite count is the number of accounts a Twitter user has
favorited.
13Chapter 3 Methodology
This is an empirical based research that uses several datasets with three experiments to
detect bots and bot generated content. We start by generating a Twitter dataset associated
with the novel coronavirus COVID-19 in a three-month period between January 22, 2020
to April 23, 2020. The Twitter’s search API is used to hydrate tweets from multiple
countries in various languages that contained any word associated with COVID-19 (i.e.,
ncov19, corona, covid, covid-19, virus, coronavirus, ncov2019) that were used in (Lopez
et al., 2020). In order to stick to Twitter’s [Terms of service]
(https://developer.twitter.com/en/developer-terms/agreement-and-policy), only the Tweet
IDs of the Tweets collected are made available for non-commercial research use only.
The only keyword used hydrate tweets for the month of January was “Coronavirus” as
there was less talk of the pandemic at that time. As news about the Coronavirus spread,
additional keywords were added to the search list.
Month Keyword(s)
January Coronavirus, virus
February Coronavirus, virus ncov19,
ncov2019
March coronavirus, virus, covid,
ncov19, ncov2019
April coronavirus, virus, covid,
ncov19, ncov2019
Table 3.1: Shows the various months and the keyword used to hydrate the tweets.
The keywords, presented in Table 3.1, used for search tweets are: virus and coronavirus
since 22 January, ncov19 and ncov2019 since 26 February, Coronavirus, virus, ncov19,
ncov2019 since 7 March 2020 and all keywords were used to hydrate tweets for the month
of April. A total of 71,908 tweets were sampled out of 115,000 tweets across the four-
14month period that this paper focused on. Since there was a disproportionate amount of data
collected in January compared to other months this data was excluded from the analysis.
Moreover, twitter API can provide tweets up to 7 days so we ensured that there was a lag
of 7 days in the dataset to make sure enough tweets were hydrated. It is worth noting that
our dataset does not capture every tweet on twitter related to the Covid-19 keywords used
for hydration due to Twitter’s limits on how much tweets can be hydrated every 15 minutes.
However, it is also worth noting that there were some inconsistencies in our data collection
process. For example, only tweets in English were hydrated from 22 January to 31 January,
2020, after this brief period we found an algorithm that could collect tweets in all
languages. Our data collection technique could also track other keywords unrelated to
Covid-19 which resulted in fewer tweets relating to Coronavirus in our dataset in the first
few weeks.
3.1 Datasets
Obtaining a social bot dataset can be cumbersome due to the challenge in obtaining
conclusive ground truth (Morstatter et al., 2016). Two labeled datasets are used for ground
truth and serve as the training datasets: social honeypot and RTbust. The trained datasets
are used to detect bots with three test datasets (1) Fame for sale, (2) BotWikiCelebrity, and
(3) COVID-19. The classes for the Fame for sale and BotWikiCelebrity datasets are known
and the trained datasets are used to evaluate classification accuracy against data where the
classes are known. The COVID-19 data is unlabeled. While several ways to detect bots
have been put forward, we use two approaches to label Twitter users as bots or humans:
(1) social account features and (2) sentiment features. To train and test our model, we
15selected five (5) datasets of verified human and bot account from Bot Repository
(https://botometer.osome.iu.edu/bot-repository/datasets.html). We use Weka machine
learning tool to test for prediction accuracy to help select the best labelled dataset that can
be used as a training set for classification in this paper. The nature of the datasets and how
we collected the five (5) datasets have been summarized below:
3.1.1Training Dataset
3.1.1.1 The Social Honeypot Dataset
We use the Social Honeypot dataset as a training set in this paper. We chose the social
honeypot dataset because of its high prediction accuracy i.e., 99%. (Lee, Eoff, and
Caverlee, 2011) created a honeypot that could attract content polluters in Twitter. (Lee,
Eoff, and Caverlee, 2011) generated and deployed 60 social honeypot accounts in Twitter
whose function was to act like Twitter users and report what accounts follow or otherwise
communicate with them. (Lee, Eoff, and Caverlee, 2011) manipulated how frequent the
honeypot account post and the sort of content that these accounts post on Twitter. The
author’s manipulation system ran from December 30, 2009 to August 2, 2010 and a total
of 22,223 polluters and 19,276 legit users were detected from 5,643,297 tweets. (Lee, Eoff,
and Caverlee, 2011) created a wide variety of user account features that were a part of one
of four groups:
• UD screen name length, description length, account age
• UFN following count, follower count, the ratio of the number of following and the
number of followers, bidirectional friend’s percentage
• UC statuses count per day
16• UH following change rate
(Lee, Eoff, and Caverlee, 2011) tested 30 classification algorithms using Weka machine
learning toolkit on five user account features ( i.e., screen name length, description length,
followers count, following count, and statuses count) and found their results consistent with
accuracy ranging between 98% to 95%. (Lee, Eoff, and Caverlee, 2011) used these five
categories of features as these features produced the highest accuracy results in their
experiment. Table 3.2 shows a breakdown of content polluters and legit users that was
detected by the manipulation model built by (Lee, Eoff, and Caverlee, 2011).
Class User Profiles Tweets
Polluters 22,223 2,380,059
Legit Users 19,276 3,263,238
Table 3.2: Social Honeypot Dataset.
3.1.1.2 RTbust Dataset
We use the RTbust dataset as our second training set in this paper. With a prediction
accuracy of 100%, (Mazza et al., 2019) had access to all Twitter metadata fields for each
tweet, retweet and user in their dataset. To collect this dataset, the authors used Twitter
Premium Search API to build a complete dataset using the following query parameters:
lang: IT and is: retweet. The authors carried out a manual annotation of a small subset of
the dataset to see the extent to which their technique was capable of correctly spotting bots
and ended up with an almost balanced annotated dataset, comprising of 51% bots and 49%
human accounts. The authors dataset consists of Italian tweets shared in a 2-week period
specifically between 17 and 30 June, 2018. The authors dataset consisted of 9,989,819
17retweets, shared by 1,446,250 different users. (Mazza et al., 2019) observed that on an
average each user in their dataset retweeted about 7 times per day which was in line with
current statistics that reported daily retweets between 2 to 50 for legitimate users. (Mazza
et al., 2019) argue that although their dataset is mainly Italian, the analytical approach and
the data collection process is strictly language independent. We use all 14,640,084 tweets
from 1000 annotated accounts from the RTbust dataset in this paper.
3.2 Test Datasets
3.2.1 Fame for sale Dataset
The fame for sale: Efficient Detection of fake Twitter followers on twitter was used as a
testing dataset in this paper. (Cresci et al., 2015) set up a project to recruit Twitter users to
voluntarily join an academic study for discovering fake followers on Twitter. This initiative
was set up by (Cresci et al., 2015) to create a dataset of verified human accounts on Twitter.
(Cresci et al., 2015) launched a verification phase on the 574 human accounts and named
this initiative as the “the fake project” dataset. The #elezioni2013 (E13) was also created
by (Cresci et al., 2015) and it is made up of active Italian Twitter users, with different
professional profiles and belong to assorted social classes.
To create their bot dataset, (Cresci et al., 2015) purchased 3000 fake accounts in April,
2013 from different Twitter online markets. To be specific, the authors purchased 1000
fake accounts from http://fastfollowerz.com, 1000 from https://intertwitter.com and 1000
fake accounts from http://twittertechnology.com. To create our legitimate user dataset, we
sampled 235 out of 574 human accounts from “thefakeproject” (TFP) and 964 out of 1488
from the #elezioni2013(E13) verified human dataset. We created our bot dataset by
18selecting all 1335 fake followers from the “intertwitter” (INT) dataset. Therefore, a total
of 1199 legitimate accounts and 1335 fake accounts were used for the test dataset. The
account details for the test dataset as well as the number of followers and friends are
provided in Table 3.3
Dataset Accounts Followers Friends
TFP (@TheFakeProject 235 183,166 152,664
E13 (#elezioni2013) 964 797,432 420,450
INT (intertwitter) 1335 22,518 517,100
Human Dataset 1199 980,598 573114
Bot Dataset 1335 22,518 517,100
Testing Dataset 2534 1,003,116 1,090,214
Table 3.3: Shows statistics about total collected data for testing.
3.2.2 BotwikiCelebrity Dataset
The performance of the social honeypot dataset was not encouraging so we created the
BotwikiCelebrity dataset as another test dataset to see if the classification framework from
the social honeypot dataset can accurately distinguish between what is a human and what
is a bot. We performed a cross-dataset analysis by using uploaded bot dataset on Bot
Repository to create our final testing dataset. To create our final testing dataset, we merged
the Self-identified bots (botwiki-verified) dataset from (Yang et al., 2020) and Celebrity
account collected as authentic users (celebrity) dataset from (Onur et al., 2019) to create a
new testing dataset. One way to analyze different labeled dataset is to look at the datasets
in feature space (Yang et al., 2020). Visualizing the two datasets together was difficult as
there were too many data points so instead we sampled 500 out of 699 verified bots from
19the botwiki dataset and 500 out of 20,984 verified human accounts from the celebrity
dataset to create a balanced dataset.
3.2.3 COVID-19 Dataset
Using Twitter’s API, we hydrated tweets relating to Covid-19 from January to April to
build the Covid-19 dataset. To quantify text and make sure certain characters are not
counted, we removed characters such as (;, :, *. ‘’, ,|,\, {,[, spaces etc.) from the text
attribute. Using the user_attribute_string function we extracted the user attributes such as
user_id, description, friend count, follower count etc. from the user column to create a
total of 71,908 tweets out of 115,000 tweets that we collected from January to April.
Dataset Number of bots Number of humans Data points Account
Features
Social Honeypot 22,223 19,276 41,499 5
RTbust 190 209 399 8
Botwiki 698 0 698 8
Celebrity 0 5971 5971 8
Covid-19 Unlabeled Unlabeled 71,908 8
Table 3.4: Shows the datasets used for our experiment.
3.3 Hypotheses
To achieve the stated objectives in section 2.1, the following four hypotheses are
investigated:
H1: The spread of misinformation or disinformation by bots regarding content related to
COVID-19 will be higher than the spread of misinformation or disinformation by humans.
While it is known that bots spread low quality information on Twitter. (Shao et al., 2018),
20we do not attempt to distinguish between misinformation and disinformation. It is
therefore our objective to analyze the percentage of social media bots in our examined
Covid-19.
H2: The accuracy to detect misinformation by bots will be higher using twitter features
such as favorite count, listed count, and topic distribution as compared to social honeypot
features. In this paper, we propose three new features: (1) topic distribution, (2) listed count
and (3) favorite count.
These three user account features have been rarely used in prior research. Topic distribution
on Twitter has to do with the variety of sentiments expressed by users on any given issue.
Listed count is a curated group of Twitter accounts, and favorite count is the number of
accounts a Twitter user has favorited.
Most prior studies have relied on well-known Twitter user account features such as count,
friend count, Tweet count, name length, account age and description length. These features
are considered to be top features with the highest predictive power and few research studies
have investigated features such as listed count, favorite count, and screen name length as
they have a lower predictive power when it comes to distinguishing between a bot and a
human (Varol et al., 2017; A. H. Wang, 2010; Cresci et al., 2015; Lee, Eoff, and Caverlee,
2011). Favorite count, listed count and screen name length will be used in our training and
testing experiment to see how well they improve our classification algorithm.
H3: The distribution of different topics will be greater for humans compared to bots. We
expect humans to have a wider variety of topics expressed in Twitter as compared to bots.
21Our reasoning is that we think bots are much more likely to have a target or an agenda that
needs to be talked about to change the economic, political or social setting of an online
platform. Hashtags will be extracted from tweets text for all tweets hydrated between 1st
February, 2020 to 31st April 2020. Bot sentinel will be used to estimate hashtags with
emerging popularity to help us test our hypothesis 3.
H4: Detected bots will express more negative sentiments compared to humans.
The rationale behind this is that we believe bots are more likely to engage in creating
negative inflammatory content compared to humans (Stella, Ferrara, & De Domenico,
2018).
3.4 Experiments
We first aim to replicate the results found in (Cresci et al., 2015) and the merged
BotwikiCelebrity dataset by using the classification framework we build using the Social
Honeypot Dataset and the RTbust Dataset. Comparing the results obtained through the
experiment and the ones reported in (Cresci et al., 2015), (Yang et al., 2020) and (Onur et
al., 2019) will increase the level of confidence in the hybrid approach that this research will
rely on. To achieve this objective, this paper will test ten features (see Table 3.5) as seen
in (Cresci et al., 2015), (Yang et al., 2020) and (Onur et al., 2019).
22Twitter Attributes Description (1) (2) (3) (4)
Name Twitter defines “name” as the name of the user x x x
Listed count Curated group of Twitter accounts x x x
Favorite count The number of accounts a user has favorited x x x
Statuses count The number Tweets (including retweet) issued by a x x x
specific user
Sentiment Sentiments expressed on a given subject x x x x
User id User features based on Twitter meta-data x x x x
Screen name Handle or alias that a specific user identifies with x x x x
Follower count The total number of Twitter users that follow a x x x x
specific user
Friends count Total number of Twitter users that follow a specific x x x x
user
Description Length Total character count of a description in a user profile x x x x
Table 3.5: Shows the features that will be used in this study. Features that are not seen in the Social Honeypot
dataset are shaded in grey. New feature proposed shaded in light blue. Features that are seen in all the
datasets used in this study are are not shaded. Datasets: (1) = Fame for sale, (2) = Social Honeypot, (3) = Self-
identified bots, (4) = RTbust
These ten features are highly predictive and capture several suspicious behaviors which
make it easier to differentiate between a bot and a human account using a bot detection
algorithm (Ferrara et al., 2016). If the results demonstrate potential, this study will
implement a new method to detect social bots by using a hybrid approach that incorporates
sentiment features
23and user account features. The new approach that this study seeks to implement will then
be tested on the COVID-19 dataset of millions of tweets between February, 2020 and April,
2020. We explain how we conducted our experiments in subsections 3.4.1 – 3.4.4.
3.4.1 Experiment I
We use the Social Honeypot Dataset and the RTbust dataset as our baseline dataset in our
first experiment. Using Weka machine learning tool (Witten et al., 2005), we followed the
same classification framework used by the authors in (Lee, Eoff, and Caverlee, 2011) and
(Mazza et al., 2019) to see what the dataset’s prediction accuracy is. We tested 20
classification algorithms, such as random forest, naive Bayes, logistic regression and tree-
based algorithm, all with default values for all parameters using 10-fold cross validation.
10-fold cross validation is a way of dividing the original data into 10 equally-sized sub-
samples, and executing 10 training and validation procedures (Lee, Eoff, and Caverlee,
2011).
3.4.2 Experiment II
In experiment II, we take the best training dataset from Experiment I to classify the Fame
for sale dataset. The social honeypot dataset or the RTbust dataset would be supplied as a
training set for the Fame for sale dataset. We test for accuracy by replacing the class labels
in the Fame for sale dataset with questions marks (?). Using Weka machine learning tool
(Witten et al., 2005), we try to replicate the results found in the Fame for sale dataset by
using our training datasets from experiment I. If the prediction results are not encouraging,
we aim to do a cross data analysis on Bot Repository to create a final testing dataset.
243.4.3 Experiment III
Results from Experiment II will show which training dataset will be used for our unlabeled
Covid-19 dataset in Experiment III. We aim to classify the unlabeled Covid-19 dataset with
the best classification framework from Experiment II. An independent data analysis would
be done by randomly comparing 7000 detected tweets from bots and 14,000 detected
tweets from humans out of a total of 39,091 tweets to understand the sort of misinformation
or information that were being amplified between February and April. We intend to achieve
this by using an online sentiment tool known as Bot Sentinel. A fact checking tool known
as Poynter would also be used to check for misinformation in Experiment III.
3.4.4 Experimental Steps
Initially, the plan for this research was to study and collect data on Twitter users that were
actively posting Covid-19 tweets overtime but that was time consuming and very expensive
to achieve. We therefore rely on a dataset that we collected from January to April to test
the new approach that we propose for this paper. However, based on pilot studies we
conducted it was determined that tweet length and sentiment expressed over time was the
most accurate method for distinguishing a bot from a human. As a result, we relied on
daily tweet length plus all other user account features to improve the accuracy of our
results.
Additionally, there are other user account features such as location, verified, protected,
default profile image among others were discarded as there was little to no information to
collect for these features. To deliver accurate results, this study will try to duplicate the
results found in (Cresci et al., 2015); (Onur et al., 2019) and (Yang et al., 2020) by using
25You can also read