Review of Biometeorology of Heatwaves and Warm Extremes in Europe
←
→
Page content transcription
If your browser does not render page correctly, please read the page content below
atmosphere
Review
Review of Biometeorology of Heatwaves and Warm
Extremes in Europe
Biljana Basarin 1, *, Tin Lukić 1,2 and Andreas Matzarakis 3,4
 1   Department of Geography, Tourism and Hotel Management, Faculty of Sciences, University of Novi Sad,
     Trg Dositeja Obradovića 3, 21000 Novi Sad, Serbia; tin.lukic@dgt.uns.ac.rs
 2   Department of Geospatial Bases of Environment, Faculty of Geography, University of Belgrade,
     Studentski Trg 3/3, 11000 Belgrade, Serbia
 3   Research Centre Human Biometeorology, Deutscher Wetterdienst, Stefan-Meier-Str. 4, 79104 Freiburg,
     Germany; Andreas.Matzarakis@dwd.de
 4   Chair of Environmental Meteorology, Institute of Earth and Environmental Sciences, University of Freiburg,
     Werthmannstr. 10, 79085 Freiburg, Germany
 *   Correspondence: biljana.basarin@dgt.uns.ac.rs; Tel.: +381-63594236

 Received: 30 October 2020; Accepted: 24 November 2020; Published: 26 November 2020

 Abstract: Numerous extreme heatwaves producing large impacts on human health, agriculture,
 water resources, energy demand, regional economies, and forest ecosystems occurred during the first
 twenty years of the 21st century. The present study strives to provide a systematic review of recent
 studies of warm biometeorological extremes in Europe. The main aim of this paper is to provide a
 methodical summary of the observed changes in warm extremes, duration, and variability in different
 parts of Europe. During the last decade, much attention has been paid to the negative impacts of heat
 and humidity on human health. Therefore, the human biometeorology is required to appraise the
 human thermal environment in a way that human thermoregulation is taken into account. In many
 European countries and regions, future heat exposure will indeed exceed critical levels, and a steep
 increase in biometeorological heatwaves and warm extremes are expected. The indices that take
 into account human energy balance along with weather conditions should be used to examine the
 impacts of extreme heatwaves on human health and should be used as a basis for the determination
 of acclimatization to high-heat-stress conditions. A detailed description of recent studies that have
 used biometeorological indices such as Physiological Equivalent Temperature (PET) and Universal
 Thermal Climate Index (UTCI) for the estimation of warm extremes and their influence on human
 health is provided. Additionally, a short overview of the existence of the heat-health warning systems
 (HHWS), their conceptualization, and implementation across the European continent is considered,
 as well as the possibilities for further investigations and implementation of effective measures and
 programs that could reduce the adverse health impacts.

 Keywords: heat stress; biometeorological indices; heatwaves; HHWS; Europe

1. Introduction
     During the last 20 years, the magnitude and impact of heatwaves in Europe have increased
substantially, thus raising concerns not only in the European continent but worldwide. Many studies
have emphasized how important is the understanding of present changes, along with the prediction
of future occurrences. The first twenty years of the 21st century have witnessed numerous extreme
heatwaves producing large impacts on human health, agriculture, water resources, energy demand,
regional economies, and forest ecosystems [1–3]. Heatwaves have devastating impacts on different
systems and the first one to think of is the impact on human health. For example, during the most

Atmosphere 2020, 11, 1276; doi:10.3390/atmos11121276                          www.mdpi.com/journal/atmosphere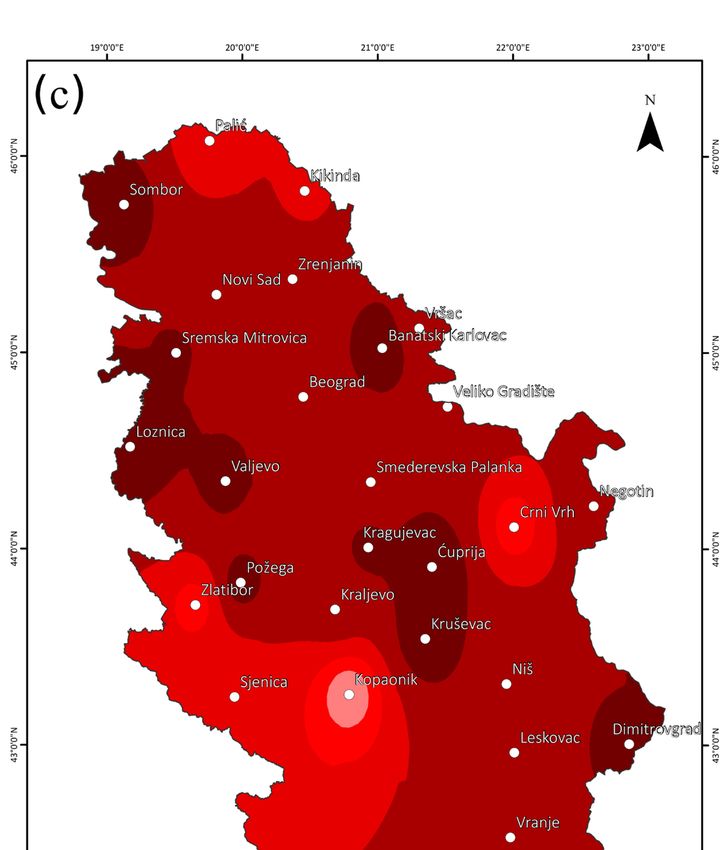
Atmosphere 2020, 11, 1276                                                                           2 of 21

intensive heatwaves of 2003 over Western Europe and 2010 over Russia more than 100,000 people
died [4,5]. During these periods, 500 year long temperature records were broken over roughly 50%
of European territory [6,7]. During the heatwave in 2003, France, Germany, Switzerland, Portugal,
and the UK experienced the highest daily maximum temperatures [8–14]. In general, the recorded
temperature anomalies were as high as 8 ◦ C compared to the base period 1961–1990 [4].
      Another heatwave hit Southeastern Europe, the Balkan Peninsula, and also part of Asia Minor in
summer 2007 [15–18]. The extraordinary warm conditions were the primary cause for numerous excess
deaths in several countries (Hungary, Romania, Bulgaria, Serbia, etc.) and caused problems in energy
supply [17]. The 2010 Russian heatwave, due to its intensity, spatial extent, and duration was named
mega-heatwave [1,19]. The heatwave persisted for more than 30 days, and 54,000 people died from
heat exposure. The comparison between heatwaves in 2003 and 2010 showed that the latter was more
extreme due to high-temperature anomalies as well as the area affected. The summer temperatures in
2010 were on average higher for 0.2 ◦ C in Europe than in 2003. The area affected by extreme conditions
was estimated to be larger than two million km2 , and the extreme temperatures lasted between 15- and
61-day averages [19]. The heatwave in August 2015 in Poland was characterized as a mega-heatwave,
and it was defined as an event with at least 6 consecutive days when maximum air temperatures are
above 30 ◦ C with no more than 1 day declining below the established threshold from the beginning
until the end of the extreme event. The authors stated that during the last 50 years, the frequency of
mega-heatwaves is increasing [20,21].
      Heatwaves have been given the name the “silent killers” [22] since they do not have an
instantaneous effect on human health. Primary medical conditions are worsened when people
are exposed to heatwaves for a longer period. Thus, these extreme weather conditions mainly affect the
elderly, the young, and those that work outside. As it gets older the body’s hydration and temperature
regulations are at high risk of not working properly. Additionally, young children and infants cannot
articulate when they feel hot or thirsty so they do need special attention during hot weather. Similarly,
some diseases lead to the body’s inability to cope with extreme heat, such as heart disease, diabetes,
renal disease, and multiple sclerosis. Consequently, in these conditions, the body is disabled to function
as it should and the body core temperature continues to rise. Sweating as a primal cooling mechanism
cannot cool down the body and the risk of heatstroke—a serious medical condition that can result in
organ failure and even death becomes incredibly high [22,23].
      Since the human body can respond to environmental conditions and acclimatize to them, it is
necessary to evaluate certain extreme events related to human sensation. Consequently, a complex
approach to assessing an extreme climate event such as a heatwave must include a combination of
weather elements that are related to the human sensation of heat [23–25]. In the present literature, there
is a myriad of biometeorological indices [26,27] as well as the methods used to estimate the severity and
intensity of individual extreme weather events [28]. As pointed out by Russo et al. [1], some heatwave
indices use a fixed threshold of 5 ◦ C above climatology, while others are based on a percentile-based
threshold (Warm Spell Duration Index, Heat Wave Magnitude Index daily). For biometeorological
heatwaves, some authors (e.g., [29]) used a fixed threshold of 35 ◦ C for Physiological Equivalent
Temperature (PET), while others (e.g., [25,30]) used percentile-based thresholds and applied the
methodology of the Expert Team on Climate Change Detection and Indices (ETCCDI). Even though
there is a necessity for using a unique index in studying the biometeorology of heatwaves, the methods
for their identification and a unique definition are lacking. However, the common ground for all of
them is that they are prolonged periods where temperatures are greatly higher than the previously
defined normal. Modern studies employ the methods where the heatwave is defined as a prolonged
event of more than three consecutive days, when air temperature exceeds a particular threshold.
The most common threshold is above the upper tail of temperature distribution (90th or 95th percentile).
The advantage of using a relative-based threshold over fixed ones is in the fact that their identification
and measurements are possible across every location [28].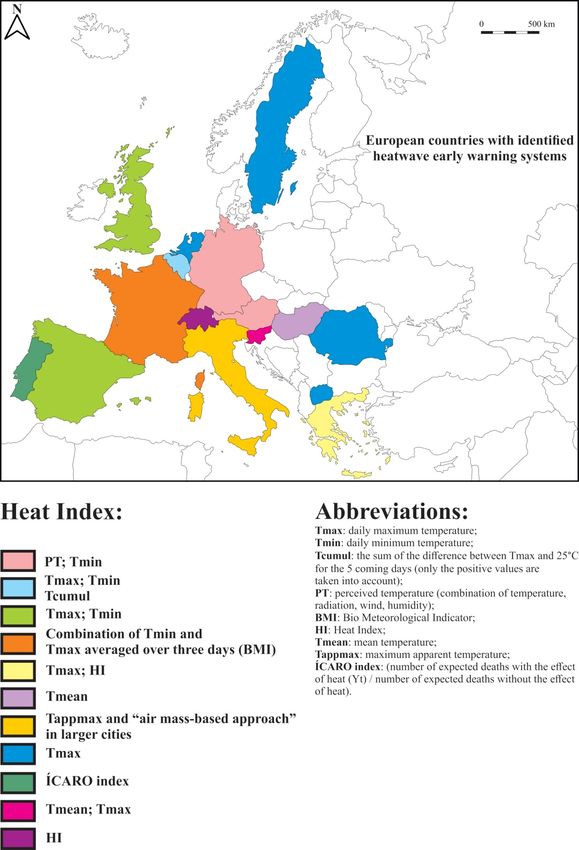
Atmosphere 2020, 11, 1276                                                                           3 of 21

      For biometeorological studies of heatwaves, it is of great importance to use a consistent framework
for their identification and measuring as well as to use a biometeorological index that will be capable of
best describing the human sensation of heat. Hence, the scientific community needs to work together
to reach a consensus to diminish the overabundance of methods and indices used, plus to balance
them with many sectors affected.
      In this review, the current state of the scientific literature about bioclimatology of heatwaves
is given. The following sections are themed around: application of biometeorological indices in a
heatwave and studies of warm extremes in Europe; the short review of heat health warning systems in
Europe, and ascertaining the possible adaptation to observed changes.

2. Application of Biometeorological Indices in Heatwave Studies in Europe
      For more than 100 years, scientists have tried to develop thermal climate indices that will be able
to tackle the complex problem of body-atmosphere heat exchange [26,27]. According to Parsons [31],
thermal stress indices are divided into three categories based on their underlying principle. Indices
based on heat balance equations are called rational indices and the calculations involve the heat balance
equations. The second group is empirical indices, which are based on establishing equations from the
physiological responses of human subjects. The third group of indices is direct indices that are based
on direct measurements.
      The indices from all three categories have been used to identify and measure heatwaves but only
the widely used will be discussed further.
      During the last decade, much attention has been paid to the negative impacts of heat and
humidity on human health. The effect of so-called humid heatwaves is seen to extend beyond direct
health outcomes to include large-scale economic impacts [19,24,32]. High relative humidity even
with air temperatures lower than the optimum body core temperature (the human body will strive
to keep a core temperature of about 37.5 ◦ C) could lead to heat stress. When relative humidity
increases, the temperatures do not need to be very high to induce heat stress and lead to mortality
events [33]. Thus, some indices that take both temperature and humidity into consideration have
recently been used to characterize and study heatwaves. The widely used are HUMIDEX, an index
that combines air temperature and water vapor pressure [34,35], the Heat Index (HI) [24] Apparent
Temperature (AT) [19,36], and Wet-Bulb Globe Temperature (WBGT) [23,37,38] and just recently Wet
Bulb Temperature [24].
      It has to be noted that previous works on environmental heat stress were developed with a
global perspective [23,24,37,39–41] mainly focusing on densely populated areas (e.g., South-East Asia,
Africa), but the detailed impact studies in Europe are scarce. Generally, the trends in heat humidity
indices show a steeper increase than the air temperature and significant increases in the number
of threshold exceedances over the latter half of the twentieth century [39,42]. Quantifying thermal
comfort in 15 different regions around the world using WBGT, Willett and Sherwood [37] showed that
positive historical trends (1973–2003) are present. Over the last four decades, WBGT increased along
with the temperature. The model they presented indicates the increase in WBGT in all investigated
regions except Southern Australia. For Europe, they showed that under the A1B scenario, both the
temperature and WBGT will significantly increase leading to more pronounced heat extremes. Similarly,
Casanueva et al. [43,44] indicated that heat stress levels shown with WBGT will amplify occupational
risks in Europe in the future. They showed that daily summer maximum WBGT will increase by 1 to
4 ◦ C by the end of the twenty-first century concerning the historical reference period. Additionally,
changes in WBGT values across Europe will be more uniform than changes in air temperatures, but the
increase in WBGT in Southern Europe and the Mediterranean will be less pronounced since the changes
in relative humidity (RH) are projected to decrease. The overall conclusion of the study is that in the
future the regions in Europe most affected by the changes in WBGT will be the ones that already have
the same problems [44].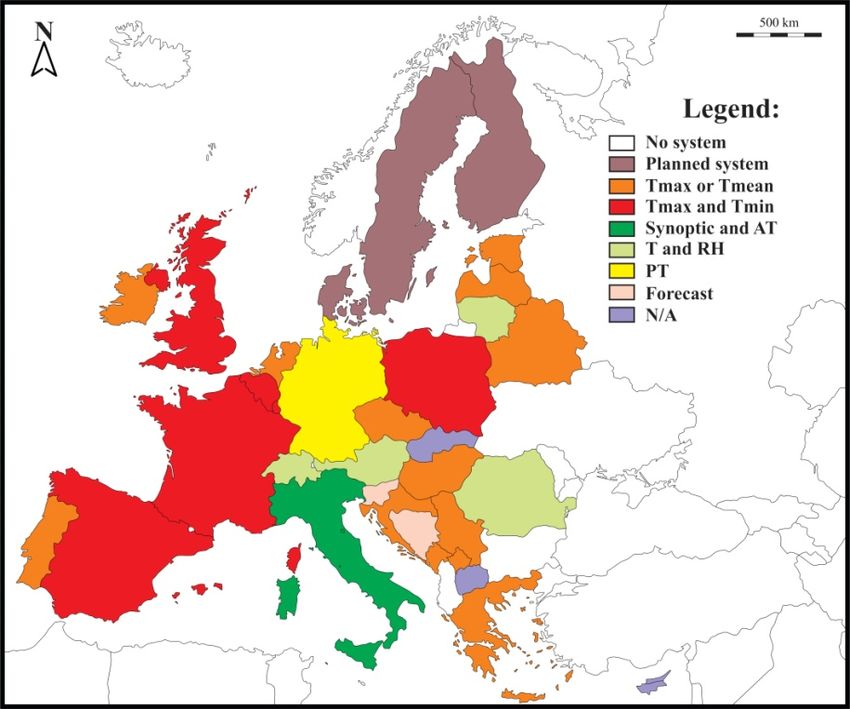
Atmosphere 2020, 11, 1276                                                                            4 of 21

     In addition to WBGT, recent studies employed standard wet bulb temperature (Tw ) to characterize
the dangerous combination of high temperature and humidity. The studies showed that even with
wet-bulb temperatures between 29 and 31 ◦ C during heatwaves, tens of thousands of deaths occur [40].
Additionally, physical labor becomes dangerous when the wet-bulb temperature reaches values
above 35 ◦ C, because when the body cannot be cooled by evapotranspiration and it accumulates
heat. Thus, the value of 35 ◦ C is considered to be the upper threshold of human tolerance to
heat [38,40,45]. Mega heatwaves of 2003 and 2010 in Europe and Russia produced wet-bulb temperatures
of approximately 28 ◦ C [23]. Wet-bulb temperatures above 30 ◦ C have been reported in scientific studies
only several times although not in Europe but in Eastern Coastal India, Pakistan and Northwestern
India, and the shores of the Red Sea, Gulf of California, and Southern Gulf of Mexico [23,46]. Generally,
even under present global atmospheric conditions, high temperatures along with high humidity caused
the death of many people in the 2015 heatwaves in India and Pakistan. It was estimated that more than
2500 excess deaths happen during the Indian heatwave with at least 700 in the megacity of Karachi and
plenty more throughout the country [47]. Russo et al. [19] introduced the category of humid heatwaves
and defined it as a heatwave with at least one of its days with Apparent Temperature (AT) higher than
maximum daily temperatures. They used the newly developed Apparent Heat Wave Index (AHWI),
calculated equivalently to the Heat Wave Magnitude Index daily (HWMId) [19]. The quantified humid
heatwave showed that its magnitude and peak temperature have been amplified by higher relative
humidity. Relative humidity has greatly augmented the heatwave magnitudes in some key regions
during the last 40 years, such as the Midwestern and Eastern US, China, Northern Latin America, and
Malaysia. The occurrence of dangerously intensive humid heatwaves is concentrated mainly in the
regions where hot and humid air is being advected from surrounding water bodies such as tropical
regions [19]. The apparent temperatures during most intensive heatwaves in Europe in 2003 and 2010
did not differ significantly from maximum air temperatures, and those heatwaves were not considered
humid, such as the one that occurred in Shanghai in 2003 where high relative humidity played an
important role in aggravating the negative impacts of the heatwave. Russo et al. [19] carried on their
analysis and discussed the future occurrence of humid heatwaves. They concluded that at 1.5 ◦ C
and 2 ◦ C global warming, the magnitude of humid heatwaves in densely populated areas is going to
reach the levels higher than during the mega heatwave in Russia in 2010. Furthermore, the AHWI
magnitude is going to be much higher than today’s maximum value, with the highest AT reaching the
levels beyond 55 ◦ C, at least once in two years at 4 ◦ C global warming.
     The number of global studies of heatwaves in light of combined temperature and humidity is
rising, but it is interesting to note that many studies are dealing with local or regional heatwaves from a
biometeorological point of view. Evaluation of the extreme heatwave of 2003 in Naples (Southern Italy)
was obtained using a HI. Historical discomfort conditions that affected the city from 1872 up to 2004
were evaluated using hourly meteorological data. The secular variation of HI over Naples during the
1872–2004 interval does not show any significant trend as well as the occurrence of extreme heatwaves,
such as those recorded in 1950 and 2003. HI values in the city of Naples (Southern Italy) showed
prolonged heat discomfort conditions during the second half of June 2003 and from the second half of
July 2003 up to the first week of September 2003, resulting in the highest mortality rate for persons aged
75 years or more. During the 2003 summer, the heat stress was persistent even during the night [48].
     Similarly, Unal et al. [49] used AT to define the heatwaves for the summer months (June–August)
of 1965–2006 in Western Turkey. The numbers of hot days, heatwaves, and heatwave duration have
increased during the observed period in the western part of Turkey. After 1998, the changes in extremes
were more frequently observed, and the rate of change was larger during the last decade of the observed
period. Analysis of regional distributions indicated a rising tendency of the number of heatwave
events towards the southern latitudes.
     The extreme heatwaves of 2003 and 2015 were analyzed for South-West Germany (Baden–
Württemberg) using HUMIDEX. The study showed that even though the 2003 heatwave was longer
and had higher maximum and minimum temperatures, the 2015 heatwave was amplified by higher air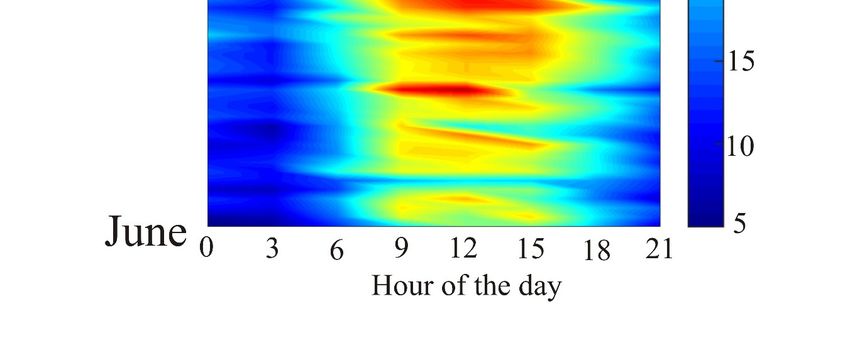
Atmosphere 2020, 11, 1276                                                                           5 of 21

humidity during day and night. The negative effects of these events were observed in higher excess
summer mortality than the reference period 1971–2000. Additionally, regional climate models were
used to investigate the future occurrences of heatwaves with similar characteristics as the ones in 2003
and 2015. The analysis showed that, under RCP4.5, even in the near future (2021–2050), a 2015-like
heatwave is likely to occur about every other summer. Furthermore, for the far future (2070–2099),
a distinct increase in heatwaves similar to 2015 is possible, with more than two per summer [35].
      Using HUMIDEX to evaluate thermal conditions during four exceptionally hot summers in large
cities in 1992, 1994, 2006, and 2010 and comparing them to mortality data concluded that excess
mortality was elevated. In the investigated sites, on the hottest days the number of deaths was more
than three times higher than for the reference period. The conclusions pointed out the dangers of
excess mortality in warming climate [50].
      Parsons [31] emphasized that six parameters for thermal stress estimation must be taken into
account. They include thermal climate factors consisting of air temperature, humidity, air velocity,
and heat radiation, and two individual factors that are comprised of metabolic rate and clothing. Thus,
the human biometeorology is required to appraise the human thermal environment in a way that
human thermoregulation is taken into account. Thus, in this way, it will produce and use the indices
intimately connected to human thermal perception, stress, and strain. Therefore, the thermoregulatory
models, as a mathematical representation of the human thermoregulation system, are required and
biometeorological indices based on those models are essential for estimating the human thermal
environment and stress. Staiger et al. [51] suggested the use of the Universal Thermal Climate
Index (UTCI), Perceived Temperature (PT), Physiological Equivalent Temperature (PET), and Effective
Temperature (ET). These indices should be used to examine the impacts of extreme heatwaves on
human health and should be used as a basis for the determination of acclimatization to high-heat-stress
conditions. Moreover, the indices should be recommended for use in future heat-health warning
systems (HHWS) as well as for the improvement of present systems across Europe.

2.1. Universal Thermal Climate Index
     Universal Thermal Climate Index (UTCI), developed by the European Cooperation in Science
and Technology (COST) European Cooperation in Scientific and Technical Research (COST 730),
represents an index based on human response-related thermo-physiological modelling with the help
of a multisegmental, multilayered representation of the human body [52,53]. This model was coupled
with a state-of-the-art clothing model that takes into consideration the behavioral adaptation of clothing
insulation by the general urban population in response to actual environmental temperature. UTCI
was derived conceptually as an equivalent temperature implying that for any combination of air
temperature, wind, radiation, and humidity (stress), this index can be defined as the isothermal air
temperature of the reference condition that would elicit the same dynamic response (strain) of the
physiological model [54,55]. This approach is useful for predicting human thermal and regulatory
responses in cold, cool, neutral, warm, and hot environments [52,53]. UTCI can be quantified using
software such as RayMan and BioKlima [56]. The UTCI uses limit values to categorized thermal stress
that ranges from “extreme cold stress” to “extreme heat stress” (Table 1) [57].
     A study of global forecasts of the UTCI provided an overview of health hazards related to
extremely high temperatures [58]. Predicting thermal hazards using UTCI is essential for developing
international HHWS and disaster preparedness. The applicability of the index for such purposes was
shown to be superior since the UTCI forecast could usefully predict the values for lead times up to
10 days [58]. The application of the UTCI to bioclimate research at a European scale was presented
by Błażejczyk et al. [59]. The paper presents thermo-physiological principles of UTCI through some
examples of its application to assess bioclimatic differentiation of Europe. A wide range of potential
applications was identified. Analysis of mean monthly values of UTCI for January and July in selected
European cities indicated that in both compared months the highest UTCI was observed for Athens
(Greece) and Valencia (Spain), while in Scandinavian cities (Stockholm and Helsinki) the UTCI had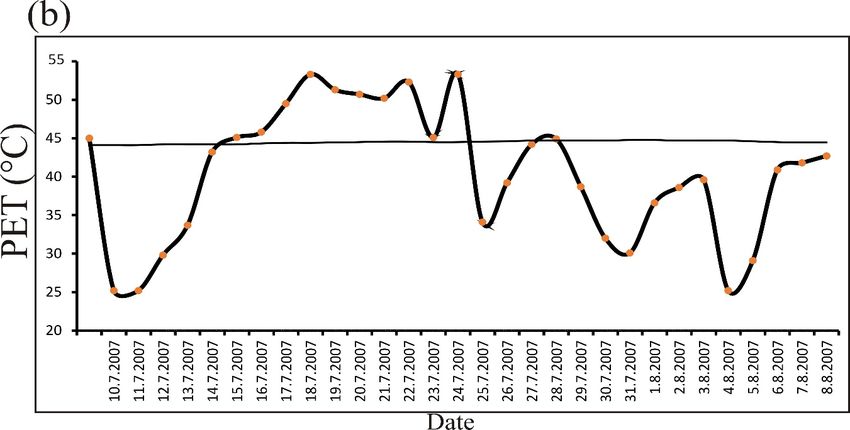
Atmosphere 2020, 11, 1276                                                                             6 of 21

the lowest values. Low values were also noted for Łódź (Poland) and London (UK). During summer,
strong heat stress was very frequently observed not only in the Mediterranean region but also in
Budapest, with exceptions such as Ljubljana and Barcelona. In the Scandinavian cities and the cities
under the frequent influence of maritime climate, the weak presence of strong heat stress was noted.
During winter, the influence of the arctic air masses is manifested by the frequent occurrence of strong
cold stress over Northern and Central Europe.

      Table 1. Universal Thermal Climate Index (UTCI) Assessment Scale: UTCI is categorized in terms of
      thermal stress [57].

                                  UTCI (◦ C)         Physiological Stress Level
                                    46.1             Extreme heat stress

     Jendritzky et al. [55] emphasized the necessity of the application of the UTCI thermal index
in bioclimate studies. As highlighted by the authors, the application of the UTCI is intended to
significantly enhance applications related to human health and wellbeing in the fields of public
weather services, public health systems, precautionary planning, and climate impact research.
Additionally, respective authors pointed out that utilization of the UTCI in the major fields of
human biometeorology is highly applicable and of great importance, thus making the index more
comparable and physiologically relevant.
     In Europe, there is an evident latitudinal gradient in heat stress occurrences during summer months,
and the UTCI values generally raise towards the south. This pattern, according to Di Napoli et al. [60],
reveals the general connection between heat load and insolation. The application of UTCI for evaluation
of heat stress and its effects on mortality was employed in numerous European countries [61–66].
However, the study on the pan European scale indicated that during the days with high UTCI values
equivalent to a high degree of heat stress, the number of deaths and emergency patients increased.
Additionally, the study of Di Napoli et al. [60] on the spatial extent of UTCI on the pan-European level
revealed that there has been an increase in heat stress of 1 ◦ C during the last 30 years. When they
correlated the values of UTCI with mortality data, they observed that the number of deaths increased
when UTCI values were higher than 26 and 32 ◦ C.

2.1.1. Southern and Southeastern Europe
     Nastos and Matzarakis [61] evaluated the grade of physiological stress and quantified the
association between the daily mortality and daily values of the UTCI for the Athens region for the
10 years 1992–2001. The study revealed that mortality is in close relation to air temperature and UTCI.
Additionally, statistically significant relationships on a given level (p < 0.01) are present between air
temperature, UTCI, and mortality.
     Assessment of bioclimatic conditions on Crete Island in Greece (Southern Europe) over 30 years
(1975–2004) indicated that the estimated UTCI thermal comfort class presents higher frequencies and
duration throughout the year compared to the respective PET classes, especially during the cold
months. The UTCI values of extreme/very strong/strong cold stress and very strong heat stress were not
observed for the majority of the analyzed stations excluding southern coastal stations, and displayed
increasing and decreasing trends of strong heat stress, respectively. The UTCI values of extreme/very
strong/strong cold stress and very strong heat stress (missing for the majority of the examined stations
with the exceptions) showed increasing and decreasing trends of strong heat stress. In the region of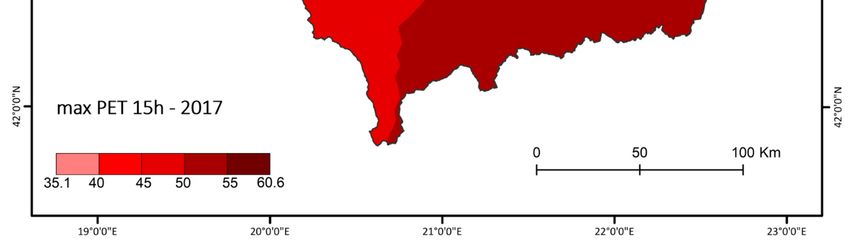
Atmosphere 2020, 11, 1276                                                                           7 of 21

Crete Island, the time series of the annual number of days with mean daily extreme values of UTCI,
as well as PET, did not present clear increasing or decreasing trends during the observed period [62].
      The Eastern Mediterranean climate “hot spot” was investigated concerning heat-related risk and
change in heat stress levels by Katavoutas and Founda [67]. They used the index that quantifies both the
intensity and duration of the heatwave event and realized that during a nearly 60-year period, a total
of 46 heatwaves occurred. The number of heat events was intensified after the late 1990s. Using the
UTCI and HUMIDEX, it was observed that there was at least one thermal stress category between the
extreme event and normal summer conditions. The striking results are connected to night-time heat
stress conditions in urban areas that were strongly enhanced during pronounced heatwave episodes.
      A different study by the same authors [68] that used simple (HI and HUMIDEX) and rational
indices (PET, UTCI) revealed that heat stress conditions have become more intense during the last two
decades. The 95th percentile of UTCI in the large urban area of the Eastern Mediterranean (Athens)
was enlarged by 2.4 ◦ C in the 2010s compared to the 1970s, which indicates the existence of extreme
heat stress. The extreme values of UTCI indicate a steep growth of the very strong heat stress season by
4.3 days/decade. Additionally, exposure times per year when very strong heat stress conditions prevail
are increasing by 0.3% per decade. For the last ten years, during night-time, the urban population has
been exposed to significantly higher heat stress than in previous periods. The results point out that
urban residents are under a noteworthy and increasing amount of heat stress.
      Morabito et al. [69] identified the most effective thermal predictors of heat-related very-elderly
mortality (people ≥75 years) for two cities located in different geographical contexts of central Italy.
Direct multivariate indices showed the highest correlations with the UTCI and were identified as
the best thermal predictors of heat-related mortality for both inland (Florence) and coastal (Livorno)
cities. Thus, the UTCI was never identified as the best thermal predictor for the given case studies.
Authors outlined that the use of direct multivariate indices (multivariate apparent temperature), which
also account for the extra effect of wind speed and/or solar radiation, displayed the best fitting with
all-cause, very-elderly mortality attributable to heat stress.
      Even though heatwaves in 2003 and 2010 draw much attention to Western Europe and Russia, it is
noteworthy to mention the particularly intensive heatwave of 2007 in South-East Europe. Pecelj et al. [70]
noted that UTCI values at 14 h were as high as 48.4 ◦ C in Novi Sad (Northern Serbia). The authors
stated that due to the changes in air temperatures and the frequency of occurrence of extreme heatwave
events, it can be expected that such high values of UTCI are likely to occur in the future.

2.1.2. Central and Western Europe
     Assessment of urban thermal stress by UTCI in Poland was performed by Blazejczyk et al. [71].
A new approach to the study of the spatial variability of heat stress in urban areas was presented
with the utilization of the UTCI. The spatial variability of UTCI at the local scale was studied using
examples of urban areas in Warsaw with different sizes and geographical locations. A very high and
significant heat stress gradient between downtown Warsaw and rural stations was observed.
     Variability of human-biometeorological conditions in Gdańsk (Poland) was presented by
Nidzgorska-Lencewicz [72]. The respective author investigated the characterization of temporal
and spatial variability of thermal and air quality conditions within the area of Gdańsk with the use of
UTCI and Common Air Quality Index (CAQI). Annually, the two UTCI classes that occur most often
are no thermal stress and moderate cold stress. Comfortable and favorable thermal conditions of the
city were observed during the warm half of the year (April–September). During the cold half of the
year, cold stress was pronounced from October–March.
     The analysis of UTCI variations for the 2015 and 2018 summer period was investigated and
compared with the reference period of 1971–2018 for the region of Lower Silesia (Poland). During the
most extreme heat events, the lowlands and the lower mountain zones experienced the highest heat
stress classes, while in the highlands, “no thermal stress” classes existed [73].
Atmosphere 2020, 11, 1276 8 of 21
Tomczyk and Owczarek [74] conducted a contemporary analysis of the occurrence of extreme heat
stress in Poland using UTCI. The UTCI values were calculated based on daily data for 40 meteorological
stations for the period 1966–2015.They used the UTCI values above 32 ◦ C to characterize the extreme
stress of humans. It is interesting to note that a statistically significant increase of 50% of the analyzed
stations was observed, while at the other 50%, the tendency of a rising or no changes was detected.
A major part of Poland’s territory was affected by conditions very strenuous for the organism with
UTCI values higher than 40 ◦ C after 1990. Similar changes in extreme values of UTCI were observed
in regional studies in Poland [75], but also in other European countries—e.g., Hungary [76] or
Romania [77], Serbia [70].
Future changes in human-biometeorological index classes for three regions of Luxembourg
(Western-Central Europe) were investigated by Lokys et al. [78]. Assessment of the impact of climate
change on human thermal comfort over the next century was performed with the usage of two
human-biometeorological indices, PET, and UTCI for the period 1971–2098. The data used are from
a multimodel ensemble of 12 Regional Climate Models and single Regional Climate Models (RCM)
run with a spatial resolution of 1.3 km. The results of the study pointed out that cold stress levels will
decrease significantly in the near future up to 2050, while the increase in heat stress turns statistically
significant in the far future up to 2100. The result indicates the presence of a temporarily reduced
overall thermal stress level. On the other hand, further increasing air temperatures will shift the
thermal comfort towards the heat stress category. Additionally, for the future period in Western Europe
(case study Luxembourg), cold stress levels will decrease significantly in the near future up to 2050 as a
result of a temporarily reduced overall thermal stress level and further increasing air temperatures.
2.2. Physiologically Equivalent Temperature (PET)
Physiologically equivalent temperature (PET) [79] is based on the energy balance equation between
a human body and the environment, and it is derived from the Munich Energy-Balance Model for
Individuals (MEMI) [79,80]. During the last 30 years, PET has been widely used to explore the impact of
oppressive heat or cold conditions on human health. PET is defined as the air temperature equivalent
at which an average person (male, 35 years; 1.75 m, 75 kg) that is indoors, not active (work activity 80 W,
heat resistance of clothing Iclo = 0.9, mean radiant temperature equal to air temperature (Tmrt = T),
velocity 0.1 m/s, water vapor pressure 12 hPa) would feel the same as in real conditions. It is worth
mentioning that Matzarakis et al. [80,81] produced the RayMan software package which calculates
mean radiant temperature, necessary for quantification of thermal indices such as Predicted Mean
Vote (PMT), PET, and Standard Effective Temperature (SET) values for given locations (e.g., Heraklion,
Crete; Freiburg, South-West Germany). The values of PET are graded as an index for showing thermal
sensation felt by humans [82] (Table 2).
Table 2. Physiologically equivalent temperature (PET) for different grades of thermal sensation and
physiological stress on human beings [82].
PET (◦ C) Thermal Sensation Physiological Stress Level
41.1 Very hot Extreme heat stress
2.2.1. Western and Central Europe
Matzarakis et al. [83] analyzed the differences between thermal comfort in the city center of
Strasbourg, and its vicinity by using PET. During the heatwave of 2003, the Strasbourg residentsAtmosphere 2020, 11, 1276 9 of 21
experienced warmer conditions compared to other years. The temperatures were not extreme and did
not cause severe heat stress. For both city centers, and the rural surrounding PET values were higher
during the summer of 2003. It was concluded that in order to progress in the knowledge of thermal
stress and human comfort, there is an increasing need for use and development of thermal indices that
could be used in urban and rural surroundings alike.
Recently, two approaches were developed [84] to estimate the increases in mortality due to heat
stress, with and without long-term adaptation in Vienna, Austria. They described the heat stress
using PET that was calculated using the variables from two regional climate models based on the
Intergovernmental Panel on Climate Change (IPCC) emissions scenarios A1B and B1. According to
scenarios, no significant changes were predicted until 2011–2040 compared to 1970–2000. An expected
heat-related mortality of up to 129% would be reached in the following decades if the adaptation were
absent. Still, with the long-term adaptation, the increase would be notable but not so pronounced.
Two complex approaches were used to assess the relationship between heat stress and mortality
in the federal state of Vienna (Austria) in the period 1970–2007. The results revealed a significant
impact of heat stress on human health, where the study pointed out that significantly higher sensitivity
was observed for women compared to men. Over38 years, some significant decreases in the sensitivity
were observed, especially in the medium heat stress levels indicating active processes of long-term
adaptation to the increasing heat stress [85].
For Freiburg (Germany), Matzarakis and Endler [86] evaluated recent thermal bioclimatic conditions
as well as future ones using the A1B and B1 scenarios. It was stated that according to future climate
scenarios, the days with extreme heat stress (PET > 35 ◦ C) will occur more frequently in the order of 5%
(from 9.2% based on the reference period 1961–1990). It was also shown that the changes in reduction
in heat stress would be much greater if the radiation fluxes were modified. This modification could be
achieved by planting specific and relevant vegetation types that produce shade in summer and allow
short wave radiation to reach the surface or the areas where humans spend their time in winter.
Matzarakis et al. [87] presented information on thermal comfort/stress conditions, as well as
aesthetical and physical parameters for tourism climate potential in Western Europe (case study
Luxembourg). The paper emphasized that most important bioclimate influences are connected with
extreme events, indicating that in the future heat stress and sultriness will increase, while cold stress
will experience a decrease in this part of Europe.
Junk et al. [88] analyzed the past and future changes in health-related meteorological variables
across Luxembourg. The performed analysis indicated the presence of trends in the thermal index PET
in the investigated area. The study pointed out that the number of frost days is declining by more than
40 days between the reference period (1961–1990) and the last decade of this century. Tropical nights
which did not occur in the reference period rose to 11 events for the same time-span. The analysis
revealed that PET values have a significant shift towards higher thermal stress levels for Luxembourg.
It was found that the frequency, duration, and intensity of cold events will most probably decrease in a
warming climate.
2.2.2. Northern Europe
The generalized additive models were used to examine the association of relative mortality to PET
and air temperature in Finland (Northern Europe). Results indicated that during the two 21-year long
sub-periods (1972–1992 and 1994–2014) relative mortality increased more in the hot than in the cold
part of the thermal distribution. Among people aged 75 years and older, the increase was stronger,
but it also had a positive tendency among individuals younger than 65 years. It was highlighted
that the causality between relative mortality and cold extremes was negligible with the exception of
individuals aged ≥75 years, during 1994–2014 [89].Atmosphere 2020, 11, 1276 10 of 21
2.2.3. Southern and Southeastern Europe
Matzarakis and Nastos [29] used the values of daily PET as well as the daily minimum air
temperature to characterize heatwaves in Athens. The two parameters were used to emphasize the
thermal stress during the day, but also the night-time discomfort. The results of the study indicated that
there is an increase in the average duration of heatwaves throughout the investigated period 1955–2001.
Furthermore, the acclimatization approach that was used to evaluate human adaptation to extreme
thermal conditions showed that this method is better at estimating the heat stress and it could be used
in urban planning measures as well as Urban Heat Island Reduction, especially during night-time.
In the study of Nastos and Matzarakis [61], the authors evaluated the grade of physiological
stress and quantified the association between the daily mortality and daily values of PET for the
wider region of Athens for the 10 years 1992–2001. Results obtained from this study indicated that
the mortality wasin close relation to the air temperature and PET, emphasizing those statistically
significant relationships between air temperature, PET, and mortality exist on the same day.
Similarly to UTCI, Katavoutas and Founda [67] showed, using PET, that the Athens population has
been exposed to a significant, increased risk of heat stress since the 1960s, which has been maximized
in the last two decades. It was concluded that inhabitants of Athens are under extreme heat stress
(for PET at values of 0.4%/decade), and the exposure has increased along with the additional time per
year with extreme warm conditions.
Bleta et al. [62] assessed and analyzed the human bioclimatic conditions of Crete Island by
applying two human thermal indices—PET and UTCI. They calculated PET and UTCI values from
daily meteorological data for the 1975–2004 period. The results showed that the daily extreme PET
values increased, but they could not find statistically significant values.
When analyzing the evolution of heatwaves in Madrid (Spain) and their impacts on human
thermal comfort, Rasilla et al. [90] indicated that there was an evident increase in frequency and
duration after 1980. Their findings are in good correlation with similar studies of heatwaves in the
Iberian Peninsula and the Mediterranean region [91,92]. The cause for the increase in PET values and
resulting heatwaves was the increase in global temperatures. The diurnal and nocturnal PET variations
were also investigated, and it was concluded that extreme heat stress during the day was exuberated
due to the lack of cooling winds [90].
Zaninović and Matzarakis [93] analyzed the relationship between heatwaves and mortality in
Croatia during the 26 years from 1983 to 2008. The study revealed that higher values were observed
for the continental part of Croatia than in the coastal region due to the refreshing influence of the sea
daily. Additionally, it was revealed that an increase in mortality in both cold and warm parts of the
scale was present but with higher frequency during the warm part.
Similarly, Basarin et al. [25] analyzed extreme bioclimate events in Novi Sad (Vojvodina, Northern
Serbia, Southeastern Europe) during the period 1949–2012. The results showed that the number of days
with temperatures above-defined thresholds rose and so has the number of heatwaves per year since 1981.
Based on the presented results, it was concluded that the average duration of warm spells is increasing.
The regional analysis of extreme PET values for Vojvodina (Northern Serbia, Southeastern
Europe) was presented by Basarin et al. [30]. To gain a better insight into the impacts of climate
change on biometeorological conditions, the extreme values of PET were calculated based on
the indices developed by the joint Commission for Climatology/Climate and Ocean: Variability,
Predictability and Change/Joint Technical Commission for Oceanography and Marine Meteorology
(CCl/CLIVAR/JCOMM) Expert Team (ET) on Climate Change Detection and Indices (ETCCDI; [94]).
These indices are objective measurement and characterization of climate variability and change. These
indices were developed to detect climate extremes covering a wide range of climates. Eleven PET
indices based on Climate Variability and Predictability (CLIVAR) were used, and their main focus is on
biometeorological change detection. The indices were created for air temperature and precipitation
but were adapted for PET [30]. The significant increase in the frequency of warm conditions along
with a significant decrease in the cold conditions dominates the whole area. The more pronouncedAtmosphere 2020, 11, 1276 11 of 21
and higher frequency of warm biometeorological extreme conditions is most likely the prevailing
factor in the warming in Vojvodina. The results showed that heatwaves are becoming more frequent
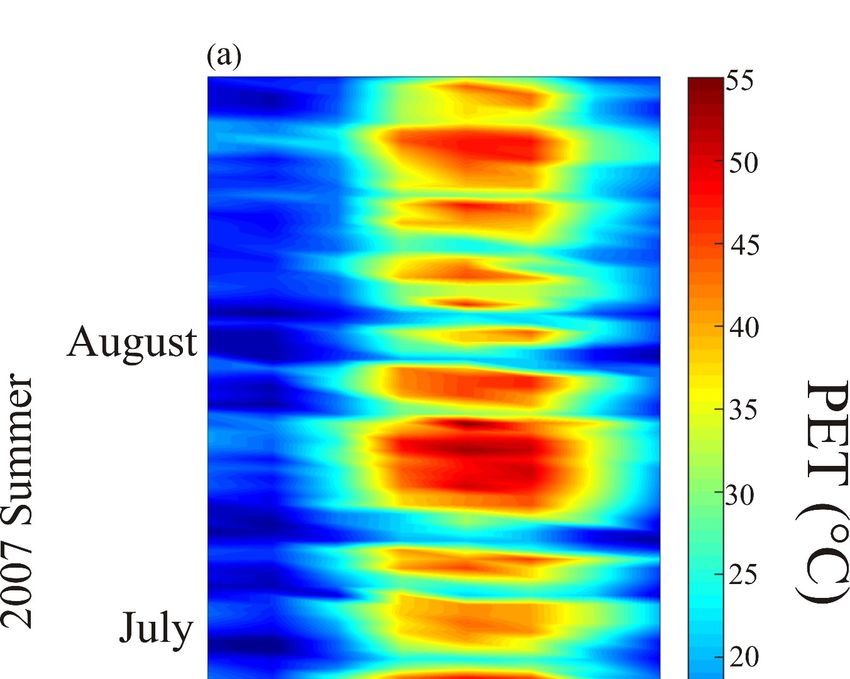
and longer-lasting for the whole area. The heatwave of 2007 was particularly intense (Figure 1).
National Hydro-meteorological Service of Serbia reported absolute maximum temperatures on the
23rd of July, reaching 44.9 ◦ C [18]. The 2007 heatwave shows the highest PET values and the largest
extension on the territory of Serbia. Similar conclusions were found in studies providing evidence
that the anomalous 2007 heatwave exceeded the amplitude and spatial extent of the previous summer
heatwaves. The heatwave in 2007 started in mid-July and lasted for 10 days at most places in
Serbia. The PET values during the hottest part of the day as high as 55 ◦ C (Figure 1). During the
night-time, the temperatures were between 20 and 25 ◦ C, which are still high and not enough to
cool the environment. The latter confirms the severity of most of these heatwaves which have been
characterized by the persistence
Atmosphere ofREVIEW
2020, 11, x FOR PEER extremely high night-time temperatures [95]. 12 of 22
Figure 1. Cont.Atmosphere 2020, 11, x FOR PEER REVIEW 13 of 22
Atmosphere 2020, 11, 1276 12 of 21
Figure
Figure 1. The
1. The highestPET
highest PET values
values and
andthe
theextension of the
extension heatwave
of the on theon
heatwave territory of Serbia.
the territory of(a)
Serbia.
Diurnal PET values recorded at Smederevska Palanka meteorological station (2007
(a) Diurnal PET values recorded at Smederevska Palanka meteorological station (2007 heatwave heatwave is is
shown as highlighted part). (b) Maximum PET values during the heatwave at Smederevska Palanka
shown as highlighted part). (b) Maximum PET values during the heatwave at Smederevska Palanka
meteorological station; the gray line shows 95th percentile threshold based on the 1981–2010 reference
meteorological station; the gray line shows 95th percentile threshold based on the 1981–2010 reference
period. (c) Spatial distribution of maximum PET values recorded at 15.00 at all meteorological stations
period. (c) Spatial distribution of maximum PET values recorded at 15.00 at all meteorological stations
in Serbia [95].
in Serbia [95].Atmosphere 2020, 11, 1276 13 of 21
The study of Stojićević et al. [96] presented the results of a detailed bioclimatological analysis of
Banja Koviljača (northwestern part of Serbia, Southeastern Europe). The presented study analyzed the
variations and trends of the PET for the period 1961–2014 on a seasonal and annual basis. In the future,
the change in tourism season and recreation potential could change due to the increase in annual and
seasonal values of PET. Hence, the number of days with PET values between 18 and 23 ◦ C is decreasing
every year by 0.22 days, and this decrease is statistically significant. Bioclimatological warm extremes
exhibited statistically significant increasing trends, where the increase in the duration of heatwaves
during the last 50 years pointed out that every year there are 0.44 more heatwaves.
Changes in the PET values for the future on a global basis indicate that the areas with extreme
and uncomfortable thermal conditions and heat stress affections could be observed. In many regions
of the world, especially the Mediterranean and North America, the changes in thermal stress will
most likely outpace changes in air temperature. Thus, the major implications for the assessment of
the health effects of climate change must be reconsidered. The effects of climate variability on human
health and well-being have been underestimated in the past since most of the studies were based on
air temperature rather than changes in PET [97]. The results of PET variation for winter and summer
season for Northern Hemisphere based on emission scenarios (SRES) A1F and B1a period 2071–2100
were assessed and showed a strong increase in heat stress for many regions of the world. The areas
most affected—e.g., the Mediterranean and western parts of North America—will likely experience
changes in thermal perception, and those are expected to outpace the changes in air temperature.
It is highly likely that climate change will affect different parts of society and economy, but the
negative effects on human health should be assessed using energy balance of the human body and the
derived thermal index. Matzarakis [98] demonstrated the spatial distribution of PET values calculated
using the standard SRES emission scenarios. These projections imply that human biometeorological
conditions are going to become much worse in the future. Very popular summer tourism areas will be
most affected by these changes. The extent extreme heat stress conditions (PET >35 ◦ C) will cover
significant portions of global mainland, especially the Northern Hemisphere [99].
3. Heat Health Warning Systems (HHWS)
The 2003 and 2010 severe heatwave events over Western Europe and Russia draw attention and
necessity for the conceptualization and implementation of public health measures that would focus,
almost exclusively, on heat health warning systems (HHWS). These systems use forecasts of high-risk
weather conditions to provide public warnings in Europe [99]. HHWS is defined as a system that
uses meteorological forecasts to initiate acute public health interventions designed to reduce heat
stress impacts on human health during extreme weather conditions [43,100]. Once the temperature
or other weather factors exceed certain thresholds, the HHWS is activated. These thresholds are
called triggers, and the ideal setting of triggers enables efficient and coordinated emergency responses;
effective communication; and, in the end, reduction in heat-related mortality and morbidity [43,101].
HHWS depend on certain thresholds that best describe human-health tolerance to extreme weather.
For HHWS to be reliable, it is necessary to include several elements such as consistent meteorological
forecasts; a thorough understanding of relationships between the thermal environment and how it
impacts human health; effective and timely response measures as well as the involved stakeholders and
decision-makers that have sufficient resources, capacities, knowledge, and political will to implement
the response actions [100]. The utilization of modern HHWS is becoming more important and widely
used, as these systems could save human lives. During recent heatwaves in Europe, it was observed that
extreme temperature-related mortality indicated that in addition to economic wealth and technological
development, adaptive capacity to climate change effects has to be enhanced [102].
Thus, many municipalities on a global basis have taken great interest in dealing with extreme
heat conditions. These systems are becoming one of the key methods by which heat events are forecast
and their effects are mitigated. Hence, regardless of the approach that is being used when creating
an HHWS, several key considerations should be taken into account when correlating meteorologicalair masses linked with high mortality rates. The greatest example is the ICARO system in Lisbon that
uses the relationship between maximum temperature and mortality, and it issues a warning when
the defined threshold is exceeded [103]. Similarly, The National Meteorological and Hydrological
Service in Sweden issues a warning when thresholds based on a study by the Department of Public
Atmosphere 2020, 11, 1276 14 of 21
Health and Clinical Medicine of the University of Umeå are exceeded and rely on the relation
between temperature and mortality [43]. Moreover, some systems integrate health observations as a
parameters
goal to either with human
advance thehealth
modelresponse.
of excess Three of the
mortality most
(e.g., important
in Milan) or tofactors
confirm arethe
spatial variability,
negative effects
temporal
of heatwave variability,
on human and persistence
health (Nationalof the oppressive
Health heat. HHWS
Services—health should
advice typically contain
and information servicedatain
on weather
the UK (NHS forecasts,
Direct)).assessments
Regardless of ofrelations between
differences, weather and
the universal aim human
should health, and a system of
be the identification
ranking
days alerts [43,100].
associated with the greatest health effects associated with extreme weather conditions. The
Some
spatial versions of
distribution of heatwave warning
the operational systems
HHWS used air during
in Europe temperature and 2019
2009 and exceedance
is givenof in
predefined
Figure 2
thresholds
and Figure of 3. daily maximum temperatures for a given day. These thresholds are region specific and
could not be uniform for all countries in Europe. On the other hand, some HHWS are based on a
Examples
minimumofduration
HHWS Basedof theon Biometeorological
heat Indices temperature-humidity indices or a combination of
event using different
several
HHWS meteorological
must be parameters.
based on aDuringmethod thefor
1990s,
the new synopticofmethods
prediction emerged that
health-relevant identify air
meteorological
thresholds especially in data-sparse areas. When this scientific task is completed, it will help withthat
masses linked with high mortality rates. The greatest example is the ICARO system in Lisbon the
uses the relationship
development between maximum
and standardized temperature
implementation and mortality,
of HHWS and it issues
at a European a warning
level [104]. when the
As discussed,
defined
the HHWS threshold is exceeded
are based [103].
on a single Similarly,
metric The National
of temperature or Meteorological
a combination and Hydrological
of several Service
variables, and
in Sweden issues a warning when thresholds based on a study by the Department
most countries issue warnings that are based on maximum or mean temperatures. Other countries’ of Public Health and
Clinicalin
HHWS Medicine
additionof tothe University
maximum of Umeå areand
air temperature exceeded
humidity anduserelya on the relation
specific simple between temperature
single index (e.g., HI).
and mortality [43]. Moreover, some systems integrate health observations
However, the most sophisticated systems issue warnings based on the combination of a thermal- as a goal to either advance
the model
stress of excess
indices (e.g., mortality
PT) and (e.g.,
minimumin Milan) or to confirm
temperatures theasnegative
such in Germanyeffects and
of heatwave
Austria. onForhuman
most
health (National Health Services—health advice and information service
HHWS, the warnings are exclusively issued for warm conditions, but only in Germany PT is also in the UK (NHS Direct)).
Regardless
used of differences,
to measure cold stress the universal
[43]. aim should
In Germany, the heatbe warnings
the identification of daysautomatically.
are generated associated with Whenthe
greatest health
published, effects associated
the warnings with and
are adjusted extreme weather
confirmed byconditions. The spatial
a biometeorology distribution
forecaster. of the
Preliminary
operational HHWS in Europe during 2009 and 2019 is given in Figures 2 and
studies indicate that there is a decrease in the heat related mortality and morbidity cases [105]. 3.
Figure 2. Heat-health
Figure 2. Heat-health warning
warning systems
systems (HHWS)
(HHWS) in Europe during
in Europe during 2009.
2009. Taxonomy
Taxonomy ofof operational
operational
HHWS
HHWS in in Europe—Tmax:
Europe—Tmax: maximum
maximum temperature;
temperature; Tmean:
Tmean: mean
mean temperature;
temperature; Tmin:
Tmin: minimum
minimum
temperature; AT: apparent temperature; T: Air temperature; RH: relative humidity; PT: perceived
temperature; AT: apparent temperature; T: Air temperature; RH: relative humidity; PT: perceived
temperature. N/A: not known (modified after EURO HEAT project and [102]).
temperature. N/A: not known (modified after EURO HEAT project and [102]).
Examples of HHWS Based on Biometeorological Indices
HHWS must be based on a method for the prediction of health-relevant meteorological thresholds
especially in data-sparse areas. When this scientific task is completed, it will help with the development
and standardized implementation of HHWS at a European level [104]. As discussed, the HHWS are
based on a single metric of temperature or a combination of several variables, and most countries issueAtmosphere 2020, 11, 1276 15 of 21
warnings that are based on maximum or mean temperatures. Other countries’ HHWS in addition
to maximum air temperature and humidity use a specific simple single index (e.g., HI). However,
the most sophisticated systems issue warnings based on the combination of a thermal-stress indices
(e.g., PT) and minimum temperatures such as in Germany and Austria. For most HHWS, the warnings
are exclusively issued for warm conditions, but only in Germany PT is also used to measure cold
stress [43]. In Germany, the heat warnings are generated automatically. When published, the warnings
are adjusted and confirmed by a biometeorology forecaster. Preliminary studies indicate that there is a
decrease in the heat related mortality and morbidity cases [105].
Atmosphere 2020, 11, x FOR PEER REVIEW 15 of 21
Figure 3. HHWS in Europe in 2019 (modified after [43,106]).
Figure 3. HHWS in Europe in 2019 (modified after [43,106]).
Even though the Hellenic National Meteorological Service uses HHWS that issues the warning
when defined thresholds of maximum temperatures are exceeded, the National Observatory of
Athens operates a system based on PET and uses it to forecast the human-biometeorological
conditions [107]. The Italian system uses maximum apparent temperature and is region-specific.
Additionally, their model is based on air mass circulation enabling the further consideration ofAtmosphere 2020, 11, 1276 16 of 21
Even though the Hellenic National Meteorological Service uses HHWS that issues the warning
when defined thresholds of maximum temperatures are exceeded, the National Observatory of Athens
operates a system based on PET and uses it to forecast the human-biometeorological conditions [107].
The Italian system uses maximum apparent temperature and is region-specific. Additionally, their
model is based on air mass circulation enabling the further consideration of extreme warm conditions
and the causes for their development [43]. Heat-budget models form the basis of HHWS in Germany
and Austria and have a clear correlation with mortality.
4. Conclusions
The reviewed scientific papers, which studied the changes in biometeorological warm extremes,
provided an extensive overview of significant fluctuations of these events for large parts of the European
continent. In recent decades, there has been an evident increase in frequency, duration, and intensity
of heatwaves that are determined using standard maximum temperature values but also those that
are quantified as simple biometeorological indices (AT, HUMIDEX, HI). Furthermore, climate models
suggest their intensification in the future. Thus, the more frequent and severe occurrences of heatwaves
and mega heatwaves are anticipated under the future warmer climate, and their distribution will
vary significantly. Moreover, the studies confirmed that the return period of those extreme events has
declined and their frequency will increase in the parts of the globe that are already affected, but the
mid-latitudes will also experience the intensification of humid heatwaves.
The use of heat budget modes and consequently complex biometeorological indices along
with meteorological forecast data will provide a platform for future detection and attributions of
biometeorological warm extremes. Further research is needed for additional adjustments of the
complex biometeorological indices in order to better respond to the needs of society under global
warming. For future scenarios, it can be observed that extreme biometeorological events will become
more frequent in Europe, and due to the potential negative effects on human health, it is necessary to
find the best mitigation strategies. Thus, the necessity for the conceptualization and implementation
of the early warning systems is of great importance. Since the duration of extreme heat events
is projected to become much longer and the intensity much stronger in the future along with the
shortening of return periods, it is necessary to modify current and design new HHWS to take these
changes into account. In the future, with accelerating changes in climate extremes, HHWS will have to
evolve consequently, ensuring sustainability and continued efficacy. There are several very important
challenges for adaptive management of HHWS such as updating the thresholds at which the warnings
are issued. The thresholds will most likely be changes due to the acclimatization of the population
to future extreme heat events, intensity, and duration. Additionally, the evolution of HHWS will
have to take into account targeted risk communications and population profile changes, while the
greater scientific knowledge is gathered about the relation between human health and atmospheric
conditions [108]. Casanueva et al. [43] gave an extensive overview of recommendations for the design
of future, as well as for the upgrading of existent, HHWS. In the scientific community, there has to
be a consensus on how to integrate meteorological data into human thermal models as international
standards subsequently to deliver more precise climate service tools and HHWS for individuals and
society alike to better manage thermal stress-induced intensifying extreme climate events.
Author Contributions: Conceptualization, A.M.; writing—original draft preparation, B.B.; writing—review and
editing, T.L. and B.B.; visualization, T.L.; supervision, A.M. All authors have read and agreed to the published
version of the manuscript.
Funding: This research received no external funding.
Acknowledgments: The authors acknowledge the support of the Ministry of Education, Science and Technological
Development of the Republic of Serbia (Grant No.451-03-68/2020-14/200125). Part of the research was supported
by the H2020-WIDESPREAD-05-2020—Twinning: ExtremeClimTwin.
Conflicts of Interest: The authors declare no conflict of interest.You can also read