Extreme temperatures compromise male and female fertility in a large desert bird
←
→
Page content transcription
If your browser does not render page correctly, please read the page content below
ARTICLE
                  https://doi.org/10.1038/s41467-021-20937-7                 OPEN

                  Extreme temperatures compromise male
                  and female fertility in a large desert bird
                  Mads F. Schou 1 ✉, Maud Bonato 2, Anel Engelbrecht 3, Zanell Brand3, Erik I. Svensson                                                1,

                  Julian Melgar 1, Pfunzo T. Muvhali 2, Schalk W. P. Cloete 2,3 & Charlie K. Cornwallis1
1234567890():,;

                  Temperature has a crucial influence on the places where species can survive and reproduce.
                  Past research has primarily focused on survival, making it unclear if temperature fluctuations
                  constrain reproductive success, and if so whether populations harbour the potential to
                  respond to climatic shifts. Here, using two decades of data from a large experimental
                  breeding programme of the iconic ostrich (Struthio camelus) in South Africa, we show that the
                  number of eggs females laid and the number of sperm males produced were highly sensitive
                  to natural temperature extremes (ranging from −5 °C to 45 °C). This resulted in reductions
                  in reproductive success of up to 44% with 5 °C deviations from their thermal optimum. In
                  contrast, gamete quality was largely unaffected by temperature. Extreme temperatures
                  also did not expose trade-offs between gametic traits. Instead, some females appeared to
                  invest more in reproducing at high temperatures, which may facilitate responses to climate
                  change. These results show that the robustness of fertility to temperature fluctuations, and
                  not just temperature increases, is a critical aspect of species persistence in regions predicted
                  to undergo the greatest change in climate volatility.

                  1 Department of Biology, Lund University, Lund, Sweden. 2 Department of Animal Sciences, University of Stellenbosch, Matieland, South Africa. 3 Directorate

                  Animal Sciences, Western Cape Department of Agriculture, Elsenburg, South Africa. ✉email: mads.schou@biol.lu.se

                  NATURE COMMUNICATIONS | (2021)12:666 | https://doi.org/10.1038/s41467-021-20937-7 | www.nature.com/naturecommunications                                  1
ARTICLE NATURE COMMUNICATIONS | https://doi.org/10.1038/s41467-021-20937-7
T
he range of temperatures that organisms can tolerate has a their risk of exposure to shifts in environmental conditions.
crucial influence on their distributions across space and Furthermore, because temperate species typically have short
time1–3. Our current understanding of thermal tolerance breeding seasons, timed to the seasonal appearance of food
largely comes from studies examining how high temperatures (phenology), there has been a focus on whether advancing spring
affect survival4–7. However, it has recently been argued that temperatures reduce breeding success through phenological
because reproductive failure often occurs well before death, mismatches18–28,35,36. Consequently, more information is needed
temperature effects on fertility (thermal fertility limits) may be on the effects of ecologically relevant temperatures on investment
more important in determining species responses to environ- in the traits directly related to fertility, such as the production and
mental change8–12. Characterizing how natural temperature viability of eggs and sperm.
fluctuations affect investment in fertility traits, such as the Here we examine how temperature fluctuations over a 20-year
number and viability of eggs and sperm, and the impact this has period affect multiple fertility traits in the world’s largest bird, the
on reproductive success is therefore crucially important, espe- ostrich (Struthio camelus), which reproduce throughout the year
cially as climatic variation is expected to increase globally13,14. Do in tropical and sub-tropical regions (Fig. 1)37–39. Individually
extreme temperatures have damaging effects on different fertility marked birds (n = 1299, Supplementary Table 1) were studied in
traits and if so, is there the potential for selection to increase the Klein Karoo region of South Africa where temperatures
resilience to changing climates? during the reproductive cycle ranged from −5 to 45 °C. Data on
Responses to selection for coping with more extreme and the fertility of females and males was obtained by collecting eggs
unpredictable temperatures relies on individuals varying in their daily from captive pairs, and by collecting natural ejaculates from
thermal resilience15. One factor that can influence individual captive solitary males. All pairs and solitary males used for sperm
variation in thermal resilience is how reproductive and somatic collection were kept in separate fenced enclosures of natural
investment are managed under thermal stress. For example, Karoo scrub exposed to natural weather conditions (Fig. 1a). Data
temperature extremes may lead to high physiological demand to were matched with onsite temperature records to investigate: (1)
protect essential organismal functions that reduce investment in how thermal fluctuations shape investment in gametic traits
reproduction1,16,17. Reduced reproductive investment can in turn (number of eggs and sperm, egg mass and sperm viability) and
generate trade-offs between different fertility traits that limit reproductive success (hatching success and offspring numbers),
responses to selection for increased resilience to temperature (2) individual variation in the resilience of fertility to temperature
change. However, whether temperature extremes expose such change, and (3) whether extreme temperatures cause trade-offs in
reproductive trade-offs, and the extent to which individuals vary investment across gametic traits.
in their prioritization of investment across different fertility traits,
is unclear.
Research on the effects of natural temperature variation on Results
reproduction in non-domesticated endotherms has primarily Is fertility compromised by hot and cold temperatures? The
been on temperate species18–33. However, temperature unpre- number of eggs females laid and the number of sperm males
dictability is greatest in tropical and sub-tropical regions and ejaculated were significantly reduced by both increases and
climate modelling shows this will increase in the future13,34. The decreases in ambient temperature (Fig. 2a, b). The effects of
reproductive performance of species living in such regions may temperature were not immediate, but resulted from a critical
also be particularly sensitive to the effects of climatic fluctuations, thermal window 2–4 days before laying and ejaculation (Sup-
as they often have prolonged breeding seasons that increase plementary Figs. 1 and 2; see the subsection “Time lag effects of
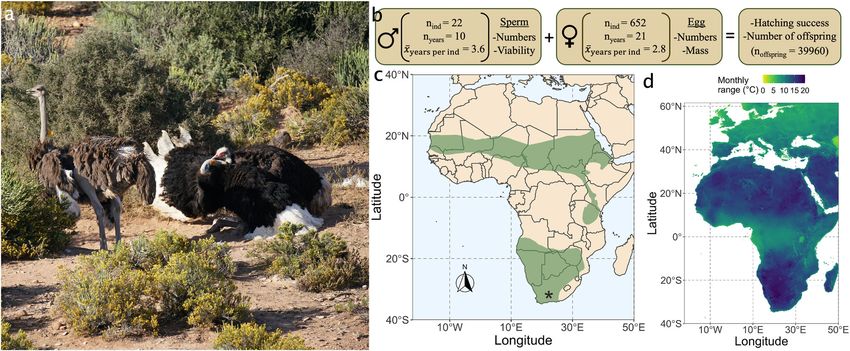
Fig. 1 Ostriches (Struthio camelus) cope with large thermal fluctuations in their native habitat, reproducing successfully across Africa from the
Western Cape to the deserts of Southern and Northern Africa. a Courtship by a male ostrich (right) towards a female (left) in one of the enclosures (n =
197) at the study site used to keep a single breeding pair (photo: CKC). b Data structure of fertility traits obtained from 1998 to 2018 at the study site of
Oudtshoorn Research Farm in the arid Klein Karoo region of South Africa. Sperm viability data was not available for all of the solitary males where
measures of sperm numbers were obtained (sperm viability: nind = 18, nyears = 7, xyears per ind ¼ 2:7). See also Supplementary Table 1 for detailed overview of
sample sizes. c Geographic range (green) of the ostrich93 with the study site marked by an asterisk. d Monthly temperature range was calculated by
estimating the range of temperatures of each month and then calculating the mean of this across all months94.
2 NATURE COMMUNICATIONS | (2021)12:666 | https://doi.org/10.1038/s41467-021-20937-7 | www.nature.com/naturecommunicationsNATURE COMMUNICATIONS | https://doi.org/10.1038/s41467-021-20937-7 ARTICLE
Increase in temperature Decrease in temperature
0.6 a 8 b
Number of sperm (x109)
Egg laying (eggs/2days)
6
0.4
4
0.2
2
0.0 0
0 5 10 15 20 25 0 5 10 15 20 25
Change from optimum (qC) Change from optimum (qC)
100
1.6 c d
80
Sperm viability (%)
Egg mass (kg)
1.5
60
1.4 40
20
1.3
0
0 5 10 15 20 25 0 5 10 15 20 25
Change from optimum (qC) Change from optimum (qC)
Number of offspring (chicks/2days)
0.8 0.4
e f
Hatching success
0.6 0.3
0.4 0.2
0.2 0.1
0.0 0.0
0 5 10 15 20 0 5 10 15 20
Change from optimum (qC) Change from optimum (qC)
Fig. 2 Temperature extremes compromise male (n = 22) and female (n = 652) fertility. Female egg laying rate (a) and number of sperm ejaculated by
males (b) were both highly sensitive to increases and decreases in temperature. Female (c: egg mass) and male (d: sperm viability) gamete quality were
generally more resistant to temperature change. Hatching success (e), which is influenced by the egg mass41,42, sperm numbers and sperm viability, was
also less affected by temperature change. The number of offspring (f) is a product of hatching success and rates of egg laying and was influenced by
changes in temperature that occured during egg laying. Ostrich females can only lay an egg every other day and we therefore used number of eggs or
chicks per number of two-day intervals (eggs/2 days or chicks/2 days) (see the subsection “Time lag effects of temperature on gametes” in
“Methods” section). The range of temperatures that sperm traits were measured at differed from the other traits, because it was not possible to collect
sperm across all years (Supplementary Table 1). Fitted lines and 95% credible intervals (shaded area) from the primary set of models are shown for traits
significantly affected by temperature (Supplementary Tables 2–7). For binomial models the fitted lines span the modelled binned temperature classes
making them robust to outliers. Points are averages with standard errors binned according to the temperature variable. Point size illustrates relative
number of observations. Source data are provided as a Source Data file.
temperature on gametes” in “Methods” section). During this “Methods” section). It is also likely that both 20 and 26 °C are
critical thermal window, egg laying rate peaked at 20 °C (Sup- within the thermal neutral zone (TNZ), which although not
plementary Fig. 3), dropping by 15% and 18% when temperatures explicitly known for ostriches, spans from 10–15 to 30 °C in the
increased and decreased by 5 °C, respectively (Fig. 2a; Table 1, closest relative, the emu (Dromaius novaehollandiae)40.
Supplementary Table 2). Similar reductions were seen in the Fluctuations in temperature had much less of an effect on
number of sperm males ejaculated (19% with 5 °C increases and gamete viability than on the number of gametes. The mass of eggs
decreases from the optimum; Fig. 2b; Table 1, Supplementary females produced only decreased by 0.7% when temperatures fell
Table 3), but the thermal optimum appeared to be slightly higher from 20 to 15 °C and were unaffected by increases in temperature
than for egg laying, peaking at ~26 °C (Supplementary Fig. 4). (Fig. 2c; Table 1; Supplementary Table 4). Similarly, the viability
While this may indicate there is the potential for conflict over the of sperm (viable sperm: normal morphology, intact membrane
thermal optima of males and females, this dataset was not and eosin impermeable) males produced was robust to tempera-
designed to test this (see the subsection “thermal stress index” in ture fluctuations, with no consistent change with increases or
NATURE COMMUNICATIONS | (2021)12:666 | https://doi.org/10.1038/s41467-021-20937-7 | www.nature.com/naturecommunications 3ARTICLE NATURE COMMUNICATIONS | https://doi.org/10.1038/s41467-021-20937-7
decreases in temperature (Fig. 2d; Table 1; Supplementary
We quantified the differences between individuals relative to within and between individual variation (repeatability) for fertility at intermediate temperatures (intercept) and for the change in fertility with increasing and decreasing temperatures (slopes). Estimates and credible
intervals (CI) were extracted from the second set of MCMCglmm models including individual by year slopes. See Supplementary Tables 8–11 for model details including estimates of repeatability on the expected scale and variance of fixed effects. PSlopeVar = ratio of the slope
Table 5).
(0.03,0.04)
(0.04,0.13)
(0.05,0.17)
(0.14,0.18)
PSlopeVar (CI)
Do changes in fertility traits matter for reproductive success?
The effect of temperature on reproductive success (number of
0.16
0.03
0.07
0.1
offspring) is a product of changes in egg laying rates and the
probability that eggs hatch. Hatching success is in turn influenced
by the fertilizing ability of males, which depends on the numbers
((0.24,0.79) and viability of sperm inseminated, and egg viability, which is
(0.06,0.34)
(0.36,0.81)
(0.41,0.53)
linked to egg mass41,42. The potential effects of ambient tem-
peratures during incubation on hatching success were removed by
stress
artificially incubating eggs using an on-site hatchery. Hatching
success was significantly affected by the temperature birds
0.47
0.18
0.60
0.57
Tcold
experienced prior to laying: hatching success was reduced by 4–7%
with 5 °C increases and decreases from 20 °C (Fig. 2e; Theat stress
(credible interval, CI) = −0.26 (−0.43, −0.09), pMCMC = 0.002;
Tcold stress (CI) = −0.57 (−0.98, −0.01), pMCMC = 0.028; Sup-
(0.48,0.57)
(0.13,0.84)
(0.38,0.81)
(0.17,0.32)
plementary Table 6). Combined with changes in egg laying rates,
this resulted in the total number of offspring decreasing by 28%
stress
with 5 °C increases, and 44% with 5 °C decreases in temperature
Slopes
from 20 °C (Fig. 2f; Tcold stress (CI) = −2.10 (−2.57, −1.60),
Theat
0.61
0.24
0.52
0.47
pMCMC = 0.001; Theat stress (CI) = −1.42 (−1.61, −1.21),
pMCMC = 0.001; Supplementary Table 7). Reproductive success
Repeatability (CI)
can also be reduced if individuals die from temperature-related
(0.59,0.65)
(0.35,0.74)
(0.13,0.39)
(0.21,0.33)
stress during the breeding season, but during the 21 years of
experimental breeding only six adult deaths (0.5%) related to
Intercept
overheating were recorded. These results suggest that the negative
effects of temperature fluctuations on reproductive success arise
0.62
0.23
0.54
0.27
through the cumulative, detrimental effects on egg and sperm
production under both low and high temperatures. It is also worth
noting that these effects may be even more pronounced in wild
(−0.07,−0.03)***
populations where access to food and water is likely to be more
(−2.43,−1.80)***
(−1.13,−0.23)**
restricted.
(−0.55,0.11)
Do individuals vary in how resilient their fertility is to tem-
Table 1 Individual variation in the resilience of fertility to temperature change.
perature change? There was substantial variation among females
stress
in how resilient their laying rates were to temperature change.
−0.05
−0.67
−2.10
−0.21
Differences between individual females explained 24% of varia-
Tcold
tion in the rate of decline in egg laying when temperatures
increased, and 18% of variation when temperatures decreased
(Table 1). Similarly, some males were much more resilient to
(−1.90,−1.50)***
(−1.30,−0.02)*
temperature change than others, as indicated by the number of
(−0.24,0.42)
(−0.01,0.02)
sperm they ejaculated (Table 1). When temperatures increased,
47% of variation in the decline in sperm numbers was explained
by differences between males, and 57% when temperature
stress
decreased. We examined the robustness of these results using
character state models where values of a trait are correlated
Slopes
−1.68
−0.67
0
0.13
Theat
between different temperature categories (cold (28.7 °C) and benign): correlations lower than one indicate
variation between individuals in their response to temperature
change43. These analyses confirmed that there were substantial
*pMCMC < 0.05, **pMCMC < 0.01, ***pMCMC < 0.001.
(−2.19,−1.62)
(10.16,10.79)
Fixed effects (CI)
differences among males and females in their responses to tem-
(0.18,0.49)
(1.42,1.45)
perature change (Supplementary Tables 12 and 13).
Females were extremely consistent in their egg mass, which was
Intercept
relatively unaffected by temperature change (PSlopeVar: 0.03,
variance to the total phenotypic variance.
1.43
−1.91
0.32
10.46
Table 1). While average egg mass ranged from 1.41 to 1.68 kg
among females, the most extreme change in egg mass of a female
from 20 to 25 °C was an increase of just 0.015 kg. Despite this, a
relatively large proportion of the variation in egg mass change
Number of sperm
was explained by differences between females, around 50%. Such
Sperm viability
consistent differences among females is in accordance with
research on other bird species where egg mass is variable in
Egg laying
Egg mass
populations, but highly consistent within individuals44. For
Trait
males, the pattern was similar with around 60% of variation in
the change in sperm viability with temperature being explained
4 NATURE COMMUNICATIONS | (2021)12:666 | https://doi.org/10.1038/s41467-021-20937-7 | www.nature.com/naturecommunicationsNATURE COMMUNICATIONS | https://doi.org/10.1038/s41467-021-20937-7 ARTICLE
by differences between males (Table 1). That said, character state producing more eggs that are also heavier, compared to other
models showed only a weak correlation between measures of females.
sperm viability at benign versus cold and hot temperatures,
suggesting that data from extreme temperatures may inflate the
estimation of between individual differences (Supplementary Discussion
Table 15). Taken together, these results show that when It has been argued that to understand how species are affected by
temperatures increase and decrease, individual females and males environmental change, it is crucial to broaden the current focus
vary substantially in the number and viability of eggs and sperm on lethal limits to include thermal fertility limits9. Our results
they produce. The efficacy of selection to promote thermal provide support for this proposition, as only six adults (0.5%)
tolerance is therefore unlikely to be limited by a lack of variation died from thermal stress, whereas there were dramatic reductions
between individuals. of 28–44% in reproductive success with 5 °C deviations from their
thermal optimum. Although increased climatic change has
brought into focus the effect of rising temperatures on survival
Is the resilience of fertility to temperature change compro- and population persistence34, our results show that cooler, as well
mised by trade-offs between traits? When individuals are as hotter, temperatures may pose a challenge for species.
exposed to temperature extremes, simultaneous investment in Much of the classical life-history research on birds has focused
multiple traits may not be possible. The resulting trade-offs can on the seasonal appearance of food as a factor limiting breeding
take two forms. First, negative correlations between fertility traits success45,46, whereas the direct effects of temperature on repro-
may occur at extreme temperatures because physiological stress duction have remained more unclear (but see Hurley et al.11). In
limits the resources individuals have to invest across reproductive ectotherms, extreme temperatures have been shown to reduce
traits. Second, there may be negative correlations in the degree of both the number and the quality of gametes individuals
change across traits (thermal resilience) rather than absolute trait produce9,47,48 and similar effects have been found in domestic
values. For example, investment in the maintenance of one trait chickens, domestic mammals and laboratory mice49–52. Such
may come at the expense of maintenance of other traits. concordant effects of heat stress on different gametic traits sug-
We found no evidence of any negative correlations between gests that high temperatures may lead to a general degradation of
any fertility traits within or among individuals at any temperature reproductive function. While our results show that heat and cold
(Fig. 3; Supplementary Table 18). This shows that the number of stress compromise reproductive success, this was not because of
eggs females produce and the number of sperm males ejaculate is consistent detrimental effects across all traits, but rather specific
not traded-off against egg mass or sperm viability in either hot or responses of traits to temperature change: Sperm viability and egg
cold periods. Instead, correlations between traits within females mass did not decline even under the most extreme thermal stress,
were generally significantly positive, indicating that investment in whereas the number of gametes individuals produced was highly
the number and mass of eggs are up and down regulated together sensitive to temperature change.
(Fig. 3; Supplementary Table 18). Furthermore, among indivi- One potential reason for why the numbers and quality of
duals there was a significant positive relationship between change gametes differ in their response to temperature change is that
in egg laying rates and change in egg mass as temperatures they are under different mechanistic control. Reductions in sperm
increased (Fig. 3). This is contrary to the idea that temperature and oocyte production caused by heat stress have been shown in
stress induces trade-offs between fertility traits. Instead, this mammals to occur due to decreases in testosterone in males and
suggests that some females respond to higher temperatures by changes in luteinizing hormone in females50,51. General physio-
logical changes due to temperature stress may therefore reduce
rates of gametogenesis9. In contrast, changes in sperm and folli-
cular function have previously been linked to processes, such as
DNA damage9,49–51, and may be somewhat shielded from phy-
siological stress by the follicle/testes–blood barriers53. Alter-
natively, the limited effects of temperature on sperm viability and
egg mass may be due to reduced sensitivity to physiological stress,
consistent with early life-history models54, or other measures of
gametic performance may be required to detect the effects of
temperature on gamete quality. For example, the biochemical
composition of eggs can vary independently of egg mass and can
influence offspring fitness55,56. The differences in the response of
gametic traits to temperature change highlights the importance of
understanding reproductive mechanisms when predicting out-
comes of environmental change, and has important implications
for how thermal fertility limits are studied.
The evolution of increased thermal tolerance is key to the
persistence of populations as environments change and become
more unpredictable1,15. Our results show that ostrich populations
Fig. 3 Correlated changes in the number and quality of gametes as harbour individual variation in resilience to temperature change
temperatures increased and decreased. The number of eggs and sperm that may facilitate responses to shifting climates. However, this
females (n = 652) and males (n = 18) produced was not traded-off against raises the question of why some individuals are more susceptible
egg mass and sperm viability as temperatures changed (see also to temperature change than others? Given the fitness benefits of
Supplementary Table 18). This was consistent within and among increased thermal tolerance, why has selection not eliminated
individuals. Changes in egg-laying rates were positively correlated to egg variation within populations57? One possibility is that there are
mass as temperatures increased both within and among females (credible alternative strategies to cope with temperature change during
interval (CI) of phenotypic correlation excluded zero). Source data are reproduction. If thermal tolerance is costly, tolerant individuals
provided as a Source Data file. that reproduce across a wide range of temperatures (generalists)
NATURE COMMUNICATIONS | (2021)12:666 | https://doi.org/10.1038/s41467-021-20937-7 | www.nature.com/naturecommunications 5ARTICLE NATURE COMMUNICATIONS | https://doi.org/10.1038/s41467-021-20937-7
may have comparable fitness to individuals that only reproduce beyond February until April. All data from these months were removed to ensure
under specific thermal conditions (specialists), if they have lower data were consistent with other years. We also removed data from pairs where the
male or female was replaced during the breeding season, which occurred some-
reproductive success per breeding attempt1,58–60. We found no times when individuals were injured or died. Data on the rate of egg laying from
support for this idea, and if anything the opposite was true: these replacement pairs indicated that acclimation to enclosures and new partners
Certain females appeared to specialize in reproducing at higher takes ~45 days (Supplementary Fig. 5). Based on this information we removed data
temperatures by increasing both the number and mass of eggs from the first 45 days from each season. Two-year-old females had substantially
they laid, with no apparent reductions in egg mass at other times. lower reproductive success than older breeders (Supplementary Fig. 6, see also
Cloete et al.69) so these were removed from the data. Pairs that spent fewer than
It is possible that the ability of females to increase laying rates 200 days in their enclosure in a given year were removed so that data were con-
without compromising egg mass under extreme temperatures is sistent across pairs and years. Finally, pairs that laid fewer than 10 eggs per year
facilitated by their unique life-history characteristics, including were removed to avoid including incompatible pairings and individuals not in
laying extremely small eggs relative to their body size. Whether breeding condition, which reduced the total number of females in the analyses
to 652.
certain life-history characteristics increase or decrease the vul-
nerability of species to climate change is unclear and clearly Male gametic traits. For males, the ability to deliver high quantities of sperm of
warrants further investigation. high quality is crucial for fertilization success73–75. We obtained natural ejaculates
Another possibility is that variation in thermal tolerance is from solitary males kept in individual enclosures and estimated the number of
maintained due to alternative breeding strategies. Ostriches have sperm and sperm viability. Semen collections were performed three to five times a
week and after periods of sexual rest the first three ejaculates collected were dis-
an extremely flexible breeding system, reproducing in both pairs carded. From the resulting set of ejaculates we kept data on the first ejaculate
and cooperative groups37–39. Cooperative breeding in birds has collected each day, typically obtained in the morning, from each individual. Sperm
been shown to be a successful strategy for coping with high and concentration was measured with a spectrophotometer in 20 µL semen diluted
fluctuating temperatures where breeding in pairs often fails61–63. 1:400 (v/v) with a phosphate buffered saline solution containing 10% formalin. The
number of sperm was estimated as the product of sperm concentration and eja-
In this study, it was necessary to restrict breeding opportunities to culate volume, which we estimated using an automatic pipette. Sperm viability was
pairs to gain detailed measures of individual reproductive success. estimated by inspecting 500 sperm stained with nigrosin-eosin, and characterizing
It is therefore possible that the sensitivity of individuals to tem- a sperm as viable if the morphology was normal (complete unit of tail, midpiece
perature change may be alleviated by the buffering effects of and slightly curved head)76, the membrane was intact and eosin impermeable77.
sociality when opportunities to breed in groups arise64–67. Only males from which we were able to obtain at least five ejaculates were included
in the analysis to avoid including males not accustomed to the ejaculation col-
This study shows thermal stress is an important factor that can lection process. Subsets of these data have previously been used to test effects of
limit reproductive success (see also Nord and Nilsson68 and season, age and collectio78–80.
Walsh et al.9), even in species, such as the ostrich, that are well
adapted to survive in extreme thermal environments. To explain Hatching success and number of offspring. Hatching success reflects the product of
the past and predict the future effects of climate change, it is both male and female gametic traits as well as the quality of incubation. To control
incubation effects, eggs were artificially incubated in an on-site hatchery until
crucial to quantify the effects of temperature on the fertility in hatching. Eggs were stored (1–6 days) at 17 °C and 80–90% humidity with two
species inhabiting different biogeographical zones and with dif- daily rotations through a 180° angle until eggs were moved to incubators once a
ferent breeding biology. The extent to which the results of this week. Eggs were incubated at 36.2 °C and 24% humidity with hourly rotation on
study can be generalized remains to be established, given that their long axis through a 60° angle for the first 35 days and then switched to a
hatcher set at 36 °C and 24% humidity for the remaining 7 days81. This dataset was
little is known about temperature-dependent fertility in other subject to the same filtering procedure as the female egg traits.
tropical and sub-tropical species. However, the challenges faced
by endotherms in arid, tropical and sub-tropical regions are clear
and have already led to the collapse of entire bird communities34. Statistical analyses
Time lag effects of temperature on gametes. The time period where different traits
A key feature of climate change highlighted by our results is that are influenced by fluctuations in ambient temperatures (i.e. the critical thermal
both hot and cold temperatures likely pose a challenge for species, window) is unknown. We therefore estimated the sensitivity of each trait to dif-
providing an illustration of why temperature fluctuations, and not ferent sliding thermal windows preceding gamete production using general linear
just temperature increases, are critical to study. models (GLMs), where different thermal windows were entered as predictors of
gametic traits at the population level. A window size of 3 days was chosen and one
day steps were examined from 7 days before to 5 days after egg laying. We chose a
Methods window size of 3 days to capture immediate temperature fluctuations, while
Study site and population. The study site is situated at the Oudtshoorn Research minimizing the effects of seasonal trends that occurred with larger windows. This
Farm in the arid Klein Karoo of South Africa (GPS: 33°38′21.5″S, 22°15′17.4″E). also enabled us to avoid missing daily extreme events that occurred with smaller
The ostriches used in this study are derived from 139 founding individuals, con- windows. Supplementary one-day and two-day window analyses supported this
sisting of individuals classified into one of two subpopulations with the popularized decision, as three sequential one-day windows (or two overlapping two-day win-
names South African Blacks (S. camelus) or Zimbabwean Blues (S.c. australis). dows) were particular important predictors of egg-laying (Supplementary Fig. 7).
From 1998 to 2018 the reproduction of captive breeding pairs (nfemales = 756, The thermal windows after egg laying served as controls, as we did not expect any
nmales = 701) was monitored in 197 enclosures of ~0.25 ha of natural Karoo predictive power apart from the autocorrelation in temperature. In each window,
habitat69. A male and a female ostrich were assigned to each enclosure in May/June the average daily maximum temperature (AVG-TMAX) was modelled as a quadratic
each year and kept together until the end of the breeding season in December/ effect. To identify the critical thermal window, we compared the models using
January. Male–female combinations were established to prevent inbreeding and Akaike information criterion (AIC) or QAIC (Quasi-AIC) to account for the
where possible, generate new combinations each year. From 2008 to 2018 the overdispersion common to logistic regressions. The maximum egg-laying rate is
fertility of males (n = 22) kept in solitary enclosures (20 m × 17 m) and trained to one egg every 2 days. We therefore modelled the probability of laying as the
ejaculate into an artificial cloaca using a dummy female was monitored (method number of 2-day intervals with (eggs/2 days) and without eggs using a Binomial
developed by Rybnik et al.70). Ostriches received a diet designed for breeding error distribution, which was necessary to correctly model the variance in successes
individuals (90–120 g protein, 7.5–10.5 MJ metabolizable energy, 26 g calcium and (our response ranged from 0 to 1 whereas eggs per day ranged from 0 to 0.5).
6 g phosphorus per kg feed) and water ad libitum. Levels of dietary protein and Model comparison with QAIC showed that the critical thermal window was
energy were reduced across years to lower feed costs, which had negligible effects 2–4 days before egg-laying (Supplementary Fig. 1). Interestingly 2 days is also the
on fertility71,72. Maximum daily temperature records were obtained from a local time it takes for eggs to travel down the oviduct82,83. Egg mass was modelled using
weather station 600 m from the study site. Ethical clearance was obtained from the a Gaussian error distribution and the ranking of AIC was very sensitive to small
Western Cape Department of Agriculture (DECRA R12/48). model adjustments and extreme temperatures, reflecting the generally low effect of
temperature on this trait (Fig. 1 and see the section “Discussion”). Visual inspec-
tion revealed a consistent trend of increasing egg mass at extreme high tempera-
Reproductive data tures but not at intermediate to high temperatures (Fig. 1). To reduce the influence
Female gametic traits. Pairs were checked twice a day and any eggs were collected of these extreme data points, without removing the entire trend of what may be a
and weighed using an electronic balance (Mercer). This gave us an estimate of the true biological signal we removed the 0.5% hottest and the 0.5% coldest records in
daily changes in quantity and mass of female gametes, that could be directly this particular analysis. Several thermal windows prior to egg-laying appeared to
compared to daily temperatures. In two years the laying season was extended predict egg mass equally well, but we proceeded with 0–2 days before egg laying as
6 NATURE COMMUNICATIONS | (2021)12:666 | https://doi.org/10.1038/s41467-021-20937-7 | www.nature.com/naturecommunicationsNATURE COMMUNICATIONS | https://doi.org/10.1038/s41467-021-20937-7 ARTICLE
the critical window for this trait due to its proximity to day of laying (Supple- random effect. For egg-laying rates, egg mass, hatching success and offspring
mentary Fig. 1). For both hatching success (Binomial error distribution: number number, enclosure was also added as a random effect, since they were used
hatched vs. number not hatched) and the number of offspring (Binomial error repeatedly across years and varied in size and vegetation cover. The males used for
distribution: 2-day intervals with chicks vs. 2 days without chicks, chicks/2 days) sperm collection were kept in the same enclosures across years and therefore we
we used 0–4 days before egg laying as the critical thermal window as this included did not have enclosure as random effect in analyses of sperm traits (not possible to
all days used as predictors for egg mass and egg laying rate. In birds, spermato- separate individual from enclosure effects). The enclosures where males were kept
genesis is believed to range from 11 to 15 days84, and we therefore tested thermal for sperm collection are, however, extremely similar making it unlikely that this
windows from 15 days before to 5 days after ejaculation. The critical thermal was a significant source of error variance.
window for the number of sperm (Poisson distribution) was 2–4 days before
ejaculation, and while sperm viability (Binomial error distribution: number alive vs. Quantifying individual variation in resilience to temperature change. In all models
number dead) was also influenced by temperature during this time, the window the thermal stress index and type of stress (cold versus heat) was allowed to interact
4–6 days before ejaculation was a better predictor (Supplementary Fig. 2). How- with ostrich ID to model the individual variance (id). This was modelled as 3 × 3
ever, as results did not differ between the analyses of sperm viability detailed below unstructured variance–covariance matrix composed of the intercept (idint), slope
(random regression and character-state models) when using 2–4 vs. 4–6 days, we during cold stress (idsl-cold) and slope during heat stress (idsl-heat). Individual
used 2–4 days for consistency across traits. The critical thermal windows estimated repeatability (R) of trait values at the optimum temperature (Tstress = 0, 20 °C for
for sperm and egg traits are specific to this study. If other species are studied it will females and 26 °C for males) was then estimated as the proportion of intercept
be important to estimate these parameters using similar critical thermal window variance that is explained by the individual variance in intercepts:
analyses from time series datasets.
σ 2idint
Rint ¼ : ð1Þ
Thermal stress index. For each trait we modelled the response to increases and σ 2idint þ σ 2year þ σ 2enclosure þ σ 2res
decreases in temperature by creating cold and heat thermal stress indexes. This was
Individual variation in the cold and heat stress slopes was used as an estimate of
done by first estimating the temperature at which trait values were maximized
variation in resilience to increasing and decreasing temperatures, i.e. phenotypic
(thermal optimum), and secondly by calculating decreases (Tcold stress) and
plasticity. However, to estimate the repeatability of slopes for individuals
increases (Theat stress) away from this optimum. Using GLMs we modelled the
(consistency of individual by environment interaction; I × E), we constructed a
change in number of sperm and eggs produced as a response to AVG-TMAX (linear
second set of models. In these models a second 3 × 3 unstructured
and quadratic terms) of the critical thermal window, and extracted the parametric
variance–covariance matrix of individual by year (id-yr) combinations was added,
vertex as the thermal optimum (rounded to closest degree Celsius). For egg laying
allowing the repeatability of thermal plasticity within individuals across different
the optimum was estimated as AVG-TMAX = 20 °C (Supplementary Fig. 3), which
breeding years to be calculated. Variance in individual slopes is on a different scale
also reflects the centre of the TNZ of the emu40 (unknown for the ostrich). For the
to that of intercepts, and also dependent on the scaling of the temperature index.
number of sperm ejaculated the optimal temperature was estimated to be 26 °C
For these reasons we followed a recently introduced practice87,88 and estimated the
(Supplementary Fig. 4). As a result, Theat stress for females was from 20 to 45 °C and
repeatability of thermal slopes as the proportion of slope variance attributable to
for males it was from 26 to 45 °C. Tcold stress was from 20 to 10 °C for females and
between individual variance:
from 26 to 10 °C for males. The observed difference in thermal optima between
sexes is intriguing, but this dataset was not designed to robustly test for sex dif- σ 2idsl
ferences: the fitness of males and females are intertwined in the pairs and we have Rsl ¼ : ð2Þ
σ 2idsl þ σ 2idyr
no direct data on how solitary male sperm performance influenced female fitness. sl
To make the intercept of the statistical models represent the most benign tem- To quantify how much variation in each trait was explained by responses to
perature we subtracted the minimum stress value resulting in 0 being the new temperature we transformed the between individual and within individual slope
minimum (no stress) of the thermal stress index. The variance of slopes (see below) variance to the same scale as the intercept variances using σ 2E ¼ σ 2sl *varðxÞ, where
depends on the scale of the environmental parameter and we therefore standar- var(x) is the variance of the environmental variable, the temperature index89. We
dized this by dividing by the maximum of the range resulting in 1 being the then expressed this variation as a ratio of the total variance, including between
maximum deviation from 0. individual and within individual intercept variance as well as year, enclosure and
residual variance:
Modelling resilience to temperature change using random regression models. We σ 2idEhot þ σ 2idyrEhot þ σ 2idEcold þ σ 2idyrEcold
constructed random regression models in R v.3.6.085 using the Bayesian framework PSlopeVar ¼ : ð3Þ
σ 2idEhot þ σ 2idyr þ σ 2idEcold þ σ 2idyr þ σ 2idint þ σ 2idyr σ 2year þ σ 2enclosure þ σ 2residual
implemented in the R-package MCMCglmm v.2.2986. For both residual and ran- Ehot Ecold int
dom terms we used the weakly informative inverse-Gamma distribution (scale = It has recently been debated if the fixed effect variance should be included in (σ 2f )
0.001, shape = 0.001, i.e. V = n, nu = (n−1 + 0.002 with n being the dimension of the denominator when estimating R90. There are arguments for including fixed
the matrix) as priors. For female gametic traits, models were run for 10,000,000 effect variance if it captures natural variation and excluding it if it represents
iterations of which the initial 100,000 were discarded and only every 10,000th experimental variance91. For full transparency we chose to report estimates of
iteration was used for estimating posterior probabilities. For male gametic traits, σ 2f excluding variance from the thermal index (σ 2fthermal stress ) as this parameter has
models were run for 3,000,000 iterations, of which the initial 30,000 were discarded already been accounted for by the interaction with the random terms. We estimated
and only every 3000th iteration was used for estimating posterior probabilities. The fixed effect variance of all terms (σ 2fall ) and of thermal stress separately (σ 2fthermal stress )
number of iterations was based on inspection of autocorrelation among posterior following de Villemereuil et al. 91, such that σ 2fthermal stress ¼ σ 2fall σ 2fthermal stress .
samples in preliminary runs. Convergence of the estimates was checked by running
the model three times and inspecting the overlap of estimates in trace plots and the As egg laying, hatching success and number of offspring are modelled via a logit
level of autocorrelation among posterior samples. Posterior mode and 95% credible link function, estimates of R are calculated on the latent scale. While this scale has
intervals are reported for random effects, correlations and repeatability measures. the benefit of fulfilling the typical assumptions of parametric analyses, it may not
Models included the fixed effects of thermal stress (ranging from 0 to 1) and stress reflect the scale at which selection is working. Methods have therefore been
type (cold or heat). The interaction between thermal stress and stress type was developed to make inferences on the observed scale92. There are currently no
modelled with a common intercept for cold stress and heat stress, as the con- methods to perform this transformation for a model using a logit-link function and
struction of the thermal stress index dictated that these intercepts are identical. where the number of trials varies between data points. Instead it is possible to
For the three traits modelled with Binomial error distributions (egg laying, calculate estimates of repeatability on the expected scale (corresponding to the
hatching success and number of offspring) data were grouped into four hot and liability scale in a threshold model) according to equations in de Villemereuil et al. 92
three cold thermal stress classes, each representing the number of observations with using the R-package QGglmm92. Similar methods are not available for the slope
success (e.g. 2-day intervals with egg) and the number of observations with failure variance parameters presented below, and all estimates presented in the main
(e.g. 2-day intervals without egg). For female gametic traits we included the document are therefore on the latent scale for consistency. Where possible, we also
additional fixed effects of female subpopulation (South African Blacks: 476 females, provide estimates on the expected scale in the supplementary material
Zimbabwean Blues: 68 females or crosses: 108 females) and its interaction with the (Supplementary Tables 2–10).
thermal stress and stress type, as well as female age and the subpopulation of the
pair male. Results were highly consistent across subpopulations and we therefore Modelling resilience to temperature change using character-state models. As an
report fixed effect estimates from the most numerous subpopulation (South alternative modelling approach to random regression, we modelled changes in each
African Blacks) for brevity. Population-specific estimates are available in the results trait across three temperature categories (cold, benign and hot), using character-
tables provided in the supplementary information. The mass of eggs decreased with state models. For egg-related traits the ranges for these categories were limited by
the number of days since the previous egg (Supplementary Fig. 8). This was the lower number of cold compared to hot days, according to the thermal optimum
accounted for by including days since previous egg (linear and quadratic terms, cut-off used in the random regression analysis (20 °C). To avoid low replication in
log-transformed) as a fixed effect in the egg mass model. Several sperm- the cold category relative to hot days we assigned the lowest 50% of days classified
characteristics may peak at an intermediate age78, and therefore linear and as Tcold stress as cold (28.7 °C, neggs = 14,759), with the remainder being
environmental effects that differed across years, such as diet, by including year as a classified as benign (neggs = 56,297). Data on sperm traits had higher temperature
NATURE COMMUNICATIONS | (2021)12:666 | https://doi.org/10.1038/s41467-021-20937-7 | www.nature.com/naturecommunications 7ARTICLE NATURE COMMUNICATIONS | https://doi.org/10.1038/s41467-021-20937-7
values. We therefore increased the temperature cut-offs (cold: 29.7 °C, nejaculations = 392 and benign nejaculations = 1174). The models Daphnia. Nat. Clim. Change 5, 665–668 (2015).
were constructed in MCMCglmm v.2.2986 and followed the same general approach 8. Iossa, G. Sex-specific differences in thermal fertility limits. Trends Ecol. Evol.
as the random regression models described above. The major difference was that 34, 490–492 (2019).
temperature category was included as a fixed factor and the interaction between the 9. Walsh, B. S. et al. The impact of climate change on fertility. Trends Ecol. Evol.
random effect ostrich ID and temperature category was modelled as a 3 × 3 34, 249–259 (2019).
unstructured variance–covariance matrix composed of the cold, benign and hot 10. Vasudeva, R. et al. Adaptive thermal plasticity enhances sperm and egg
temperature categories. We also estimated the residual variance separately for each performance in a model insect. eLife 8, e49452 (2019).
temperature category (see Supplementary Tables 12–17 for further details on the 11. Hurley, L. L., McDiarmid, C. S., Friesen, C. R., Griffith, S. C. & Rowe, M.
model components). Experimental heatwaves negatively impact sperm quality in the zebra finch.
Proc. R. Soc. B 285, 20172547 (2018).
Modelling trade-offs between traits. To quantify correlations between female 12. Dahlke, F., Wohlrab, S., Butzin, M. & Pörtner, H. Thermal bottlenecks in the
gametic traits (egg mass vs. number of eggs with 0–4 days before egg laying as the lifecycle define climate vulnerability of fish. Science 369, 65–70 (2020).
critical thermal window) and between male gametic traits (sperm viability vs. 13. Bathiany, S., Dakos, V., Scheffer, M. & Lenton, T. M. Climate models
number of sperm with 2–4 days before ejaculation as the critical thermal window) predict increasing temperature variability in poor countries. Sci. Adv. 4, 1–11
two-trait models were used. These were setup using MCMCglmm v.2.2986 with the (2018).
same error distributions as the single-trait models. For female gametic traits, 14. Vázquez, D. P., Gianoli, E., Morris, W. F. & Bozinovic, F. Ecological and
models were run for 5,000,000 iterations of which the initial 100,000 were dis- evolutionary impacts of changing climatic variability. Biol. Rev. 92, 22–42
carded and only every 2000th iteration was used for estimating posterior prob- (2017).
abilities. For male gametic traits, models were run for 3,000,000 iterations, of which 15. Chevin, L.-M., Lande, R. & Mace, G. M. Adaptation, plasticity, and extinction
the initial 30,000 were discarded and only every 3000th iteration was used for in a changing environment: towards a predictive theory. PLoS Biol. 8,
estimating posterior probabilities. Each trait comparison was analysed with e1000357 (2010).
both random regression models and with character-state models, containing the 16. Sgrò, C. M. & Hoffmann, A. A. Genetic correlations, tradeoffs and
same fixed effects as the single-trait models, but with the reserved term “trait”
environmental variation. Heredity 93, 241–248 (2004).
interacted with all fixed effect components. Models also contained the same
17. Wood, C. W. & Brodie, E. D. Environmental effects on the structure of the G-
basic random effects as the single trait models, but with the random effects and
matrix. Evolution 69, 2927–2940 (2015).
residuals estimated separately for each trait. In the random regression models the
18. Brommer, J. E., Merila, J., Sheldon, B. C. & Gustavsson, L. Natural selection
interaction between ostrich ID and thermal stress was modelled by constructing
and genetic variation for reproductive reaction norms in a wild bird
two 4 × 4 unstructured variance–covariance matrices, one for Theat stress and one for
Tcold stress, composed of the intercept and slope for both traits. Two similar matrices population. Evolution 59, 1362–1371 (2005).
were constructed for the interaction between individual by year (id-yr) records and 19. Brommer, J. E., Rattiste, K. & Wilson, A. J. Exploring plasticity in the wild:
thermal stress. Using these matrices, we extracted covariance between traits in the laying date–temperature reaction norms in the common gull Larus canus.
response to heat or cold stress among and within individuals, which was then used Proc. R. Soc. B 275, 687–693 (2008).
to estimate correlations (correlation = covariancetrait1,trait2/sqrt(vartrait1*vartrait2)). 20. Nussey, D. H., Postma, E., Gienapp, P., Visser, M. E. & Gienapp, P. Selection
In the character-state models the interaction between ostrich ID and temperature on heritable phenotypic plasticity in a wild bird population. Science 310,
category was modelled by constructing three 2 × 2 unstructured 304–306 (2005).
variance–covariance matrices composed of either the cold, benign or hot thermal 21. Charmantier, A. et al. Adaptive phenotypic plasticity in response to climate
category for both traits. These matrices were used to extract covariance compo- change in a wild bird population. Science 320, 800–803 (2008).
nents between traits among individuals for a given thermal category, and use these 22. Matthysen, E., Adriaensen, F. & Dhondt, A. A. Multiple responses
to estimate correlations. Similar matrices were also used to model the residual to increasing spring temperatures in the breeding cycle of blue and
variance (within individuals) in the character-state models. great tits (Cyanistes caeruleus, Parus major). Glob. Change Biol. 17, 1–16
(2011).
23. Both, C. & Visser, M. E. Adjustment to climate change is constrained by
Reporting summary. Further information on research design is available in the Nature
arrival date in a long-distance migrant bird. Nature 411, 296–298 (2001).
Research Reporting Summary linked to this article.
24. Schiegg, K., Pasinelli, G., Walters, J. R. & Daniels, S. J. Inbreeding and
experience affect response to climate change by endangered woodpeckers.
Data availability Proc. R. Soc. B 269, 1153–1159 (2002).
The data that support the findings of this study are available from the Western Cape 25. Wilson, S., Norris, D. R., Wilson, A. G. & Arcese, P. Breeding experience and
Department of Agriculture in South Africa (WCDA). Restrictions apply to the use of population density affect the ability of a songbird to respond to future climate
these data, and so are not publicly available. Data are however available from the WCDA variation. Proc. R. Soc. B 274, 2539–2545 (2007).
upon request. Source data are provided with this paper. 26. Dunn, P. O. & Winkler, D. W. Climate change has affected the breeding date
of tree swallows throughout North America. Proc. R. Soc. B 266, 2487–2490
(1999).
Code availability 27. Hällfors, M. H. et al. Shifts in timing and duration of breeding for 73 boreal
The code used in this study is available as an R-file (Supplementary Code 1).
bird species over four decades. Proc. Natl Acad. Sci. USA 117, 18557–18565
(2020).
Received: 28 July 2020; Accepted: 4 January 2021; 28. Gienapp, P., Postma, E. & Visser, M. E. Why breeding time has not responded
to selection for earlier breeding in a songbird population. Evolution 60, 2381
(2006).
29. Jàrvinen, A. Global warming and egg size of birds. Ecography 17, 108–110
(1994).
30. Kitaysky, A. S. & Golubova, E. G. Climate change causes contrasting trends in
References reproductive performance of planktivorous and piscivorous alcids. J. Anim.
1. Angilletta, M. J. Thermal Adaptation: A Theoretical And Empirical Analysis Ecol. 69, 248–262 (2000).
(Oxford University Press, 2009). 31. Julliard, R., Clavel, J., Devictor, V., Jiguet, F. & Couvet, D. Spatial segregation
2. Chown, S. L., Sinclair, B. J., Leinaas, H. P. & Gaston, K. J. Hemispheric of specialists and generalists in bird communities. Ecol. Lett. 9, 1237–1244
asymmetries in biodiversity—a serious matter for ecology. PLoS Biol. 2, e406 (2006).
(2004). 32. Weatherhead, P. J. Effects of climate variation on timing of nesting,
3. Sunday, J. M., Bates, A. E. & Dulvy, N. K. Thermal tolerance and the global reproductive success, and offspring sex ratios of red-winged blackbirds.
redistribution of animals. Nat. Clim. Change 2, 686–690 (2012). Oecologia 144, 168–175 (2005).
4. Kellermann, V., van Heerwaarden, B., Sgrò, C. M. & Hoffmann, A. A. 33. Auer, S. K. & Martin, T. E. Climate change has indirect effects on resource use
Fundamental evolutionary limits in ecological traits drive Drosophila species and overlap among coexisting bird species with negative consequences for
distributions. Science 325, 1244–1246 (2009). their reproductive success. Glob. Change Biol. 19, 411–419 (2013).
5. Araújo, M. B. et al. Heat freezes niche evolution. Ecol. Lett. 16, 1206–1219 34. Riddell, E. A., Iknayan, K. J., Wolf, B. O., Sinervo, B. & Beissinger, S. R.
(2013). Cooling requirements fueled the collapse of a desert bird community from
6. García-Robledo, C., Kuprewicz, E. K., Staines, C. L., Erwin, T. L. & Kress, W. J. climate change. Proc. Natl Acad. Sci. USA116, 21609–21615 (2019).
Limited tolerance by insects to high temperatures across tropical elevational 35. Visser, M. E., Van Noordwijk, A. J., Tinbergen, J. M. & Lessells, C. M. Warmer
gradients and the implications of global warming for extinction. Proc. Natl springs lead to mistimed reproduction in great tits (Parus major). Proc. R. Soc.
Acad. Sci. USA 113, 680–685 (2016). B 265, 1867–1870 (1998).
8 NATURE COMMUNICATIONS | (2021)12:666 | https://doi.org/10.1038/s41467-021-20937-7 | www.nature.com/naturecommunicationsNATURE COMMUNICATIONS | https://doi.org/10.1038/s41467-021-20937-7 ARTICLE
36. Both, C., Bouwhuis, S., Lessells, C. M. & Visser, M. E. Climate change and 68. Nord, A. & Nilsson, J. Å. Heat dissipation rate constrains reproductive
population declines in a long-distance migratory bird. Nature 441, 81–83 investment in a wild bird. Funct. Ecol. 33, 250–259 (2019).
(2006). 69. Cloete, S. W. P. et al. Variance components for live weight, body
37. Magige, F. J., Stokke, B. G., Sortland, R. & Røskaft, E. Breeding biology of measurements and reproductive traits of pair-mated ostrich females. Br. Poult.
ostriches (Struthio camelus) in the Serengeti ecosystem, Tanzania. Afr. J. Ecol. Sci. 47, 147–158 (2006).
47, 400–408 (2009). 70. Rybnik, P. K., Horbanczuk, J. O., Naranowicz, H., Lukaszewicz, E. & Malecki,
38. Bertram, B. C. R. The Ostrich Communal Nesting System (Princeton University I. A. Semen collection in the ostrich (Struthio camelus) using a dummy or a
Press, New Jersey, 1992). teaser female. Br. Poult. Sci. 48, 635–643 (2007).
39. Kimwele, C. N. & Graves, J. A. A molecular genetic analysis of the communal 71. Brand, T. S., Olivier, T. R. & Gous, R. M. The response in food intake and
nesting of the ostrich (Struthio camelus). Mol. Ecol. 12, 229–236 (2003). reproductive parameters of breeding ostriches to increasing dietary energy.
40. Maloney, S. K. Thermoregulation in ratites: a review. Aust. J. Exp. Agric. 48, South Afr. J. Anim. Sci. 40, 434–437 (2010).
1293–1301 (2008). 72. Brand, T. S., Olivier, T. R. & Gous, R. M. The reproductive response of female
41. Hassan, S. M., Siam, A. A., Mady, M. E. & Cartwright, A. L. Egg storage period ostriches to dietary protein. Br. Poult. Sci. 56, 232–238 (2015).
and weight effects on hatchability of ostrich (Struthio camelus) eggs. Poult. Sci. 73. Martin, P. A., Reimers, T. J., Lodge, J. R. & Dziuk, P. J. The effect of ratios and
84, 1908–1912 (2005). numbers of spermatozoa mixed from two males on proportions of offspring. J.
42. Gonzalez, A., Satterlee, D. G., Moharer, F. & Cadd, G. G. Factors affecting Reprod. Fertil. 39, 251–258 (1974).
ostrich egg hatchability. Poult. Sci. 78, 1257–1262 (1999). 74. Birkhead, T. R. & Møller, A. P. Sperm Competition and Sexual Selection
43. Roff, D. A. & Wilson, A. J. Quantifying genotype-by-environment interactions (Academic Press, 1998).
in laboratory systems. In Genotype‐by‐Environment Interactions and Sexual 75. Birkhead, T. R. & Biggins, J. D. Sperm competition mechanisms in birds:
Selection (eds. Hunt, J. & Hosken, D.) 100–136 (John Wiley & Sons, Ltd, models and data. Behav. Ecol. 9, 253–260 (1998).
2014). 76. Soley, J. T. & Roberts, J. C. Ultrastructure of ostrich (Struthio camelus)
44. Christians, J. K. Avian egg size: variation within species and inflexibility within spermatozoa. II. Scanning electron microscopy. Onderstepoort J. Vet. Res. 61,
individuals. Biol. Rev. Camb. Philos. Soc. 77, 1–26 (2002). 239–246 (1994).
45. Lack, D. The Natural Regulation of Animal Numbers (Clarendon Press, 1954). 77. Lake, P. E. & Stewart, J. M. Artificial Insemination in Poultry. Ministry of
46. Perrins, C. M. The timing of birds‘ breeding seasons. Ibis 112, 242–255 (1970). Agriculture Fisheries and Food, Bulletin 213 (Her Majesty’s Stationery Office,
47. Sales, K. et al. Experimental heatwaves compromise sperm function and cause 1978).
transgenerational damage in a model insect. Nat. Commun. 9, 1–11 (2018). 78. Bonato, M., Malecki, I. A., Rybnik-Trzaskowska, P. K., Cornwallis, C. K. &
48. McAfee, A. et al. Vulnerability of honey bee queens to heat-induced loss of Cloete, S. W. P. Predicting ejaculate quality and libido in male ostriches: effect
fertility. Nat. Sustain 3, 367–376 (2020). of season and age. Anim. Reprod. Sci. 151, 49–55 (2014).
49. Pérez-Crespo, M., Pintado, B. & Gutiérrez-Adán, A. Scrotal heat stress effects 79. Bonato, M., Rybnik, P. K., Malecki, I. A., Cornwallis, C. K. & Cloete, S. W. P.
on sperm viability, sperm DNA integrity, and the offspring sex ratio in mice. Twice daily collection yields greater semen output and does not affect male
Mol. Reprod. Dev. 75, 40–47 (2008). libido in the ostrich. Anim. Reprod. Sci. 123, 258–264 (2011).
50. Hansen, P. J. Effects of heat stress on mammalian reproduction. Philos. Trans. 80. Muvhali, P. T. et al. Ostrich ejaculate characteristics and male libido around
R. Soc. B 364, 3341–3350 (2009). equinox and solstice dates. Trop. Anim. Health and Prod. 52, 2609–2619
51. Moreno, R. D., Lagos-Cabre, R., Bunay, J., Urzua, N. & Bustamante-Marin, X. (2020).
Molecular basis of heat stress damage in mammalian testis. In Testis: 81. Brand, Z., Cloete, S. W. P., Brown, C. R. & Malecki, I. A. Systematic factors
Anatomy, Physiology and Pathology (eds. Nemoto, Y. & Inaba, N.) 127–155 that affect ostrich egg incubation traits. South Afr. J. Anim. Sci. 38, 315–325
(Nova Science, 2012). (2008).
52. Karaca, A. G., Parker, H. M., Yeatman, J. B. & McDaniel, C. D. The effects of 82. Bronneberg, R. G. G. et al. The relation between ultrasonographic
heat stress and sperm quality classification on broiler breeder male fertility observations in the oviduct and plasma progesterone, luteinizing hormone
and semen ion concentrations. Br. Poult. Sci. 43, 621–628 (2002). and estradiol during the egg laying cycle in ostriches. Domest. Anim.
53. Mita, P., Hinton, B. T. & Dufour, J. M. The blood–testis and blood–epididymis Endocrinol. 32, 15–28 (2007).
barriers are more than just their tight junctions. Biol. Reprod. 84, 851–858 83. Van Schalkwyk, S. J., Cloete, S. W. P. & De Kock, J. A. Repeatability and
(2011). phenotypic correlations for body weight and reproduction in commercial
54. Smith, C. C. & Fretwell, S. D. The optimal balance between size and number of ostrich breeding pairs. Br. Poult. Sci. 37, 953–962 (1996).
offspring. Am. Nat. 108, 499–506 (1974). 84. Jones, R. C. & Lin, M. Spermatogenesis in birds. In Oxford Reviews of Reproductive
55. Ojanen, M. Composition of the eggs of the great tit (Parus major) and pied Biology, Vol. 15 (ed. Milligan, S. R.) (Oxford University Press, 1993).
flycatcher (Ficedula hypoleuca). Ann. Zool. Fenn. 20, 57–63 (1983). 85. R Core Team. R: A Language and Environment for Statistical Computing
56. Krist, M. Egg size and offspring quality: a meta-analysis in birds. Biol. Rev. 86, (R Core Team, 2020).
692–716 (2011). 86. Hadfield, J. D. MCMC methods for multi-response generalized linear mixed
57. Falconer, D. S. & Mackay, T. F. C. Introduction to Quantitative Genetics models: the MCMCglmm R package. J. Stat. Softw. 33, 1–22 (2010).
(Pearson, 1996). 87. Araya-Ajoy, Y. G. & Dingemanse, N. J. Repeatability, heritability, and age-
58. Lynch, M. & Gabriel, W. Environmental tolerance. Am. Nat. 129, 283–303 dependence of seasonal plasticity in aggressiveness in a wild passerine bird. J.
(1987). Anim. Ecol. 86, 227–238 (2017).
59. Gilchrist, G. W. Specialists and generalists in changing environments. I. 88. Araya-Ajoy, Y. G., Mathot, K. J. & Dingemanse, N. J. An approach to estimate
Fitness landscapes of thermal sensitivity. Am. Nat. 146, 252–270 (1995). short-term, long-term and reaction norm repeatability. Methods Ecol. Evol. 6,
60. Whitlock, M. C. The red queen beats the jack-of-all-trades: the limitations on 1462–1473 (2015).
the evolution of phenotypic plasticity and niche breadth. Am. Nat. 148, S65 89. Scheiner, S. M. Genetics and evolution of phenotypic plasticity. Annu. Rev.
(1996). Ecol. Syst. 24, 35–68 (1993).
61. Pen, I. & Weissing, F. J. Towards a unified theory of cooperative breeding: the 90. Wilson, A. J. Why h2 does not always equal VA/VP. J. Evol. Biol. 21, 647–650
role of ecology and life history re-examined. Proc. R. Soc. B 267, 2411–2418 (2008).
(2000). 91. de Villemereuil, P., Morrissey, M. B., Nakagawa, S. & Schielzeth, H. Fixed-
62. Emlen, S. T. The evolution of helping. I. An ecological constraints model. Am. effect variance and the estimation of repeatabilities and heritabilities: Issues
Nat. 119, 29–39 (1982). and solutions. J. Evol. Biol. 31, 621–632 (2018).
63. Rubenstein, D. R. Spatiotemporal environmental variation, risk aversion, and 92. de Villemereuil, P., Schielzeth, H., Nakagawa, S. & Morrissey, M. General
the evolution of cooperative breeding as a bet-hedging strategy. Proc. Natl methods for evolutionary quantitative genetic inference from generalized
Acad. Sci. USA 108, 10816–10822 (2011). mixed models. Genetics 204, 1281–1294 (2016).
64. Cornwallis, C. K. et al. Cooperation facilitates the colonization of harsh 93. BirdLife International. BirdLife International and Handbook of the Birds of the
environments. Nat. Ecol. Evol. 1, 0057 (2017). World. Bird Species Distribution Maps of the World (BirdLife International,
65. Rubenstein, D. R. & Lovette, I. J. Temporal environmental variability drives 2019).
the evolution of cooperative breeding in birds. Curr. Biol. 17, 1414–1419 94. Fick, S. E. & Hijmans, R. J. WorldClim 2: new 1-km spatial resolution climate
(2007). surfaces for global land areas. Int. J. Climatol. 37, 4302–4315 (2017).
66. Albright, T. P. et al. Mapping evaporative water loss in desert passerines
reveals an expanding threat of lethal dehydration. Proc. Natl Acad. Sci. USA
114, 201613625 (2017).
67. Vincze, O. et al. Parental cooperation in a changing climate: fluctuating Acknowledgements
environments predict shifts in care division. Glob. Ecol. Biogeogr. 26, 347–358 We are thankful to all the staff and workers at Oudtshoorn Research Farm for assistance
(2017). with data collection and maintenance of the birds and to the Western Cape Government
NATURE COMMUNICATIONS | (2021)12:666 | https://doi.org/10.1038/s41467-021-20937-7 | www.nature.com/naturecommunications 9You can also read