Does hydrostatic pressure influence lumpfish (Cyclopterus lumpus) heart rate and its response to environmental challenges?
←
→
Page content transcription
If your browser does not render page correctly, please read the page content below
Volume 9 • 2021                  10.1093/conphys/coab058

                                                                                                                              Research article

Does hydrostatic pressure influence lumpfish
(Cyclopterus lumpus) heart rate and its response

                                                                                                                                                             Downloaded from https://academic.oup.com/conphys/article/9/1/coab058/6325438 by guest on 12 September 2021
to environmental challenges?
Zoe A. Zrini*, Rebeccah M. Sandrelli and A. Kurt Gamperl

Department of Ocean Sciences, Memorial University, St. John’s, Newfoundland and Labrador, A1C 5S7, Canada
*Corresponding author: Department of Ocean Sciences, Memorial University, St. John’s, Newfoundland and Labrador, A1C 5S7, Canada.
Email: zoezrini@gmail.com

..........................................................................................................................................................

Studies on the effects of environmental changes with increasing depth (e.g. temperature and oxygen level) on fish physiology
rarely consider how hydrostatic pressure might influence the observed responses. In this study, lumpfish (Cyclopterus lumpus,
200–400 g), which can exhibit vertical migrations of over 100 m daily and can be found at depths of 500 m or more, were
implanted with Star-Oddi micro-HRT loggers. Then, their heart rate (f H ) was measured in a pressure chamber when exposed to
the following: (i) increasing pressure (up to 80 bar; 800 m in depth) at 10◦ C or (ii) increasing temperature (12–20◦ C), decreasing
temperature (12 to 4◦ C) or decreasing oxygen levels (101–55% air saturation at 12◦ C) in the absence or presence of 80 bar of
pressure. Additionally, we determined their f H response to chasing and to increasing temperature (to 22◦ C) at atmospheric
pressure. Pressure-induced increases in f H (e.g. from 48 to 61 bpm at 12◦ C) were associated with hyperactivity. The magnitude
of the rise in f H with temperature was greater in pressure-exposed vs. control fish (i.e. by ∼30 bpm vs. 45 bpm between 5◦ C
and 20◦ C). However, the relative increase (i.e. slope of the relationship) was not different between groups. In contrast, 80 bar
of pressure eliminated the small (5 bpm) increase in f H when control fish were exposed to hypoxia. Exhaustive exercise and
increasing temperature to 22◦ C resulted in a maximum f H of 77 and 81 bpm, respectively. Our research shows that pressure
influences the f H response to environmental challenges and provides the first evidence that lumpfish have a limited capacity
to increase f H .

Key words: Biologgers, heart rate, hydrostatic pressure, hypoxia, lumpfish, temperature
Editor: Steven Cooke
Received 18 January 2021; Revised 13 June 2021; Editorial Decision 27 June 2021; Accepted 5 July 2021
Cite as: Zrini ZA, Sandrelli RM, Gamperl AK (2021) Does hydrostatic pressure influence lumpfish (Cyclopterus lumpus) heart rate and its response to
environmental challenges?. Conserv Physiol 9(1): coab058; doi:10.1093/conphys/coab058.

..........................................................................................................................................................

Introduction                                                                  Andrzejaczek et al., 2019). However, due to the technical
                                                                              difficulties and high costs of gaining biological information
During vertical migrations to deeper waters, animals expe-                    while animals are under pressure (Guerrero et al., 2000;
rience large changes in environmental conditions such as                      Shillito et al., 2014), there is still very little known about
increases in hydrostatic pressure and reductions in tempera-                  the physiological responses of fish to changing environmental
ture, oxygen (hypoxia) and light (Gross and Jaenicke, 1994;                   conditions at depth (Andrzejaczek et al., 2019).

..........................................................................................................................................................
© The Author(s) 2021. Published by Oxford University Press and the Society for Experimental Biology.
This is an Open Access article distributed under the terms of the Creative Commons Attribution License (http://creativecommons.org/licenses/            1
by/4.0/), which permits unrestricted reuse, distribution, and reproduction in any medium, provided the original work is properly cited.
Research article Conservation Physiology • Volume 9 2021
..........................................................................................................................................................
The physiological capacity of animals to cope with changes As mature adults, lumpfish migrate into shallow coastal
in their environment can inform biologists and managers of waters in the spring and summer to reproduce. However, once
a species’ likelihood to be a ‘winner’ or ‘loser’ in the face of the young become juveniles, they migrate out to the open
ocean warming and the expansion of oxygen minimum zones ocean (Davenport, 1985). Most pelagic trawl records and
(Somero, 2010; Cooke et al., 2013). For example, changes in video images suggest that lumpfish reside in the upper 60 m
water temperature and oxygen levels have implications for of the ocean, but they have also been found at depths up to
future shifts in the bathymetric distribution of fish (Morris 1000 m (Blacker, 1983; Rosen and Holst, 2013; Rosen et al.,
et al., 2015; Andrzejaczek et al., 2019). Specifically, it is 2013). In addition, Kennedy et al. (2016) tagged Icelandic
primarily the capacity of the cardiovascular system that limits lumpfish with biologgers that recorded depth and temper-
the depth range of ecologically and economically important ature and they reported that the maximum recorded and
species such as tuna and billfishes (Brill et al., 1998). Further, extrapolated depth (based on temperature data) were 309 and
Downloaded from https://academic.oup.com/conphys/article/9/1/coab058/6325438 by guest on 12 September 2021
heart rate (f H ), cardiac output and the scope available for 498 m, respectively, and that this species regularly engaged in
f H may well determine the survival of fishes when exposed daily vertical migrations of greater than 100 m.
to abiotic and biotic challenges (Eliason et al., 2013; Farrell
and Smith, 2017). Thus, it is critical that we learn more about Given that lumpfish can be found at a variety of depths
the effects of these interacting variables on fish cardiovascular and that data on their cardiovascular physiology and envi-
function. ronmental tolerances are lacking, we set out to determine
how hydrostatic pressure influences their capacity to deal
Early research on the effects of hydrostatic pressure exam- with other abiotic factors. Star-Oddi micro-HRT loggers have
ined the tolerance and behavioural responses of a narrow been shown to provide reliable measurements of f H in other
range of fish species to acute increases in pressure (Brauer fish species (Brijs et al., 2019; Zrini and Gamperl, 2021)
et al., 1974; Macdonald et al., 1987). Since then, the field and would allow us to collect measurements of f H in a
has focused on the effects of acute and chronic pressure sealed pressure chamber (IPOCAMP, formally named ‘Incu-
increases on the metabolic response of various fish species bateur Pressurisé pour l’Observation et la Culture d’Animaux
(e.g. see Sébert and Barthélémy, 1985a, b; Sébert and Marins Profonds’). Considering the lack of information on
Macdonald, 1993; Speers-Roesch et al., 2004; Vettier et al., the effects of pressure on the cardiovascular system of fish,
2005, 2006). However, to our knowledge, no studies have we used these two unique pieces of equipment to examine:
measured the physiological response of fish to hypoxia (i) the f H response of lumpfish to increasing hydrostatic
in combination with pressure and very few studies have pressure up to 80 bar (800 m in depth); (ii) the effect of prior
examined the combined effects of temperature and pressure exposure to 80 bar on the post-chase f H of lumpfish; and
(Sébert et al., 1995a, b; Scaion et al., 2008a, b). Further, even (iii) the f H response to decreasing temperature (12 to 5◦ C),
less is known about its effects on the cardiovascular system, increasing temperature (12 to 20◦ C) or decreasing oxygen
and the published information is quite variable. For example, levels (101–55% air saturation at 12◦ C) in the absence and
some studies indicate that pressure causes tachycardia in fish presence of 80 bar of pressure. The experiment investigating
(Naroska, 1968 (c.f. Sébert and Macdonald, 1993); Sébert the effect of increased pressure and temperature (which would
and Barthélémy, 1985b), while others report bradycardia be unlikely to occur unless fish were in the proximity of
(Belaud et al., 1976; Pennec et al., 1988), and the mechanisms hydrothermal vents) was performed to more fully understand
mediating these effects are not yet known. how temperature and pressure interact in the control of f H in
fishes. In addition, we measured the lumpfish’s f H response
The common lumpfish (Cyclopterus lumpus) is an eco- during an acute warming protocol (increase by 2◦ C h−1 up
logically important marine species that is widely distributed to 22◦ C) at atmospheric pressure. This latter experiment was
on both sides of the Atlantic Ocean (Simpson et al., 2016; performed to determine if the limited maximum f H observed
Powell et al., 2017). Further, it is a commercially important for this species in the IPOCAMP was similar to that measured
species due to the demand for their role as a substitute for by a standard warming protocol.
sturgeon caviar, and their use as a cleaner fish in the Atlantic
salmon (Salmo salar) aquaculture industry (Imsland et al.,
2014; Powell et al., 2018). However, due to overfishing/ Materials and methods
harvesting, lumpfish have been designated as ‘Threatened’
by the Committee on the Status of Endangered Wildlife in Animal husbandry
Canada (COSEWIC, 2017). Information on the physiolog- All work described was approved by the Institutional Animal
ical limits of this species will be important for its future Care Committee of Memorial University (Protocol # 17-95-
conservation, and its proper management in the roe fishery KG) and followed the standards and guidelines outlined by
and in the aquaculture industry. However, there is a limited the Canadian Council on Animal Care.
understanding of the basic physiology of lumpfish and their
tolerance to different environmental conditions (Ern et al., The lumpfish used in these studies were reared at the
2016; Jørgensen et al., 2017; Hvas et al., 2018; Hvas and Ocean Science Centre (Memorial University; Newfoundland,
Oppedal, 2019). Canada) at 6◦ C. The lumpfish were then transferred to one
..........................................................................................................................................................
2Conservation Physiology • Volume 9 2021 Research article
..........................................................................................................................................................
of two 0.5-m3 tanks on 23 April 2018 (n = 56), 23 July 2018 inspection camera was inserted into one of the view ports in
(n = 22) and 16 January 2019 (n = 20) with densities never the lid of the IPOCAMP to record the behaviour and activity
exceeding 16.8 kg m−3 . Tanks were supplied with seawater of the fish during all experiments. Fibre-optic light sources
at ∼7.5◦ C and a 14-hour light:10-hour dark photoperiod. and red filters were inserted into the other two view ports to
The temperature in these tanks was raised at a rate of 0.5◦ C provide adequate light and to maintain photoperiod.
per day to 10 or 12◦ C, this difference in temperature due to
requirements of concurring projects in our multi-use facility. Experiment # 1: heart rate response to
Lumpfish were held at these temperatures for a minimum of hydrostatic pressure and the fish’s
14 days before use in experiments. maximum post-exercise heart rate
Logger implantation After implantation, lumpfish (n = 14, 0♀: 0♂: 3 immature: 11
not measured, 237.8 ± 5.3 g, 18.1 ± 0.3 cm, mean ± S.E.M.)
Downloaded from https://academic.oup.com/conphys/article/9/1/coab058/6325438 by guest on 12 September 2021
The Star-Oddi (Gardabaer, Iceland; see https://www.star-oddi. were returned to their tank for recovery. At 48 hours post-
com) micro-HRT logger (25.4 mm in length, 8.3 mm in diam- surgery, two fish were transferred to a container with mesh
eter, 3.3 g in air) records and stores f H , electrocardiograms sides (38.7 cm long × 24.8 cm wide × 29.2 cm deep) that was
(ECGs) and temperature. These loggers were programmed floating in the tank to be fasted for ∼66 hours before being
using the company’s Mercury software prior to implantation. transferred to the IPOCAMP. This was necessary as water
supplying the IPOCAMP passed through a fine filter that was
To prepare the loggers for implantation, 3-O silk suture
easily clogged by faecal matter. Then fish, two at a time, were
was tied around the body of the logger and the loggers
placed on the platforms of an insert that was lowered into the
and surgical equipment were cleaned and sterilized in 70%
IPOCAMP (Fig. S1) and acclimated to the chamber overnight
ethanol. The lumpfish were anaesthetized in seawater con-
at 10◦ C and at 0 bar of pressure.
taining 0.15 g l−1 of tricaine methanesulfonate (MS-222; Skar
et al., 2017). After losing equilibrium, the fish were moved Immediately following surgery, the pre-programmed
onto a wetted surgical sponge where their gills were irri- micro-HRT loggers saved ECGs and recorded f H (at 100 Hz
gated with flowing and aerated ∼10◦ C seawater containing for 6 seconds) and temperature every 4 hours during the
0.075 g l−1 of MS-222. A 1.5- to 2.0-cm mid-ventral incision recovery period. On the morning following acclimation to
was made in the fish’s body wall beginning immediately the IPOCAMP, the loggers began to save ECGs and record
posterior to the sucker. The logger was then inserted (blunt f H (100 Hz for 6 seconds) and temperature every 2 minutes.
end first) in a posterior direction and pulled anteriorly to Then, the lumpfish were exposed to 0 pressure (n = 6; for
within 0.5 cm of the pericardium using the anchoring suture. use as time-matched controls) or to increasing levels of
A cutting-edge needle was used to pass the suture through the hydrostatic pressure (n = 8). Hydrostatic pressure was initially
skin to secure the logger to the body wall at the anterior of increased to 20 bar over 2 minutes, then held at this pressure
the incision. Finally, the incision was closed with continuous for 8 minutes. Thereafter, pressure was increased to 35, 50, 65
stitches. One or two suture knots were also attached to the and finally to 80 bar using the same protocol. The lumpfish
dorsal muscle to allow for the identification of fish in their were then decompressed in the opposite sequence (see Fig. 1
holding tank. for a schematic representation of this experiment).
Following the experimental protocol, most lumpfish were
IPOCAMP set-up removed from the IPOCAMP and euthanized. However, four
Experiments # 1 and # 2 used IPOCAMP chambers (Autoclave, fish from each treatment were given 1 hour in the chamber
France; 19 l vessel, 60 cm high by 20 cm in diameter) for the pressure-exposed group to recover. Then, these fish
(Fig. S1). The temperature of the chambers was controlled by were placed into a tote (75 cm long × 40 cm wide × 45 cm
a heater/chiller that regulated the temperature of both the in- deep, 30 l) and continuously chased with a net for 1.5 minutes.
flowing water and of the glycol jacket that surrounded each Lumpfish were discouraged from attaching to the tote by con-
chamber. The water flowing into the IPOCAMPs came from stant poking/encouragement with the net. This allowed for an
a 50-l reservoir in which the oxygen level was controlled by estimation of the fish’s maximum f H in response to exercise
a fibre-optic oxygen probe connected to a Witrox 1 oxygen with and without prior exposure to pressure. However, no
system equipped with WitroxCTRL software and solenoid fish lost equilibrium during the chase or appeared to reach
valves (Loligo Systems, Denmark). This system regulated the complete exhaustion, and thus their maximum post-chase f H
reservoir’s water oxygen content within relatively narrow may not have been reached.
limits (±2% air saturation) by bubbling air or nitrogen into
the reservoir when water oxygen levels reached the lower Experiment # 2: influence of hydrostatic
and upper set points, respectively. These set points were pressure on heart rate and its response to
determined by monitoring the oxygen content in the water
leaving the chamber, as recorded by a Fibox 3 LCD oxygen
changes in temperature and hypoxia
metre (PreSens, Germany). A PT1000 probe was used to Lumpfish were recovered from surgery, fasted and trans-
measure temperature in the reservoir (±0.15◦ C), and a pipe ferred to the IPOCAMP chamber as described in Experiment
..........................................................................................................................................................
3Research article Conservation Physiology • Volume 9 2021
..........................................................................................................................................................
Downloaded from https://academic.oup.com/conphys/article/9/1/coab058/6325438 by guest on 12 September 2021
Figure 1: Protocols for compression and/or decompression in Experiment # 1 (dotted lines) and # 2 (solid lines). In Experiment # 1, control
lumpfish (grey lines) were held at 0 bar and the pressure-exposed fish (black lines) were compressed to 80 bar in a stepwise protocol and then
decompressed to 0 bar using the same protocol (110 total minutes; diamond represents end of experiment). In Experiment # 2, control fish were
held at 0 bar and pressure-exposed fish were compressed to 80 bar using the stepwise protocol and held at pressure. After 1 hour, control and
pressure-exposed fish were exposed to either: (a) decreasing temperature, (b) increasing temperature or (c) decreasing oxygen (340–350 total
minutes; circle represents end of experiment).
#
1, but at 12◦ C. The micro-HRT loggers were set to save Experiment # 3: the normobaric heart rate
ECGs and record f H (100 Hz for 6 seconds) and temper- response to increased temperature
ature every 4 hours on the day of being transferred to the
IPOCAMP, every 2 minutes during the increase in pressure Lumpfish (n = 12, 544.5 ± 19.1 g, 23.7 ± 0.4 cm) were
and when initially held at 80 bar (i.e. between 8:00 and implanted with loggers, four at a time, then returned to their
10:20 AM) and every 5 minutes for the rest of the duration holding tank for recovery for 72 hours. After recovery, the fish
of the experiment; the latter used to save logger memory and were transferred into individual buckets (26.5 cm in diameter
battery life. × 23.5 cm deep, 8 l) in a water bath with flowing seawater
and sufficient aeration to maintain water oxygen levels near
On the morning following acclimation to the IPOCAMP, 100% saturation. The lumpfish were given 24 hours at 12◦ C
lumpfish were exposed to increasing pressure to 80 bar to acclimate to the buckets, during which time, photoperiod
and acclimated at this pressure for 1 hour, or maintained was maintained at 14-hour light:10-hour dark.
at atmospheric pressure (0 bar, control fish) for the same
On the morning following transfer, the pre-programmed
total duration (Fig. 1). The lumpfish were then exposed to
micro-HRT loggers began saving ECGs and recording f H
one of the following treatments. In the first trial, lumpfish
(100 Hz for 6 seconds) and temperature every 5 minutes at
were exposed to decreasing temperature from 12◦ C to 5◦ C
8:00 AM. At 9:00 AM, water temperature was increased by
(n = 14, 7♀: 2♂: 3 immature: 2 not measured, 350.1 ± 12.4 g,
2◦ C h−1 to a maximum of 22◦ C (n = 8). Some lumpfish were
21.1 ± 0.2 cm). In the second trial, lumpfish (n = 15, 1♀: 0♂:
also held at 12◦ C to serve as time-matched controls (n = 4).
8 immature: 6 not measured, 404.9 ± 14.1 g, 21.2 ± 0.3 cm)
were exposed to increasing temperature from 12 to 20◦ C Following all experiments, the fish were euthanized in
(∼2◦ C lower than the previously calculated critical thermal 0.6 g l−1 MS-222 in order to perform post-mortem dissec-
maximum or CTMAX for lumpfish; Ern et al., 2016). The tions and recover the data. Post-mortem dissections were
rate of temperature change in both trials was ∼ 2◦ C h−1 . conducted to record the distance from the front of the logger
Finally, lumpfish (n = 16, 2♀: 6♂: 4 immature: 4 not measured, to the pericardium, the logger’s final position, to look for any
435.8 ± 23.9 g, 21.9 ± 0.4 cm) were exposed to decreasing signs of inflammation or infection and to determine sex based
oxygen from 100% to 50% air saturation (∼10% air on the absence (i.e. immature fish) or presence of ovaries or
saturation above their Pcrit calculated at 10◦ C; Ern et al., testes.
2016). Temperature and oxygen were not brought close to
the CTMAX or Pcrit of the lumpfish because they can attach
to the platforms with their suckers even when unconscious,
Calculation of heart rate parameters
making loss of equilibrium difficult to determine (Ern et All reported measurements of f H were calculated manually
al., 2016). In addition, decompression and removal of fish using a previously described method (Zrini and Gamperl,
from the pressure chamber takes a considerable amount 2021). Briefly, the average time between R wave peaks was
of time. This posed ethical concerns for the welfare of measured (in seconds), and then 60 was divided by this
the fish. number to obtain the fish’s f H in beats per minute (bpm).
..........................................................................................................................................................
4Conservation Physiology • Volume 9 2021 Research article
..........................................................................................................................................................
Quality index (QI) measurements for each ECG also were activity during pressure exposure was assessed using linear
provided by the Mercury software (with QI0 indicating very regressions. Lastly, the effect of resting f H on f H scope was
good quality, QI1 and QI2 indicating decreasing quality determined using linear regression.
and QI3 meaning that no R-R interval was detected). The
absolute difference between f H values calculated by the on- Linear regression analysis was also used to examine the
board logger algorithm and those manually calculated ranged relationships between f H and the percentage change in f H
from 0 to 389 bpm (avg. absolute difference: QI0 = 1.4 bpm, for each environmental parameter (decreased temperature,
QI1 = 9.1 bpm, QI2 = 15.9 bpm and QI3 = 21.9 bpm). When increased temperature, decreased oxygen and acute warm-
ECG artefacts made the PQRS complex unidentifiable, ing protocol on data up to 20.8◦ C), including determining
manual calculation was not possible and the data were whether the slopes and intercepts were different between
not included. Percentage change in f H was calculated for treatments. Finally, an LME model with temperature/oxygen
and treatment as fixed effects, an interaction term and fish as
Downloaded from https://academic.oup.com/conphys/article/9/1/coab058/6325438 by guest on 12 September 2021
each fish based on initial f H values in each experiment (e.g.
as a percentage of 0 or 80 bar values prior to changes in a random factor was used to assess changes in the percentage
temperature of oxygen level). Heart rate variability (HRV) of QI0 ECGs.
was calculated as the standard deviation of time between The LME models were performed in RStudio (v. 1.2.1335,
successive R wave peaks (in ms). Heart rate scope (bpm) RStudio Inc., Boston, MA, USA; http://www.rstudio.com) with
was determined in the pressure-exposed fish (Experiments # 1 the nlme package (Pinheiro et al., 2020), while the other
and # 2) as the difference between mean f H at 0 bar and that analyses were performed using Prism 7 (GraphPad Software,
measured once 80 bar was reached. Inc., San Diego, CA, USA). Assumptions of normality, homo-
geneity and independence were analysed by visual inspection
Lumpfish activity of Q-Q plots and histograms of the residuals, residual-fit
Video was recorded during all experiments by connecting the plots and residual lag plots, respectively, for data analysed in
pipe inspection camera in the view ports of the IPOCAMP’s RStudio. The estimated marginal means, or emmeans, pack-
lid to a laptop running VideoVelocity (CandyLabs, Vancouver, age (Singmann et al., 2019) was used to perform Bonferroni
Canada). From these videos, the activity of all individuals post-hoc tests on all LME models and Tukey’s multiple com-
was scored by assigning fish with a rank for each 10-minute parison tests were performed following one-way ANOVAs.
period during exposure to pressure: 0 represented fish that The level of statistical significance was P < 0.05. All values
were completely inactive; 1 represented fish that were mostly presented in the text are means ± standard errors of the mean
inactive but had some spontaneous activity; 2 represented (S.E.M.).
fish that were mostly active, but had some periods of rest;
and 3 represented fish that were active for the entire 10-
minute period. Activity was ranked for all pressure steps in Results
Experiments # 1 and # 2.
Heart rate recovery and diel patterns
Statistical analyses post-surgery
To assess the effects of surgical recovery on f H , linear mixed- Following implantation of the micro-HRT loggers, the f H of
effects (LME) models were used with photoperiod (day time lumpfish recovering in the holding tank at 10◦ C was recorded
between 6:00 AM and 7:59 PM and night time between for 5 days (Fig. 2A). Average daily f H decreased significantly
8:00 PM and 5:59 AM) and day (where N1 was the first night during the recovery period (P < 0.0001; Fig. 2B; Table S1),
following surgery and D1–D5 represent the subsequent days) from 61.8 ± 0.9 and 59.1 ± 1.1 bpm (day-time and night-time
as the fixed-effects, an interaction term, and fish as a random values) on the first day to 54.4 ± 0.9 and 51.9 ± 1.0 bpm on
factor. the final day of recovery. There was also a significant effect
of photoperiod (P = 0.0015). However, the diel variation was
The effects of pressure on f H , the percentage change in f H , relatively small (2–4 bpm) and only significant on the first day
HRV, activity rank and the percentage of good quality (i.e. post-surgery.
QI0 ) ECGs were assessed using LME models with pressure
step (0, 20, 35, 50, 65 and 80 bar, and either the reverse Experiment # 1: the heart rate response to
during decompression or 10-minute increments when pres- hydrostatic pressure and the fish’s
sure was held at 80 bar) and treatment (control fish at 0 bar
or pressure-exposed fish) as the fixed effects, an interaction
maximum post-exercise heart rate
term and fish as a random factor. For all pressure-exposed Heart rate, the percentage change in f H , activity, HRV and
fish in Experiments # 1 and 2, the effects of sex (immature, percentage of QI0 ECGs remained constant in the control
female, male), temperature (10◦ C or 12◦ C) and activity rank fish (Fig. 3). At 10◦ C, hydrostatic pressure had a significant
at 0 bar on resting f H (at 0 bar) or f H scope (0 vs. 80 bar) effect on f H and the percentage change in f H (P = 0.0025;
were analysed by one-way ANOVAs and unpaired t-tests, P = 0.0012; Table S2). Heart rate began to increase between
while their relationship with weight (g), length (cm) and 35 and 50 bar, and while further increases were limited, f H
..........................................................................................................................................................
5Research article Conservation Physiology • Volume 9 2021
..........................................................................................................................................................
Downloaded from https://academic.oup.com/conphys/article/9/1/coab058/6325438 by guest on 12 September 2021
Figure 2: Moving average (A) and average (B) heart rate (f H , bpm) values in free-swimming lumpfish (n = 14) recorded every 4 hours for 5 days
following the surgical implantation of the Star-Oddi micro-HRT logger. After 48 hours (dotted line), two lumpfish were transferred to containers
inside the tank to be fasted for an additional ∼66 hours. (A) Fish were on a 14-hour light:10-hour dark photoperiod (grey bars represent periods
of darkness/night-time). (B) Open symbols represent day-time, while dark symbols represent night-time values. Dissimilar lower-case letters
indicate a significant difference within a photoperiod group (for night-time values the letters are bolded), while an asterisk represents a
significant difference between day-time and night-time values at each measurement point. The symbols represent means ± S.E.M. with each
value representing the average of 3 data points per fish. Note: N1 was not included in the analysis.
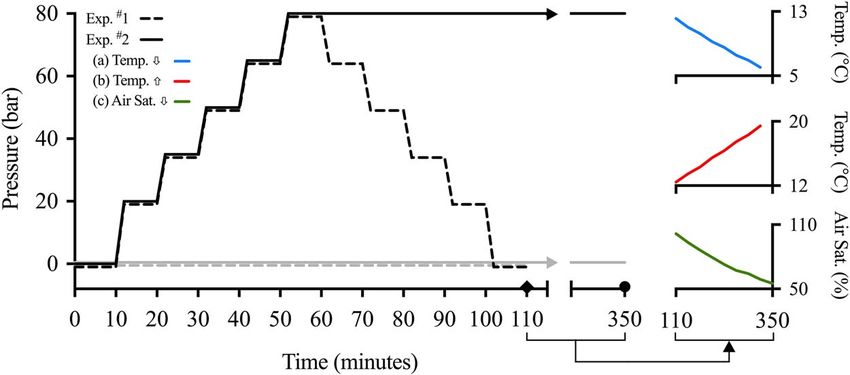
reached 61.5 ± 1.7 bpm (129.1 ± 3.8% of initial values) by Experiment # 2: influence of hydrostatic
80 bar as compared to 48.1 ± 1.4 bpm in the control fish at pressure on the heart rate response to
the same time point (Fig. 3A). The lumpfish’s f H remained
elevated during decompression. Following removal from changes in temperature and hypoxia
the IPOCAMP, maximum post-exercise f H was 73.2 ± 1.4 At 12◦ C, the effects of hydrostatic pressure were similar to
and 76.8 ± 1.2 bpm (in control and pressure-exposed fish, those at 10◦ C. However, f H began to increase at 35 bar
respectively), suggesting that the pressure-induced increase instead of 50 bar (Fig. 3B). Heart rate was significantly ele-
in f H was only ∼47% of the fish’s scope for increases in vated by hydrostatic pressure (P = 0.0053) throughout the
f H (Fig. 3A). Pressure significantly increased the activity period of exposure, and this was also reflected in values of f H
of the fish exposed to 80 bar (P = 0.0006; Fig. 3E). At when expressed as a percentage of initial values (P < 0.0001
0 bar, pressure-exposed fish had an average activity rank for both parameters; Table S3). Heart rate did not change
of 0.63 ± 0.18 and fish were either not moving (rank = 0) or over the experiment in control fish. When pressure reached
swimming very little (rank = 1). Initial increases in activity 80 bar, f H was 67.7 ± 1.6 bpm compared to 57.7 ± 1.7 bpm
began immediately upon compression, and activity rank in control fish at the same sampling point (i.e. 121.1 ± 4.1%
peaked at 50 bar at 2.38 ± 0.18. Activity gradually decreased of initial values) and f H remained elevated above control
to normal levels during decompression. values after 1 hour of acclimation to 80 bar. Similar to
Experiment # 1, the lumpfish were significantly more active
Overall, treatment did not significantly affect HRV or the when exposed to increased pressure (P < 0.0001). Activity
quality of ECGs (P = 0.2932 and P = 0.0519, respectively; peaked at 2.35 ± 0.12 at 80 bar and remained elevated for
Table S2). However, there was a significant interaction the 50 minutes of exposure to 80 bar of pressure.
between treatment and ‘pressure step’. In the pressure-
exposed group, HRV decreased from 100.9 ± 14.5 ms at the When data from fish in Experiments # 1 and # 2 were
beginning to 71.4 ± 13.5 ms at 80 bar and to 57.6 ± 8.5 ms combined, weight and length had no effect on resting f H (i.e.
after decompression (Fig. 3G). Interestingly, HRV spiked values at 0 bar), but sex significantly affected this parame-
to ∼173 ms at 35 bar, this value significantly higher than ter (P = 0.015), with females having a 14.6- and 14.1-bpm
measured in the control group at this pressure. The percentage higher f H than immature or male fish, respectively (P = 0.014
of QI0 ECGs fell from 0 to 50 bar, and then gradually returned and P = 0.092; Fig. S2; Table S4). Neither weight, length, sex,
to initial values; the values at 35 and 50 bar were significantly temperature nor activity affected the f H scope between 0 and
different from that of the control group at these pressures 80 bar (P > 0.05; Fig. S2; Table S4). However, this f H scope
(Fig. 3H). Interestingly, 35–50 bar of pressure corresponded was negatively correlated with resting f H , with fish with high
to the beginning of f H increases, and the relationship between f H values at 0 bar having a smaller increase in f H , or a
the percentage of QI0 values and pressure was a mirror image decrease in f H , in response to pressure-exposure (P < 0.0001;
of that for activity. Fig. S2; Table S4).
..........................................................................................................................................................
6Conservation Physiology • Volume 9 2021 Research article
..........................................................................................................................................................
Downloaded from https://academic.oup.com/conphys/article/9/1/coab058/6325438 by guest on 12 September 2021
Figure 3: Lumpfish were held in the IPOCAMP at atmospheric pressure (0 bar, grey symbols) or exposed to hydrostatic pressure in a step-wise
protocol (black symbols). Pressure was initially increased to 20 bar over 2 minutes, then held for 8 minutes. Pressure was then increased in a
similar manner to 35, 50, 65 and 80 bar, followed by decompression in the opposite sequence (A, C, E, G, H; controls and 8 pressure exposed) or
held at 80 bar for 1 hour (B, D, F; 19 controls and 23 pressure exposed). Heart rate (f H in bpm; A and B), the percentage change in f H (as a % of
resting values at 0 bar; C and D) and HRV (in ms; G) were manually calculated from ECGs and the percentage of QI0 ECGs (H) were provided by
the Star-Oddi Mercury software. The average activity rank (E and F) was determined from video recordings; where 0 represents fish that were
completely inactive, 1 represents fish that were mostly inactive but had some spontaneous activity, 2 represents fish that were mostly active but
had some periods of inactivity and 3 represents fish that were active for the entire 10-minute period. Maximum f H post-chase following removal
from the IPOCAMP is represented as a grey (control; n = 4) or line in panel A. Dissimilar lower-case letters indicate a significant difference within
the pressure-exposed group (no differences existed in the control group), while an asterisk indicates a significant difference (P < 0.05) between
the pressure-exposed and control groups at a particular pressure step. Data were recorded every 2 minutes and the symbols represent means ±
S.E.M (5 per fish).
..........................................................................................................................................................
7Research article Conservation Physiology • Volume 9 2021
..........................................................................................................................................................
Downloaded from https://academic.oup.com/conphys/article/9/1/coab058/6325438 by guest on 12 September 2021
Figure 4: Lumpfish held at atmospheric pressure (grey symbols; 7 per experiment) or exposed to 80 bar of pressure (black symbols; 7 per
experiment) were exposed to decreasing (at 2◦ C h−1 ; A, C, E) or increasing (at 2◦ C h−1 ; B, D, F) temperature in the IPOCAMP chamber. Heart rate
(f H in bpm; A and B) and the percentage change in f H (as a % of resting values at 0 or 80 bar; C and D) were manually calculated from the ECGs.
An asterisk indicates a significant difference between the slopes for relationships between control and pressure-exposed groups. The
percentage of QI0 ECGs (E and F) was provided by the Star-Oddi Mercury software. In these panels, significant differences within the control
(regular letters) or pressure-exposed groups (bold letters) are represented by dissimilar lower-case letters and an asterisk indicates a significant
difference (P < 0.05) between the pressure-exposed and control groups at a particular temperature step. Data were recorded every 5 minutes,
and the symbols represent means ± S.E.M (6 values per fish).
In control and pressure-exposed fish, f H fell with decreas- values, and the slopes of the relationships between relative f H
ing temperature (P < 0.0001 and P < 0.0001, respectively; (as a percentage of the initial value) and temperature, were
Fig. 4A; Table S5). The f H of pressure-exposed fish was not significantly different between the control and pressure-
7.0 bpm higher than that of control fish before the exposed groups (Fig. 4A; Table 1).
temperature began to decrease (i.e. at 80 bar), and the
slopes of the relationship between f H and temperature were Heart rate was 16.0 bpm higher in the pressure-exposed
significantly different (P = 0.007; Table S5) as f H in both group before temperature was raised and increased in
groups was 38–39 bpm at ∼5.7◦ C. In contrast, the Q10 both control and pressure-exposed fish with temperature
..........................................................................................................................................................
8Conservation Physiology • Volume 9 2021 Research article
..........................................................................................................................................................
Table 1: Summary of Q10 and average maximum values of f H recorded in lumpfish
Experiment Location Treatment Maximum f H (bpm) Temperature (◦ C) Q10
#
1 Bucket Chase – Control 73 10 -
Chase – Pressure 77 10 -
#
2 IPOCAMP Control - 12.2–6.1 2.10
Pressure - 12.0–5.9 2.07
#
2 IPOCAMP Control 64 12.4–19.3 1.37
Pressure 83 12.5–19.6 1.39
Downloaded from https://academic.oup.com/conphys/article/9/1/coab058/6325438 by guest on 12 September 2021
#
3 Bucket Acute Warming 81 12.3–20.8 1.67
(P < 0.0001 and P < 0.0001, respectively; Fig. 4B). The than the corresponding value reached in fish held at atmo-
slope of this relationship was significantly greater in the spheric pressure in the IPOCAMP (∼64 bpm at 19.6◦ C), but
pressure-exposed group (P = 0.0078; Table S5). However, the comparable to the maximum f H recorded for lumpfish at
Q10 values for f H (1.37 and 1.39) and the slopes of the 80 bar (∼83 bpm at 19.6◦ C). Increasing temperature also
relationships between temperature and relative f H (i.e. as resulted in a significant decrease in the percentage of QI0
a percentage of initial values) were again not significantly ECGs; this value being significantly lower than the time-
different (P = 0.1069). When the two temperature challenges matched control group at temperatures >15◦ C (P = 0.0041;
are considered together, the f H of control and pressure- Fig. 6C; Table S6). Overall, the percentage of QI0 values
exposed lumpfish increased from 38 to 64 bpm and 39 to decreased from 45.8% at 12.3◦ C to 1.8% at 21.6◦ C (com-
83 bpm, respectively, from 5 to 20◦ C. pared to 41.7% and 67.9% in the time-matched controls).
When held at atmospheric pressure in the IPOCAMP, the
f H of lumpfish increased slightly with decreasing oxygen
(P < 0.0001; Fig. 5A; Table S5), i.e. from 58.7 ± 3.2 bpm at Discussion
106% air sat. to 62.3 ± 2.9 bpm at 57% air sat. However,
Post-surgical recovery and diel patterns in
exposure to 80 bar of hydrostatic pressure eliminated the
effect of decreasing oxygen level, i.e. f H remained unchanged heart rate
from 103% to 57% air sat. (P = 0.7859). The same rela- While not a primary goal of this research, the f H of lump-
tionships were evident when f H data was calculated as a fish was recorded following the implantation of micro-HRT
percentage of initial values (Fig. 5B; Table S5). loggers to monitor recovery. This is because netting, handling,
anaesthesia and surgery induce a physiological stress response
Hydrostatic pressure had a significant effect on the
in fish leading to increased f H (Altimiras and Larsen, 2000;
percentage of QI0 ECGs during the decreasing oxygen
Hill and Forster, 2004; Rothwell et al., 2005; Gräns et al.,
experiment (P = 0.0292; Table S6), but not in the decreasing
2014). Initially, the day-time f H of lumpfish was 62 bpm,
or increasing temperature experiments (P = 0.9784 and
but this value was ∼60 bpm after 48 hours of recovery and
P = 0.1939, respectively). On average, QI0 ECG values
54 bpm by 5 days (at 10◦ C). Given the limited maximum f H
were ∼25% fewer in pressure-exposed fish compared to
in this species (∼80 bpm, see below), it might be expected
control fish in the hypoxia experiment (48.4% vs. 23.6%).
that they would have a low resting f H so that they would
Conversely, decreasing or increasing temperature, but not
have a scope for f H comparable to other teleost species (1.8-
decreasing oxygen (P < 0.0001, P < 0.0001 and P = 0.2698,
to 2.6-fold increase in f H during CTMAX tests; Gollock et al.,
respectively; Fig. 4E and F; Fig. 5C) strongly affected the
2006; Clark et al., 2008; Vornanen et al., 2014; Penney et al.,
quality of the ECGs. Overall, the percentage of QI0 ECGs
2014; Motyka et al., 2017). These data may indicate that the
fell from 72.6% at 6.0◦ C to 12.3% at 19.4◦ C.
lumpfish had not fully recovered from surgery and that this
explains their high resting f H . This would agree with recent
Experiment # 3: the normobaric heart rate research on Atlantic salmon showing that while f H decreases
response to increased temperature most during the first week post-implantation it continues to
fall for 2–3 weeks post-surgery (Hvas et al., 2020; Zrini and
When lumpfish underwent an acute warming protocol under Gamperl, 2021). However, it is also possible given the low
normobaric conditions, f H was 52.4 ± 2.5 bpm at 12.3◦ C, aerobic scope and Ucrit of this species (Hvas et al., 2018) that
peaked at 81.0 ± 3.6 bpm at 20.8◦ C (P < 0.0001) and then a large scope for f H is not required.
declined to 71.7 ± 3.6 bpm by 22.1◦ C (a scope of ∼29 bpm
between 12.3◦ C and 20.8◦ C; Q10 = 1.67) (Fig. 6A; Table 1; Overall, there was a significant effect of photoperiod on the
Table S5). This value for maximum f H was ∼17 bpm higher f H of lumpfish during the recovery period (Fig. 2). However,
..........................................................................................................................................................
9Research article Conservation Physiology • Volume 9 2021
..........................................................................................................................................................
Downloaded from https://academic.oup.com/conphys/article/9/1/coab058/6325438 by guest on 12 September 2021
Figure 5: (A) Heart rate (f H , bpm) and (B) the percentage change in
f H (as a % of initial values at 0 or 80 bar) in lumpfish exposed to
decreasing oxygen levels (air saturation, %) in the IPOCAMP chamber Figure 6: (A) Heart rate (f H , bpm) and (B) the percentage change in
over 3–4 hours. Prior to the decrease in oxygen levels, lumpfish were f H (as a % of initial values at 12.2◦ C) in lumpfish during an acute
held at atmospheric pressure (black circles; n = 8) or exposed to warming protocol (black symbols; n = 12) in a water table, where
80 bar of pressure (grey circles; n = 8). An asterisk represents a temperature was increased at 2◦ C h−1 vs. when fish were held at a
significant difference in the slopes of the relationships between constant temperature of 12◦ C (grey symbols; n = 4). An asterisk
control and pressure-exposed lumpfish. (C) The percentage of QI0 indicates a significant difference (P < 0.05) in the slopes between
ECGs were provided by the Star-Oddi Mercury software, and in this control fish and those exposed to increasing temperature. (C) The
panel, an asterisk represents a significant difference between percentage of QI0 ECGs was provided by the Star-Oddi Mercury
pressure-exposed and control groups at a particular oxygen level. software. In this panel, significant differences within the warming
Within each treatment group, there were no differences in the quality group (there were no differences in the control group) are
of ECGs. Data were recorded every 5 minutes, and the symbols represented by dissimilar lower-case letters, and an asterisk
represent means ± S.E.M (6 values per fish). represents a difference between the warming and control group at a
particular temperature. Data were recorded every 5 minutes, and the
symbols represent means ± S.E.M (6 per fish). The dotted line
indicates the temperature of 20.8◦ C. Beyond this temperature the f H
day-time values were only significantly different than night- of the lumpfish began to decrease, and thus, these data were not
time values on the first day post-surgery, and diel variations included in the linear regression.
in f H were relatively small (2 to 4 bpm). Conversely, Atlantic
salmon had average diel variations of 7 bpm (and up to that were synchronous with changes in swimming activity
14 bpm) at similar temperatures and time points post-surgery (Zrini and Gamperl, 2021). It is possible that the dampened
..........................................................................................................................................................
10Conservation Physiology • Volume 9 2021 Research article
..........................................................................................................................................................
diel variations in f H were related to low day-time activity in f H induced by hydrostatic pressure was only ∼47% of
of the lumpfish; however, this parameter was not monitored the available scope for f H . Again, this is consistent with
in this study. While limited evidence suggests that lumpfish Sébert and Barthélémy (1985b) who reported that while the
behave diurnally (Imsland et al., 2015; Leclercq et al., 2018), maximum temperature-induced f H in eels is ∼120 bpm, f H
further investigation is needed to understand diel patterns of when exposed to ∼101 bar did not exceed 60 bpm. These
behaviour and physiology in this species, especially given the data indicate that fish at high pressure (at least those whose
flexibility of these characteristics. life history includes excursions to the applied pressures) still
have a considerable scope available for increases in f H .
Heart rate response to hydrostatic pressure Many authors attribute the reported increases in ṀO2
The primary goal of this research was to investigate the effect to a simultaneous increase in motor activity during com-
Downloaded from https://academic.oup.com/conphys/article/9/1/coab058/6325438 by guest on 12 September 2021
of hydrostatic pressure on the f H of lumpfish. In response pression (Sébert and Barthélémy, 1985a; Simon et al., 1989;
to an acute exposure to 80 bar of pressure, the f H of 10◦ C- Sébert et al., 1997; Vettier et al., 2003), which Speers-Roesch
acclimated lumpfish increased by ∼14 bpm (20–30%) above et al. (2004) suggested was partially related to compression
resting values (Fig. 3A and C). Further, this tachycardia was of the swim bladder in bloater, and thus a loss of buoyancy.
sustained during 1 hour at 80 bar (Fig. 3B and D) and only Lumpfish do not possess a swim bladder (Powell et al., 2017)
diminished slightly during decompression. Previous research and were supported by a platform in the pressure chamber.
on this topic is extremely limited, possibly due to technical Nonetheless, they became agitated and more active during
limitations (Guerrero et al., 2000). However, our results are compression and this hyperactivity was maintained for 1 hour
generally consistent with other studies that have measured the at 80 bar (see Fig. 3E and F); a behavioural response that may
effect of hydrostatic pressure on f H in fishes at temperatures simply be an attempt to escape this novel situation. Sébert and
within the middle of a species’ thermal range. For example, Barthélémy (1985b) found that increases in motor activity
Sébert and Barthélémy (1985b) reported that (i) exposure during compression in eels were associated with tachycardia.
to ∼101 bar of pressure increased the f H of freshwater eels These data strongly suggest that increased activity was pri-
acclimated to 15–20◦ C by ∼30–80% and that tachycardia marily responsible for the increase in f H with pressure expo-
was sustained during the 1 hour of pressure exposure; and sure. However, it is also possible that the observed tachycardia
(ii) while f H did fall to some degree during decompression, was in part related to alterations in the neurohormonal con-
it was still not back to pre-exposure levels by 1 hour. Also, trol of f H . This conclusion is based on three lines of evidence.
Naroska (1968) showed that abrupt compression to ∼50 bar First, exposing isolated eel hearts (which are free of neurohor-
produced a transient tachycardia in 5◦ C eel pout (Zoarces monal control) to increased pressure resulted in a pronounced
viviparous) and Belaud et al. (1976) found that pressure bradycardia, not tachycardia (Pennec et al., 1988). Second,
induced a tachycardia below the temperature of 24.5◦ C in eels Belaud et al. (1976) and Sébert and Barthélémy (1985b)
(c.f. Sébert and Macdonald, 1993). Further, our results agree show that atropine, and adrenergic agonists and antagonists,
with studies on the effects of pressure on oxygen consumption markedly alter the magnitude of the tachycardic response
(ṀO2 ) in a variety of teleost species (reviewed in Sebert and when eels are exposed to increased hydrostatic pressure.
Macdonald, 1993). While the relationship between ṀO2 and Third, HRV was considerably lower in the pressure-exposed
f H can be influenced by changes in stroke volume (Farrell group near the end of the compression period at 80 bar
and Smith, 2017), this latter data is still highly relevant to our and remained lower during decompression (Fig. 3G). The
conclusions (Armstrong, 1986; Lucas, 1994); especially given mechanisms involved in pressure-induced increases in f H
the limited f H data on the following topics. require investigation but could be related to alterations in
cholinergic or adrenergic tone, or receptor function/affinity
With regards to the pressure at which increases in f H associated with changes in pacemaker cell membrane fluid-
begin in fishes, the data are difficult to compare as the ity (Sébert and Barthélémy, 1985b). Further, several studies
maximum hydrostatic pressure the fish is exposed, the rate have provided evidence that a pressure-induced decrease in
of compression and temperature all influence the f H response membrane fluidity, or ‘rigidification’, results in ‘compression-
to increased pressure (Sébert and Macdonald, 1993). In this induced histotoxic hypoxia’ in fish (Sébert and Barthélémy,
study, f H began to increase between 30 and 50 bar and this is 1985a; Sébert et al., 1987; Sébert et al., 1993). However,
consistent with Sébert and Barthélémy (1985b) where, after this latter hypothesis/phenomenon is controversial and is not
no change or a brief bradycardia in some eels, f H began supported by data on the ṀO2 of permeabilized red muscle
to increase at 40 to 50 bar. In contrast, the pressure at fibres (Scaion et al., 2008b) or blood PO2 (Sébert et al., 1997).
which the ṀO2 of male and female eels began to increase
was between 50 and 80 bar (Scaion et al., 2008a), and By combining the data from all of the pressure-exposed
Speers-Roesch et al. (2004) demonstrated that pressures as experiments, it was possible to also investigate the influence
low as 3 bar increased ṀO2 in the bloater (Coregonus hoyi). of acclimation temperature, sex, mass, length and activity on
The latter data suggest that the normal depth range of a given the initial f H and scope for f H in response to compression
species likely has a significant effect on the sensitivity of their (Fig. S2). Despite females having a higher resting f H , we
responses to increasing pressure. In this study, the increase report that sex, weight, length and activity did not affect the
..........................................................................................................................................................
11Research article Conservation Physiology • Volume 9 2021
..........................................................................................................................................................
scope for f H during compression. The lack of an effect of in the control fish (Fig. 5). This is an interesting observation,
sex on pressure-induced physiology in lumpfish at 10–12◦ C is and while the mechanism(s) mediating this difference is/are
consistent with the ṀO2 data for eels at temperatures below unknown, these data suggest that fish experiencing increased
15◦ C (Scaion et al., 2008a). However, these authors also hydrostatic pressure and moderate hypoxia may have a very
report that the ṀO2 of female eels was much more sensitive limited scope for increases in f H . Bradycardia is typically
at 22◦ C as compared to males, and thus the effects of sex recorded at oxygen levels similar or slightly higher than a
on hydrostatic pressure-related changes in the f H of fishes species’ critical oxygen tension, Pcrit (e.g. see Marvin and
cannot be excluded. Interestingly, the initial f H of lumpfish Heath, 1968; Gehrke et al., 1988; Speers-Roesch et al., 2010).
at 0 bar significantly affected the f H scope in response to Therefore, it is very likely that bradycardia was not recorded
the stress of pressure exposure (Fig. S2). Previous research in this study because the lumpfish did not reach their Pcrit
compliments these results, as the capacity for rainbow trout to (∼40% air saturation at 12◦ C; Ern et al., 2016). Future exper-
Downloaded from https://academic.oup.com/conphys/article/9/1/coab058/6325438 by guest on 12 September 2021
increase f H in response to exercise was highly dependent on iments are being planned to examine if hydrostatic pressure
their resting f H (Brijs et al., 2019). It is possible that variation affects the oxygen level at which bradycardia is initiated and
in the intrinsic f H of individuals, or in stress caused by the the magnitude of the decrease in f H .
transfer to the IPOCAMP, resulted in a high allostatic load
for some fish and that this reduced their ability to increase f H Ultimately, the most relevant experimental scenario would
in response to pressure. be one that accurately reflects the environmental and
behavioural challenges of a vertical migration, i.e. simul-
taneous increases in pressure and decreases in temperature
Influence of hydrostatic pressure on the and water oxygen levels while the fish is actively swimming
heart rate response to changes in (e.g. fish dealing with changing water currents or evading
temperature and hypoxia predation).
After lumpfish were exposed to 80 bar of pressure for 1 hour,
changing temperature resulted in a linear change in f H . While Maximum exercise and
the relationship was steeper for absolute f H in fish exposed to
hydrostatic pressure, the relationship was similar to control
temperature-induced heart rate of lumpfish
fish when the elevated f H in pressure exposed fish at 12◦ C Given the low maximum f H recorded in the IPOCAMP
was taken into account (Fig. 4). These results suggest that at 20◦ C (63 bpm) and following exercise at 10◦ C (73–
while hydrostatic pressure does have an effect on resting 77 bpm), an acute warming protocol was performed under
f H , it does not influence the sensitivity of f H to changes in normobaric conditions. The f H of lumpfish increased up to
temperature. This finding was quite surprising as Scaion et al. 20.8◦ C (Q10 = 1.67; Table 1) and began falling as tempera-
(2008a) showed that temperature had a significant effect on tures approached the lumpfish’s CTMAX of 22◦ C (Fig. 6; Ern
the sensitivity of ṀO2 to increases in hydrostatic pressure, et al., 2016). This response is typical of that seen in other
and Sébert et al. (1995b) reported that exposing eels to a fish species, where f H increases (at Q10 values ranging from
5◦ C temperature increase (from 15◦ C to 20◦ C) concomitantly 1.5 to 2.5) up until ∼2◦ C before the fish’s CTMAX (Gollock
with an increase in pressure to ∼101 bar reduced the acute et al., 2006; Steinhausen et al., 2008; Gilbert et al., 2019). The
increase in ṀO2 by ∼50%. Finally, while tachycardia is seen highest individual f H recorded in lumpfish was 95 bpm, while
in pressure-exposed eels at lower temperatures, this response the highest average f H at 20◦ C was 81 bpm. Thus, it appears
changes to a bradycardia at temperatures near this species’ that lumpfish have a low maximum f H relative to fish species
critical thermal maximum (CTMAX ; ∼ 31◦ C) (Belaud et al., such as the channel catfish Ictalurus punctatus (150 bpm;
1976; Claësson et al., 2016). The disparity in response to tem- Burleson and Silva, 2011) and salmonids (105–132 bpm;
perature between our study and these studies may be related Clark et al., 2008; Steinhausen et al., 2008; Vornanen et al.,
to species or methodological differences. Most importantly, 2014; Motyka et al., 2017) and more typical of those recorded
we exposed the lumpfish to elevated pressure for 1 hour prior in species such as the Atlantic cod (72 bpm; Gollock et
to any changes in temperature, whereas the eels were exposed al., 2006), winter flounder (Pseudopleuronectes americanus;
to changes in temperature either before, or in concert with, 73 bpm; Mendonça and Gamperl, 2010) and European perch
changes in hydrostatic pressure. (Perca fluviatilis; 83 bpm; Jensen et al., 2017).
In the lumpfish, decreasing water PO2 at atmospheric These results, combined with previous data, suggest that
pressure from ∼100% to ∼55% saturation resulted in a lumpfish are well adapted to a passive, yet still pelagic,
slight increase in f H (by ∼5 bpm). This minor increase in f H lifestyle. Hvas et al. (2018) reported that lumpfish have a low
was somewhat surprising as f H generally does not change as critical swimming speed and aerobic scope due to a limited
water PO2 is lowered to the point of bradycardia. However, maximum ṀO2 . The results of this study agree with the
such a response has been seen in several other fish species findings of Hvas et al. (2018), as lumpfish were found to have
including the Atlantic cod (Gadus morhua) (Gamperl and a low scope for f H and a low maximum f H . Additionally,
Driedzic, 2009; Petersen and Gamperl, 2011). Exposure to research shows that lumpfish have relatively low values of
pressure eliminated the small increase in f H that was observed exercise-induced cortisol, glucose and lactate, which indicates
..........................................................................................................................................................
12You can also read