Increased iNOS and Nitrosative Stress in Dopaminergic Neurons of MDMA-Exposed Rats - MDPI
←
→
Page content transcription
If your browser does not render page correctly, please read the page content below
International Journal of
           Molecular Sciences

Article
Increased iNOS and Nitrosative Stress in
Dopaminergic Neurons of MDMA-Exposed Rats
Stefania Schiavone 1, *,† , Margherita Neri 2,† , Angela Bruna Maffione 1 , Paolo Frisoni 2 ,
Maria Grazia Morgese 1 , Luigia Trabace 1,‡ and Emanuela Turillazzi 3,‡
 1    Department of Clinical and Experimental Medicine, University of Foggia, Via Napoli, 20, 71122 Foggia, Italy;
      angelabruna.maffione@unifg.it (A.B.M.); mariagrazia.morgese@unifg.it (M.G.M.);
      luigia.trabace@unifg.it (L.T.)
 2    Department of Morphology, Surgery and Experimental Medicine, University of Ferrara, Via Fossato di
      Mortara, 70, 44100 Ferrara, Italy; margherita.neri@unife.it (M.N.); paolo.frisoni@unife.it (P.F.)
 3    Section of Legal Medicine, Department of Surgical, Medical, Molecular and Critical Pathology,
      University of Pisa, Via Roma 55, 56126 Pisa, Italy; emanuela_turillazzi@inwind.it
 *    Correspondence: stefania.schiavone@unifg.it; Tel.: +39-0881588052
 †    These authors contributed equally to this work.
 ‡    These authors contributed equally to this work.

 Received: 3 January 2019; Accepted: 5 March 2019; Published: 12 March 2019

 Abstract: Several mechanisms underlying 3,4-Methylenedioxy-N-methylamphetamine (MDMA)
 neurotoxicity have been proposed, including neurochemical alterations and excitotoxicity mediated
 by reactive oxygen species (ROS), nitric oxide (NO), and reactive nitrogen species (RNS). However,
 ROS, NO, and RNS sources in the brain are not fully known. We aimed to investigate possible
 alterations in the expression of the ROS producer NOX enzymes (NOX2, NOX1, and NOX4),
 NO generators (iNOS, eNOS, and nNOS), markers of oxidative (8-hydroxy-20 -deoxyguanosine,
 8OHdG), and nitrosative (3-nitrotyrosine, NT) stress, as well as the colocalization between cells
 positive for the dopamine transporter (DT1) and cells expressing the neuronal nuclei (NeuN)
 marker, in the frontal cortex of rats receiving saline or MDMA, sacrificed 6 h, 16 h, or 24 h after
 its administration. MDMA did not affect NOX2, NOX1, and NOX4 immunoreactivity, whereas
 iNOS expression was enhanced. The number of NT-positive cells was increased in MDMA-exposed
 animals, whereas no differences were detected in 8OHdG expression among experimental groups.
 MDMA and NT markers colocalized with DT1 positive cells. DT1 immunostaining was found in
 NeuN-positive stained cells. Virtually no colocalization was observed with microglia and astrocytes.
 Moreover, MDMA immunostaining was not found in NOX2-positive cells. Our results suggest that
 iNOS-derived nitrosative stress, but not NOX enzymes, may have a crucial role in the pathogenesis
 of MDMA-induced neurotoxicity, highlighting the specificity of different enzymatic systems in the
 development of neuropathological alterations induced by the abuse of this psychoactive compound.

 Keywords: MDMA; oxidative stress; nitrosative stress; iNOS; NADPH oxidases

1. Introduction
     3,4-Methylenedioxy-N-methylamphetamine (MDMA), also known as ecstasy, is a synthetic
entactogen of the phenethylamine family, used primarily as an illicit recreational drug, especially in the
context of rave culture [1]. The use of MDMA is highly alarming and, therefore, there is an urgent need
to deeply understand the consequences of MDMA consumption. Neurotoxicity is one of them and
evaluations of MDMA effects on human psychobiology have, consequently, been the focus of several
studies [2–6]. Since studies on humans have ethical barriers, investigation on MDMA neurotoxicity in

Int. J. Mol. Sci. 2019, 20, 1242; doi:10.3390/ijms20051242                            www.mdpi.com/journal/ijms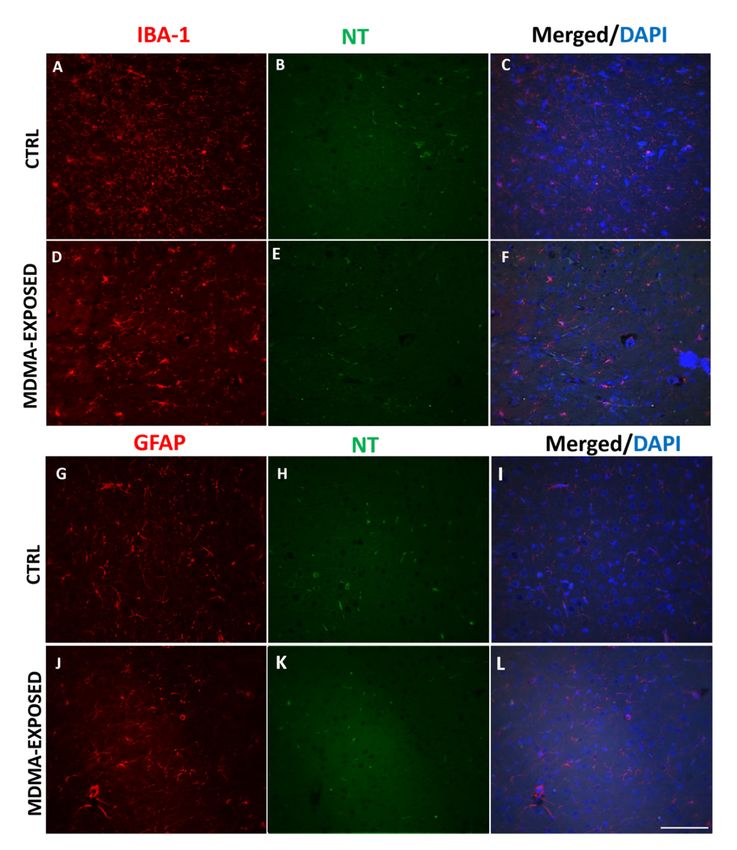
Int. J. Mol. Sci. 2019, 20, 1242                                                                  2 of 20

animal models have been widely performed and are of extreme importance. Indeed, the neurotoxic
and neuroinflammatory effects associated with the abuse of this psychoactive compound have been
widely described in rodent studies, especially in terms of altered dopaminergic neurotransmission and
long-term degeneration of dopaminergic nerves [7–9].
     The dopamine transporter (DT1), a marker of dopaminergic neurons [10], has also been
described as a major target for drugs of abuse [11]. In particular, a reduction of its density has been
observed in MDMA recreational users [12]. Preclinical evidence, obtained by using mice lacking this
transporter, also highlighted that it is an essential mediator required for methamphetamine-induced
neurotoxicity [13]. Moreover, MDMA-exposed rats showed a dose-dependent decrease in the striatal
binding of this transporter [14].
     Recent evidence has highlighted that, besides its detrimental effects on the striatum and the pars
compacta of the substantia nigra, MDMA also affects cortical regions, altering the firing pattern of
dopamine neurons, probably via an increase of norepinephrine release, finally resulting in dopamine
release alterations [15]. Importantly, dysfunctions of the frontal cortex have been described to be
directly implicated in memory deficits observed in MDMA users [16]. Alterations in the expression
of specific gene sets related to protein synthesis, transmembrane transport processes, and synaptic
plasticity have also been reported in the frontal cortex of rats following MDMA administration [17].
Moreover, MDMA binge consumption in rodents induced alterations of serotonergic and dopaminergic
neurotransmission in this brain region [14].
     Several pathogenetic mechanisms underlying MDMA-neurotoxicity have been proposed,
including excitotoxicity, mediated by the increased production of reactive oxygen species (ROS), nitric
oxide (NO), and reactive nitrogen species (RNS) [18–21], leading ultimately to excessive glutamate
release, activation of specific glutamate receptors, elevation of intracellular calcium levels, and
activation of apoptotic processes [22]. However, despite the increasing amount of evidence in this
sense, the sources of ROS, NO, and RNS resulting from MDMA exposure are not fully known. One
of the major sources of ROS in the central nervous system (CNS) is represented by the family of
the nicotinamide adenine dinucleotide phosphate (NADPH) oxidase NOX enzymes, which have
been described as crucial contributors of several physiological functions in the brain, as well as key
players in the pathogenesis of different CNS diseases, going from neurodegenerative to psychiatric
pathologies [23,24]. In the context of psychoactive substance abuse, the NOX2 enzyme has been
implicated in human cocaine-induced neurotoxicity [25], also associated with the excited delirium
syndrome [26], as well as in the development of neuropathological alterations induced by ketamine
administration in mice [27,28]. With respect to NO production in the CNS, the three isoforms of the
NO synthase (NOS) enzyme (i.e., neuronal (nNOS), inducible (iNOS), and endothelial (eNOS)) have
been widely considered the most important NO source [29] in both physiological and pathological
CNS conditions [30–33].
     Here, by using an immunohistochemical approach, we investigated possible alterations in the
expression of NOX2, NOX1, and NOX4 enzymes as ROS sources, NO producers iNOS, eNOS,
and nNOS, as well as 8-hydroxy-20 -deoxyguanosine (8OHdG, a marker of oxidative stress) and
3-nitrotyrosine (NT, a marker of nitrosative stress) in the frontal cortex of rats receiving saline or
MDMA administration and sacrificed at three different time points, namely, 6 h, 16 h, and 24 h from
the injection of this psychoactive compound. Finally, we also evaluated the possible involvement of
dopaminergic neurons, microglia, and astrocytes in MDMA-induced immunohistochemical alterations.

2. Results

2.1. MDMA Administration Did Not Affect NADPH Oxidase Immunoreactivity
     In order to assess if MDMA administration could induce modifications in the expression of the
NADPH oxidase NOX enzymes, we analyzed NOX2, NOX1, and NOX4 immunoreactivities in the
frontal cortex of control (CTRL) and rats sacrificed after 6 h, 16 h, and 24 h from MDMA administration.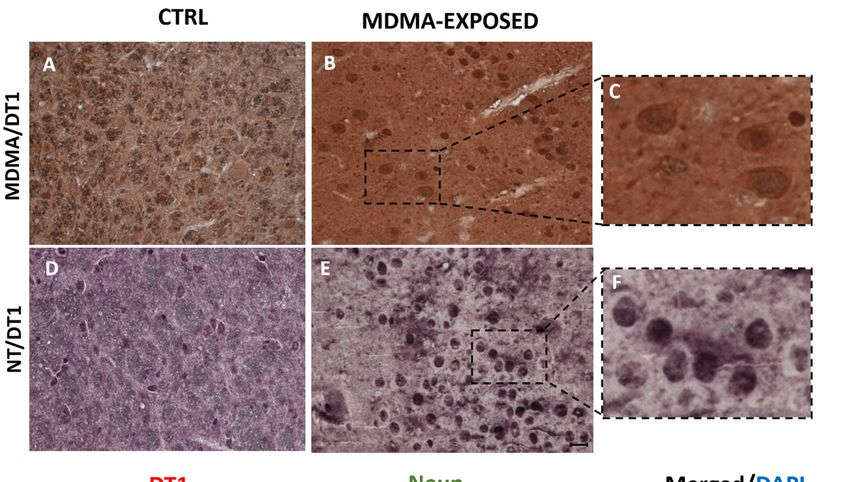
Int. J. Mol. Sci. 2019, 20, 1242 3 of 20
Immunohistochemical results showed no significant differences in NOX2 expression between CTRL
and rats
Int. J. sacrificed
Mol. Sci. 2019,after
20, x the three different time points from MDMA administration, as well3as within
of 19
the MDMA-exposed group (Figure 1A–D). This was confirmed by the correspondent quantifications of
as well asstained
NOX2-positive within cells
the (Figure
MDMA-exposed
1M, one-waygroup (Figurefollowed
ANOVA 1A–D). byThis was confirmed
Tukey’s by Fthe
post-hoc test, = 2.281,
correspondent
p > 0.05). The samequantifications
was observedofforNOX2-positive
NOX1 (Figurestained
1E–H)cells
and (Figure
NOX4 1M, one-way
(Figure ANOVA
1I–L) followed
immunoreactivities
by Tukey’s post-hoc test, F= 2.281, p ˃ 0.05). The same was observed for NOX1 (Figure 1E–H) and
and pertaining quantifications (for NOX1 (Figure 1N), one-way ANOVA followed by Tukey’s post-hoc
NOX4 (Figure 1I–L) immunoreactivities and pertaining quantifications (for NOX1 (Figure 1N), one-
test, F = 0.9608, p > 0.05; for NOX4 (Figure 1O), one-way ANOVA followed by Tukey’s post-hoc test,
way ANOVA followed by Tukey’s post-hoc test, F = 0.9608, p ˃ 0.05; for NOX4 (Figure 1O), one-way
F = 1.333,
ANOVA p >followed
0.05). by Tukey’s post-hoc test, F = 1.333, p ˃ 0.05).
Figure 1. Nicotinamide adenine dinucleotide phosphate (NADPH) oxidase immunoreactivity is not
Figure 1. Nicotinamide adenine dinucleotide phosphate (NADPH) oxidase immunoreactivity is not
affected by 3,4-Methylenedioxy-N-methylamphetamine (MDMA) administration. (A–D) Representative
affected by 3,4-Methylenedioxy-N-methylamphetamine (MDMA) administration. (A–D)
images (light microscopy,
Representative images (light40×microscopy,
) of NOX240×) immunoreactivity in the frontal
of NOX2 immunoreactivity in the cortex of ratsofreceiving
frontal cortex rats
(A) saline
receiving (A) saline (controls = CTRL) and of rats receiving MDMA and sacrificed after (B)h,6 (C)
(controls = CTRL) and of rats receiving MDMA and sacrificed after (B) 6 1616
h, (C) h, and
(D) 24 h from
h, and (D) 24itsh from
administration.
its administration.(E–H) Representative
(E–H) Representativeimages
images (light microscopy,
(light microscopy, 40of
40×) ×NOX1
) of NOX1
immunoreactivity
immunoreactivity in the frontal
in the cortex
frontal cortexofofrats
rats receiving (E)saline
receiving (E) saline (CTRL)
(CTRL) andand of rats
of rats receiving
receiving MDMA MDMA
and sacrificed
and sacrificed after after
(F) (F)
6 h,6 h,
(G)(G)
1616h,h,and
and(H)
(H) 24 hh from
fromits
itsadministration.
administration. (I–L) Representative
(I–L) images
Representative images
(light(light microscopy,
microscopy, 40×)40×) of NOX4
of NOX4 immunoreactivity
immunoreactivity in the
in the frontal
frontal cortex
cortex of rats
of rats receiving
receiving (I) (I) saline
saline (CTRL)
(CTRL) and of rats receiving MDMA and sacrificed after (J) 6 h, (K) 16 h,
and of rats receiving MDMA and sacrificed after (J) 6 h, (K) 16 h, and (L) 24 h from its administration.and (L) 24 h from its
Scaleadministration.
bar for images Scale bar for images in panels (A–L) =50 μm. (M–O) Quantification of (M) NOX2, (N)
in panels (A–L) = 50 µm. (M–O) Quantification of (M) NOX2, (N) NOX1, and
NOX1, and (O) NOX4 positive-stained cells/area analyzed in controls (CTRL) and MDMA-exposed
(O) NOX4 positive-stained cells/area analyzed in controls (CTRL) and MDMA-exposed rats, sacrificed
rats, sacrificed after 6 h, 16 h, and 24 h from its administration. One-way ANOVA followed by Tukey’s
after 6 h, 16 h, and 24 h from its administration. One-way ANOVA followed by Tukey’s post-hoc test.
post-hoc test. For NOX2: F = 2.281, p ˃ 0.05; for NOX1: F = 0.9608, p ˃ 0.05; for NOX4: F = 1.333, p ˃
For NOX2:
0.05.
F = 2.281, p > 0.05; for NOX1: F = 0.9608, p > 0.05; for NOX4: F = 1.333, p > 0.05.
2.2. MDMA Administration Induced an Increase in iNOS Immunoreactivity
2.2. MDMA Administration Induced an Increase in iNOS Immunoreactivity
In order to evaluate
In order possible
to evaluate alterations
possible of NOS
alterations of induced by MDMA
NOS induced administration,
by MDMA we compared
administration, we
iNOS, eNOS, and
compared nNOS
iNOS, expressions
eNOS, and nNOSinexpressions
the frontal in
cortex by immunohistochemistry
the frontal between saline-
cortex by immunohistochemistry
and MDMA-exposed rats sacrificed after 6 h, 16 h, and 24 h. Inducible NOS immunoreactivity was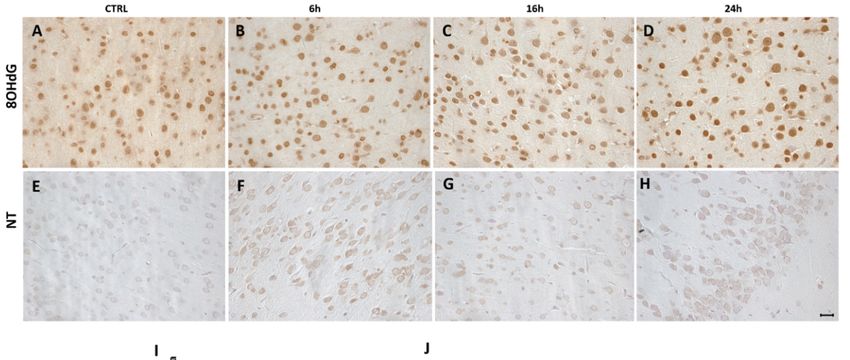
Int. J. Mol. Sci. 2019, 20, x                                                                                     4 of 19
Int. J. Mol. Sci. 2019, 20, 1242                                                                                  4 of 20

between saline- and MDMA-exposed rats sacrificed after 6 h, 16 h, and 24 h. Inducible NOS
immunoreactivity was significantly increased in MDMA-exposed animals with respect to CTRL,
significantly increased in MDMA-exposed animals with respect to CTRL, while no significant changes
while no significant changes in iNOS expression was detected within the three MDMA-exposed
in iNOS expression was detected within the three MDMA-exposed groups (Figure 2A–D,M, one-way
groups (Figure 2A–D,M, one-way ANOVA followed by Tukey’s post-hoc test, F = 9.090, 6 h vs. CTRL
ANOVA followed by Tukey’s post-hoc test, F = 9.090, 6 h vs. CTRL p < 0.001, 16 h vs. CTRL p < 0.01,
p < 0.001, 16 h vs. CTRL p < 0.01, 24 h vs. CTRL p < 0.01, 6 h vs. 16 h p ˃ 0.05, 6 h vs. 24 h p ˃ 0.05, 16 h
24 h vs. CTRL p < 0.01, 6 h vs. 16 h p > 0.05, 6 h vs. 24 h p > 0.05, 16 h vs. 24 h p > 0.05). No statistical
vs. 24 h p ˃ 0.05). No statistical differences were observed for eNOS expression both between and
differences were observed for eNOS expression both between and within the four experimental groups
within the four experimental groups (Figure 2E–H,N, one-way ANOVA followed by Tukey’s post-
(Figure 2E–H,N, one-way ANOVA followed by Tukey’s post-hoc test, F = 0.7276, p > 0.05). The same
hoc test, F = 0.7276, p ˃ 0.05). The same results were found for nNOS immunoreactivity and
results were found for nNOS immunoreactivity and correspondent quantification (Figure 2I–L,O,
correspondent quantification (Figure 2I–L,O, one-way ANOVA followed by Tukey’s post-hoc test, F
one-way ANOVA followed by Tukey’s post-hoc test, F = 1.290, p > 0.05).
= 1.290, p ˃ 0.05).

      Figure 2. Inducible nitric oxide synthase (iNOS) immunoreactivity is increased following MDMA
      Figure 2. Inducible nitric oxide synthase (iNOS) immunoreactivity is increased following MDMA
      administration. (A–D) Representative images (light microscopy, 40×) of iNOS immunoreactivity in the
      administration. (A–D) Representative images (light microscopy, 40×) of iNOS immunoreactivity in
      frontal cortex of rats receiving (A) saline (CTRL) and of rats receiving MDMA and sacrificed after (B)
      the frontal cortex of rats receiving (A) saline (CTRL) and of rats receiving MDMA and sacrificed after
      6 h, (C) 16 h, and (D) 24 h from its administration. (E–H) Representative images (light microscopy, 40×)
      (B) 6 h, (C) 16 h, and (D) 24 h from its administration. (E–H) Representative images (light microscopy,
      of endothelial nitric oxide synthase (eNOS) immunoreactivity in the frontal cortex of rats receiving (E)
      40×) of endothelial nitric oxide synthase (eNOS) immunoreactivity in the frontal cortex of rats
      saline (CTRL) and of rats receiving MDMA and sacrificed after (F) 6 h, (G) 16 h, and (H) 24 h from its
      receiving (E) saline (CTRL) and of rats receiving MDMA and sacrificed after (F) 6 h, (G) 16 h, and (H)
      administration. (I–L) Representative images (light microscopy, 40×) of neuronal nitric oxide synthase
      24 h from its administration. (I–L) Representative images (light microscopy, 40×) of neuronal nitric
      (nNOS) immunoreactivity in the frontal cortex of rats receiving (I) saline (CTRL) and of rats receiving
      oxide synthase (nNOS) immunoreactivity in the frontal cortex of rats receiving (I) saline (CTRL) and
      MDMA and sacrificed after (J) 6 h, (K) 16 h, and (L) 24 h from its administration. Scale bar for images in
      of rats receiving MDMA and sacrificed after (J) 6 h, (K) 16 h, and (L) 24 h from its administration.
      panels (A–L) = 50 µm. (M–O) Quantification of (M) iNOS, (N) eNOS, and (O) nNOS positive-stained
      Scale bar for images in panels (A–L) =50 μm. (M–O) Quantification of (M) iNOS, (N) eNOS, and (O)
      cells/area analyzed in controls (CTRL) and MDMA-exposed rats, sacrificed after 6 h, 16 h, and 24 h
      nNOS positive-stained cells/area analyzed in controls (CTRL) and MDMA-exposed rats, sacrificed
      from its administration. One-way ANOVA followed by Tukey’s post-hoc test. For iNOS: F = 9.090,
      after 6 h, 16 h, and 24 h from its administration. One-way ANOVA followed by Tukey’s post-hoc test.
      *** p < 0.001 6 h vs. CTRL, ** p < 0.01 16 h vs. CTRL and 24 h vs. CTRL, p > 0.05 6 h vs. 16 h, 6 h vs.
      For
      24 h,iNOS:
            and 16F =h 9.090,
                       vs. 24***p  < 0.001
                              h; for eNOS: 6h
                                            F vs. CTRL,p**p
                                              = 0.7276,     < 0.01for
                                                         > 0.05;    16nNOS:
                                                                       h vs. CTRL   and 24
                                                                              F = 1.290,      vs. CTRL, p ˃ 0.05 6 h
                                                                                         p >h 0.05.
      vs. 16 h, 6 h vs. 24 h, and 16 h vs. 24 h; for eNOS: F = 0.7276, p ˃ 0.05; for nNOS: F = 1.290, p ˃ 0.05.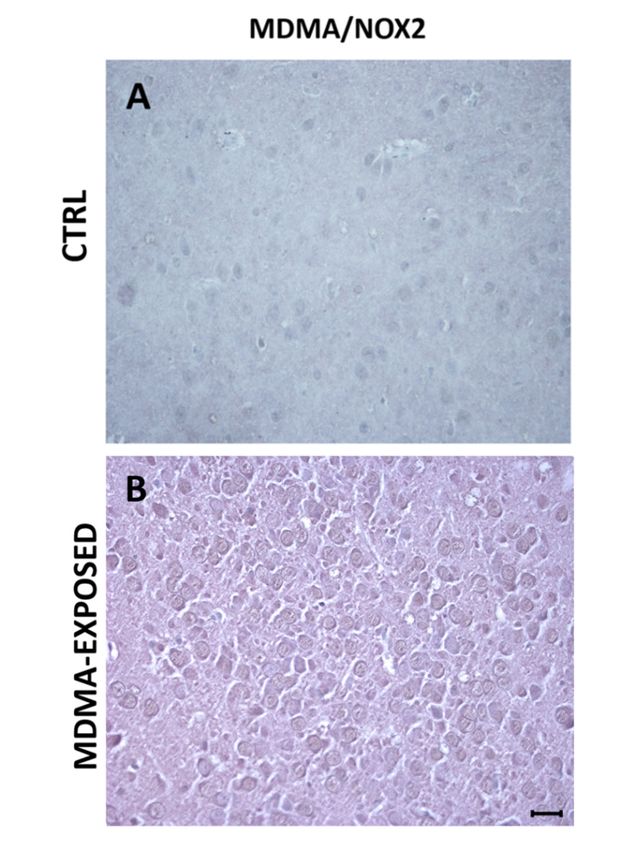
Int. J. Mol. Sci. 2019, 20, 1242                                                                                 5 of 20

Int. J. Mol. Sci. 2019, 20, x                                                                                     5 of 19

2.3. MDMA Administration Induced an Increase in NT Immunoreactivity
 2.3. MDMA Administration Induced an Increase in NT Immunoreactivity
      To assess possible increase of biomarkers of nitrosative or oxidative stress, following MDMA
      To assess possible
administration,             increaseimmunohistochemical
                   we performed       of biomarkers of nitrosative
                                                              analysisorfor
                                                                          oxidative
                                                                            NT and stress,
                                                                                    8OHdG, following  MDMA
                                                                                              respectively, in
 administration,   we  performed     immunohistochemical      analysis  for NT  and 8OHdG,
the frontal cortex. While no differences were observed for 8OHdG immunoreactivity among the   respectively,  in
 the frontal cortex. While no differences were observed for 8OHdG immunoreactivity among the four
four experimental groups and within MDMA-exposed animals (Figure 3A–D,I, one-way ANOVA
 experimental groups and within MDMA-exposed animals (Figure 3A–D,I, one-way ANOVA
followed by Tukey’s post-hoc test, F = 3.141, p > 0.05), a significant elevation in NT expression was
 followed by Tukey’s post-hoc test, F = 3.141, p ˃ 0.05), a significant elevation in NT expression was
identified between CTRL and MDMA-exposed rats (Figure 3E–H,J, one-way ANOVA followed by
 identified between CTRL and MDMA-exposed rats (Figure 3E–H,J, one-way ANOVA followed by
Tukey’s post-hoc test, F = 9.471, 6 h vs. CTRL p < 0.001, 16 h vs. CTRL p < 0.01, 24 h vs. CTRL p < 0.01,
 Tukey’s post-hoc test, F = 9.471, 6 h vs. CTRL p < 0.001, 16 h vs. CTRL p < 0.01, 24 h vs. CTRL p < 0.01,
6 h vs. 16 h p > 0.05, 6 h vs. 24 h p > 0.05, 16 h vs. 24 h p > 0.05).
 6 h vs. 16 h p ˃ 0.05, 6 h vs. 24 h p ˃ 0.05, 16 h vs. 24 h p ˃ 0.05).

      Figure 3. 3-nitrotyrosine (NT) immunoreactivity is increased following MDMA administration.
       Figure 3. 3-nitrotyrosine (NT) immunoreactivity is increased following MDMA administration. (A–
      (A–D) Representative images (light microscopy, 40×) of 8-hydroxy-20 -deoxyguanosine (8OHdG)
       D) Representative images (light microscopy, 40×) of 8-hydroxy-2’-deoxyguanosine (8OHdG)
      immunoreactivity in the frontal cortex of rats receiving (A) saline (CTRL) and of rats receiving MDMA
       immunoreactivity in the frontal cortex of rats receiving (A) saline (CTRL) and of rats receiving MDMA
      and sacrificed after (B) 6 h, (C) 16 h, and (D) 24 h from its administration. (E–H) Representative
       and sacrificed after (B) 6 h, (C) 16 h, and (D) 24 h from its administration. (E–H) Representative images
      images (light microscopy, 40×) of NT immunoreactivity in the frontal cortex of rats receiving (E)
       (light microscopy, 40×) of NT immunoreactivity in the frontal cortex of rats receiving (E) saline (CTRL)
      saline (CTRL) and of rats receiving MDMA and sacrificed after (F) 6 h, (G) 16 h, and (H) 24 h from its
       and of rats receiving MDMA and sacrificed after (F) 6 h, (G) 16 h, and (H) 24 h from its administration.
      administration. Scale bar for images in panels (A–H) = 50 µm. (I–J) Quantification of (I) 8OHdG and
       Scale bar for images in panels (A–H) = 50 μm. (I–J) Quantification of (I) 8OHdG and (J) NT positive-
      (J) NT positive-stained cells/area analyzed in controls (CTRL) and MDMA-exposed rats, sacrificed
       stained cells/area analyzed in controls (CTRL) and MDMA-exposed rats, sacrificed after 6 h, 16 h, and
      after 6 h, 16 h, and 24 h from its administration. One-way ANOVA followed by Tukey’s post-hoc test.
       24 h from its administration. One-way ANOVA followed by Tukey’s post-hoc test. For 8OHdG: F =
      For 8OHdG: F = 3.141, p > 0.05; for NT: F = 9.471, *** p < 0.001 6 h vs. CTRL, ** p < 0.01 16 h vs. CTRL
       3.141, p ˃ 0.05; for NT: F = 9.471, *** p < 0.001 6 h vs. CTRL, ** p < 0.01 16 h vs. CTRL and 24 h vs. CTRL,
      and 24 h vs. CTRL, p > 0.05 6 h vs. 16 h, 6 h vs. 24 h, and 16 h vs. 24 h.
       p ˃ 0.05 6 h vs. 16 h, 6 h vs. 24 h, and 16 h vs. 24 h.
2.4. MDMA and NT Were Localized in Dopaminergic Neurons
 2.4. MDMA and NT Were Localized in Dopaminergic Neurons
      To determine a possible colocalization of MDMA and NT with dopaminergic neurons, double
       To determine a possible
immunohistochemistry             colocalization
                          for MDMA     or NT andofDT1
                                                   MDMA      and NT with
                                                       was performed.      dopaminergic
                                                                         Results  showed thatneurons,
                                                                                                  MDMA  double
                                                                                                          and
 immunohistochemistry
DT1                        for MDMAin
      immunoreactivities colocalized   orthe
                                          NTcortex
                                              and DT1  wasadministered
                                                   of rats   performed. Results
                                                                         with thisshowed
                                                                                    substancethat(Figure
                                                                                                   MDMA    and
                                                                                                         4A–C
 DT1Figure
and    immunoreactivities    colocalized
            S1A,B). Furthermore,         in the cortex ofcells
                                    NT-immunoreactive      rats were
                                                                administered  with
                                                                     also found      this
                                                                                 to be     substance (Figure
                                                                                        double-stained    with
 4A–C
DT1     and Figure
      (Figure 4D–F andS1A,B).
                         FigureFurthermore,
                                 S1C,D). DT1NT-immunoreactive
                                              immunofluorescencecells      were alsoin found
                                                                     was detected               to expressing
                                                                                        cells also  be double-
 stained
the       with nuclei
     neuronal  DT1 (Figure
                      (NeuN)4D–F    and(Figure
                               marker    Figure4G–I).
                                                S1C,D). DT1 immunofluorescence was detected in cells
 also expressing the neuronal nuclei (NeuN) marker (Figure 4G–I).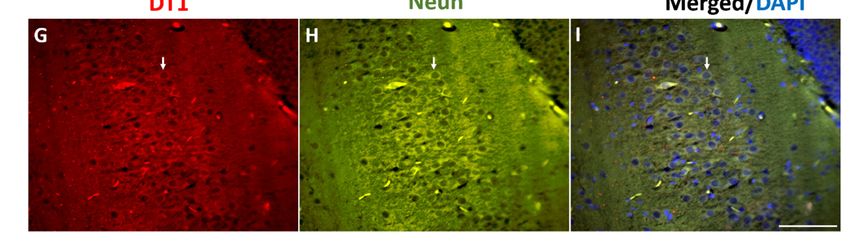
Int. J. Mol. Sci. 2019, 20, 1242                                                                                                  6 of 20
 Int. J. Mol. Sci. 2019, 20, x                                                                                                    6 of 19

      Figure 4. MDMA and NT colocalized with dopamine transporter (DT1). (A,B) Representative images
       Figure
      (light   4. MDMA 40
             microscopy,      and×)NT    colocalized with
                                      of MDMA/DT1             dopamine
                                                          double          transporterin(DT1).
                                                                   immunostaining                (A,B)cortex
                                                                                           the frontal   Representative     images
                                                                                                               of rats receiving
       (light microscopy,       40×)  of MDMA/DT1        double    immunostaining       in the frontal  cortex
      (A) saline (CTRL) and of rats receiving (B) MDMA (MDMA-exposed, sacrificed after 6 h). (C) Blown-up       of  rats  receiving
       (A) saline
      image        (CTRL)
              of the  dotted   and
                                 areaof highlighted
                                        rats receiving in(B)
                                                          (B).MDMA     (MDMA-exposed,
                                                                (D,E) Representative          sacrificed
                                                                                          images   (light after  6 h). (C)40
                                                                                                           microscopy,      Blown-
                                                                                                                             ×) of
       up  image   of  the   dotted    area highlighted     in (B). (D,E)  Representative     images
      NT/DT1 double immunostaining in the frontal cortex of rats receiving (D) saline (CTRL) and in rats(light microscopy,      40×)
       of NT/DT1
      receiving     double
                  (E)  MDMA     immunostaining
                                   (MDMA-exposed,    in thesacrificed
                                                             frontal cortex
                                                                       after of rats(F)
                                                                             6 h).    receiving
                                                                                         Blown-up(D)image
                                                                                                      saline of
                                                                                                             (CTRL)     and inarea
                                                                                                                 the dotted     rats
       receiving   (E)  MDMA        (MDMA-exposed,         sacrificed  after  6  h). (F) Blown-up     image
      highlighted in (E). Scale bar for images in (A,B,D,E) = 50 µm. (G–I) Representative images (light       of  the dotted    area
       highlighted 40
      microscopy,     in×(E).    Scale(G-red
                            ) of DT1     bar forstaining)/NeuN
                                                  images in (A,B,D,E)
                                                                    (H-green= 50   μm. (G–I)
                                                                                staining)       Representative images
                                                                                            immunofluorescence                (light
                                                                                                                     and merged
       microscopy,    40×)
                       0      of DT1    (G-red  staining)/NeuN      (H-green    staining)   immunofluorescence
      images with 4 , 6-diamidino-2-phenylindole (DAPI) (I-blue staining) in the frontal cortex. Scale bar for        and   merged
       imagesin
      images    with
                  (G–I)4′, =6-diamidino-2-phenylindole           (DAPI) (I-blueDT1/NeuN
                              100 µm. Arrows indicate a representative             staining) indouble-stained
                                                                                                  the frontal cortex.
                                                                                                                    cell. Scale bar
       for images in (G–I) = 100 μm. Arrows indicate a representative DT1/NeuN double-stained cell.
2.5. MDMA and NT Were Not Localized in Glia Cells
 2.5. MDMA and NT Were Not Localized in Glia Cells
      To assess if MDMA and NT were also present in other CNS cellular subtypes, we performed
doubleToimmunofluorescence
          assess if MDMA andexperiments
                                  NT were also forpresent
                                                    MDMAinor    NT and
                                                              other CNSionized
                                                                          cellularcalcium-binding     adapter
                                                                                   subtypes, we performed
molecule   1 (IBA-1),  a marker of microglia [34]  and for MDMA     or NT  and glial fibrillary
 double immunofluorescence experiments for MDMA or NT and ionized calcium-binding adapter       acidic protein
(GFAP),
 moleculea 1marker  ofaastrocytes
              (IBA-1),   marker of[35].  Results
                                   microglia     showed
                                              [34] and forthat IBA-1
                                                            MDMA    orand
                                                                       NT GFAP    immunofluorescence
                                                                           and glial                      did
                                                                                     fibrillary acidic protein
not  co-stain
 (GFAP),       with MDMA
           a marker         (Figure[35].
                     of astrocytes  5A–L   and Figure
                                         Results  showedS2A–L).
                                                           that IBA-1 and GFAP immunofluorescence did
 not co-stain with MDMA (Figure 5A–L and Figure S2A–L).
Int. J. Mol. Sci. 2019, 20, 1242 7 of 20
Int. J. Mol. Sci. 2019, 20, x 7 of 19
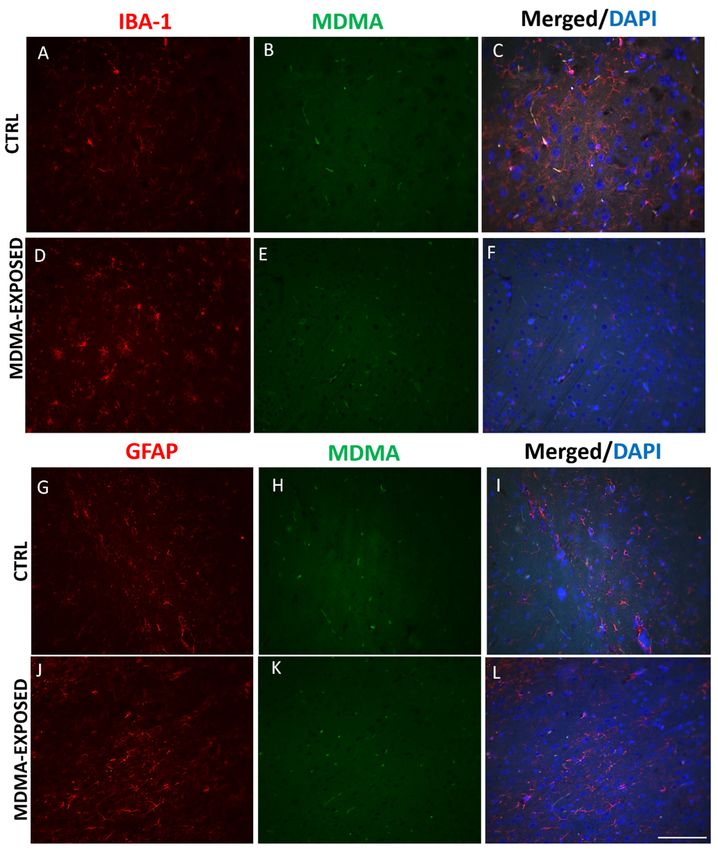
Figure 5.5.MDMA
Figure MDMA immunofluorescence
immunofluorescence is not is not in
present present
microgliain and
microglia and
astrocytes. astrocytes.
(A–F) (A–F)
Representative
Representative immunofluorescence
immunofluorescence images (light
images (light microscopy, microscopy,
40×) of 40×) of ionized
ionized calcium-binding calcium-binding
adapter molecule 1
adapter(red
(IBA-1) molecule 1 (IBA-1) (red
staining)/MDMA staining)/MDMA
(green staining) and (green
mergedstaining)
images with and merged images
DAPI (blue with in
staining) DAPI
the
(blue staining) in the frontal cortex of (A–C) saline-exposed (CTRL) and
frontal cortex of (A–C) saline-exposed (CTRL) and (D–F) MDMA-exposed (sacrificed after 6 h from (D–F) MDMA-exposed
(sacrificed
its after 6 hrats.
administration) from its administration)
(G–L) Representativerats. (G–L) Representative
immunofluorescence images immunofluorescence
(light microscopy, 40images
×) of
(lightfibrillary
glial microscopy,
acidic40×) of glial
protein fibrillary
(GFAP) (redacidic protein (GFAP)
staining)/MDMA (redstaining)
(green staining)/MDMA
and merged (green staining)
images with
and merged
DAPI images with
(blue staining) in theDAPI
frontal(blue staining)
cortex insaline-exposed
of (G–I) the frontal cortex of (G–I)
(CTRL) and saline-exposed (CTRL)
(J–L) MDMA-exposed
and (J–L) MDMA-exposed
(sacrificed (sacrificed after rats.
after 6 h from its administration) 6 h from
Scaleits
baradministration) rats. Scale
for images in panels (A–L)bar for µm.
= 100 images in
panels (A–L) = 100 μm.
No colocalization was detected between IBA-1 and NT immunofluorescence as well as between
GFAPNo
and NT staining was
colocalization (Figure 6A–L between
detected and Figure S3A–L).
IBA-1 and NT immunofluorescence as well as between
GFAP and NT staining (Figure 6A–L and Figure S3A–L).Int. J. Mol. Sci. 2019, 20, x1242 8 of 20
19
Figure 6. NT immunofluorescence is not present in microglia and astrocytes. (A–F) Representative
Figure 6. NT immunofluorescence is not present in microglia and astrocytes. (A–F) Representative
immunofluorescence images (light microscopy, 40×) of IBA-1 (red staining)/NT (green staining)
immunofluorescence images (light microscopy, 40×) of IBA-1 (red staining)/NT (green staining) and
and merged images with DAPI (blue staining) in the frontal cortex of (A–C) saline-exposed (CTRL)
merged images with DAPI (blue staining) in the frontal cortex of (A–C) saline-exposed (CTRL) and
and (D–F) MDMA-exposed (sacrificed after 6 h from its administration) rats. (G–L) Representative
(D–F) MDMA-exposed (sacrificed after 6 h from its administration) rats. (G–L) Representative
immunofluorescence images (light microscopy, 40×) of GFAP (red staining)/NT (green staining) and
immunofluorescence images (light microscopy, 40×) of GFAP (red staining)/NT (green staining) and
merged images with DAPI (blue staining) in the frontal cortex of (G–I) saline-exposed (CTRL) and
merged images with DAPI (blue staining) in the frontal cortex of (G–I) saline-exposed (CTRL) and (J–
(J–L) MDMA-exposed (sacrificed after 6 h from its administration) rats. Scale bar for images in panels
L) MDMA-exposed (sacrificed after 6 h from its administration) rats. Scale bar for images in panels
(A–L) = 100 µm.
(A–L) = 100 μm.
Virtually, no colocalization was observed between MDMA immunoreactive and NOX2-positive
Virtually,
stained no colocalization
cells (Figure was observed
7A,B and Figure S4A,B). between MDMA immunoreactive and NOX2-positive
stained cells (Figure 7A,B and Figure S4A,B).Int. J. Mol. Sci. 2019, 20, 1242 9 of 20
Int. J. Mol. Sci. 2019, 20, x 9 of 19
Figure 7. MDMA staining does not colocalize with NOX2 immunoreactivity. (A,B) Representative
Figure
images 7. MDMA
(light microscopy, ×) ofnot
staining40does colocalize with
MDMA/NOX2 NOX2
double immunoreactivity.
immunostaining in the(A,B) Representative
frontal cortex of rats
receiving
images (A) saline
(light (CTRL)40×)
microscopy, and of rats receiving (B)double
MDMA/NOX2 MDMA (sacrificed after in
immunostaining 6 hthe
from its administration).
frontal cortex of rats
Scale bar for
receiving (A)images
salinein(CTRL)
panels (A,B)
and =of50rats
µm. receiving (B) MDMA (sacrificed after 6 h from its
administration). Scale bar for images in panels (A,B) = 50 μm.
3. Discussion
3. Discussion
In this study, we investigated if MDMA may induce oxidative and/or nitrosative stress in the
frontal
In cortex of rats.
this study, we We found thatif MDMA
investigated MDMA did maynot affectoxidative
induce NOX enzyme and/orimmunoreactivity
nitrosative stress in in this
the
frontal cortex of rats. We found that MDMA did not affect NOX enzyme immunoreactivity incells.
brain region, whereas iNOS expression was enhanced along with the number of NT-positive this
MDMA
brain and NT
region, markers
whereas iNOSwere detected in
expression DT1-stained
was enhanced cells
along but notthe
with in microglia
number of and astrocytes.cells.
NT-positive
The link between MDMA administration and a possible increase
MDMA and NT markers were detected in DT1-stained cells but not in microglia and astrocytes.of oxidative stress in other
organs,
Thesuch
link as liver and
between MDMA heart,administration
especially myocardium,
and a possiblehas been previously
increase investigated
of oxidative stress in[36–40].
other
However, only a limited number of studies have evaluated the impact of
organs, such as liver and heart, especially myocardium, has been previously investigated [36–40]. MDMA on the brain
redox stateonly
However, [41–43], in particular
a limited number with respect
of studies to the
have identification
evaluated of possible
the impact of MDMA sources
on theof brain
free radical
redox
production. In regard to this point, we found that the immunoreactivity of NOX2,
state [41–43], in particular with respect to the identification of possible sources of free radical NOX1, and NOX4
as well as theInexpression
production. regard to thisof 8OHdG,
point, wea marker of ROS-induced
found that oxidative of
the immunoreactivity damage
NOX2,toNOX1,
DNA [44]and widely
NOX4
considered as a reliable biomarker for oxidative stress presence, were not increased
as well as the expression of 8OHdG, a marker of ROS-induced oxidative damage to DNA [44] widely in the frontal cortex
following MDMA
considered administration
as a reliable biomarker with
forrespect to saline-exposed
oxidative stress presence, animals,
were notat the three considered
increased time
in the frontal
points. These results are in line with our previous observations showing that
cortex following MDMA administration with respect to saline-exposed animals, at the three NOX2 was not implicated
in the alterations
considered of neurotransmitter
time points. These results arerelease and
in line behavioral
with our previouschanges in response
observations to amphetamine
showing that NOX2
administration in mice [27]. Indeed, we previously found that amphetamine administration
was not implicated in the alterations of neurotransmitter release and behavioral changes in response induced
similar neurochemical and behavioral responses in wild-type and
to amphetamine administration in mice [27]. Indeed, we previously found that amphetamineNOX2 knockout mice, while
increased glutamate
administration inducedand similar
dopamine release induced
neurochemical and by subchronic
behavioral administration
responses of subanaesthetic
in wild-type and NOX2
knockout mice, while increased glutamate and dopamine release induced suggest
doses of ketamine were abolished after NOX2 deficiency in mice [27]. These data that this
by subchronic
enzyme may not be directly implicated in the pathogenetic pathways underlying
administration of subanaesthetic doses of ketamine were abolished after NOX2 deficiency in mice MDMA-induced
[27]. These data suggest that this enzyme may not be directly implicated in the pathogenetic
pathways underlying MDMA-induced neurotoxicity. They are also in line with previous worksInt. J. Mol. Sci. 2019, 20, 1242 10 of 20
neurotoxicity. They are also in line with previous works reporting an enhancement of free radical
production by mitochondria [45–47] and an alteration of specific mitochondria-related biochemical
parameters, following MDMA administration [48]. However, we cannot totally exclude a possible
involvement of the NADPH oxidases in the pathogenesis of MDMA-induced neurotoxicity, also in the
light of the role that the NADPH plays in the glutathione-dependent neutralization of MDMA-derived
oxidized metabolites [49].
A novel finding of our study, if compared to previous lines of evidence showing a direct
involvement of the nitrergic system in the onset and progression of MDMA-neurotoxicity [50–52],
is the detection of iNOS immunoreactivity increase in the cortex of MDMA-exposed animals with
respect to CTRL. Importantly, iNOS has been reported to act as a key modulator of neuronal death.
Indeed, iNOS knockout mice injected with kainic acid showed a reduced number of TUNEL positive
cells in the hippocampus [53]. In the same line, iNOS-derived NO was able to induce neuronal death
following hypoxic-ischemic insults by interacting with NMDA receptors [54] or directly synergizing
with hypoxia [55].
At least in our experimental conditions, there were no significant differences in nNOS expression
between MDMA-exposed rats and CTRL. Accordingly, previous observations reported that the
induction of psychomotor sensitization to MDMA was dependent upon NO and that repeated
administration of MDMA resulted in psychomotor sensitization in both wild-type and nNOS knockout
mice [56]. Moreover, an increased immunoreactivity for nNOS was observed in the striatum and
nucleus accumbens, but not in the cortex, of mice following administration of repeated doses
of MDMA [57]. An increased expression of nNOS has also been reported only following the
administration of MDMA in association with other psychostimulant compounds, such as caffeine [58].
With respect to the lack of eNOS expression alterations in the brain of MDMA-exposed rats, our results
are in line with a previously published paper reporting an involvement of eNOS in the pathological
consequences of MDMA administration, combined with other molecules, such as phosphodiesterase
5 inhibitors, in peripheral body districts [59]. Besides the observed iNOS involvement, a possible
implication of other sources of nitrosylating species, such as myeloperoxidase, could not be excluded.
Indeed, this enzyme has been described to interact directly with iNOS, up-regulating its catalytic
activity or consuming NO released by iNOS and therefore preventing the NO-induced inhibition
attributed to the formation of the iNOS–nitrosyl complex [60]. Moreover, myeloperoxidase has been
reported to be a crucial component of the MDMA-induced intracellular enzymatic cascade which
leads to the activation of pro-apoptotic signals, finally resulting in toxic damage, cell dysfunction, and
death [61].
We observed a colocalization between MDMA and DT1 staining, as well as between NT and
DT1-positive cells. This is an important finding of our study, in line with previously published reports
describing alterations of the dopaminergic system and neurotransmission induced by MDMA [62]. This
is also particularly relevant with respect to the age of the animals we used (late adolescence/beginning
of adulthood). Indeed, it has been demonstrated that adult rats exposed to MDMA during adolescence
showed a significant reduction of dopamine cell bodies and terminals at adulthood, associated with
a reduced density of TH-positive neurons, a decreased immunoreactivity dopamine transporter,
a reduction of basal dopamine release, and a deficit in the processes of memory formation and
recognition [63]. However, the possible implication of other neurotransmitters, such as serotonin
(5-HT), should also be considered. In this regard, it has been reported that the 5-HT receptor subtypes
differentially contribute to the behavioral effects of MDMA—the 5-HT2A and 5-HT1B/1D receptors
playing a facilitatory role in mediating the stimulant effect of this molecule, the 5-HT2C being, instead,
inhibitory [64]. Moreover, both rodent and clinical neuroimaging studies, conducted on frequent
MDMA users, reported that this substance induces a massive 5-HT release, with consequent decrease
of the 5-HT transporter binding in different brain regions [62,65–67]. These 5-HT-related alterations
induced by MDMA administration should also be seen in the light of the physiological connections
existing between the serotonergic and the dopaminergic systems. Indeed, a recent study, performed byInt. J. Mol. Sci. 2019, 20, 1242 11 of 20
combining cell-type-specific fiber photometry of Ca2+ signals and intravenous drug infusion, reported
that MDMA caused long-lasting suppression of both dopamine and 5-HT neurons, through its activity
on dopamine and 5-HT autoreceptors [68].
In our experimental conditions, MDMA and NT did not co-stain with microglia and astrocytes,
at least within 24 h after MDMA administration. However, the important pathological link existing
among MDMA administration, activation of neuroinflammatory pathways in the CNS [69], and glia
activation [8] must be taken adequately into account. Indeed, it has been reported that administration
of neurotoxic amphetamines significantly increased both resting and activated microglia, as well as
astrocytes, causing enhanced production of reactive species, such as NO [70,71], and increased release
of proinflammatory cytokines [72,73]. Thus, we cannot exclude the possibility that the involvement of
the inflammation-associated cellular subtypes of the CNS (i.e., microglia and astrocytes) might occur
later with respect to our chosen time point (24 h from MDMA administration).
Here, by analyzing the effects of MDMA at three specific time points, namely, 6 h, 16 h, and 24 h
after its administration, we also defined a possible time course for the onset of its neurotoxic effects.
This is an innovative experimental approach designed by our research group, allowing to evaluate
if MDMA-induced alterations in the CNS might occur within the first 24 h from its administration
Importantly, we did not detect significant differences in the analyzed parameters within the group of
MDMA-exposed animals with respect to the different considered time points, as we already observed
an increased expression of iNOS and NT staining after 6 h from the injection of this psychoactive
compound, suggesting an early onset of the dysfunctions induced by MDMA-derived oxidative stress,
without differences with respect to later time points. Future investigations at earlier time points
(i.e., after 1 or 2 h from MDMA administration) might be useful to further define the induction profile
of the enzymatic systems implicated in MDMA-induced neurotoxicity.
An important aspect of our study is that all findings were observed in the absence of body
temperature elevations. Indeed, in our experimental protocol, MDMA was administered at 18 ◦ C,
this temperature preventing the hyperthermic response [74] described, instead, at standard housing
temperature (21–23 ◦ C) [57,75,76]. Therefore, the observed effects of MDMA administration on the
expression of oxidative and nitrosative stress producing enzymes might be considered, at least in our
experimental conditions, independently from MDMA-induced hyperthermia. Although it has been
reported that hyperthermia is a significant complication of MDMA use and a factor potentiating its
toxic effects on the CNS [77], several other mechanisms underlying MDMA-induced neurotoxicity
have been described, such as altered oxidase metabolism of monoamines, glutamate excitotoxicity,
agonism of 5-HT 2A receptors, as well as formation of neurotoxic metabolites [52].
The most important limitation of this work is related to the lack of a direct measure of iNOS
activation and RNS amount, produced following MDMA administration. However, we found that
the increased iNOS immunoreactivity, detected in MDMA-exposed animals, was occurring along
with elevations in the number of NT-positive stained cells. Elevations in this marker may suggest a
possible increase in the activation and functioning of the iNOS enzyme. Indeed, NT is known to be a
direct marker of nitrosative stress, being the product of tyrosine nitration mediated by RNS such as
peroxynitrite anion and nitrogen dioxide, formed in the presence of NO [78]. In the same line, further
investigations, performed by using specific techniques or other tissue fixation conditions [79–83], are
needed to directly evaluate ROS amount in the brain following NOX enzyme activation.
Together with the induction of neuropathological alterations in CNS, psychoactive compounds
are known to induce significant behavioral changes [84–86]. Thus, another important limitation of
this study regards the lack of behavioral analyses on MDMA-exposed rats. Previously preclinical
published papers reported that MDMA administration was able to alter sexual behavior [87], to induce
anxiety-like and avoidant behaviors [88], to reduce social interactions, also enhancing the rewarding
effect of other drugs of abuse [89] in rodents. Thus, despite the absence of behavioral data in the
present work, the important pathogenetic role that iNOS has been reported to play in the modulationInt. J. Mol. Sci. 2019, 20, 1242 12 of 20
of these behaviors [51,90–92] may represent a link between our immunohistochemical findings and
the previously described MDMA-induced behavioral impairment.
This study may have important clinical implications. Indeed, MDMA has been described as one of
the three most commonly used illicit substances [93] and still remains a very popular psychostimulant
drug, especially among young adults, aged 18–25 years (https://www.drugabuse.gov/drugs-abuse/
mdma-ecstasymolly), (https://www.theguardian.com/uk-news/2015/jul/23/ecstasy-and-lsd-use-
reaches-new-high-among-young) [94]. The search of novel biomarkers and/or pharmacological
strategies to reduce the neurological burden associated with the misuse of this compound represents,
therefore, a clinical priority. Thus, increased iNOS expression and nitrosative stress described in our
study may be considered as novel targets to be used for the clinical monitoring and the pharmacological
treatment of MDMA’s detrimental effects on the CNS. Moreover, as contrasting results have been
published about the possible relationship between MDMA and neurocognitive deficits [95], the
identification of novel molecular pathways underlying the impact of this substance abuse may provide
novel insights into this crucial issue.
4. Materials and Methods
4.1. Animals
Adult (8–10 weeks), male Wistar rats (Envigo, San Pietro al Natisone, Italy) weighing 200–250 g
were housed at constant room temperature (22 ± 1 ◦ C) and relative humidity (55 ± 5%) under a 12 h
light/dark cycle (lights on from 7:00 AM to 7:00 PM) for at least seven days before the experiments.
Food and water were available ad libitum. Procedures involving animals and their care were conducted
in strict accordance with the European (86/609/EEC) and Italian (DLgs 116/92; notice pursuant to
art. 7) guidelines on animal care. The Guide for the Care and Use of Mammals in Neuroscience and
Behavioral Research (National Research Council 2004) was also followed. All experimental techniques
and scientific procedures involving animals were conducted in accordance with “Animal Research:
Reporting of In Vivo Experiments” (ARRIVE) guidelines. All efforts were made to minimize the
number of animals used and to alleviate their suffering. Animal welfare was daily monitored through
the entire period of experimental procedures.
4.2. MDMA Administration and Experimental Protocol
The MDMA dose (20 mg/kg) and way of administration (intraperitoneally, i.p.) used were chosen
based on previously published works from our group, as well as others [36,37,96].
In order to avoid the MDMA-induced hyperthermic response [74] and in order to exclude the
possibility that the observed effects might be only related to body temperature elevation, animals were
conducted from the standard housing room (21–23 ◦ C), where they stayed for at least seven days before
the experiments, to the 18 ◦ C room one hour before MDMA administration, in order to acclimatize
to the lower temperature. We monitored animal temperature before and 30 minutes after MDMA
administration [57] by using a rectal probe and we did not observe any hyperthermic response in any
of the MDMA-exposed animals. A total of 24 animals were initially exposed to MDMA and a total of 9
animals to saline (vehicle). The total number of animals to be included in this study was established
based on our previous experience with immunohistochemical analyses on rodent brain [27,97–99] and
on previous immunohistochemical studies on rat brain from other groups [100–102]. Four animals
died within the first hour from MDMA administration. The 29 remaining animals were killed by
decapitation after 6 h (MDMA n = 8; saline = 3), 16 h (MDMA n = 7; saline = 3), or 24 h (MDMA
n = 5; saline = 3) from MDMA or saline administration. No significant differences were detected in the
considered parameters within saline-exposed animals (data not shown). Therefore, results regarding
saline-exposed animals are presented as one single control (CTRL) group.Int. J. Mol. Sci. 2019, 20, 1242 13 of 20
4.3. Immunohistochemical Analyses
After rat decapitation, the entire brain was removed and fixed in 10% buffered formalin for
48 h [39]. The fixed brain was dissected in four specimens of about 20 mm (named as A, B, C, and
D), proceeding respectively from the anterior to the posterior regions of the rat brain. Each of these
sections was then processed for paraffin inclusion. For this study, 4 µm paraffin-embedded sections
of the frontal cortex region were obtained from specimen A, by using an automized microtome
(Leica, Cambridge, UK), mounted on 3-amminopropyl-triethoxysilane covered slides (Fluka, Buchs,
Switzerland), and dried at 37 ◦ C for 24 h. Brain sections were then deparaffinized through graded
alcohols, subjected to epitope retrieval for 15 min and incubated for two hours at room temperature
with primary antibodies, diluted in a blocking buffered serum solution containing albumin and fetal
bovine serum (Sigma-Aldrich S.R.L., Milan, Italy), raised against NOX2 (1:50, Santa Cruz Biotechnology,
Inc., Dallas, TX, USA), NOX1 (1: 250, Abcam, Cambridge, UK), NOX4 (1:100, Abcam), iNOS (1:100,
Santa Cruz Biotechnology), eNOS, (1:100, Santa Cruz Biotechnology), nNOS (1:150, Santa Cruz
Biotechnology, Inc.), 8OHdG (1:10, JaICA, Shizuoka, Japan), NT (1:600, Santa Cruz Biotechnology, Inc.),
DT1 (1:100, Abcam). Sections were then washed with phosphate-buffered saline (PBS) and incubated
for 15 min at room temperature with specific biotinylated secondary antibodies. After several washes
in PBS, sections were incubated for 15 min in horseradish peroxidase-avidin/biotin complex solution.
Horseradish peroxidase was visualized using 3,3-diaminobenzidinetetrahydrochloride hydrate (DAB,
Sigma-Aldrich S.R.L.) and H2 O2 . Counterstaining with hematoxylin-eosin allowed visualization of cell
morphology and nuclei by light microscopy. Specificity of NOX2 and iNOS antibodies was previously
investigated by our research group on positive and technical negative controls [103].
The MDMA immunostaining was performed as previously described [39], by using a monoclonal
antibody that specifically recognizes MDMA (clone 1A9, kindly supplied by Microgenics GmbH
Products Europe, Passau, Germany). Specificity of this primary antibody was tested on positive and
negative controls (brain samples of MDMA- and saline-exposed rats, respectively), as well as technical
negative controls (without primary antibody), by using different experimental conditions, that is, both
without pretreatment and with several pretreatments (boiling in 0.25 mM EDTA buffer; boiling in
0.1 M citric acid buffer; proteolytic enzyme at 20 ◦ C for 5 min; proteinase K at 20◦ C for 15 min), at
various concentrations (ratio 1:20, 1:50, 1:100, 1:500, 1:1000, 1:2000). The tested samples were examined
under a light microscope in order to detect the best reaction, that is, anti-MDMA concentration 1:100,
with a boiling pre-treatment in 0.25 mM EDTA buffer. The detection system used for the MDMA
immunostaining was the LSAB1 Kit (Dako, Carpinteria, CA, USA).
Double immunohistochemistry for MDMA/DT1, NT/DT1, and MDMA/NOX2 was performed
as previously described [104]. Briefly, slices were incubated with the above-cited primary antibodies.
After the incubation, the peroxidase–avidin/biotin complex was visualized using the following
peroxidase substrates with different colors: Vector NovaRED (red, Vector, Burlingame, CA, USA),
Vector VIP (purple, Vector, Burlingame, CA, USA), and Vector SG (blue/grey, Vector, Burlingame, CA,
USA). Sections were counterstained with methyl green, dehydrated, coverslipped, and observed in a
Leica DM6000 optical microscope (Leica, Cambridge, UK). The different combinations of colors used
for each above-mentioned double immunohistochemistry are detailed in Table 1.
Table 1. Combinations of colors used in double immunohistochemistry experiments.
Antibodies Colors
MDMA/DT1 Red/Blue-grey
NT/DT1 Purple/Blue-grey
MDMA/NOX2 Purple/Blue-grey
Double immunofluorescence for DT1/NeuN (DT1 = 1:100; NeuN = 1:1000, Abcam, Cambridge,
UK), MDMA/IBA-1 (MDMA = 1:100; IBA-1 = 1:500, kindly provided by Prof. Livio Luongo,Int. J. Mol. Sci. 2019, 20, 1242 14 of 20
Department of Experimental Medicine Division of Pharmacology University of Campania
“L. Vanvitelli” Naples, Italy), MDMA/GFAP (MDMA = 1:100; GFAP = 1:500, kindly provided by
Prof. Livio Luongo, Department of Experimental Medicine Division of Pharmacology University of
Campania “L. Vanvitelli” Naples, Italy), NT/IBA-1, and NT/GFAP was performed as previously
described [97], using the following fluorescent secondary antibodies: goat anti-rabbit ALEXA Fluor
Plus 555 (1:1000, ThermoFisher Scientific, Milan, Italy) for DT1, IBA-1, and GFAP staining, goat
anti-mouse ALEXA Fluor Plus 488 (1:1000, ThermoFisher Scientific) for NeuN, MDMA, and NT
staining. Sections were counterstained with 40 , 6-diamidino-2-phenylindole (DAPI, ThermoFisher
Scientific) in order to stain cellular nuclei, coverslipped, and observed using a Nikon Ti-E time-lapse
microscope (Nikon, Campi Bisenzio, Italy).
Quantification of NOX2, NOX1, NOX4, iNOS, eNOS, nNOS, 8OHdG, and NT positive-stained
cells was performed by the ImageJ software (imagej.nih.gov/ij/), as previously described [103],
using the “Manual Cell Counting and Marking” protocol of this software for RGB color, single, not
stack images (https://imagej.nih.gov/ij/docs/guide/user-guide.pdf). One image for each animal
of the different experimental groups was processed. Quantifications were expressed as number of
positive-stained cells/analyzed area.
4.4. Blindness of the Study
Histological analyses were performed by researchers who were blind with respect to the treatment
conditions. The blinding of the data was maintained until the analysis was terminated.
4.5. Statistical Analysis
Data were analyzed using the GraphPad Prism 5 software for Windows (La Jolla, CA, USA).
Data were checked for normality using Bartlett’s test and analyzed by one-way analysis of variance
(ANOVA), followed by Tukey’s post-hoc test. For all tests, a p valueInt. J. Mol. Sci. 2019, 20, 1242 15 of 20
References
1. Michael, W.C. How MDMA’s pharmacology and pharmacokinetics drive desired effects and harms. J. Clin.
Pharmacol. 2014, 54, 245–252. [CrossRef] [PubMed]
2. Parrott, A.C. Human psychobiology of MDMA or ‘Ecstasy’: An overview of 25 years of empirical research.
Hum. Psychopharmacol. 2013, 28, 289–307. [CrossRef] [PubMed]
3. Parrott, A.C. Human research on MDMA (3,4-methylene-dioxymethamphetamine) neurotoxicity: Cognitive
and behavioural indices of change. Neuropsychobiology 2000, 42, 17–24. [CrossRef] [PubMed]
4. Halpin, L.E.; Collins, S.A.; Yamamoto, B.K. Neurotoxicity of methamphetamine and 3,4-methylenedioxy
methamphetamine. Life Sci. 2014, 97, 37–44. [CrossRef] [PubMed]
5. Benningfield, M.M.; Cowan, R.L. Brain serotonin function in MDMA (ecstasy) users: Evidence for persisting
neurotoxicity. Neuropsychopharmacology 2013, 38, 253–255. [CrossRef] [PubMed]
6. Karuppagounder, S.S.; Bhattacharya, D.; Ahuja, M.; Suppiramaniam, V.; Deruiter, J.; Clark, R.; Dhanasekaran, M.
Elucidating the neurotoxic effects of MDMA and its analogs. Life Sci. 2014, 101, 37–42. [CrossRef] [PubMed]
7. Peraile, I.; Torres, E.; Mayado, A.; Izco, M.; Lopez-Jimenez, A.; Lopez-Moreno, J.A.; Colado, M.I.; O’Shea, E.
Dopamine transporter down-regulation following repeated cocaine: Implications for 3,4-methylenedioxy
methamphetamine-induced acute effects and long-term neurotoxicity in mice. Br. J. Pharmacol. 2010, 159,
201–211. [CrossRef] [PubMed]
8. Costa, G.; Frau, L.; Wardas, J.; Pinna, A.; Plumitallo, A.; Morelli, M. MPTP-induced dopamine neuron
degeneration and glia activation is potentiated in MDMA-pretreated mice. Mov. Disorders 2013, 28, 1957–1965.
[CrossRef] [PubMed]
9. Costa, G.; Morelli, M.; Simola, N. Progression and Persistence of Neurotoxicity Induced by MDMA
in Dopaminergic Regions of the Mouse Brain and Association with Noradrenergic, GABAergic, and
Serotonergic Damage. Neurotox. Res. 2017, 32, 563–574. [CrossRef] [PubMed]
10. Nirenberg, M.J.; Vaughan, R.A.; Uhl, G.R.; Kuhar, M.J.; Pickel, V.M. The dopamine transporter is localized
to dendritic and axonal plasma membranes of nigrostriatal dopaminergic neurons. J. Neurosci. 1996, 16,
436–447. [CrossRef]
11. Zhu, J.; Reith, M.E. Role of the dopamine transporter in the action of psychostimulants, nicotine, and other
drugs of abuse. CNS Neurol. Disord. Drug Targets 2008, 7, 393–409. [CrossRef] [PubMed]
12. Reneman, L.; Booij, J.; Lavalaye, J.; de Bruin, K.; Reitsma, J.B.; Gunning, B.; den Heeten, G.J.; van den
Brink, W. Use of amphetamine by recreational users of ecstasy (MDMA) is associated with reduced striatal
dopamine transporter densities: A [123 I]β-CIT SPECT study—Preliminary report. Psychopharmacology 2002,
159, 335–340. [CrossRef] [PubMed]
13. Fumagalli, F.; Gainetdinov, R.R.; Valenzano, K.J.; Caron, M.G. Role of dopamine transporter in
methamphetamine-induced neurotoxicity: Evidence from mice lacking the transporter. J. Neurosci. 1998, 18,
4861–4869. [CrossRef] [PubMed]
14. Biezonski, D.K.; Piper, B.J.; Shinday, N.M.; Kim, P.J.; Ali, S.F.; Meyer, J.S. Effects of a short-course MDMA
binge on dopamine transporter binding and on levels of dopamine and its metabolites in adult male rats.
Eur. J. Pharmacol. 2013, 701, 176–180. [CrossRef] [PubMed]
15. Dela Pena, I.; Gevorkiana, R.; Shi, W.X. Psychostimulants affect dopamine transmission through both
dopamine transporter-dependent and independent mechanisms. Eur. J. Pharmacol. 2015, 764, 562–570.
[CrossRef] [PubMed]
16. Quednow, B.B.; Jessen, F.; Kuhn, K.U.; Maier, W.; Daum, I.; Wagner, M. Memory deficits in abstinent MDMA
(ecstasy) users: Neuropsychological evidence of frontal dysfunction. J. Psychopharmacol. 2006, 20, 373–384.
[CrossRef] [PubMed]
17. Petschner, P.; Tamasi, V.; Adori, C.; Kirilly, E.; Ando, R.D.; Tothfalusi, L.; Bagdy, G. Gene expression
analysis indicates reduced memory and cognitive functions in the hippocampus and increase in synaptic
reorganization in the frontal cortex 3 weeks after MDMA administration in Dark Agouti rats. BMC Genom.
2018, 19, 580. [CrossRef] [PubMed]
18. Gorska, A.M.; Noworyta-Sokolowska, K.; Golembiowska, K. The effect of caffeine on MDMA-induced
hydroxyl radical production in the mouse striatum. Pharmacol. Rep. 2014, 66, 718–721. [CrossRef] [PubMed]You can also read