IMT traffic estimates for the years 2020 to 2030 - Report ITU-R M.2370-0 (07/2015) M Series Mobile, radiodetermination, amateur and related ...
←
→
Page content transcription
If your browser does not render page correctly, please read the page content below

Report ITU-R M.2370-0
                              (07/2015)

          IMT traffic estimates
    for the years 2020 to 2030

                             M Series
Mobile, radiodetermination, amateur
        and related satellite services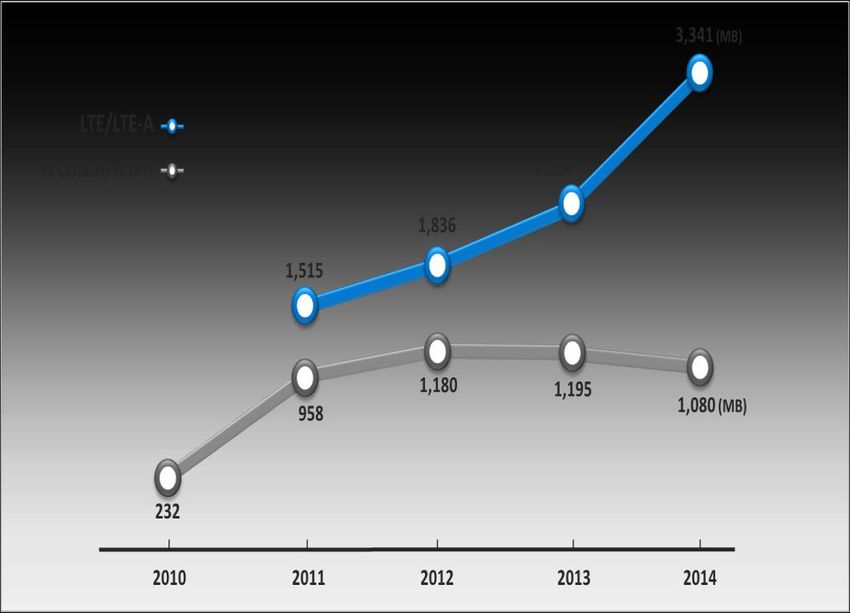
ii Rep. ITU-R M.2370-0
Foreword
The role of the Radiocommunication Sector is to ensure the rational, equitable, efficient and economical use of the radio-
frequency spectrum by all radiocommunication services, including satellite services, and carry out studies without limit
of frequency range on the basis of which Recommendations are adopted.
The regulatory and policy functions of the Radiocommunication Sector are performed by World and Regional
Radiocommunication Conferences and Radiocommunication Assemblies supported by Study Groups.
Policy on Intellectual Property Right (IPR)
ITU-R policy on IPR is described in the Common Patent Policy for ITU-T/ITU-R/ISO/IEC referenced in Annex 1 of
Resolution ITU-R 1. Forms to be used for the submission of patent statements and licensing declarations by patent holders
are available from http://www.itu.int/ITU-R/go/patents/en where the Guidelines for Implementation of the Common
Patent Policy for ITU-T/ITU-R/ISO/IEC and the ITU-R patent information database can also be found.
Series of ITU-R Reports
(Also available online at http://www.itu.int/publ/R-REP/en)
Series Title
BO Satellite delivery
BR Recording for production, archival and play-out; film for television
BS Broadcasting service (sound)
BT Broadcasting service (television)
F Fixed service
M Mobile, radiodetermination, amateur and related satellite services
P Radiowave propagation
RA Radio astronomy
RS Remote sensing systems
S Fixed-satellite service
SA Space applications and meteorology
SF Frequency sharing and coordination between fixed-satellite and fixed service systems
SM Spectrum management
Note: This ITU-R Report was approved in English by the Study Group under the procedure detailed in
Resolution ITU-R 1.
Electronic Publication
Geneva, 2015
ITU 2015
All rights reserved. No part of this publication may be reproduced, by any means whatsoever, without written permission of ITU.
Rep. ITU-R M.2370-0                                                                      1

                                                REPORT ITU-R M.2370-0

                             IMT traffic estimates for the years 2020 to 2030
                                                                                                                                             (2015)

                                                          TABLE CONTENTS

1      Introduction ....................................................................................................................         2

2      Related ITU-R Recommendations and Reports .............................................................                                   3

3      Trends impacting traffic estimation beyond 2020 ..........................................................                                3
       3.1        Drivers ................................................................................................................       3
       3.2        Shifting demography ..........................................................................................                 7

4      Mobile device proliferation ............................................................................................                  8
       4.1        Statistical information .........................................................................................              8
       4.2        Estimations of global number of mobile subscriptions to 2030 .........................                                        11

5      Global IMT traffic estimations to 2030 ..........................................................................                        15
       5.1        Estimation 1 ........................................................................................................         15
       5.2        Estimation 2 ........................................................................................................         19
       5.3        Estimation 3 ........................................................................................................         20

6      Traffic asymmetry ..........................................................................................................             22
       6.1        Description of traffic asymmetry ........................................................................                     22
       6.2        Examples of traffic asymmetry ...........................................................................                     23
       6.3        Traffic asymmetry volumes in recent years ........................................................                            24
       6.4        Traffic asymmetry estimation to 2024 ................................................................                         26
       6.5        Traffic asymmetry analysis in the space and time domains ...............................                                      29

7      Conclusions ....................................................................................................................         30

Annex 1 – Examples of basic esstimation methods .................................................................                               31

Annex 2 – Country-specific information .................................................................................                        32

Annex 3 – Some examples of subscribers’ traffic profiles ......................................................                                 40

Annex 4 – Traffic characteristics of future applications supported by IMT ............................                                          44
2                                        Rep. ITU-R M.2370-0

1        Introduction
Mobile communication has become one of the largest and most significant platforms in history,
transforming the way we communicate, experience entertainment and make use of the Internet. In
May 2015, over the current world’s population of 7.3 billion, there were about 7.5 billion mobile
subscriptions (including machine-to-machine/M2M) worldwide and about 3.7 billion people
connected1. As many people have multiple subscriptions, the total number of subscriptions is higher
than the number of people connected with mobile.
Mobile communications contribute positively to the economic and social developments of both
developed and developing countries. The evolution of mobile communications toward mobile
broadband (MBB)2 results in a new opportunity to bridge the gap between Internet-connected and
unconnected people. As of September 2014, 2.3 billion (or 30%) of mobile subscriptions were data
subscriptions3. The spread of smart mobile devices – smartphones and tablets – and the associated
innovative mobile broadband applications have resulted in an increase in the volume of mobile data
traffic and it is still growing, putting more emphasis on MBB.
ITU-R has developed two documents on traffic, as well as spectrum requirements to 2020, namely:
−      Report ITU-R M.2243-0 (11/2011) – Assessment of the global mobile broadband
       deployments and forecasts for International Mobile Telecommunications.
−      Report ITU-R M.2290-0 (12/2013) – Future spectrum requirements estimate for terrestrial
       IMT.
Report ITU-R M.2243 reviews both the market and traffic forecasts for IMT that were developed in
previous study periods (2000-2007) and assesses the perspectives and future needs of MBB that
would be supported by IMT until 2020. In addition, it provides traffic forecasts up to 2015, and in
some cases up to 2020, taking into account new market trends and market drivers.
Report ITU-R M.2290 provides a global perspective on the future spectrum requirements estimate
for terrestrial IMT. In order to estimate the spectrum requirements for 2020, this Report predicts
future traffic growth up to 2020 and derived input parameters representing a possible set of global
scenarios of the future mobile traffic growth.
The first Report shows that mobile data traffic has grown dramatically in the recent years; whilst the
second Report predicts more growth still to come towards 2020.
Building on the Reports described above, this Report analyses trends impacting future IMT traffic
growth beyond the year 2020 and estimates the traffic demands for the period 2020 to 2030. There
are many drivers impacting future IMT traffic growth and the characteristics of the traffic that are
envisaged to generate this growth are also described in this Report. These drivers are expected to
evolve over time, and this evolution will be different in each country due to social/economic
differences. This results in a wide variation in national estimates of traffic in the period 2020-2030.
Given this high degree of variability, the absence of a complete catalogue of all national estimates,
and the inability to collect a broader sample of national estimates, this Report has focused on global
traffic forecasts for the period 2020-2030.

1   GSMA Intelligence, April 2015, https://gsmaintelligence.com .
2   In this report, Mobile Broadband (MBB) refers to devices using technologies that can offer at least IMT
    capabilities.
3   “The State of Broadband 2014: Broadband for all”, A Report by the Broadband Commission, 21 September
    2014, page 19. http://www.broadbandcommission.org/Documents/reports/bb-annualreport2014.pdf .
Rep. ITU-R M.2370-0 3
2 Related ITU-R Recommendations and Reports
Report ITU-R M.2243-0 – Assessment of the global mobile broadband deployments and forecasts for
International Mobile Telecommunications
Report ITU-R M.2290-0 – Future spectrum requirements estimate for terrestrial IMT
3 Trends impacting traffic estimation beyond 2020
3.1 Drivers
There are many drivers influencing the growth of future IMT traffic such as the adoption of
IMT-20204 devices with enhanced capabilities that require increased bit-rates and bandwidth,
increased video usage, device proliferation and application uptake. Similar drivers increased traffic
in the transition from IMT-2000 to IMT-Advanced.
The main drivers behind the anticipated traffic growth are5:
– Video usage: Usage of video-on-demand services will continue to grow and resolution of
these videos will continue to increase. By 2020, it is expected that people will want to watch
high-resolution audio-visual content (HD/UHD), regardless of the way the content is
delivered. A study by Bell Labs estimates that by 2016 video streaming will account for
almost two-thirds of all mobile traffic.
– Device proliferation: In 2016, about 1 in 7 people (or about 1 billion) are forecasted to
purchase new smartphones. By 2017, more than 1.4 billion smartphones and tablets will ship,
becoming the fastest-growing category of consumer electronics6.
– Application uptake: The rate at which applications are being adopted is accelerating.
The annual global downloading of applications was 102 billion apps in 2013 and will grow
to 270 billion in 20177 (139, 180 and 225 billion in 2014, 2015 and 2016, respectively). It
should be noted that most applications are not used more than once after being downloaded.
This mobile application uptake and the usage of those will contribute to increased mobile
broadband traffic and, in addition, the amount of regular updates/upgrades to those hundreds
of billions applications will also increase mobile broadband traffic.
In addition to these major drivers of data traffic growth, there are other characteristics and trends that
are expected to impact the overall traffic demand in 2020-2025 and beyond.
Some of the key ones are illustrated in Fig. 1 followed by some further details:
4 The use of the term IMT-2020 will be defined by an appropriate ITU-R Resolution by the
Radiocommunication Assembly 2015.
5 J.P. Bonin, C. Evci and A.L. Sanders, “ Securing Spectrum through the ITU to fuel the growth of next
generation Wireless technologies ” Alcatel-Lucent Bell Labs Technical Journal (BLTJ), 18(2),
September 2013, http://onlinelibrary.wiley.com/enhanced/doi/10.1002/bltj.21607/ .
This document can be obtained upon request from the Radiocommunication Bureau.
6 Global Smartphone Market Analysis and Outlook: Disruption in a Changing Market, www.ccsinsight.com,
June 2014.
7 Gartner (September 2013), http://www.gartner.com/newsroom/id/2592315 .4 Rep. ITU-R M.2370-0
FIGURE 1
Drivers for future traffic increase
– Accelerated deployment of new IMT technologies (IMT-2020): New technologies will
increase the bit-rates and quality of experience (QoE)8, which will also increase customer
demand and decreases the cost/MB. This reduces the price to customers which in turn creates
more demand (price/demand elasticity).
– Machine–to-machine (M2M) applications and devices are also one of the fastest growing
segments for MBB usage and, eventually, increased mobile data demand. Billions more
machines will potentially utilise mobile networks to access online services and connect with
each other. While most M2M devices will be connected to a smartphone or a car or another
connected device for their own communication; each device could have separate
charges/subscriptions. The amount of M2M connections could be several orders of
magnitude larger than the world population.
– Enhanced screen resolution/content offering: Improvements in the resolution (screen)
capabilities (e.g. 4K UHD, etc.) and increasing demand for video downloading and streaming
leads to more traffic on mobile networks consumed on devices such as smartphones or
tablets.
– Proliferation of ambient screens or info-bearing surfaces to internet-connected devices for
up-to-date information, such as screens in elevators, screens for information, news, etc. in
trains will increase traffic more and more.
– Cloud computing: The demand for mobile cloud services is expected to grow because users
are increasingly adopting more services that are required to be ubiquitously accessible. As the
8 Quality of experience (QoE) measures total system performance using subjective and objective measures
of customer satisfaction. It differs from quality of service (QoS), which assesses the performance of
hardware and software services delivered by a vendor under the terms of a contract.Rep. ITU-R M.2370-0 5
number of users connecting through the mobile network to the cloud increases, the mobile
data traffic between mobile terminals, servers and storage in the cloud will continue to grow.
– Fixed broadband (FBB) replacement by MBB: In areas and contexts where MBB is used
as an alternative to wired broadband, such as copper, cable and fibre, this would contribute
to an increase in IMT traffic.
– MBB penetration rate is growing faster than FBB penetration rate. This will contribute to
increasing IMT traffic
– The continued growth of audio-visual media streaming: People use their mobile devices
more and more for streaming entertainment, with increased unicast media consumption due
to time shift (expansion of cloud/network DVR), space shift (availability of content
anywhere) and device shift (multi-screen, switch to mobile/portable devices). The DigiWorld
yearbook 2014 from IDATE9 indicates that linear TV still represents 90% of the world
audio-visual services market, growing 4.2% from the previous year; while OTT10 (over-the-
top) represents 4.4% of the market, growing 37%. Most of OTT traffic is delivered via
non-IMT networks. However, the part delivered by IMT is expected to increase in the future.
– The shifting demography/migration to cities and increased urbanisation trend: Given
that 600 cities of the world are producing 60% of the global gross domestic product (GDP),
much of the global population are, or will be, urban migrants, moving to cities particularly
in emerging markets as detailed in § 3.2.
– The evolution in usage and traffic characteristics of the current (web-browsing, voice,
streaming, etc.) and emerging services changing the utilisation rates, active bit rates, and,
hence, the net average up and down link traffic per device.
– Overall average traffic asymmetry ratio (UL/DL), which is currently dominant (from 1/4
to 1/9) in favour of downlink (DL) and is expected to increase in favour of DL (from 1/7 to
1/10) or more, in future.
– The (time and space) subscriber behaviour including the subscriber’s geographical
distribution, moving behaviour and application usage behaviour: It will impact on the space-
and time-domain traffic behaviour, leading to non-uniformly distributed traffic volume and
traffic asymmetry.
– Actual deployment timescale to make mobile broadband available to all potential users.
Furthermore, as indicated in Table 1, the following approaches can be considered to cope with
increasing traffic growth:
9 DigiWorld yearbook by IDATE: key indicators of the digital economy, November 2014,
http://www.idate.org/en/Forum/DigiWorld-Yearbook_40_.html .
10 Over-the-top content (OTT) refers to delivery of audio, video and other media over the Internet without
a multiple-system operator being involved in the control or distribution of the content. The provider may
be aware of the contents of the Internet Protocol packets but is not responsible for, nor able to control, the
viewing abilities, copyrights, and/or other redistribution of the content. OTT in particular refers to content
that arrives from a third party, such as Dramatize, DramaFever, Crackle, Hulu, myTV, NetD, Netflix,
NowTV or WWE Network, etc.6 Rep. ITU-R M.2370-0
TABLE 1
Approaches to cope with traffic increase11
Spectrum availability Amount of spectrum used by radio interface.
Technical enhancements Migration to innovative, more efficient techniques such as new radio
interfaces, codec improvements, use of multicast and reduction in
energy consumption.
New network structure/topology Number of radio sites and smaller cell sizes.
Offloading traffic Off-loading of traffic onto licence-exempt frequencies frees up
capacity in the macro network layer.
– Spectrum availability: The increased mobile traffic demand is driving the development and
deployment of MBB technologies such as IMT. However, the identified IMT spectrum is
currently not fully made available in many countries, which limits IMT usage in those
countries.
Sufficient and suitable spectrum resources are key factors to facilitate the development of
innovative services and applications and stimulate competition in mobile broadband
landscape.
– Technical enhancements: Along with the efficient radio interface technologies, video codec
improvements with more efficient compression methods will facilitate better handling of
traffic. For example, usage of H.265 instead of MPEG4 will reduce the amount of traffic.
As the number of users and connected devices grows, energy consumption might become a
limiting factor to traffic growth, reaching an unsustainable level of cost of operation and
greenhouse gas emissions12. The energy consumption of wireless networks in 2011 was
estimated to be 17 kWhr/year/user (excluding device consumption). With 5.9 billion users in
2011, this amounts to about 100 TeraWatt-hour/year, which is 0.5% of the electrical energy
consumption in the world. Therefore, improvements in energy efficiency are needed to keep
traffic increase affordable.
– New network structure/topology: Network densification such as applying new network
structure/topology also improves the network capacity. For example, the number of radio
sites as well as the usage of the small cell sizes is important elements for capacity increase.
The highest traffic demand occurs in dense urban centers at peak times. As a result, it is urban
hotspot sites that require additional capacity. However, in these areas networks are already
extremely dense today, and locations for new sites are hard to find.
Smaller cells are likely to be used to increase capacity without a need of tower based radio
sites. Femtocells can also provide capacity increase in many applications, for example
domestic environments.
11 The four approaches are not mutually exclusive, but are complementary.
12 GeSI SMARTer 2020 Report on “The role of ICT in driving a sustainable future”, December 2012,
http://gesi.org/SMARTer 2020.Rep. ITU-R M.2370-0 7
– Offloading traffic: Off-loading of traffic onto licence-exempt frequencies (e.g. using Wi-Fi
or LAA13) frees up capacity in the macro network layer.
The volumes of off-loaded traffic are significant. For example, Cisco estimates that in the
UK, 40% of cellular traffic was off-loaded in 2010 and was expected to increase to 42% in
2015. Advanced mobile networks have the ability to handle multiple applications and device
types with different network requirements, traffic load on the network, and levels of
profitability. A service provider can select (using Wi-Fi or LAA) to off-load traffic to license-
exempt spectrum depending on the required quality of service (QoS), off-loading at various
locations, over secured or open license-exempt access points.
3.2 Shifting demography
3.2.1 Migration to cities and increased urbanisation trend
An ever increasing number of people are living in cities. Every hour the global urban population
grows by 7 500 people, due to migration and natural population growth – that is more than 5 million
new city residents every month – driving the geographical expansion of cities. Already, the top
600 cities of the world are producing 60% of the total global GDP, with only 20% of the population.
Up to 60% of current mobile broadband data traffic is generated by the 30% of the global population
that lives in cities with a population density of more than 1 000 people per square kilometre14.
Therefore, investments in infrastructure, including telecommunications, are essential to cope with
this expected migration.
Cities will evolve, and future policies being applied to communication networks operations, including
the necessary spectrum regulation, to a great extent, will be defined by the large cities.
City planners need to address environmental issues, climate change, poverty and illiteracy. In
addition, there is a need to provide intelligent transport solutions, and speed up the flow of people,
goods and services which will in turn reduce fuel consumption. Smart grids can increase energy
efficiency, enable more renewable energy sources and support the widespread deployment of electric
cars. All of these can be supported by the deployment of broadband mobile telecommunications
networks.
The challenges vary from city to city, dependent on local and national circumstances, while noting
that emerging-market cities also have unique opportunities, and can choose to “leapfrog” stages of
development; emerging market cities can create solutions that are more efficient than those in many
developed urban areas as they would not have to cope with legacy infrastructure. Broadband
investments can have a strong impact, both direct and indirect, as mobile broadband spurs new
consumer and producer behaviours, functionalities and businesses acting as a platform.
In conclusion, future mobile broadband traffic growth is likely to be driven by the growth of large
cities.
3.2.2 Connected society
Connectivity in the context of digital economy implies all types of communications channels,
including e-mails, chatting, tweets, social networks, Instagrams, video calls, etc. An increase in the
number of channels and devices per person will result in traffic growth.
13 Licensed Assisted Access (LAA) will enable LTE in licence-exempt spectrum in a licensed assisted manner,
and coexists successfully with other licence-exempt applications.
14 Ericsson Mobility Report, November 2012.8 Rep. ITU-R M.2370-0
At the time of approval of this Report in 2015, about 28,000 GB of internet traffic is generated every
second by, amongst other things, 2 400 000 emails, 9 400 Tweets, 2 200 Instagram photo uploads,
1 800 Skype calls, 2 000 Tumblr posts, 49 000 Google searches and 103 000 YouTube videos15.
These data imply that the digital economy is evolving quickly across all parts of the world, creating
huge efficiency gains, but also enormous upheaval and disruption to traditional business.
Moreover, increased use of mobile to replace face-to-face activities and other traditional forms of
communication should also be taken into account. These can include the following:
– Online shopping overtaking traditional way of purchasing items in real time.
– An increase in online education as a complement to classrooms.
– Paperless billing and electronic payments overtaking paper bills/checks through the mail.
– More video and audio conferencing taking the place of face-to-face meetings, etc.
Since all these services will be accessible by mobile devices, and eventually will contribute to
improvements in social welfare; they will also generate significant additional mobile traffic.
4 Mobile device proliferation
4.1 Statistical information
The growth in smartphone subscriptions has been extensive in recent years. From 2010 to 2013, the
global number of smartphone subscriptions grew 280% from 0.5 billion to 1.9 billion. Also, in the
same timeframe, as can be seen from Fig. 2, mobile PCs and tablets increased from 150 million to
300 million.
FIGURE 2
Statistics on global smartphone and tablets subscriptions
15 Communication Statistics: http://internetlivestats.com/one-second/, June 2015.Rep. ITU-R M.2370-0 9
Statistical information figures from the ITU ICT statistics web-page (reproduced in Table 2 below)
also show an increase in the growth rate of MBB subscriptions. From 2007 to 2014, global MBB
subscriptions numbers climbed by 764% and growth in developing countries was extensive; from
43 million to 1 265 million, which is nearly 3 000%.
TABLE 2
MBB subscriptions from the ITU ICT Statistics(1)
Active mobile-broadband subscriptions (millions)
Years 2007 2008 2009 2010 2011 2012 2013 2014(2)
Developed 225 336 450 554 707 828 939 1 050
Developing 43 86 165 253 475 726 991 1 265
World 268 422 615 807 1 182 1 554 1 930 2 315
Active mobile-broadband subscriptions – Penetration rate (%)
Years 2007 2008 2009 2010 2011 2012 2013 2014(2)
Developed 18.5 27.5 36.6 44.7 56.8 66.4 75.1 83.7
Developing 0.8 1.6 3.0 4.5 8.3 12.4 16.8 21.1
World 4.0 6.3 9.0 11.5 16.7 21.7 26.7 32.0
NOTE 1 – Key ICT indicators for developed and developing countries and the world
http://www.itu.int/en/ITU-D/Statistics/Documents/statistics/2014/ITU_Key_2005-
2014_ICT_data.xls .
NOTE 2 – Projection.
On the other hand, statistical information figures from the ITU ICT statistics web-page (reproduced
in Table 3 below) show a decline in the growth rate of (global) mobile-cellular subscriptions. From
2005 to 2006 and from 2013 to 2014, global subscription numbers climbed by 24.5% and 3.8%,
respectively. In developed countries, the growth from 2013 to 2014 was 1.7%.10 Rep. ITU-R M.2370-0
TABLE 3
Global mobile-cellular subscription from the ITU ICT statistics (3)
Number of global mobile-cellular telephone subscriptions (millions)
Years 2005 2006 2007 2008 2009 2010 2011 2012 2013 2014(4)
Developed 992 1 127 1 243 1 325 1 383 1 404 1 411 1 447 1 490 1 515
Developing 1 213 1 618 2 125 2 705 3 257 3 887 4 453 4 785 5 171 5 400
World 2 205 2 745 3 368 4 030 4 640 5 290 5 863 6 232 6 662 6 915
Global mobile-cellular telephone subscriptions – Penetration rate (%)
Years 2005 2006 2007 2008 2009 2010 2011 2012 2013 2014(4)
Developed 82.1 92.9 102.0 107.8 112.1 113.3 113.5 116.0 119.2 120.8
Developing 22.9 30.1 39.1 49.0 58.2 68.5 77.4 82.1 87.6 90.2
World 33.9 41.7 50.6 59.7 68.0 76.6 83.8 88.1 93.1 95.5
NOTE 3 – Key ICT indicators for developed and developing countries and the world
http://www.itu.int/en/ITU-D/Statistics/Documents/statistics/2014/ITU_Key_2005-2014_ICT_data.xls .
NOTE 4 – Projection.
Table 4 shows statistical information for mobile subscriptions with different terminal types, which
comes from the Cisco VNI White Papers16 published in 2012 to 2015.
TABLE 4
Mobile subscriptions with different terminal types in the CISCO VNI White Paper
Mobile subscriptions with different terminal types 2011 2012 2013 2014(5)
(Million)
Non smartphone (Feature phone) 5007 4727 4688 4542
Smartphone 804 1339 1681 2120
Laptops 144 126 175 189
Tablets 14 41 47 74
M2M 227 224 329 494
NOTE 5 – Projection.
Feature phones: The number of non-smartphones (feature phones) peaked in 2011, since then their
number has been dropping. Given that smartphones are more appealing to customers, it can be
expected that the numbers of feature phones will continue to decrease as they are gradually replaced
by smartphones. However, unless forced by external triggers (regulatory or network operational) such
devices could still be present for an extended period of time.
16 Cisco Virtual Networking Index : Global Mobile Data Traffic Forecast Update, 5th. February 2015.
http://www.cisco.com/c/en/us/solutions/collateral/service-provider/visual-networking-index-vni/
white_paper_c11-520862.htmlRep. ITU-R M.2370-0 11
Smartphones: There is a strong growth in the number of smartphones. One relevant factor is the
substitution of a feature phone by a smartphone.
The development of mobile communications and electronic component technologies, better user
experience and lower price of smartphones will also contribute to this growth. Recently, new terminal
category called “phablets” have emerged which is considered as smartphone with a screen having an
intermediate size between a tablet and a smartphone. Therefore, Table 4 above includes phablet
numbers as part of smartphones.
Laptops: For laptops with IMT subscription, there was a trend to replace them by tablets, therefore
their number was dropping until 2012. However, recently due to advent of lightweight laptops and
their popularity, the number of subscriptions is increasing.
Tablets: The number of tablets has increased significantly in recent years. As of the year 2014 only
18% of tablets had a subscription (i.e. active SIM card), but it is estimated to increase to 31% by
201916.
With IMT broadband networks becoming increasingly robust and IMT-Advanced increasingly
deployed, many tablets without subscription will be connected to IMT networks via the tethering
mode of smartphones. These tablets contribute to increased IMT traffic (i.e. IMT traffic from
smartphones).
The development of mobile communications and electronic component technologies, better user
experience and lower prices contribute to an increase of the number of tablets.
M2M: Table 4 shows the number of M2M subscriptions remained flat until 2012. However, since
then a significant growth trend can be observed.
4.2 Estimations of global number of mobile subscriptions to 2030
4.2.1 Estimation 117
Concerning global mobile subscriptions, this estimation method consists of statistical data collection,
estimation of the increase of global mobile subscriptions through curve fitting. In addition, estimation
model used and parameters were based on the power function fitting (e.g. of curve fitting as depicted
in Annex 1) to estimate the year on year growth until 2030, and then calculate the mobile subscriptions
every year. In this estimation, statistical information was based Table 5 below.
TABLE 5
Statistical information used in the estimation
Years 2005 2006 2007 2008 2009 2010 2011 2012 2013
Global mobile
2 205 2 745 3 368 4 040 4 640 5 320 5 962 6 411 6 835
subscriptions (Million)
The differences between Table 3 and Table 5 are due to the fact this estimation uses some other
consultant companies’ data with different statistic metrics.
Figure 3 below depicts estimation of global mobile subscriptions and shows that they will grow
rapidly between 2020 and 2030.
17 Estimation provided by China.12 Rep. ITU-R M.2370-0
Estimation of global mobile subscriptions
18.0 16.4 17.1
15.1 15.7
16.0 14.4
13.2 13.8
14.0 11.9 12.5
10.7 11.3
12.0
Billion
10.0
8.0
6.0
4.0
2.0
0.0
2020 2021 2022 2023 2024 2025 2026 2027 2028 2029 2030
The number of global mobile subscriptions has already reached 6.7 billion in 2013. As a result of the
system performance improvements, widely used new device types and applications, the number of
global mobile subscriptions will increase significantly in the future. It was estimated that the number
of global mobile subscriptions could be 13.8 billion in 2025 and 17.1 billion in 2030.
Estimation of global mobile subscriptions of each type of terminal
The estimation method used for mobile subscriptions of each type of terminal was based on the curve
fitting approach and revised through normalization method based on the estimated result of global
mobile subscriptions. Based on power function fitting (an example of curve fitting) to estimate the
year on year growth of each type of terminal separately, the mobile subscriptions of each type of
terminal every year can be calculated.
One assumption is that the number of feature phone subscriptions will reduce gradually and the
feature phone will be substituted by other types of terminal around 2025. The estimated result was
finally revised through normalization method based on the estimated result of overall global
subscriptions (with the assumption that the proportion of each type of terminal obtained from
respective curve-fitting results is unchanged). The statistical information used in this estimation was
based on Table 6 below.
TABLE 6
Statistical information used in the estimation
Mobile subscriptions with different terminal types (Million) 2010 2011 2012 2013
Non smartphone (feature phone) 5 365 5 276 5 350 5 528
Smartphone 645 698 1 177 1 507
Tablet and other smart devices 144 241 267 348
Based on the estimation method described above, Fig. 4 provides estimation of global mobile
subscriptions with different categories from 2020 onwards.Rep. ITU-R M.2370-0 13
FIGURE 4
Estimation of global mobile subscriptions with different categories
18
16
14 4.5 5.0
0.4 3.7 4.1
12 0.8 3.4
1.5 3.0
Billion
2.3 2.6
10 2.8 2.2
3.2 1.8
8 1.5
1.3
6 11.0 11.3 11.6 11.9 12.1
9.8 10.4
4 7.8 8.8
6.3 7.0
2
0
2020 2021 2022 2023 2024 2025 2026 2027 2028 2029 2030
Smartphone Tablet and other smart devices Feature phone
With the development of mobile communications and electronic element technologies, better user
experience and lower price of devices will accelerate the growth rate of penetration of tablets between
2020 and 2030. It is estimated that the number of global subscriptions of smartphone could be 10
billion in 2025 and 12 billion in 2030. The number of global subscriptions of tablets and other smart
devices could be around 3 billion in 2025 and 5 billion in 2030. However, the number of non-
smartphone (feature phone) subscriptions will decrease rapidly during the same period.
Estimation of global M2M subscriptions
Estimation methods and procedures
Estimation methods used were based on the following steps:
a) Statistical data collection on global population, M2M connections and penetration ratio,
b) Estimate the increase of global population,
c) Estimate the penetration ratio of global M2M connections to global population through
S-curve (see Annex 1),
d) Calculation of the number of M2M connections by global population and the penetration
ratio of global M2M connections.
Estimation models and parameters
Global M2M subscriptions were based on S-Curve method to estimate the penetration ratio of global
M2M subscriptions to global population until year 2030 as depicted in Fig. 5. Such penetration ratio
is 0.03 in year 2010. One assumption is that the most rapidly development period of M2M industry
and terminals will be around year 2020, and this industry will become saturated no earlier than 2030.14 Rep. ITU-R M.2370-0
FIGURE 5
Estimation of global M2M subscriptions
120
100
97
80
Billion
84
60 70
57
40
45
34
20 26
19
10 14
0 7
2020 2021 2022 2023 2024 2025 2026 2027 2028 2029 2030
M2M Subscriptions
The estimated result of global population comes from the estimation report of UN 18. Moreover, this
estimate of M2M connections was based on the statistical information of M2M subscriptions as
depicted in Table 7 below.
TABLE 7
Statistical information of global M2M subscriptions
Years 2010 2011 2012 2013
Global M2M subscriptions (Million) 213 324 376 422
Based upon Fig. 5, the market of M2M is expected to grow between year 2020 and 2030. It is
estimated that the number of mobile connected M2M devices will be around 7 billion in 2020, which
is almost equivalent to the global population in January 2015. By 2030, this number could reach 97
billion, which would be more than ten times the estimated human population at that time.
4.2.2 Estimation 219
In the future, advanced connectivity will provide new ways of innovating, collaborating and
socializing. However, already today, more than 60% of the global population has access to mobile
communications, and in a few years from now more than 90% of the population will benefit from
IMT-based mobile broadband coverage. The mobile broadband traffic will be dominated by video
content carried by smartphones and other devices. As the time-frame for estimations extends further
into the future, it becomes increasingly challenging to forecast future subscriptions and mobile traffic
growth accurately. Consequently, by portraying scenarios, some discussion points (or assumptions)
are included to address the various aspects of the estimates.
As shown in Fig. 6, there are three scenarios of growth that can be assumed – one which is
conservative (“flat”), the second which is growth-accentuated (“high”) and the third which includes
18 United Nations, Department of Economic and Social Affairs, Population Division (2013). World Population
Prospects: The 2012 Revision, DVD Edition.
19 Estimation provided by Ericsson.Rep. ITU-R M.2370-0 15
assumptions of strong contributions from machine-to-machine (M2M) communication, and also the
integration of road-side and vehicular-to-vehicular communication, but most of all a strong impact of
the introduction of devices containing future IMT (IMT-2020) capabilities suggesting that all devices
that need to communicate will communicate (“very high”). Under these conditions, the number of
global subscriptions could be of the order of 10 billion, 15 billion or 20 billion around the year 2025
(shown on the right hand side of Fig. 6).
FIGURE 6
Estimations of global mobile subscriptions (2020-2025)
No of subscriptions
20.0
~20.0 (“very high”)
17.5
15.0
~15.0 (“high”)
12.5
10.0
Billion
~10.0 (“flat”)
7.5
5.0
2.5
Year 2020 2025
5 Global IMT traffic estimations to 2030
5.1 Estimation 120
The following section describes this global mobile traffic estimation.
Estimation methods and procedures
a) Statistical data collection on total global mobile traffic per month (including M2M) and the
average mobile traffic per device per month (several types of terminals were estimated
separately, including feature phone, smartphones, M2M devices, tablets and other devices).
b) Estimate the increase of global mobile traffic (including M2M) through curve fitting,
c) Estimate the average mobile traffic per device per month in the future through curve fitting,
several types of terminals were considered separately.
d) Calculate the total mobile traffic per month for each type of terminal based on the average
mobile traffic per device per month (see step c) and the mobile subscriptions of such type of
20 Estimation provided by China.16 Rep. ITU-R M.2370-0
terminal and revised through normalization method based on the estimated result of global
mobile traffic (including M2M, see step b).
e) Calculate the total mobile traffic (not including M2M).
Estimation model and parameters
Global mobile traffic (including M2M): based on power function fitting (an example of curve fitting)
to estimate the year on year growth until year 2030, then calculated the mobile traffic every year.
Table 8 shows the statistical information used in the estimation.
TABLE 8
Statistical information used in the estimation
Years 2005 2006 2007 2008 2009 2010 2011 2012
Mobile traffic (PB/Month) 0.9 4 15 38 92 256 597 885
Figure 7 below shows an estimation of global traffic through 2030.
FIGURE 7
Estimations of global mobile traffic from 2020 to 2030 (M2M traffic not included)
traffic/month
5000 4394
4500
4000
3500 2905
3000
EB
2500 1910
2000
1500 1259
830
1000 353 543
500 57 91 144 226
0
2020 2021 2022 2023 2024 2025 2026 2027 2028 2029 2030
This Figure shows that mobile traffic (without M2M traffic) is estimated to grow at an annual rate of
around 54% in 2020-2030.
The global mobile traffic per month is estimated to 543EB in 2025 and 4 394EB in 2030.
Figure 8 below shows mobile traffic (including M2M traffic) growing at an annual rate of around
55% in 2020-2030. The global mobile traffic per month would then be estimated to reach to 607 EB
in 2025 and 5 016 EB in 2030.Rep. ITU-R M.2370-0 17
FIGURE 8
Estimations of global mobile traffic in 2020-2030 (M2M traffic included)
traffic/month
6000
5016
5000
4000 3327
EB
3000
2194
2000 1439
938
1000 390 607
62 99 158 249
0
2020 2021 2022 2023 2024 2025 2026 2027 2028 2029 2030
Estimation of mobile traffic by different service types
This section includes the estimated results of mobile traffic by different service types for the years
2020-2030. Video, non-video, M2M and other types of services are considered.
Both subscriber behaviour and service characters, especially future new services, are very important
factors impacting the estimation of traffic volume. Other information such as business model,
operation model and accounting rule are also helpful.
Estimation methods and procedures
Estimation methods and procedures were based in the following steps:
a) Statistical data collection on total global mobile traffic per month (including M2M) and the
mobile traffic by service types per month (several types of services are estimated separately,
including video, non-video and M2M).
b) Estimate the increase of global mobile traffic (including M2M) through curve fitting.
c) Estimate the mobile traffic of each type of service separately, and revise through
normalization method based on the estimated result of global mobile traffic (including M2M,
see step b).
Estimation models and parameters
Mobile traffic by service type: based on power function fitting (an example of curve fitting) to
estimate the year on year growth, different services were estimated separately and revised through
normalization method based on the estimated result of global mobile traffic as seen in Fig. 9 (with
the assumption that the proportion of each type of service obtained from respective curve-fitting
results unchanged). Table 9 shows the statistical information used in the estimation.18 Rep. ITU-R M.2370-0
FIGURE 9
Estimation of mobile traffic by different service types globally
traffic/month
6000
5000
EB
4000
3000
2000
1000
0
2020 2021 2022 2023 2024 2025 2026 2027 2028 2029 2030
Non-Video Video M2M
TABLE 9
Statistical information used in the estimation
Service Type (TB/Month) 2010 2011 2012 2013
Non-Video 111 272 266 387 406 124 669 249
Video 117 943 307 869 455 216 858 026
M2M 7 462 23 009 23 566 49 973
Mobile internet traffic and M2M traffic will grow dramatically after year 2020. Video traffic will be
4.2 times than non-video in 2025 and 6 times in 2030. The traffic volume consumed by M2M services
will be 7% of the total in 2020 and 12% of the total in 2030.
Estimation of mobile traffic per subscription
Estimation 1 provided some figures using a method based on the estimated results of global mobile
traffic divided by global mobile subscriptions (M2M traffic was not included).
Figure 10 shows estimation of average global mobile traffic per subscriptions per month from 2020
to 2030.Rep. ITU-R M.2370-0 19
FIGURE 10
Estimations of global mobile traffic per subscriptions per month from 2020 to 2030
(M2M not included)
traffic/month
300.0
257.1
250.0
200.0 177.0
150.0
GB
121.3
100.0 83.5
57.5
39.4
50.0 18.0 26.8
5.3 8.1 12.1
0.0
2020 2021 2022 2023 2024 2025 2026 2027 2028 2029 2030
The popularity of large-screen smart, high resolution devices is still a key driver of the growth of
mobile data traffic. As the convenient and high performance smart devices like smartphones and
tablets are widely used around world, in addition to the growth of mobile subscriptions, the mobile
traffic volume consumed by each user will increase continually. It is estimated that each subscriber
will consume 39.4 GB of data traffic per month in 2025 in average and this amount will be around
257 GB in 2030.
5.2 Estimation 221
One of the estimates as indicated in Fig. 11 covers a period of 2020-2030, building on the estimates
done in Report ITU-R M.2243.
Figure 11 shows one possible scenario of mobile traffic growth in ZB22/year between the years 2020
and 2030. Note that this is called a scenario, not a forecast, because it is based on a set of assumptions
which, if changed could lead to a different scenario.
The main assumptions for this possible scenario are a continued growth in penetration of
smartphones, tablets, etc. – in many regions limited (for smartphones) by population as penetration
approaches 100% – and a continuous growth in traffic by each device/user which assumes continuous
evolution of screen resolution and increasing viewing times for video which are the main contributors
to traffic volumes. Each smartphone, as of the year 2013, generates 600 MB/month of traffic based
on a global average, noting that this figure varies considerably among countries. While the current
21 Estimation provided by Ericsson.
22 Network capacity units:
Zetabyte ZB=1021 B 1 Zetabyte = 1 000 Exabytes = 1 000 0000 Petabytes
Exabyte EB=1018 B 1 Exabyte = 1 000 Petabytes = 1 000 000 Terabytes
Petabyte PB=1015 B 1 Petabyte = 1 000 Terabytes = 1 000 000 Gigabytes
Terabyte TB=1012 B 1 Terabyte = 1 000 Gigabytes
Gigabyte GB=109 B 1 Gigabyte = 1 000 Megabytes
Megabyte MB=106 B
Kilobyte kB=103 B20 Rep. ITU-R M.2370-0
growth rate in mobile internet traffic is 30%, based on estimates of historical development of internet
traffic and consideration of dilution by less-affluent subscribers in the later years, our reasoning is
that the per device traffic will gradually decline from the current 30% to 15% through the year 2030.
Another assumption is that the resolution of pictures and video content will be raised significantly; in
addition, screen sizes will also be larger. The screens referred to are phones, tablets and PCs (not
TVs), for example sizes for smartphones/tablets could grow from 5½ inches to 8 inches. The screen
resolution is also expected to increase while it is true that codec efficiency increases might
compensate, the screen resolution will grow faster, so the effective data-rate will increase.
Other assumptions are increased mobile enterprise connectivity; increased M2M traffic – but these
may, or may not, be excessively high; we have therefore applied a moderate level in this scenario.
The model is considered robust, as it is built on well-known and well-observed mechanisms. It does
not take into account any significantly disruptive forces, nor is it exhaustive in its approach where all
possible scenarios are examined. Rather, if the traffic grows as it does today – with new applications
similar to Facebook, Twitter, YouTube, etc. – the scenario presented above is one possibility of what
the traffic will look like in the years 2020–2030.
FIGURE 11
Scenario of global mobile traffic growth in ZB/year between 2020 and 2030
5.3 Estimation 323
Figure 12 shows another study forecast as a combined plot of the actual and forecasted global mobile
data traffic growth for the time periods 2010–2013 and 2014–2030, respectively. The cumulative
compound annual growth rate (CAGR) relative to 2010 was depicted. For the time period 2010–2018
the actual and forecasted CAGR values provided in the “CISCO Visual Networking Index: Global
Mobile Data Traffic Forecast Update” white papers are shown in the bar plots16.
23 Estimation provided by Nokia.Rep. ITU-R M.2370-0 21
FIGURE 12
Forecast from a study for global mobile broadband traffic growth for the period 2010 – 2030
The forecast model used in this study for mobile broadband traffic for the entire time period
2010-2030 (blue lines) were based on the combination of three factors:
– total subscription base (includes broadband and voice/SMS subscriptions) growth of 15% for
‘upper’ (light blue line) or 5% for ‘lower’ (dark blue line) forecast per year;
– broadband connectivity penetration in the subscription base to reach 100% by 2030
(grey line); and
– subscription traffic growth of 25% per year (not shown, but incorporated in the blue lines).
In this forecast, the broadband connectivity penetration models the uptake of broadband services (i.e.
switch to a broadband subscription) relative to the total number of subscriptions and mathematically
is modelled with an S-curve. The 100% broadband connectivity penetration reached by 2030
corresponds to a growth of 10-times in number of broadband subscriptions compared to 2010. The
constant 25% per year growth in broadband traffic per subscription is motivated by the observed
general (not only wireless) technological evolution during the past decades. Therefore the total
number of broadband subscriptions is given by the multiplication between the broadband connectivity
penetration curve (grey line) and the 5% or 15% per year subscriber base growth.
The resulting traffic forecasts indicate a global growth between 2 300-times or 14 000-times from
2010 to 2030. The ‘lower’ and ‘upper’ forecasts assumed the possible scenarios without and with
machine type communication included, respectively.
Figure 13 shows the same study forecasts for mobile broadband traffic growth as in Fig. 12, only for
the time period 2020 – 2030 (relative to 2020) and indicates a global growth between 26-times and
70-times from 2020 to 2030.22 Rep. ITU-R M.2370-0
FIGURE 13
Forecasts from the same study for global mobile broadband traffic growth for the period 2020–2030
Annex 2 provides country-specific information concerning both mobile subscriber estimations and
mobile traffic forecasts for certain country.
6 Traffic asymmetry
6.1 Description of traffic asymmetry
Asymmetry is the difference between the average amount of traffic in the uplink and the downlink
direction. Average traffic asymmetry is dependent upon a range of factors including the:
− nature of each application (web-browsing, voice, streaming, etc.) in terms of average up and
down link traffic;
− average mix of applications according to each category of device (mobile, smartphone, tablet,
laptop) and subscription generation;
− mix of device type per generation (i.e. IMT-2000 smart phone vs. IMT-Advanced smart
phone.
Furthermore, all of these factors are expected to evolve over time and will be strongly dependent
upon cultural differences between different countries, the impact of operator tariffing strategy on
subscriber behaviour, migration toward next generation technologies, macro-economic factors
impacting ability to pay for advanced end-user devices and subscription packages, etc. These factors
are expected to result in a wide range of observed traffic asymmetry rates across different countries,
radio access technology generations and over time.
In recent years the uplink-downlink asymmetric usage of the mobile service has increased
significantly. The introduction of mobile broadband has made it possible for users to apply the sameRep. ITU-R M.2370-0 23
behaviour as they did with fixed broadband. This has resulted in many asymmetric applications
finding their way into the mobile networks.
The DL dominates with around 80-90% of data traffic while UL contributes around 20-10%. This is
based on the lowest traffic asymmetry ratio where UL/DL is 1/4 that corresponds to 80% (DL) =
4x20% (UL) over 100% traffic with UL+DL. As video content increases, it is estimated that the
proportion of DL content will grow even further in the near future.
When considering traffic asymmetry, applications can be grouped into different categories, such as:
− Bi-directional: point-to-point (P2P) applications (file sharing, P2P media), email, instant
messaging, voice-over-IP (VoIP), video conferencing, etc. These applications generate, on
average similar amounts of uplink and downlink traffic volumes: emails and instant messages
are both sent and received; shared files are both uploaded and downloaded, etc. The high
UL/DL ratio of unknown traffic hence implies that most of this traffic probably comes from
either P2P applications or VoIP and videoconferencing applications.
− Request-response: social networking, web browsing, etc. These applications have a typical
request - response communication pattern where requests (uplink) are typically much smaller
than responses (downlink). It is interesting to note the significantly higher uplink traffic ratio
for social networking. Social networking is not only focused on viewing existing content, but
users also actively contribute to create content; therefore average "request" sizes are larger
than for web browsing.
− Download dominated: software update and download, online video, online audio, web TV,
etc. These applications are practically download only. The 2-3% uplink ratio is mainly due
to TCP ACK packets in uplink direction as well as small requests in uplink preceding
software or media downloads.
6.2 Examples of traffic asymmetry
Figure 14 shows the ratio of the uplink traffic to total traffic. The colour changes indicate a range,
based on actual measurements, with the darkest portion indicating the average split amongst the
measured networks. For example, looking at “file sharing”, the ratio (of uplink traffic to total) could
vary between less than 15% to over 30%, depending upon the network measured. It should be noted
that the measurements are made at the IP layer, not the radio layer.
FIGURE 14
Ratio of uplink traffic volume (vs. total)
50%
45%
40%
35%
30%
25%
20%
15%
10%
5%
0%
video audio app & media web browsing social file sharing email real time
stores networking communication
Also Tables 10 and 11 depict the UL/DL traffic distribution for specific types of applications.24 Rep. ITU-R M.2370-0
TABLE 10
UL/DL traffic distribution over different applications24
Services % downlink Source
25, 26
Web browsing/e-mail 80%
90%
25, 26
Video 98%
80-92%
25
VoIP and IM 50%
25
File sharing 80%
25
Other 60%
27 26
Interactive service 72%
TABLE 11
Traffic distribution over different applications28
% of global traffic
Services Year Value in PB/month
in 2014
Video 2014 1 400 43%
Other 2014 540 17%
Social networking 2014 420 13%
Web browsing 2014 290 9%
Encrypted 2014 210 6%
Software download & update 2014 200 6%
File sharing 2014 130 4%
Audio 2014 70 2%
6.3 Traffic asymmetry volumes in recent years
Data continues to be a major area of growth for mobile operators as emphasized in
Report ITU-R M.2038, which says that “in broadband multimedia communications, asymmetric
traffic is envisaged to be dominant”. A GSMA Report29 confirms this trend, saying that in
24 Global Internet Phenomena Report: Sandvine-Intelligent Broadband Networks, www.sandvine.com,
February 2013.
25 http://fr.slideshare.net/zahidtg/plum-june2011-benefitsof14ghzspectrumformultimediaservices
26 http://www.gsma.com/connectedliving/wp-content/uploads/2013/03/Presentation-5-Madame-Hunag-
China-Mobile.pdf slide 3 for Mobile Broadband Era.
27 A service which provides the means for the bidirectional exchange of information between users or between
users and hosts. According to ITU-R M.1224, interactive services are subdivided into three classes of
services: conversational services, messaging services and retrieval services.
28 http://www.ericsson.com/TET/trafficView/loadBasicEditor.ericsson: data from EMR and Exploration
tool in 2014.
29 http://www.gsmamobileeconomy.com/GSMA_ME_Report_2014_R2_WEB.pdf, page 18.Rep. ITU-R M.2370-0 25
September 2013, 75% of the data traffic of one of the major mobile network operators in Europe was
video streaming and internet browsing.
Table 12 shows the data traffic volume measured in Japan in September 201430.
TABLE 12
Statistics on mobile network traffic in Japan (data only, December 2014)
Measured traffic data rate Uplink Downlink UL/DL ratio
Average data traffic rate counted on GGSN/EPC per 114.3 Gbps 757.5 Gbps 1/6.6
month (Increase from the last year) (+75%) (+45%)
Average data traffic rate per subscription per month 693.9 bps 4 599 bps 1/6.6
(Increase from the last year) (+57%) (+31%)
These values are averages per month over all hours.
Data for China31 shows traffic asymmetry ratios of between 1/4 and 1/6 in favour of DL. It should be
pointed out that the uplink-downlink traffic asymmetry ratio given in Table 12 is data only, voice
traffic is not included. This range is similar for particular operators in different countries (USA, Japan
and Europe) in 201024.
An additional example comes from a study provided by one European Operator 32 as depicted in
Fig. 15. The Figure shows specifically how the ratio between uplink and downlink in a LTE network
has evolved in recent years. It is important to note that in only two years (from 2012 to 2014), the
difference between the uplink and downlink traffic has increased from 1/2 to 1/10. As in Table 12,
here again only data traffic is considered, voice traffic is not included, except for VoIP in applications
such as Viber, Skype, etc. This operator claims that for other markets, the development of traffic is
similar, but the timing (year/week) can differ slightly.
30 http://www.soumu.go.jp/johotsusintokei/field/data/gt010602.pptx .
31 http://www.gsma.com/connectedliving/wp-content/uploads/2013/03/Presentation-5-Madame-Hunag-
China-Mobile.pdf slide 3 for Mobile Broadband Era.
32 Source: TeliaSonera AB, 2014.You can also read