Greenhouse Gas emission Baselines and reduction Potentials from BuildinGs in mexico - A Discussion Document
←
→
Page content transcription
If your browser does not render page correctly, please read the page content below
Sustainable Buildings
                                       & Climate Initiative

                                                       Greenhouse Gas
                                                       Emission Baselines and
                                                       Reduction Potentials
                                                       from Buildings in
                                                       Mexico
                                                       A Discussion Document
United Nations Environment Programme
Copyright © United Nations Environment Programme, 2009

This publication may be reproduced in whole or in part and in any form for
educational or non-profit purposes without special permission from the copyright
holder, provided acknowledgement of the source is made. UNEP would appreciate
receiving a copy of any publication that uses this publication as a source.

No use of this publication may be made for resale or for any other commercial
purpose whatsoever without prior permission in writing from the United Nations
Environment Programme.

Disclaimer
The designations employed and the presentation of the material in this
publication do not imply the expression of any opinion whatsoever
on the part of the United Nations Environment Programme
concerning the legal status of any country, territory, city or                 UNEP
area or of its authorities, or concerning delimitation of its
frontiers or boundaries. Moreover, the views expressed                  promotes environ-
do not necessarily represent the decision or the                     mentally sound practices
stated policy of the United Nations Environment
Programme, nor does citing of trade names or
                                                                 globally. This document is pub-
commercial processes constitute endorsement.                 lished in electronic format only thereby
                                                              eliminating the use of paper, ink, and
                                                            transport emissions. You are encouraged
                                                            print it only when absolutely necessary.
                                                               UNEP will print the document on de-
                                                                  mand on 100% recycled paper.
Greenhouse Gas Emission
Baselines and Reduction
Potentials from
Buildings in Mexico

A Discussion Document

                               Sustainable Buildings
                               & Climate Initiative

UNEP DTIE
Sustainable Consumption &
Production Branch
15 Rue de Milan
75441 Paris CEDEX 09, France
Tel: +33 1 4437 1450
Fax: +33 1 4437 1474
E-mail: unep.tie@unep.org
www.unep.fr/scp/sun
Acknowledgements

            Acknowledgements

            This report was commissioned by the
            United Nations Environment Programme – Sustainable Buildings & Climate Initiative

            Sponsored by:
                Centre Scientifique et Technique du Bâtiment
                                CSTB, France

            Author:
            Odón de Buen R., M.Sc.1

            Expert Review Panel:
             Mr Arturo Echeverría                                  Asociación de Empresas para el Ahorro en la Edificación
                                                                   (AEAEE)

             Ms. Astrid Bolbrugge                                  Instituto del Fondo Nacional de la Vivienda para los
                                                                   Trabajadores (INFONAVIT)

             Ms. Cristina González - Zertuche                      Consejo Nacional de Vivienda (CONAVI)

             Ms. Julia Martínez                                    Institituto Nacional de Ecología (INE)

             Dr. David Morillón                                    Instituto de Ingeniería from UNAM

             Ms. Cristina Montenegro                               UNEP Regional Office for Latin America and the Caribbean.

             Dr. Peter Graham                                      Sustainable Buildings & Climate Initiative UNEP – DTIE , Paris,
                                                                   & University of New South Wales, Australia

             Mr. Stephane Pouffary                                 ADEME, France

             Mr. Niclas Svenningsen                                UNEP – Division of Technology, Industry & Economics

             Dr. Kaarin Taipale                                    Marrakech Task Force on Sustainable Buildings and
                                                                   Construction, Finland
                  Note: The opinions expressed in this report are those of the author and do not necessarily reflect the
                  opinions of those who were consulted or their organizations.

            Editors:
            •     Peter Graham, United Nations Environment Programme Sustainable Buildings & Climate Initiative
                  (UNEP-SBCI) & Faculty of the Built Environment, University of New South Wales, Australia
            •     Jenny Yamamoto, UNEP Consultant
            •     Chen Nan, Consultant to Centre Scientifique et Technique du Bâtiment CSTB, France

            Design / Layout:
            Thad Mermer, The Graphic Environment

            1 About the Author: Odon De Buen was principle consultant for the Mexico section on the report “Green Building in North America” that was
            prepared for the Commission for Environmental Cooperation (2007); Adviser for the Association of Enterprises for Energy Efficiency in Buildings
            (AEAEE) (2004 to date); General Director of the National Commission for Energy Conservation (CONAE)

2
Contents

Table of Contents

Acknowledgements                                                                    2

Table of Contents                                                                   3

1 Key Outcomes: Summary for Decision-Makers                                         5
1.1    Process                                                                      5
1.2    Estimated emissions                                                          5
1.3    A zero growth scenario                                                       5
1.4    Overall GHG reductions                                                       5
1.5    Cost of GHG reductions                                                       6
1.6    Recommendations                                                              6

2 Context                                                                           9
2.1    Climate                                                                      9
2.2    Population                                                                  10
2.3    The services sector                                                         12

3 Building Stock                                                                   15
3.1.   Households                                                                  15
3.2    Commercial buildings                                                        16

4 Energy Use                                                                       21
4.1.   Residential sector.                                                         21
4.2.   Commercial buildings                                                        24

5 Baseline: The Building Sector’s Contribution To National Greenhouse Emissions    29
5.1.   Actual carbon-equivalent emission trends by sector                          29
5.2.   Projected carbon-equivalent emission trends by sector                       29
5.3.   Building Sector’s Contribution to National Greenhouse Emissions             31
5.4.   Participation in Mexico’s total CO2 eqv. emissions                          35

6 Sustainable Development Priorities and Priority Issues for the Building Sector   37
6.1    General climate change policies and programs                                37
6.2    Policies and programs related to the buildings´ sector                      37
6.3.   Other issues                                                                40

7 Sustainable Development Priorities and Priority Issues for the Building Sector   43
7.1.   Residential buildings                                                       43
7.2.   Commercial buildings                                                        46

8 Conclusions and Recommendations                                                  51
8.1.   Conclusions                                                                 51
8.2.   Recommendations                                                             53

Annex 1: Methodology for estimating GHG emissions from buildings in México         57
1.     Residential sector                                                          57
2.     Commercial (non-residential) sector                                         59

References                                                                         63

                                                                                               3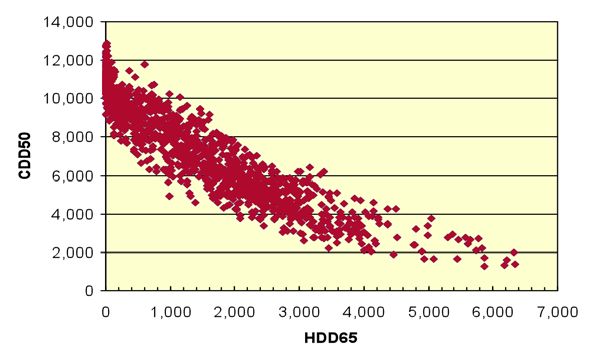
Chapter 1
Key Outcomes:
Summary for Decision-Makers
Chapter 1

Key Outcomes:
Summary for Decision-Makers

This report represents the first comprehensive description of the factors that determine the present and
future impacts of residential and commercial buildings in México on climate change.

1.1.     Process

The elaboration of the present document involved a process of information gathering on built space and

                                                                                                                      Section 1
energy use in Mexico´s residential and commercial sectors. It also involved the development of a model
to estimate greenhouse gas emissions of those sectors based on the available information.

It is important to note that there is a systematic lack of data on these matters in Mexico, particularly
for the commercial sector but also on more specific issues (like energy end use information) for both
sectors. To deal with this lack of data, many assumptions were made by the author, most of them based
on other related data but sometimes on his personal judgment.

1.2.     Estimated emissions

The present exercise estimates residential and commercial buildings emissions of close to 75 MTon in
2006. This means that buildings represented about 12% of total present CO2 eqv. emissions in Mexico
in that year.

To have reference values for the year 2000, a simple backwards extrapolation was performed based of
the 2006 to 2007 growth rate. A total of 70,250 KTon in GHG emissions was estimated. A potential
growth to up to close to 500 MTon for 2050 has been estimated. Therefore there would be an increase
of GHG emissions by a factor of 6.7 if nothing is done.

1.3.	A zero growth scenario

All of the assumptions for the parameters considered in the model use for this report were made to reach
a zero growth target, that is, that total emissions have a constant value over the 2006-2050 period.
To reflect this, two important assumptions are made: (1) that the average intensity of electricity use in
households in temperate climate does not grow and (2) that the average energy intensity for space
cooling in households in hot climate also remains constant.

1.4.	Overall GHG reductions

In general, measures in the residential sector are reflected in the average end use intensities of five end
uses (lighting, space cooling, refrigeration, “other electrical” and water heating). In the commercial
sector, reductions are reflected by energy end use intensities by building type. In the residential sector,
the proposed measures would reduce the growth of CO2 eqv. emissions from the residential sector
to 63% of the baseline in 2050. Most of the reductions come from measures related to electricity
(96%) and, by end uses, the largest fraction of the reductions come from greater efficiency in “other
electrical” uses (50%), space cooling (42%), refrigeration (3%) water heating (3%), and lighting (2%).
In the commercial sector, technology improvements would result in reductions in the energy intensities

                                                                                                                     5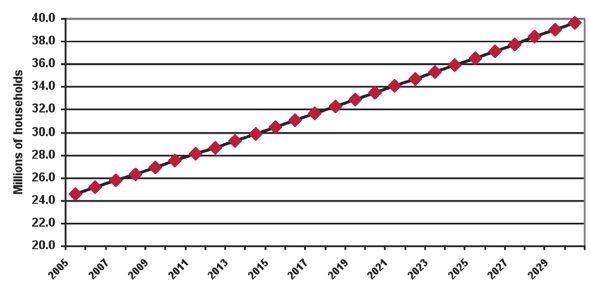
Key Outcomes: Summary for Decision-Makers

             of space cooling, lighting and auxiliary equipment by 75%, and of 60% in energy intensity for water
             heating, and auxiliary motors.

             1.5.    Cost of GHG reductions

             In the residential sector, the estimated cost of the measures, at 2008 values, would be close to 103
             billion US$. In terms of unit costs per Ton of CO2 eqv. avoided (under very general assumptions) the
             cheapest measure involves “other electrical” while water heating (which involves the use of solar energy)
             has the higher cost. In the commercial sector, the cost of the mitigation measures was estimated as a
             general percentage (3%) of the unit global construction costs of the buildings, so estimated cost is close
             to 21 billion US$ by 2050.

             1.6.	Recommendations

             Short-term
             •   Establish the building sector as a priority in mitigation policy. To date, there are no specific laws
                 involving sustainable development priorities for buildings in Mexico. There are, though, a number
                 of policies and programs involving both the government and the private sector that have direct and
                 indirect impacts on the CO2 eqv. emissions that result from residential and commercial buildings
                 operations. These policies and programs have mixed results, and lack coordination and a steady
                 effort. Making buildings a stated by the federal government priority (be it for energy efficiency in
                 particular or for GHG mitigation in general) could help solidify the efforts.
             •   Reinforce the Instituto del Fondo Nacional de la Vivienda para los Trabajadores (INFONAVIT)
                 Green Mortgage program and go ahead with Consejo Nacional de Vivienda (CONAVI) sustainable
                 housing program. The Green Mortgage program by INFONAVIT and the use of subsidies by
                 CONAVI to increase the sustainability aspects of new housing are key programs to reach a zero
                 emissions growth in the residential sector.
             •   Increase the intensity and broaden the scope of Comisión federal de Electricidad (CFE) Demand
                 Side Management (DSM) programs. CFE has been operating (directly or through the Fideicomiso
                 para el Ahorro de Energía Eléctrica-FIDE) a number of successful DSM programs, mainly aimed
                 at lighting and space cooling in the residential sector. These programs should recover their wide
                 scale scope.
             •   Start a formal, integrated and coordinated effort of data gathering to have a better idea of the size
                 and the energy use characteristics of commercial buildings. Recognize, in the government’s data
                 collection system, the importance of buildings as a specific category of energy use and integrate
                 comprehensive data bases that include—by building type—building stock, floor area, vintage,
                 energy use by energy source and energy intensity.

             Medium-term
             •   Strengthen federal, state and local agencies that enforce compliance of building regulation. Even
                 though Mexico has two mandatory energy efficiency standards that apply to commercial buildings
                 (one for lighting systems and the other for the building’s envelope) [1, 2], they are not fully effective
                 as they have been poorly enforced, particularly the one that applies to the building’s envelope. This

6
Chapter 1
implies the need for greater involvement of local governments to integrate the standard into local
building codes.
• Use the Clean Development Mechanism (CDM) programmatic alternative to add resources to
government programs. The CDM under the programmatic category, can help collect additional
resources to government sponsored programs. This can be the case of the federal, state and
municipal housing programs.
• Implement surveys and detailed audits by building types and climatic regions in to identify energy
end-use technology and intensities. This work is to supplement the efforts done in the short term
and would help to improve the design of programs in the sector and should be done for both the
Section 1
residential and commercial sectors.
• Promote “Green building” strategies. Either through their inclusion as mandatory in building codes
or through tax incentives, local governments should, as its is becoming best practice in developed
countries, promote the use of well established “Green building” certification systems.
Long-term
• Eliminate subsidies to energy use and use them to promote energy efficiency. Though it is clear
that there is a need for economic support for low-income families, a large but not clearly defined
fraction of the subsidies goes to households that do not need it, thus giving the wrong economic
signal for energy efficiency. In this case, the recommendation is to use a significant fraction of
the resources that are used to cover the subsidy to cover the cost of purchase of energy efficiency
measures.
• Keep Minimum Efficiency Performance Standards (MEPS) of main energy using equipment harmonized
with those of the US and Canada. Based on the fact that there are number of equipment (electric
motors, refrigerators and AC units) that already have the same MEPS for the three North American
countries, México should follow the lead of the US and Canada to strengthen its own standards.
7Chapter 2 Context
Chapter 2 Context Mexico is a federal territory formed by 31 states and a Federal District (Mexico City or D.F.), and is divided into 2446 municipalities. There are close to 200000 populated locations in the country, of which only 178 have 50000 or more inhabitants; in contrast, there are close to 150000 populations with less than 100 inhabitants [3]. 2.1. Climate Mexico’s geographical location and variable altitudes give place to a wide variety of weather conditions. Located in the temperate region of North America, the Mexican territory comprises several climate conditions and zones, ranging from tropical to desert to some spots with very low temperatures in the winter. In terms of climate conditions, three main zones can be identified in Mexico: a. The very arid, arid and semi-arid zones comprise almost 56% of the territory and are located to the north and center of the territory. These zones are influenced by the high pressure extratropical belt which prevents cloud formation and rain incidence. b. The sub-humid zones which comprise 37% of the territory and are located in the mountain regions (Sierras) and coastal plains of the Pacific Ocean, the Gulf of Mexico and the northeast of the Yucatan Peninsula. These zones are influenced by tradewinds. c. The humid zones, located in the southern portion of Mexico, comprise the remaining 7% of the territory, where the ascent to the mountain regions begins and the climate conditions are influenced by the accumulation of a small portion of the humidity of the Gulf of Mexico and the Pacific Ocean. In general terms, Mexico is a country with warm weather. About three quarters of Mexico´s territory has warm temperatures (above 18 °C), while only 1% of the territory has cold temperatures (22 °C 37% Semi-warm 18° to 22 °C 39% Tempered 12° to 18 °C 23% Semi-cold and cold
Context

          Figure 1. Distribution of areas by heating and cooling degree-days (HDD65 y CDD50)
          for 1,400 locations in Mexico

          Source: Estimated from SMN data for 1400 locations of Mexico [5].

          It is important to note that several regions in Mexico present extreme climatic variations throughout the
          year. The Chihuahuan Desert has recorded the lowest temperatures of the country during the winter,
          less than -20.0° C. The highest temperatures are registered in the Sonora Desert during the summer,
          frequently above 45.0° C. The coastal plains of the Gulf of Mexico and the Pacific Ocean register
          temperatures which oscillate between 15.6° C and 40.0° C. These regions together with the Tehuantepec
          Isthmus, the state of Chiapas and the Yucatan Peninsula also register the major rainfall ratio, with and
          average of 1500 mm of pluvial precipitation [6].

          2.2.    Population

          According to the population census update of 2005, the total population of Mexico in 2005 was
          103.3 million inhabitants, an increase from 97.5 in 2000. Thus, the average annual growth rate of the
          population in that period was of 1.19%. This rate of growth represents a reduction in growth rates of
          previous years, from 3.35% in the 1960-1970 period (Table 2) [3].

          Table 2. Population growth rates in Mexico 1900-2000
           PERIOD               1960-1970            1970-1990           1990-1995            1995-2000
           Growth rate          3.35                 2.59                2.03                 1.54
          Source: Instituto Nacional de Estadística y Geografía (INEGI) [3]

          According to the 2000 census and the 2005 census update, urban population in Mexico represented
          74.6% of total population in 2000 and 76.5% for 2005. The five largest metropolitan areas are Mexico

10
Chapter 2
City Valley, Guadalajara, Monterrey, Puebla-Tlaxcala and Toluca, represent more than 28.7% of the
total population. The metropolitan area of Mexico City Valley is the largest urban populated area, with
18.5 million inhabitants, that represent close to the 17.9% of the national population [3].
In terms of population density, the Consejo Nacional de Población (CONAPO) estimates a national
average of 50.0 and 53.3 inhabitants per km2 in 2000 and 2006, respectively. Mexico City has the
smaller territorial extension and the greater population density, -5972 inhabitants per km2 in 2005-. In
contrast, the state of Baja California Sur, registers the lowest population density, only 7 inhabitants per
km2 [7].
Section 2
In the rural context, population has significantly diminished over the past decade. In the period 2000-
2006, the population living in the more than 182000 rural communities with less than 2500 inhabitants
had a reduction, as it passed from 25.4% of Mexico´s total population in 2000 to 23.5% in 2006 [7].
CONAPO estimates that Mexican population will increase to 111.6 million in 2010, 127.2 million in
2030 and 129.6 million in 2050. Compared with the tendencies observed throughout the twentieth
century, the average annual growth rate will be reduced to 0.88% in 2010 and than 0.38% in 2030.
For the purposes of this study, the number of households grows as population grows and the number of
occupants per household diminishes. For the population projections, a rate of growth of 1.19 % starting
in 2005 was used, with this latter rate reducing at 4.3% per year was. Under these assumptions, the
population of Mexico totals, as estimated by CONAPO, 130 million people in 2050 (Fig. 2).
Figure 2. Population growth and tendencies in Mexico 2006-2050
Source: Estimates by the author based on CONAPO´s data [7].
Also, the national urban population is expected to increase to 76.2 and 90.2 million inhabitants in 2010
and 2030, respectively, which will represent 68.2% (2010) and 70.9% (2030) of the total expected
population.
11Context
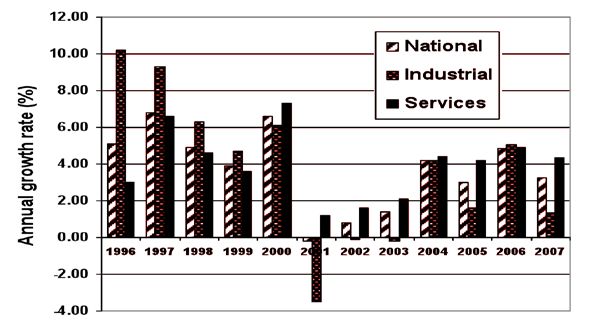
2.3. The services sector
In Mexico, economic statistics reflect the increasing importance of the tertiary (services) sector. This is
evident in the growth of the gross domestic product (GDP), where the services sector has out-performed
the industrial sector since 2000. The same situation occurs for the Gross Domestic Product (GDP) of the
economy as a whole (Fig. 3) [8].
Figure 3. Annual growth rate for nationwide GDP and the GDP for industry and
services sector (1996 to 2007) 2
Source: INEGI [8]
To analyze the present and future Greenhouse Gas (GHG) emissions from the services´ sector, his
study will incorporate the following types of commercial buildings: hotels, office buildings, retail and
department stores, hospitals, restaurants, warehouses, and schools.
2 INEGI. http://www.inegi.gob.mx/est/contenidos/espanol/rutinas/ept.asp?t=agr01&c=469&s=est
12Chapter 2
13Chapter 3 Building Stock
Chapter 3
Building Stock
3.1. Households
The number of households in Mexico increased from 22.3 to 24.8 million between 2000 and 2005
according to the latest census data, which represents an increase of 11.4 percent. In comparison, the
number of households from 1970 to 2000 increased of 9.8 to 22.3 million, an increase of nearly
127.0 percent [3].
As Table 3 shows, demographic dynamics, with a tendency to the reduction of the population, have
favored the reduction of the average number of occupants in a household in Mexico. Whereas in 1970
the average number of people living in a household was of around five members, for 2000 it was
reduced to 4.3 people and 4.2 in 2005 [3].
Table 3. Number of households and occupants in Mexico 2000 and 2005
CONCEPT 2000 2005
Number of households (million) 22.3 24.8
a/
Average household growth rate 3.0 2.0
Number of occupants (million) 95.4 100
a/
Average occupants per 4.3 4.2
household
Source: INEGI [8]
This trend is also reflected in the smaller presence of the homes of greater size and in the progressive
increase of the small ones. Table 4 shows that the smaller households (one and two bedrooms with a
separate kitchen) have represented the most important percentage of the total household number in
Mexico.
Table 4. Percentage of households and number of rooms in each household in Mexico
1960-2000
Number of rooms 1990 a/ 2000 a/
One room b/ 27.1 23.2
Two rooms b/ 26.7 24.4
Three rooms b/ 20.3 23.1
Four or more rooms b/ 25.9 29.3
a/ Based on total occupied households, b/ Not counting the kitchen as an additional room, NA/ Not available
Source: INEGI, Mexico [8]
To establish the baseline for residential buildings, numbers for the year 2005 were used and a number
of assumptions was made in regard to the rate of change of the population (that includes a rate of
change of the population growth rate) and of the number of occupants per household (Table 5).
15Building Stock
Table 5. Values of parameters related to population and number of occupants per
household used to estimate future GHG emissions from the residential sector
CONCEPT Value Units
Population in 2005 103.0 Million
Occupants per household in 4.2 People/HH
2005
Rate of population growth in 1.2 %/yr
2005
Rate of reduction of rate of 4.3 %/yr
population growth
Rate of reduction of occupants/ 1.2 %/yr
household from 2006 to 2030
Under those assumptions, the number of households is estimated to grow to about 54 million in 2050
(Fig. 4).
Figure 4. Number of households in Mexico 2006-2050
Source: Estimates by the author based on CONAPO´s data [7].
3.2. Commercial buildings
Energy use and built space data on commercial buildings in Mexico is scarce and dispersed.
In the case of energy use, the only data available for the services sector is that of use by type of energy
source by not only buildings but municipal services (such as lighting and water pumping) [9].
For built space, there is not a single, unified data source either on the number of buildings or their area,
so, in order to have and estimate, a survey of a number of data sources (mostly websites of chambers and
associations related to the services sector) was performed. From that data obtained (that may not have
16Chapter 3
included total built area and/or average area per type of building) some very general considerations
were made by the author in order to have an acceptable (but conservative) approximation.
To analyze the present and future GHG emissions from the services´ sector, this study will incorporate the
following types of commercial buildings: hotels, office buildings, retail and department stores, hospitals,
restaurants, warehouses, and schools.
3.2.1. Warehouses
According to data obtained from a business magazine, there are 25.5 million of m2 of built space in
Class A industrial parks in México [10]. Some of this space is used as warehouses for the services sector.
So, for this type of buildings, an estimate of 5 million m2 is used for the calculations.
3.2.2. Hotels and restaurants
According to Mexico´s Confederación Nacional Turística (CNT), in 2007 there were 14963 hotels in
the country, with nearly 585 thousand rooms for an average of 39 rooms per hotel. Also, the rate of
growth in the number of rooms has been 4.7% per year since 2000, while the number of installations
has been 5.5% [11].
No data on built area for hotels was found so 30 m2 per room (that includes common areas in the
hotels) was used to estimate the total area of 12 million m2.
Regarding restaurants and according to the Cámara Nacional de la Industria de los Restaurantes
(CANIRAC), there are 243000 affiliated establishments and 96% are small businesses and 98% of them
the service area is less than 150 m2 [12].
To estimate built area for restaurants only those that are not small businesses (these are included under
the “other” category) were considered and under the assumption of 400 m2 per establishment (for a
total of 2 million m2).
In total, the total area for hotels and restaurants was estimated in 14.0 million m2.
3.2.3. Office Buildings
Data obtained from the business sector of a national newspaper on office buildings built space indicates
4.6 million m2 of class A, B and C buildings in 2008 [13]. This is the value used for the calculations.
3.2.4. Wholesale and retail
According to the Asociación Nacional de Tiendas de Autoservicio y Departamentales (ANTAD) this
association (which represents the retail industry in Mexico) is composed of 14034 stores, of which 2244
are retail, 957 are department stores and 10833 are specialty stores, accounting for a total sales space
of 15.2 million m2 [14].
3.2.5. Theaters & Recreational Facilities
No direct is data available on this type of buildings but data on malls (that always include some type of
theater) indicate 27.8 million m2 (from a density of 0.27 m2/person) of built area in México [15].
Assuming that theaters take 10% of total space in a mall, and estimated 2.8 million m2 are considered
for this type of buildings.
17Building Stock
3.2.6. Hospitals
According to the National Health Information System (Sistema Nacional de Información en Salud),
there are 4300 hospitals in Mexico with a total of close to 120 thousand beds [16].
No data on built area was found, so 50 m2 per bed (that includes common spaces) was considered for
an estimate of six million m2.
3.2.7. Schools
According to Ministry of Education data, there are close to 242000 schools in Mexico. Close to 100000
are primary schools, 86700 for preschool, while more than 37000 are for secondary education (middle
and high school) [17].
No data on built area was found so, assuming 500 m2 per school, an estimate of 121 million m2 for
schools is considered.
3.2.8. Other buildings
This category of buildings includes all of the small businesses for an estimate of 110,000 m2.
18Chapter 3
19Chapter 4 Energy Use
Chapter 4
Energy Use
4.1. Residential sector.
4.1.1. Total energy use
Residential energy use in Mexico covers a number of services, mainly cooking, water heating, refrigeration,
air conditioning, lighting and other electricity related end-uses.
According to the 2006 national energy balance, final energy consumption of the residential sector
represented 705.1 Petajoules (PJ), which amounted up to 16% of the total final energy consumption in
Mexico (4390.7 PJ) [18].
LPG was the main energy source used in the residential sector, with a participation of 37.8% (266.5 PJ),
followed by firewood with 35% (247.2 PJ). Electricity contributed with 22.7% (160 PJ) of the final energy
consumption, natural gas 4.2% (29.6 PJ) and kerosene 0.3% (1.8 PJ). Residential energy consumption
grew 0.1% between 2005 and 2006 [18].
For the purpose of this study, electricity use by type of customer is classified under two groups by generic
type of climate: temperate and hot. This classification is based on Mexico’s residential electricity tariffs,
that are defined by average temperature in the two hottest months and under seven different rates, one
for temperate climate and six for different levels of average temperature above 25 oC. There is also a
third group that is defined by its level of consumption above a certain threshold (that varies by rate and
time of the year). This is identified as “high consumption” (Table 6) [19].
Table 6. Electricity rate structure for the residential sector in Mexico
Rate Average minimum temperature High consumption limit
for application (in °C) (in kWh/month)
1 Less than 25 250
1A 25 300
1B 28 400
1C 30 850
1D 31 1000
1E 32 2000
1F 33 2500
Source: CFE [19]
For this study, the temperate category refers to households in locations under the temperate climate rate
and the hot category to those households located in the locations with the other six rates.
In terms of electricity use, by the end of 2007 the Mexican electricity sector had little more than 26.3
million residential users. Of this total, 55% were located in temperate climates 43% in hot climates and
2% are high consumption (Fig. 5) [20].
21Energy Use
Figure 5. Residential end-users by type of climate 2004-2006
Source: CFE [20]
4.1.2. Average energy use
As there are no recent studies on average energy use by type of energy and/or end use, the numbers
were estimated based on direct and indirect data obtained from different sources and on engineering
estimates.
4.1.2.1. Water heating
For water heating the assumptions were that all of the residents of a household with hot water shower
daily using 65 liters of water with a temperature increase of 15o C in a water heater that is 50% efficient.
That results in 2.98 GJ per person per year.
For the purpose of calculating emissions, a mixture of natural gas and LPG was considered (based on
the mixture referred in the national energy balance) [18].
4.1.2.2. Cooking
An energy consumption of 8.0 GJoules per household is used for the calculations [21]. This consumption
is only for houses with gas stoves (70% of the total) [22].
As with water heating and for the purpose of calculating emissions, a mixture of natural gas and LPG
was considered (based on the present mixture) [18].
4.1.2.3. Electricity
For 2006, average yearly power consumption for households in hot climate is 2,200 kWh, 1200 kWh
in temperate climate and a little more than 6000 kWh by high consumption customers (Fig. 6) [20].
For the purposes of this study, an average consumption for 2005 of 1.4 and 2.2 MWh/yr for temperate
and hot climate was, respectively, assumed.
22Chapter 4
Figure 6. Residential yearly consumption by type of climate (2004-2006)
Source: CFE [20]
In terms of electricity end uses, the following considerations were made (for 2005):
• Refrigeration. An average of 800 kWh/yr for the total number of households.3
• Lighting. An average of 440 kWh/yr for the total number of households (Four 60 Watt lamps used
five hours every day of the year).
• Space cooling. An average of 600 kWh/yr for the hot climate households. The estimate is equal to
the difference in the yearly unit consumption between temperate and hot climate households.
• Other electrical. The intensity of this end use is defined as the difference between total intensity per
household mines the three above.
4.1.3. Projected energy consumption by the residential sector
Mexico’s Secretaría de Energía (SENER) presents a series yearly planning exercises that projects energy
consumption by types of energy and end-users for ten years [23-25]. Aggregating the different estimates
by fuel a projection was made that is specific for the residential sector (Fig. 7)
Figure 7. Energy consumption in the residential sector (1995-2005) and trends to 2015
Source: SENER [23-25]
3 This is a value between the highest value ( of 1,100 kWh/yr for a ten year refrigerator) and the lowest value (400 kWh/yr for a new
refrigerator).
23Energy Use
4.2. Commercial buildings
4.2.1. Average energy use
There is very little data on average energy use of commercial buildings in Mexico and even less on
energy end uses. Some data on electricity use for lighting and space cooling in commercial buildings
can be found in a series of reports prepared by the Fideicomiso de Ahorro de Energía Eléctrica (FIDE)
some years ago.4
To compensate such a limitation, data on commercial building energy use in Canadian commercial
buildings from Natural Resources Canada (NRC) was used as a main reference for end-use intensity
[26]. This was done under the assumption that the intensity of energy end-uses such as lighting and
water heating are about the same and that other end uses can be adjusted for the specific conditions of
Mexico. So the following assumptions were made:
a. Energy use for heating was assumed to be zero.
b. Consider the energy intensity for space cooling as twice the value of NRCan building data base,
except for schools (that keep the same intensity as in the NRCan database).
The numbers that result from this process range from an intensity of 580 MJ/m2-yr for warehouses to
1480 MJ/m2-yr for hospitals (Fig. 8).
Figure 8. Estimated average energy use per year in Mexico´s commercial buildings
by end use and building type (2005).
Source: Estimates by the author using NRCan data [26]
To calibrate these numbers, the resulting electricity intensity per unit of area for some of the building
types (Fig. 9) was compared with data collected from sheets of individual projects published by FIDE.
4 They are reports done on demonstration projects and do not have consistent information.
24Chapter 4
Figure 9. Estimated average electricity use in Mexico´s commercial buildings by end
use and building type (2005).
Source: Estimates by the author using NRCan data [26]
4.2.2. Total energy use
According to Mexico’s National Energy Balance for 2006, the overall energy consumption of the
commercial sector totaled 135.2 petajoules, with electricity representing 70.0 petajoules [18].
However, total energy use for the commercial buildings as reported by SENER´s energy statistics only
partially reflect the sector’s energy consumption, in particular electricity use, as the energy accounting
by the national utility is based on voltage of service and not on type of installation.
Reviewing the “commercial” subsector’s electricity use defined in National Energy Balance for 2005 against
data from Comisión Federal de Electricidad (CFE) for that same year, it was found that the total refers to
energy users at rates 2, 3 and 7, which correspond to distribution-level (low tension) services [20].
Also, upon reviewing the long list of case sheets from FIDE and data compiled by the Comisión Nacional
para el Ahorro de Energía (CONAE) in its public buildings program, a majority of typical services-sector
facilities (hotels, restaurants, shopping centers, schools and hospitals) are connected at OM and HM
rates, which are categorized by CFE as “medium industry.”
Thus, not only CFE statistics but also national energy reports underestimate the services or the services
sector’s weight in the energy balance.
To put the importance of commercial buildings in national energy consumption into perspective, and
to show the extent of its evident underestimation, information on the size of the sector and its energy
consumption was collected from various sources.
In particular, data from FIDE case sheets, an old version of the CONAE public building database [27],
CFE sales statistics [20] and data from companies and associations involved in the sector that have
been referred to in the building stock.
25Energy Use
Using the area estimated for all types of buildings that are not small buildings (they are considered
under “other” in the global estimates) and the electricity intensities defined above, the estimated total
electricity use that is not included in the commercial buildings totals is 22350 GWh (Table 7).
Table 7. Estimated electrical power consumption in large service-sector buildings in Mexico
Type of building Total building area Unit consumption Total use
(m2) (kWh/m2-yr) (GWh)
Warehouse 5000 148.32 742
Hotels & Restaurants 14000 310.60 4348
Office Buildings 4600 158.91 730
Wholesale & Retail 15200 189.81 2885
Theatres & Recreational 3000 242.75 728
Facilities
Hospitals & Health 6000 335.57 2013
Facilities
Schools 121000 90.11 10903
TOTAL 168800 - 22350
Source: Estimates by the author from a variety of data sources [10-15]
4.2.3. Future energy use
Based on SENER´s projected energy consumption by types of energy and end-users for ten years, and
the estimates for electricity use in large buildings not considered in the National Energy Balance (at a
2.3% rate), total energy use is expected to grow to 275 PJoules in 2015 (Fig. 10).5
Figure 10. Energy consumption in the commercial sector (1995-2005) and trends to 2015.
Source: Estimates by the author from a variety of data sources [10-16]
5 SENER, 2007. Prospectiva del Sector Eléctrico, Prospectiva de Gas Natural y Prospectiva de Gas LP 2007-2016. Secretaría de Energía,
México.
26Chapter 4
27Chapter 5 Baseline: The Building Sector’s Contribution To National Greenhouse Emissions
Chapter 5
Baseline: The Building Sector’s
Contribution To National
Greenhouse Emissions
5.1. Actual carbon-equivalent emission trends by sector6
The latest national GHG inventory was prepared by the Instituto Nacional de Ecología (INE) for 2002.
For that year, GHG emissions for the six gases listed in Appendix A of the Kyoto Protocol were estimated
at 643183 KTon of carbon dioxide equivalent (CO2 eqv.), with the caveat that figures for the category
of Land Use, Land-Use Change and Forestry (LULUCF) are still preliminary [28].
The results of the Inventory show a contribution of GHG emissions from the different categories in terms
of CO2 eqv. as follows: energy, 61% with 389497 KTon; LULUCF, 14% with 89854 KTon; waste, 10%
with 65584 KTon; industrial processes, 8%, with 52102 KTon; and agriculture, 7% with 46146 KTon
(Table 8).
Table 8. Total CO2 eqv. emissions in 1990 and 2002 (LULUCF not included) in México
(in KTon)
Source 1990 2002
Energy 312,027 389,497
Fossil fuel use 279,863 350,414
Fugitive emissions 32,164 39,082
Industrial processes 32,456 52,102
Agriculture 47,428 46,146
Waste 33,357 65,584
TOTAL 425,268 553,329
Source: Instituto Nacional de Ecología,[28].
By sectors, energy generation contributed 24% of the country’s total emissions in 2002, while transport 18%,
manufacturing and the construction industry 8%, residential, commercial and agricultural sectors 5%; and
fugitive methane emissions 6%. GHG emissions in the energy category, expressed in CO2 eqv., showed an
increase from 312027 KTon to 389497 KTon from 1990 to 2002, which represents a 25% increase.
An estimate of CO2 eqv. emissions from direct fossil fuel combustion based on energy use as reported in
the 2005 National Energy Balance, comes to a total of 396000 KTon. By sectors, the transportation sector
had the greatest share of those emissions with 36%, while power generation had 30%, the oil sector 19%,
industry 9% and the sum of the residential, commercial and agricultural sectors with 6% (Fig. 11).
5.2. Projected carbon-equivalent emission trends by
sector7
An estimate of CO2 eqv. emissions from direct fossil fuel combustion based on SENER´s ten-year
projections of energy consumption results in a 31% growth from 2005 to 2015 in direct CO2 eqv.
emissions (which represents a yearly growth rate of 2.74%).
6, 7 It should be noted that this estimation is based on government data and does not consider the assumption made in this document to reflect
(as it is stated in this report) the fact that electricity use that goes to the services sector is accounted as industrial use.
29Base-Line: The Building Sector’s Contribution to National Greenhouse Gas Emissions
By fuels, the greatest growth would occur in the combustion of gasoline and natural gas with 47%, while
fuel oils would be reduced in 20% (Fig 12).
By sectors, the transportation will have 47% more CO2 eqv. emissions in 2015 than in 2005, while
the oil sector will grow by 30%, industry and the power sector by 21%, and the aggregation of the
residential, commercial and agricultural sectors by 17% (Fig. 13).
Figure 11. Estimated contribution of direct CO2 eqv. emissions from fossil fuel
combustion by sectors in 2005
Source: Estimates by the author based on SENER and IPCC data [29] [30]
Figure 12. Estimated evolution of direct CO2 eqv. emissions from fossil fuel combustion
by sectors (2005 to 2015)
Source: Estimates by the author based on SENER and IPCC data [29] [30]
30Chapter 5
Figure 13. Estimated growth of direct CO2 eqv. emissions from fossil fuel combustion
from 2005 to 2015
Source: Estimates by the author based on SENER and IPCC data [29] [30]
5.3. Building Sector’s Contribution to National Greenhouse
Emissions
Baselines for both the residential and the commercial buildings are based on energy consumption
projections that are assembled from a number of factors subject to change. These projections were
assembled in a model integrated in an Excel spreadsheet (see ANNEX I: Methodology).
In order to define the baseline factors, the growth rates that determine the model projections were
calibrated to obtain the same energy use values with the Ministry of Energy projections for 20158. These
baseline factors are reflected in both the numbers annotated above and the rates of change that are
defined for each of the building sets.
CO2 eqv. emissions are calculated with the emission factor referred in Table 9.
Table 9. CO2 eqv. emissions factors for LP gas, natural gas and electricity in México
Type of energy Emission factor
(Tons of CO2 eqv./TJ)
LP Gas 67.57
Natural gas 56.61
Electricity (2005) 166.00
Source: Estimates by the author based on SENER and IPCC data [29] [30]
To reflect the evolution of the power generation mix, it is assumed that the emission factor for electricity
changes through the years at a rate of 0.5 % per year.
8 2015 is used because that is the latest year for which there are government projections in terms of energy use.
31Base-Line: The Building Sector’s Contribution to National Greenhouse Gas Emissions
5.3.1. Residential buildings
For electricity consumption, the 2005 values for fraction of households in temperate climate and unit
electricity use in hot and temperate climate are used (Table 10).
Table 10. Values of parameters related to electricity use9
CONCEPT Value Units
[Source, where appropriate]
Fraction of households in 0.56 %
temperate climate [20]
Unit electricity use in temperate 1.50 MWh/yr
climate (2005) [20]
Unit electricity use in hot 2.10 MWh/yr
climate (2005) [20]
Rate of growth of unitary power 0.00 %/yr
use in temperate climate
Rate of growth of unitary power 4.00 %/yr
use in hot climate
Rate of growth of refrigerator -1.00 %/yr
intensity
Power consumption by “other 0.20 MWh/yr
electrical” in 2005
Rate of growth of “other 7.60 %/yr
electrical” use intensity
Rate of growth of lighting -1.00 %/yr
intensity
This serves to establish power use for air conditioning as a general average for all the households
located in hot climates. The use of differential rates of growth for these two parameters is done to reflect
the growth of air conditioning.
It is important to note that the concept of “other” involves those uses that come from a growing
electrification of households and includes clothes and dishwashers, more and larger TVs, computers,
and systems with stand-by consumption (clocks, cable boxes, etc.) This is why (besides the fact that it
serves to calibrate the aggregation of end-uses with total electricity estimations by SENER) its rate of
growth is significant.
Also a negative growth rate for refrigeration and lighting reflect an on-going tendency as new, more
energy efficient refrigerators and lamps replace older, less efficient technology.
For LPG and natural gas consumption, unit consumptions per household (for cooking) and per person
(for water heating) were considered, together with levels of stove and water heater saturation. No growth
of these parameters is considered (the uses will grow with the population and number of households) but
a rate of growth of the fraction of solar heat is used to reflect the growth in the use of solar energy. Also
the fraction of households using LPG as fuel (to apply the high emissions factor) were used (Table 11).
9 The growth rates that determine the model projections were calibrated to obtain the same energy use values with the Ministry of Energy
projections for 2015.
32Chapter 5
Table 11. Values of parameters related to energy use in residential buildings
CONCEPT [Source, where Value Units
appropriate]
Cooking [21] 8.00 GJ/hh-yr
Stove saturation [22] 70.00 % of hh
Water heater saturation [22] 50.00 % of hh
Unit hot water consumption 2.98 GJ/person-year)
Rate of growth of fraction of solar 0.00 % per yr
heat
Fraction of households w/LPG [22] 89.00 %
With those assumptions, present (2008) CO2 eqv. emissions are close to 50,000 KTon CO2 eqv. per
year. In terms of projections, while population is expected to grow 26% by 2050, residential sector
emissions are estimated to grow close to nine-fold to that year (Fig. 14).
Figure 14. Baseline projections of CO2 eqv. emissions of Mexico’s residential buildings
(2006-2050)
It should be noted that, given the assumptions, most of the growth in emissions will come from electricity
generation to feed space cooling and the “other” uses, which were given growth rates to match the
official projections for electricity and total energy use by the residential sector in 2015.
5.3.2. Commercial buildings
A set of values for the growth rates are defined to establish a baseline for commercial buildings that
matches SENER´s projections for 2015. The year 2015 is used because that is the latest year for which
there are government projections in terms of energy use.
First, there are rates of growth of built area by type of building (Table 12).
33Base-Line: The Building Sector’s Contribution to National Greenhouse Gas Emissions
Table 12. Growth per year of electricity use by type of commercial building
CONCEPT Value
Warehouses 4.0
Hotels & Restaurants 4.0
Office Buildings 4.0
Wholesale & Retail 4.0
Theatres & Recreational Facilities 4.0
Hospitals & Health Facilities 4.0
Schools 3.0
Other Services 3.0
Second, growth of energy intensity by end use was assumed as equal to zero.
Third, there are rates of growth of electricity use of the unaccounted fraction from large buildings and
the evolution of CO2 eqv. emissions factor (Table 13).
Table 13. Values of parameters related to electricity use in commercial buildings10
CONCEPT Value Units
Growth of electricity use 2.3 % per yr
Change in unit electricity CO2 -0.5 % per yr
eqv. emissions
Under those assumptions, CO2 eqv. emissions resulting from the energy use of commercial buildings in
2008 are around 31000 KTon, while this value grows close to 105000 KTon in 2050 (Fig. 15).
Figure 15. Baseline projections of CO2 eqv. emissions of Mexico´s commercial buildings
(2005-2050)
10 These numbers were established by the author and are conservative.
34Chapter 5
5.3.3. Consolidated residential and commercial buildings´ emissions
Consolidating the estimated CO2 eqv. emissions´ numbers for residential and commercial buildings it
was found that they were close to 75000 KTon in 2006 and, under the assumption stated above, they
will grow up to close to 510000 KTon in 2050 (Fig. 16).
Figure 16. Baseline projections of CO2 eqv. emissions of Mexico´s residential and
commercial buildings (2006-2050)
5.4. Participation in Mexico’s total CO2 eqv. emissions
As it was noted above, 61% the Mexico’s GHG emissions came from direct fossil fuel combustion and
an estimate of CO2 eqv. emissions from combustion of fossil fuels—based on energy use as reported in
the National Energy Balance in 2005—comes to a total of 396000 KTon. This would mean that total
emissions for 2005 would be about 650000 KTon.
This means that buildings represent about 12% of total emissions in Mexico.
35Chapter 6 Sustainable Development Priorities and Priority Issues for the Building Sector
Chapter 6
Sustainable Development
Priorities and Priority Issues for
the Building Sector
The main purpose with regards to sustainable development set forth in the National Development
Plan is to achieve environmental management which consolidates sustainable development both in the
economic and social areas, consistent with the protection and preservation of natural resources. From
a governmental stand point, the Secretaria del Medio Ambiente y Recursos Naturales (SEMARNAT) is
responsible of conducting all sustainable development policies and programs.
6.1. General climate change policies and programs
6.1.1. Mexico’s federal government National Strategy on Climate Change
The National Strategy on Climate Change (ENACC) identifies specific measures for mitiga¬tion, with
estimates of their potential for emissions reductions [31]. It also proposes a suite of research objectives
as a tool for laying out more precise mitigation targets and outlines national requirements for capacity
building for adaptation to climate change.
This strategy will be followed by an action plan that has only been presented as a draft.
6.1.2. Mexico City’s Climate Action Program
Published in 2008, Mexico City’s Climate Action Program defines strategies and specific measures to
reduce, in the 2008-2012 period, 7 million tons of CO2 eqv. emissions [32]. The measures considered
include large water conservation programs, public transportation and waste management projects, and
subsidies and incentives for residential and commercial buildings. In particular, tax exemptions for new
and existing residential and commercial buildings that integrate energy and water conservation, and
renewable energy measures could be put in place in 2009.
6.2. Policies and programs related to the buildings´ sector
There are no specific laws involving sustainable development priorities for buildings in Mexico.
There are, though, a number of policies and programs involving both the government and the private
sector that have direct and indirect impacts on the CO2 eqv. emissions that result from residential and
commercial buildings operations.
• Energy efficiency standards for appliances
• Energy efficiency standards for lighting systems and building envelope of non-residential
buildings.
• CFE and FIDE´s DSM programs
• The Instituto del Fondo Nacional de la Vivienda para los Trabajadores (INFONAVIT) “Green
mortages” program.
• Comisión Nacional de Vivienda (CONAVI) Low Income Housing subsidies.
• Solar water heating standards
• Environmental regulation that mandate the use of solar water heating systems in non residential
buildings in Mexico City.
37Sustainable Development Priorities and Priority Issues for the Building Sector
6.2.1. Energy efficiency standards for appliances
The Federal Law on Metrology and Standards, in its Article 40 establishes the mandate to implement
mandatory technical standards (Normas Oficiales Maxicanas or NOM) which define “the characteristics
and/or specifications products or processes must meet in the case they may constitute a risk for the
human safety or could endanger human, animal or vegetable health, overall or working environment,
or for natural resources preservation” [33].
To date, eight NOMs have been implemented for equipment and appliances that are used in both
residential buildings (Table 14) [34]. The minimum performance standards (and their corresponding test
procedures) for refrigerators and AC units have been harmonized with those of the US and Canada [35].
Table 14. Energy Efficiency Standards related to building energy use
Product or system
Room air conditioners
Residential refrigerators and freezers
Residential clothes washers
Water heaters
Thermal insulation
Central-type air conditioners
Self-contained commercial refrigerators
One-phase motors
Source: CONAE [34]
These standards depend on the private sector for their implementation and are working well and having
significant positive impacts [36].11
6.2.2. Energy efficiency standards for lighting systems and building envelope of
non-residential buildings
Two other NOMs have been issued for interior lighting systems and the exterior buildings´ envelope [1,
2]. They have been in place for more than six years but have been poorly enforced as they require the
involvement of the power utilities (for the interior lighting systems standard) and the municipal authorities
(for the building envelope standard) to be applied. In the case of the envelope standard, no large city
government has adopted it in its construction regulations; in the case of the lighting standard, the
utilities have not been consistent of its application.12
6.2.3. CFE and FIDE´s Demand Side Management (DSM) programs
CFE has been involved (be it directly or through FIDE) in a number of DSM programs since the early
1990s. One has been ILUMEX, a program that help install more than 2 million compact fluorescent
lamps in Mexico´s largest cities and was later taken over by FIDE [37]. Another program has been done
to thermally insulate roofs in Mexicali [38]. This type of actions have continued but at a low key level.
11 Energy efficiency standards have represented significant energy savings. According to CONAE´s information, standards related to electricity
end uses have saved an aggregate of 16065 GWh to end-users by the year 2006 (equivalent to the power consumption of 10 million Mexican
households in one year), and resulted in 2926 MW of avoided power capacity (equal to 6% of Mexico´s installed capacity by the end of 2006).
Energy efficiency standards for water heaters and industrial thermal insulation have resulted in energy savings of 36 Pjoules of LPG by the year 2006
(equal to 10% of a years´ use by residential and commercial end-users).
12 This opinion is based on personal exchanges with professionals involved in the sector and government officials as no official data is
available.
38Chapter 6
6.2.4. The Instituto del Fondo Nacional de la Vivienda para los Trabajadores
(INFONAVIT) “Green mortages” program
INFONAVIT is a public fund designed and integrated to, mainly, get low interest rate credit in sufficient
amount to facilitate the purchase of new housing for workers in payrolls of the private sector [39].
The funds resources come from contributions by the workers themselves, their employers and the
government. Individuals can use their accounts in the fund to pay for all or a fraction of the cost of a
new house or its remodeling of a used one. In its lifetime (from 1972) this fund has provided close to
5 million loans [40].
Section 4
Starting in 2007, INFONAVIT started operating a program that has been named Hipotecas Verdes
(Green Mortgages). This is a mechanism that increases the amount of credit in close to 1500 US$ (to be
paid in a longer period) to finance water and energy conservation measures and the use of solar energy
for water heating. Measures include: low-flow showers, compact fluorescent lamps, thermal insulation
and high efficiency AC units [41].
The financing mechanism allows the home buyer to pay for the measures under the logic that the
measures will reduce operating expenses and facilitate reimbursing the loan.
The program has involved several hundred new houses and is expected to grow to close to 100,000
per year in 2009.
6.2.5. Voluntary standards for solar water heating
Three voluntary standards have been issued through a private sector standardization initiative with a
solar energy mandate (NESO -13) [42]. These standards apply to solar water heating components,
systems and installations. To date, three standards are in place: flat plate collectors, installations and
terminology. These standards are not mandatory but can be adopted voluntarily to be used in public
and private programs. To support the flat plate collector standard, a test laboratory has been installed
and is already certifying solar collectors.
Other standards under development apply to residential systems and to storage tanks.
6.2.6. Environmental regulation that mandate the use of solar water heating
systems in non residential buildings in Mexico City
The Government of Mexico City mandates, starting in 2006 and through an environmental standard,
that all new public-use installations (such as hotels and sport clubs) have to heat 30% of their hot water
needs with solar energy (GDF 2006) [43].
The impacts of this standard are still to be evaluated as enforcement has not been fully implemented.
6.2.7. Comisión Nacional de Vivienda (CONAVI) Low Income Housing subsidies
CONAVI is a federal government institution with regulatory and planning capacities that define the rules
by which subsidies are given for low income housing [44]. For 2007, CONAVI has defined the rules for
the use of close to 400 million US$ worth of subsidies [45].
To date, CONAVI has been working to define the rules and best practices to allow the use of subsidies
for the incorporation of sustainability measures in low-income housing that include water conservation
39You can also read