September 2018 Investor Presentation - Nextera Energy Investor Relations
←
→
Page content transcription
If your browser does not render page correctly, please read the page content below
September 2018 Investor Presentation
Cautionary Statements And Risk Factors That May Affect
Future Results
This presentation includes forward-looking statements within the meaning of the federal securities laws.
Actual results could differ materially from such forward-looking statements. The factors that could cause
actual results to differ are discussed in the Appendix herein and in NextEra Energy’s and NextEra Energy
Partners’ SEC filings.

Non-GAAP Financial Information
This presentation refers to certain financial measures that were not prepared in accordance with U.S.
generally accepted accounting principles. Reconciliations of historical non-GAAP financial measures to the
most directly comparable GAAP financial measures can be found in the Appendix herein.

2
NextEra Energy is comprised of two strong businesses
supported by a common platform

                                                                   • ~$81 B market capitalization(1)
                                                                   • ~47 GW in operation(2)
                                                                   • ~$95 B in total assets(3)

                    • The largest electric utility                     • The world leader in
                      in the United States by                            electricity generated
                      retail MWh sales                                   from the wind and sun
                                         Engineering & Construction
                                               Supply Chain
                                            Nuclear Generation
                                          Non-Nuclear Generation
    1) As of August 24, 2018; Source: FactSet
    2) Megawatts shown includes assets operated by Energy Resources owned by NextEra Energy Partners as of
       June 30, 2018
3   3) As of June 30, 2018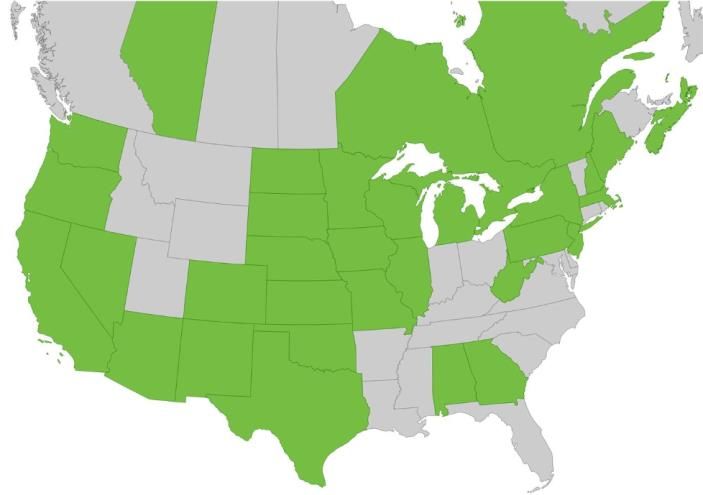
Built on a foundation of best-in-class operational excellence
 and financial strength, and focused on clean generation
FPL Service Reliability (“SAIDI”)(1)                                                         Generation Profile
                                                                                    2017 NextEra Energy Fuel Mix MWhs(2)
                                      ~101 minutes

                                                                                                      Nuclear         Wind
               ~56 minutes                                                                             26%            22%
 Good

                                                                                                                               Coal 2%
           FPL ~$14                         FPL ~61                                                       Natural Gas          Solar 3%
                                                                                                             46%
                                                                                                                                Oil
We have a long-term track record of delivering value to
        shareholders

       Adjusted Earnings Per Share(1)                                                                Total Shareholder Return(3)
                                                                                             $6.70
                                                                                     $6.19           40%                             70%
                                                                             $5.71                          34%                                 60%
                                                                     $5.30                                                           60%
                                                             $4.97
                                                                                                     30%
                                $4.05 $4.30 $4.39 $4.57                                                                              50%
                          $3.84                                                                                          22%                                 38%
                  $3.49                                                                                                              40%
        $3.04                                                                                        20%
$2.63                                                                                                                                30%              24%
                                                                                                                  12%
                                                                                                     10%                             20%
                                                                                                                                     10%
                                                                                                     0%                               0%
'05     '06        '07    '08    '09   '10   '11     '12     '13     '14     '15     '16     '17                One Year                         Three Year

                  Dividends Per Share(2)                                                     $3.93
                                                                                                     200%                            240%       221%
                                                                                     $3.48
                                                                                                            162%
                                                                             $3.08                   160%                            200%
                                                                     $2.90
                                                             $2.64
                                                     $2.40                                                                           160%
                                             $2.20                                                   120%                108%                                126%
                              $2.00                                                                                                  120%
            $1.64 $1.78 $1.89                                                                                      81%
                                                                                                                                                       85%
$1.42 $1.50                                                                                          80%
                                                                                                                                      80%
                                                                                                     40%                              40%

                                                                                                      0%                                   0%
                                                                                                                Five Year                         Ten Year

 '05        '06    '07     '08   '09   '10   '11     '12      '13     '14     '15     '16     '17           ■      NEE
                                                                                                            ■      S&P 500 Utility Index
                  1) See Appendix for reconciliation of adjusted amounts to GAAP amounts                    ■      S&P 500
                  2) Expected 2018 annualized dividend per share of $4.44
        5         3) Source: FactSet; includes dividend reinvestment as of 12/31/2017
Over a sustained period of time, our growth strategy has led
to real change in relative position

    Top 20 Global Utility Equity Market Capitalization(1)
                   As of 6/1/2001 ($ MM)                      As of 8/24/2018 ($ MM)
         Rank            Market Cap                    Rank      Market Cap
           1              $38,574                        1         $81,446     NextEra Energy
           2              $38,185                        2         $57,993
           3              $34,476                        3         $52,073
           4              $34,111                        4         $51,847
           5              $30,955                        5         $49,143
           6              $23,906                        6         $48,338
           7              $21,537                        7         $46,836
           8              $20,093                        8         $45,667
           9              $17,297                        9         $42,529
          10              $16,873                       10         $36,981
          11              $16,279                       11         $35,584
          12              $15,884                       12         $35,269
          13              $15,785                       13         $31,831
          14              $14,601                       14         $30,695
          15              $14,461                       15         $29,047
          16              $14,223                       16         $26,656
          17              $13,773                       17         $26,610
          18              $13,550                       18         $24,717
          19              $13,136                       19         $24,411
          20              $12,934                       20         $24,301

          30              $10,206     NextEra Energy
    1) Source: Factset
6
We are well positioned to continue this track record
Wholesale
& Service FPL Coal FPL
Territory Retirements Energy
Expansion Services
FPL
FPL Battery FPL T&D FPL New
Solar Infrastructure Generation
Storage
Expect
$40 B - $44 B(1)
FPL
Capital
New Wind Generation Asset of capital
Recycling Growth Modernization M&A deployment
from 2017
through 2020
Gas Battery Competitive
New Solar
Pipelines Storage Transmission
Gas Customer
Supply & Distributed
Upstream Generation
Trading
We believe we have the industry’s leading growth
prospects
1) Excludes potential acquisition of Gulf Power and the Stanton and Oleander natural gas power plants and closed
7 acquisition of Florida City GasFlorida Power & Light is one of the best utility franchises in
the U.S.
Florida Power & Light
• One of the largest U.S.
electric utilities
• Vertically-integrated, retail
rate-regulated
• ~5 MM customer accounts
• ~27 GW in operation
• $12 B(1) in operating
revenues
• ~$52 B in total assets
1) As of year ended December 31, 2017
Note: All other data as of June 30, 2018
8Our core focus at FPL has been consistent for many years
Areas of Focus
• Unyielding commitment to
customer value proposition
Customer
– Low Bills Satisfaction
– High reliability
– Excellent customer service
• Focus on efficiency and best-in- Superior Constructive
class cost performance Customer Virtuous Regulatory
– Lowest O&M costs among all major Value Circle Environment
Delivery
regulated utilities
• Invest capital in ways that benefit
customers Strong
Financial
– Expect ~9% compound annual Position
growth in regulatory capital
employed 2017 – 2021(1)
– Operate one of the most modern,
fuel-efficient and low-carbon
generation fleets in the nation
9 1) Based on 13-month averageFPL’s value delivery is founded on a low cost position and
best-in-class operations
Operational Cost Effectiveness(1)
$100.00
Adjusted Regressed
Top Quartile
Top Decile
Good
$/
Retail MWh
Log/Log FPL 2017 = $12.44/MWh
$10.00
1,000,000 10,000,000 100,000,000 1,000,000,000
Retail MWh
1) FERC Form 1, 2017; excludes pensions and other employee benefits; FPL costs exclude expense related to
Hurricane Irma write-off
10 Note: Holding companies with >100,000 customers; excludes companies with no utility owned generationFPL has significantly outperformed the industry on cost
management over a long period of time
FPL vs. Industry Non-Fuel O&M per Retail MWh(1)
$35.00
FPL Industry Average $30.79
$30.00
Good
$25.00
O&M $20.00 $18.10
$/MWh
$15.00
$15.32
$12.44
$10.00
$5.00
$0.00
Retail MWh (MM)
1) FERC Form 1, 1994 - 2017; excludes pensions and other employee benefits; FPL costs exclude expense related
11 to Hurricane Irma write-offFPL projects total capital deployment of $17.5 B to $19.0 B
from 2017 to 2020 through smart investments that result in
customer savings and enhanced reliability
FPL 2017 – 2020 Investment Initiatives
Projected Recovery
Opportunity Status
Investment(1) Mechanism
Completed construction on ~600 Solar Base Rate Adjustment
2017/2018 Solar ~$800 MM
MW in Q1 2018 (SoBRA)
Solar Base Rate Adjustment
2019/2020 Solar Eight sites being finalized ~$800 MM
(SoBRA)
Site control; early stage
Additional Solar Investments ~$1.1 B Base Rates
development
Transmission & Distribution Investments from 2017 – 2020 ~$8.0 - $9.0 B Base Rates
Okeechobee Clean Energy Generation Base Rate
2019 Capacity Need ~$1.2 B(2)
Center Adjustment
Dania Beach Clean Energy
2022 Modernization ~$900 MM(2) Base Rates
Center
Indiantown completed Jan-2017;
Clause
Indiantown & SJRPP buy-outs Completed early retirement of ~$500 MM(3)
SJRPP Jan-2018
Combustion Turbine Upgrades On track for 2019 completion ~$1 B Base Rates
Maintenance of existing assets,
Ongoing ~$4.0 - $6.0 B Base Rates
nuclear fuel, and other
1) Includes amount invested in 2017 through 2020, unless otherwise noted
2) Reflects total investment for Okeechobee Clean Energy Center and Dania Beach Clean Energy Center including
investment made pre-2017 and post-2020
3) Indiantown & SJRPP investment are recorded as regulatory assets
12FPL has 18 MW of battery projects in operation, each
providing unique reliability and economic benefits
FPL Storage Project Summary
Primary Secondary Size In-service
Application (Use Case)
Benefit Benefit (MW) date
Freq. Response
Distribution Feeder Installation Peak
T&D Deferral 1.5 8/2016
(Peaker) Shaving
Power Quality
Local Community Reliability Freq. Response Various in
Reliability 0.08
(Community Storage) – 3 units Power Quality 2016-2017
Freq. Response
Back Up Power for Radial Load
Reliability Peak Shaving 1.5 12/2016
(Micro-Grid)
Power Quality
Stadium / Arena / C&I Power
Reliability 0.75 2/2017
(Premium Service) Quality
Solar Clip & Solar Shifting,
DC Coupled Solar + Storage 4 12/2017
Capture Firming
Solar Solar Firming,
AC Coupled Solar + Storage 10 3/2018
Shifting Smoothing
FPL will be installing 36 MW of battery storage under the 50 MW
pilot, demonstrating additional applications and configurations
13FPL’s strategy continues to result in typical residential bills
below both Florida and National averages
FPL 1,000-kWh Residential Bill
$140 ~$138
$120 ~$119
~$109
~$99 ~$100
$100
Good
$80
$60
$40
$20
$-
FPL FPL (1) FPL FL IOUs National
2006 2018 2021E Average(2) Average(3)
FPL expects the typical residential bill to remain lower than 2006 levels
from 2018 through 2021
1) Based on a typical 1,000 kWh residential bill for September 2018
2) FL IOUs Avg consists of data from FPL, TECO, Duke Energy Florida, FPUC and Gulf Power; as of September 2018
3) Source: EEI; National Average as of January 2018 based on reporting utilities
14NextEra Energy announced agreement to acquire Gulf
Power, Florida City Gas, and the Stanton and Oleander
natural gas power plants
Transaction Overview
• Addition of attractive regulated electric
and natural gas franchises are an Tallahassee
Tallahassee
Tallahassee
Tallahassee
excellent geographic and strategic fit Pensacola
Pensacola
Pensacola
Pensacola
Jacksonville
Jacksonville
Jacksonville
Jacksonville
– NextEra to extend its best in class value
proposition of low bills, clean energy, high
reliability and outstanding customer service
to additional FL customers
– Florida Public Service Commission has FL
FL Orlando
Orlando
Orlando
Orlando
provided a constructive and progressive
regulatory environment
Tampa
Tampa
Tampa
Tampa
• $6.475 B total transaction value:
– ~$5.1 B all cash consideration (expected to
be financed with issuance of new debt)
– Includes the assumption of ~$1.4 B of Gulf Florida Power & Light
Power debt Florida City Gas
• Gulf Power and natural gas plants Gulf Power Miami
Miami
Miami
Miami
expected to close in first half of 2019(1)
• Florida City Gas closed in July 2018
Transactions expected to be $0.15 and $0.20 accretive
to adjusted EPS in 2020 and 2021, respectively
978389_1.WOR (NY008P5T)
1) Subject to FERC approval and Hart-Scott-Rodino antitrust requirements
15Energy Resources’ focus is to be the leading North
American clean energy company
Energy Resources
• World leader in electricity
generated from the wind and sun
• ~20 GW(1) of generation in
operation
– ~14 GW wind
– ~2 GW solar
– ~3 GW nuclear
– ~1 GW natural gas/oil
• ~8 BCF of natural gas pipeline Wind
capacity operating or under 69%
development(2)
• ~$5.2(3) B in operating revenues
• ~$42 B in total assets Solar
Nuclear
Natural Gas 14%
Oil 11%
2%
4%
1) Generation mix is based on MW capacity operated by Energy Resources including NextEra Energy Partners’ assets
2) Includes 4 BCF Texas Pipelines operated by Energy Resources for NextEra Energy Partners
3) For the year ended December 31, 2017
16 Note: All other data as of June 30, 2018Energy Resources’ growth is driven by its best-in-class
development skills and competitive advantages
Energy Resources Development Skills
20,000
Wind and Solar Portfolio(1)
15,000 Customer
Relationships
MW Engineering/
10,000 Regulatory
Construction
Management
5,000
0
Wind Solar Best-In-Class Integrated
Environmental/ Development Product
Cumulative Gas Permitting
Skills Offerings
Pipeline Investments(2)
$5,000
$4,000
$3,000 Technology
$ MM and Brand
$2,000 Innovation Recognition
Balance
$1,000 Sheet
Strength
$0
2014 2015 2016 2017 2018E
Energy Resources expects to invest $22 B to $25 B from 2017 – 2020
1) Includes 3,332 MW of assets operated by Energy Resources for NextEra Energy Partners and contracted
renewables projects with expected COD in 2018 as of July 25, 2018
2) Includes actual and projected investment of approved projects as of July 31, 2018 and the Texas Pipelines operated
17 by Energy Resources and owned by NextEra Energy PartnersWith continued technology improvements and cost
declines, wind and solar are expected to be competitive into
the next decade
Wind and Solar Technology
Levelized Cost of Levelized Cost of
Electricity from Wind Electricity from Solar
(Including Production Tax Credits) (Including Investment Tax Credits)
$/MWh $/MWh
$70 $160
$140-$150
$55-$65 $140
$60
$120
$50
$100 $95-$105
$40 $36-$42
$80 $73-$83
$30
$21-$27 $60
$16-$22 $39-$47
$20 $12-$18 $40 $25-$35
$10 $20
$0 (1) (1) (1) (1) (2)
$0
2010 2012 2014 2016 2020 2010(3) 2012(3) 2014 (3) 2016(3) 2020(2)
1) Source: U.S. Department of Energy, 2015 Wind Technologies Market Report – August 2016
2) Energy Resources’ estimate
3) Source: IHS Markit; the use of this content was authorized in advance; any further use or redistribution of this
content is strictly prohibited without written permission by IHS Markit; all rights reserved
18Energy Resources benefits from NextEra Energy’s purchasing
power as a top capital investor across all industries
2017 Top 10 U.S. Capital Investors(1)
$20.0 $19.3
$18.0 $17.2
$16.0
$14.0
$12.0
$B $12.0 $10.7
$10.0 $9.6
$10.0 $8.7 $8.4 $8.1 $8.1
$8.0
$6.0
$4.0
$2.0
$0.0
A B C NEE D E F G H I
NextEra Energy was the fourth largest investor of capital
in the U.S. among all sectors in 2017
19 1) NEE internal estimates based on publicly available informationLeveraging the scale of Energy Resources’ portfolio and
purchasing power have helped reduce wind O&M costs by
~25% since 2014
Wind O&M(1)
$/MWh
~5% ~10%
Improvement Per Year Improvement Per Year
2014 2016 2018E
NextEra Average Site (2) Top Quartile Site (2) Top Decile Site (2)
Energy Resources’ fleet average is expected to operate within
the top decile of wind sites
1) Wind O&M costs are reported herein on a per-gross-generation basis and include all expenses related to the
operations and maintenance of each wind project owned and operated by NextEra Energy Resources. These costs
include planned and unplanned maintenance of the wind turbines as well as electrical balance of plant - including
labor, parts, materials and consumables and exclude all G&A costs
2) Top quartile and average O&M costs based on average of two independent studies. Top decile performance based
20 on one independent studyEnergy Resources is able to leverage NEE’s strong balance
sheet and diverse bank group with total capital commitments
of over $21 B
Funding Breakdown by Country(1)
Our lending group is large, balanced and well-diversified
1) Reflects corporate credit facilities, commitments and term loans outstanding as of May 31, 2018 and
original balances of project debt funded or committed by banks since 2003
21Resource assessment and site selection capabilities help
identify optimal sites to support long-term renewables growth
Renewable Development Longer-Term Pipeline
Wind: 450-600 MW
Wind: 4,500-4,800
2,200-2,500 MW Solar:1,600-1,700 MW
Solar: 600-700
200-300 MW
Wind: 300-450 MW
Solar: 600-700 MW
Wind: 2,800-2,900 MW
Solar: 3,400-3,500 MW Solar: 3,500-3,600 MW
Wind: 7,950-8,100 MW
Solar: 1,900-2,000 MW
Energy Resources expects to grow its current 28 GW renewables pipeline
to 40 GW by 2020
22Battery efficiency improvements and cost declines are
expected to expand the storage market and enable even
greater renewables expansion
Storage Technology
Lithium-ion 4-Hour
Battery Pack Cost(1) Battery Storage Adder(2)
$/kWh $/MWh
$1,200 $80 $71-$81
$1,000 $70
$1,000
$60
$800 $45-$55
$50
$642 $38- $48
$600 $540 $40
$30
$400 $19-$29
$273 $20 $12-$22
$200 $172
$10
$0 $0
2010 2012 2014 2016 2020 2010 2012 2014 2016 2020
1) Source: Bloomberg New Energy Finance
2) Energy Resources’ Estimate; assumes: 4 hour battery storage at 40% of nameplate solar capacity; total battery
system costs calculated as two times Bloomberg New Energy Finance battery pack cost
23Energy Resources’ battery portfolio has rapidly transitioned
from single-use short duration ancillary services to long
duration multi-use stacked applications
Energy Storage Portfolio
Operating Portfolio Announced Backlog Portfolio
Project MW Duration Project MW Duration
Parry 2 4.0 Rush Springs 10 2.0
Elmira 2 4.0 Montauk 5 8.0
East Hampton 5 8.0 Valencia 10 4.0
Mantua Creek 2 0.2 Gopher 15 2.0
Frontier 20 0.4 Wilmot 30 4.0
Meyersdale 18 0.3 Dodge Flat 50 4.0
Green Mountain 10 0.3 Fish Springs 25 4.0
Casco Bay 16 0.5 Casa Mesa 1 1.0
Blue Summit 30 0.5 Total 146 3.8
Pima 10 0.3 Peaking, Load Shaving Frequency Response
Pinal 10 4.0 Solar + Storage Frequency Regulation
Wind + Storage
Total 125 1.1
NextEra Energy is the U.S. leader in energy storage
24Energy Resources’ competitive advantages position us well for
continued success
Energy Resources Development Program(1)
(Signed Contracts as of July 25, 2018)
2017 – 2018 2017 – 2018 2019 – 2020 2019 – 2020 2017 – 2020
Signed Current Signed Current Current
Contracts(2) Expectations Contracts Expectations Expectations
U.S. Wind 2,287 2,400 – 3,800 1,953 3,000 – 4,000 5,400 – 7,800
Canadian Wind 0 0 – 300 0 0 – 300 0 – 600
U.S. Solar(3) 504 400 – 1,300 1,483 1,000 – 2,500 1,400 – 3,800
Wind Repowering 2,550 2,100 – 2,600 299 1,200 – 1,700 3,300 – 4,300
Total 5,341 4,900 – 8,000 3,735 5,200 – 8,500 10,100 – 16,500
Energy Storage(4) 80 40
Our ~7,400 MW backlog of future wind, solar and storage projects is the
largest in Energy Resources’ history
1) See Appendix for detail of Energy Resources’ development projects included in backlog; excludes development
project sales of 628 MW in 2017-2018 and 400 MW in 2019-2020
2) 355 MW of wind projects, 343 MW of solar projects, 1,698 MW of repowering projects and 44 MW of storage
projects are in service
3) Excludes 590 MW signed for post-2020 delivery
25 4) Excludes 75 MW signed for post-2020 deliveryEnergy Resources backlog of future renewables projects
has never been stronger
Energy Resources Renewables Backlog(1)
(MW)
~7,400
~5,000
~3,700
~2,900
~2,400
~2,100
Q4 2013 Q4 2014 Q4 2015 Q4 2016 Q4 2017 Q2 2018
Wind Solar Repowering Energy Storage
Year to date 2018, Energy Resources announced ~2,600 MW
of new PPAs – our best period ever
1) Energy Resources reported backlog
26We are well positioned to capitalize on and respond to
potentially disruptive changes to our industry in the next
decade
Disruptive Industry Changes
Potential Cost per kWh Post-2020(1)
Shale
(¢/kWh)
Gas 3.5 - 5¢ 4 - 5¢
3 - 4¢ 3 - 4¢
Big Data Renewables
/Storage 2 - 2.5¢
Generation Wind Solar Gas Coal Nuclear
Smart Cost
Restructuring
Grid Restructuring U.S. Electricity Production by Fuel Type(2)
2017 2030E
Generation Natural Natural Coal &
Shareholder Gas Coal & Gas Nuclear
Activism Restructuring Nuclear
Wind & Wind
Solar & Solar
Other Other
1) Represents projected cost per kWh for new build wind, solar, and natural gas, excluding PTC and ITC; projected
per kWh operating cost including fuel for existing nuclear and coal; based on NextEra Energy internal estimates
2) 2017 Source: U.S. EIA; 2030 estimate Source: IHS Inc; the use of this content was authorized in advance by
IHS; any further use or redistribution of this content is strictly prohibited without written permission by IHS; all
27 rights reservedWe have leveraged our skills and capabilities to expand into
the natural gas pipeline business
Natural Gas Pipeline Assets
Sabal Trail and Florida Mountain Texas
Southeast Connection (FSC) Valley Pipeline (MVP) Pipelines
• ~$1.5 B investment in Sabal • NextEra is a 31% owner of • NEP completed the $2.2 B
Trail MVP acquisition in October 2015
– JV with Enbridge – JV with EQT, Con Edison – Seven natural gas pipelines in
• ~$0.5 B investment in FSC Midstream, WGL Midstream, Texas
and RGC Midstream – ~3 Bcf/day of ship-or-pay
– Subsidiary of Energy Resources – ~300-mile natural gas pipeline contracts
• Florida pipelines achieved – ~2 Bcf/day of 20-year firm – Continue to focus on growth and
commercial operation in June capacity commitments expansion projects
2017 • Announced MVP Southgate
expansion project
We continue to look for new long-term contracted natural
gas pipeline opportunities
28We expect to continue to maintain $5 to $7 B of excess balance
sheet capacity following the closing of the acquisition of Gulf
Power
Strong Financial Position
NextEra Energy Current Downgrade Expected Post-Closing
Rating Agency
Corporate Rating Threshold Downgrade Threshold(1)
Standard & Poor’s A- 23% Low 20% Range
Moody’s Baa1 20% 18%
Fitch A- 4.25x 4.25x
• Transactions expected to increase the regulated contribution to our
business mix to ~70%
• Based on rating agency discussions, we anticipate further favorable
adjustments to our credit metric thresholds upon closing
• At expected revised rating agency thresholds, we would continue to
maintain $5 – $7 B in excess balance sheet capacity through 2021
The remaining excess balance sheet capacity serves as cushion, as its
utilization is not currently assumed in our revised financial expectations
1) Based on discussions with the rating agencies; assumes transaction to acquire Gulf Power
29 closesWe remain well positioned to achieve the $7.70 target adjusted
EPS for 2018 as well as our long-term financial expectations
NextEra Energy’s
Adjusted Earnings Per Share Expectations(1)
• The Gulf Power, Florida City
$9.40 -
$8.70 -
$9.95 Gas, and two natural gas
$8.00 -
$9.20 power plant acquisitions are
$7.45 - $8.50 expected to be $0.15 and $0.20
$7.95
accretive in 2020 and 2021,
$6.70 respectively
• Expected growth in DPS of
12% to 14% per year through
at least 2020, off a 2017 base
of $3.93 per share
2017 2018E 2019E 2020E 2021E
Expected transaction accretion
1) Expectations assume transaction to acquire Gulf Power and the Stanton and Oleander natural gas power plants
closes; see Appendix for definition of Adjusted Earnings expectations
30NextEra Energy’s businesses deliver strong earnings,
dividend and cash flow growth and a low beta
NextEra Energy Investment Proposition
Track record of delivering value to shareholders
High visibility into earnings growth to support 11% - 12%
total return potential
Low payout ratio and above average dividend growth of
12% - 14% through at least 2020
Low beta provides attractive risk adjusted returns relative
to other sectors
Disciplined capital allocation strategy; ongoing ability to
recycle capital through sales to NEP or 3rd parties
Strong cash flow generation of underlying assets
One of the strongest balance sheets in the sector with
significant balance sheet capacity
3132
NextEra Energy Partners is a best-in-class diversified clean
  energy growth company

                          NextEra Energy Partners’ Portfolio(1)
• Stable cash flows supported by:
     – Long-term contracts with credit-
       worthy counterparties
     – Geographic and asset diversity
• ~4,700 MW of renewables
     – ~4,100 MW wind
     – ~600 MW solar
• ~4 Bcf total natural gas pipeline
  capacity
     – Seven natural gas pipelines
     – ~542 miles                                                                                                       Wind assets
                                                                                                                        Solar assets
     – ~3 Bcf of contracted capacity                                                                                    Pipeline assets

                   Solid distribution growth through accretive acquisitions

    1) Portfolio as of June 30, 2018; plus acquisition of 1,388 MW announced on September 5, 2018 that is expected to
  33   close by year-end 2018; excludes non-economic ownership interest in equity method investments;
Since the IPO, NEP has grown distributions by ~133% and
delivered total unitholder return of 126%
Annualized Total Unitholder Return
LP Distributions(1) NEP vs. Indices
$1.75
140%
126%
120%
100%
80%
60%
60%
42%
40%
$0.75 20%
6%
0%
Q3 2014
Q4 2014
Q1 2015
Q2 2015
Q3 2015
Q4 2015
Q1 2016
Q2 2016
Q3 2016
Q4 2016
Q1 2017
Q2 2017
Q3 2017
Q4 2017
Q1 2018
Q2 2018
(2)
NEP S&P 500 S&P 500 YieldCo
Utilities Average(3)
Index
1) Annualized basis; refer to distributions payable on the NextEra Energy Partners Investor Relations website
2) Reflects total unitholder return, assuming dividend reinvestment, as of August 24, 2018 since the IPO dated
June 27, 2014 based on the IPO price of $25
3) Reflects average total shareholder return, assuming dividend reinvestment, for TERP, AY, PEGI, NYLD.A as
of August 24, 2018 since the IPO date assuming IPO price
Note: All other data is total shareholder return, assuming dividend reinvestment, as of August 24, 2018 since
34 June 27, 2014; Source: BloombergNEP’s value proposition is built upon four core strengths
NextEra Energy Partners’ Core Strengths
High-Quality Portfolio(1) Financial Strength and Flexibility
Issuer Credit
~4.7 GW Rating(4) Year-end 2017
17-Yr Baa1 Renewables >90% Ba1/BB/BB+
Remaining Counterparty
Capacity of Project Debt ~1.2x
& Tax Equity supports 4x-5x Coverage
Contract Life(2) Credit(2,3) ~4 Bcf Is Amortizing(1) Holdco debt / project Ratio(5)
Pipeline Capacity CAFD
Tax-Advantaged Structure(6) Opportunities For Growth
≥8 years Treated as C-Corp Clean energy
assets at
≥15 years Potential return of for U.S federal tax
Energy Organic
Not expected to
capital treatment purposes with
prospects for 3rd Party
pay significant
for distributions to
the extent of
Form 1099 Resources, Texas Pipelines acquisitions
U.S. federal taxes for investors including future and Repowerings
investor’s tax development
basis (vs K1)
1) Includes acquisition of 1,388 MW announced on September 5,2018 that is expected to close by year-end 2018
2) Weighted on calendar year 2019 Cash Available for Distribution (CAFD) expectations for expected portfolio as of December 31, 2018
3) Moody’s rating related to firm contract counterparties
4) Moody’s, Standard & Poor’s, and Fitch ratings, respectively
5) Assumes calendar year 2018 expectations for portfolio as of 12/31/17, divided by the product of annualized
LP distributions of $1.62 and 156 MM outstanding units, plus distributions made to the Series A Preferred Units
6) As of June 30, 2018; should not be construed as tax advice
35We continue to execute on our plan to expand NextEra Energy
Partners’ portfolio by announcing agreement to acquire ~1.4
GW of renewable projects from Energy Resources
NextEra Energy Partners – Portfolio Additions
• Purchase price of $1.275 B(1), Portfolio Overview
plus assumption of: Remaining
Project Resource MW COD (3)
PPA Term
– ~$930 MM in tax equity financing Carousel Wind 149.7 2015 23
– ~$38 MM of project debt Bluff Point Wind 119.7 2017 19
Cottonwood Wind 89.7 2017 22
• Expected 5-year average annual Golden Hills North Wind 46.0 2017 19
run rate contribution(2): Kingman I Wind 103.3 2016 18
Kingman II Wind 103.3 2016 18
– Adjusted EBITDA: $290 - $310 MM Ninnescah Wind 208.3 2016 18
– CAFD: $122 - $132 MM Breckinridge Wind 98.1 2015 17
Rush Springs Wind 249.9 2016 13
• Acquisition expected to close in Javelina II Wind 200.0 2016 18
Q4 2018 Mountain View Solar 20.0 2014 20
Portfolio Total 1,388 18
The acquisition replaces the Canadian assets sold earlier this year and
enables NEP to meet its growth targets for 2018
1) Subject to working capital adjustments. Tax equity and debt balances as of 12/31/2018
2) Beginning 12/31/2018
3) As of 12/31/2018; for assets with multiple PPAs reflects the average based on MW. Portfolio Total weighted on
12/31/18 run-rate Cash Available for Distribution (“CAFD”) expectations for acquisition portfolio
36The acquisition will be funded with the Canadian asset sale
proceeds and a $750 MM convertible equity portfolio
financing with BlackRock
NextEra Energy Partners – Portfolio Financing(1)
• BlackRock pays $750 MM in Financing Comparison
exchange for an equity interest in 2018
the acquisition portfolio 2017 Convertible
Convertible
– Initial effective “coupon” of ~2.5% per Preferred Equity Portfolio
annum through allocation of Financing
distributable cash for three-year period,
which steps-up in year four(2) Annual
Cash Cost 4.5% ~2.5%
• NEP expects to exercise its buyout Years 1 - 3
right during year four at a fixed pre-
tax 7.75% return to BlackRock(3) NEP Unit
– At least 70% of buyout price expected Upside 15% No limit
to be payable in NEP common units at Retained
then-current market price (no discount)
with the balance paid in cash NEP 100% At least 70%
Conversion / conversion in NEP
• Expected to be very attractive, low- Buyout right starting units at no
cost equity-like product for NEP Rights at up ~40%(4) premium
This transaction further enhances NEP’s financing flexibility
1) Refer to Appendix and SEC filings for additional detail of BlackRock financing
2) Following the initial three-year period, if NextEra Energy Partners has not exercised its buyout right, BlackRock
will receive 80% of portfolio distributions
3) Return inclusive of all prior distributions
4) Premium to 45-day average VWAP prior to agreement execution required to force convert financing into NEP
37 common unitsNEP continues to focus on investing in clean energy assets
with stable cash flows
Asset Suitability
Long-Term Contract
Clean Energy Technology
Creditworthy Counterparty “NEP-Able”
Asset
Stable Regulatory Environment
Limited or Monetized Tax Credits
Strong Operations
Any clean energy asset that fits these criteria may be suitable for
acquisition by NEP
38Acquisitions from Energy Resources, organic growth and
third party M&A all provide NEP with clear visibility to future
growth
Growth Opportunities
Potential
Acquisition of
Potential Organic
Clean Energy Potential for 3rd
Prospects for
Assets at Energy Party
Texas Pipelines
Resources, Acquisitions
and Repowerings
Including Future
Development
Existing Energy Resources’ portfolio alone could provide one potential
path to 12% - 15% DPU growth per year through 2023
39NEP’s credit ratings increase financing flexibility and debt
capacity due to greater market access
Corporate Credit Rating and Debt Capacity
• NEP corporate credit ratings: Convertible Term Loan B High-Yield
Equity Debt
Portfolio
Convertible Financing Revolving
Moody’s S&P Fitch Preferred Credit
Facility
Ba1 BB BB+ Convertible
Preferred Optimal Capital Structure
Stable Stable Stable for Distribution Growth Bank
Term
Loans
Convertible
• Credit profile should support Debt
Project
PAYGO
Tax
HoldCo debt of 4.0x to 5.0x Equity Financing/
Refinancing
Equity
project distributions
New Opportunities Utilized Products
NEP continues to analyze and evaluate new opportunities for financing its
long-term growth
40NEP’s long-term outlook for distribution growth through 2023
is best-in-class
NextEra Energy Partners Financial Expectations
Annualized LP Distributions(1) Adjusted EBITDA and CAFD(3)
Annual
12% - 15%
$1,000–$1,150 MM
Growth(2)
$1.81-$1.86
$1.62
$360–$400 MM
Q4 2017 Q4 2018E Q4 2023E 12/31/2018 12/31/2018
Run Rate Run Rate
Adj. EBITDA CAFD
1) Represents expected fourth quarter annualized distributions payable in February of the following year
2) From a base of our fourth quarter 2017 distribution per common unit at an annualized rate of $1.62
3) See Appendix for definition of Adjusted EBITDA and CAFD expectations; reflects calendar year 2019
expectations for forecasted portfolio as of 12/31/18; includes announced portfolio, plus expected impact of
additional acquisitions not yet identified
41We believe NEP offers a superior value proposition and is
better positioned than ever to deliver upon its long-term
expectations
Investor Total Return Potential
•
Opportunity to earn a total return of
~4% 16% - 19% roughly 16% - 19% per year through
at least 2023
12% - 15% • Diversified portfolio with stable cash
flows
• High visibility into available growth
options to support DPU growth
• Disciplined approach to capital
allocation
• Flexible capital structure to finance
future growth
Distribution Distribution Annual Total
• Strong corporate governance
Growth Yield (1) Return • A proven and experienced
Through At Potential
Least 2023
management team that has a long
track record of delivering results
Aside from any modest issuances executed through the ATM, NEP is
not expected to need to sell common equity until 2020 at the earliest
1) Based on NextEra Energy Partners‘ distribution yield as of August 24, 2018
42Appendix 43
44
NextEra Energy’s credit metrics remain on track

                                                     Credit Metrics
                                          A-               Downgrade                   Actual     Target
     S&P                                 Range             Threshold                   2017(1)    2018(2)
     FFO/Debt                         23%-35%                    23%                  26% / 29%    28%

     Debt/EBITDA                       2.5x-3.5x                                        3.0x       3.0x
                                          Baa              Downgrade                   Actual     Target
     Moody’s                             Range             Threshold                    2017      2018(2)
     CFO Pre-WC/Debt                  13%-22%                    20%                    22%        23%
     CFO-Div/Debt                      9%-17%                                           16%        16%

                                          A                Downgrade                   Actual     Target
     Fitch                             Midpoint            Threshold                    2017      2018(2)
     Debt/FFO                              3.5x                 4.25x                   3.9x       3.5x
     FFO/Interest                          5.0x                                         6.6x       6.7x

     1) Represents NEP proportionally consolidated and deconsolidated, respectively
     2) Reflects full deconsolidation of NEP
45
Contracted Wind and Solar Development Program(1)
Wind Location MW Solar Location MW
2017: 2017:
Oliver III ND 99 Whitney Point CA 20
Golden Hills North CA 46 Marshall MN 62
Bluff Point IN 120 Westside CA 20
Cottonwood NE 90 Distributed Generation Various 97
TOTAL 2017 Wind: 355 TOTAL 2017 Solar: 199
2018: 2018:
Pegasus MI 150 Stuttgart AR 81
Lorenzo TX 80 Pinal Central AZ 20
Wildcat Ranch TX 150 Bluebell TX 30
Sholes NE 160 Titan CO 50
Pratt KS 243 Coolidge VT 20
Heartland Divide IA 103 Distributed Generation Various 104
Minco IV OK 130 TOTAL 2018 Solar: 305
Minco V OK 220 2019 – 2020:
Casa Mesa CO 50 Blythe III CA 125
Torrecillas TX 300 New England Solar Various 362
Armadillo Flats OK 247 Wilmot AZ 100
Blue Summit II TX 99 Blythe IV CA 62
TOTAL 2018 Wind: 1,932 Quitman GA 150
2019 – 2020: Shaw Creek SC 75
Burke ND 200 Chicot AR 100
Emmons-Logan ND 300 Dougherty GA 120
Waymart II PA 68 Bluebell Solar II TX 100
Crowned Ridge I SD 300 Grazing Yak CO 35
Eight Point NY 102 Florida Solar FL 224
Sky River CA 62 Distributed Generation Various 30
Dodge County MN 170 TOTAL 2019 – 2020 Solar: 1,483
Borderlands AZ 100
Roundhouse WY 150
Soldier Creek KS 300 Post – 2020 Solar: 590
Blue Summit III TX 201
TOTAL 2019 – 2020 Wind: 1,953
1) 2017+ COD and current backlog of projects with signed long-term contracts, all projects are subject to
development and construction risks
46U.S. Federal tax incentives for completed renewables projects
have been extended into the next decade
Extended U.S. Federal Tax Credits
Wind Production Solar Investment
Tax Credit (PTC) Tax Credit (ITC)
Start of Start of
Construction COD Wind Construction COD Solar
Date Deadline PTC Date Deadline ITC
During 2016 12/31/2020 100% During 2019 12/31/2023 30%
During 2017 12/31/2021 80% During 2020 12/31/2023 26%
During 2018 12/31/2022 60% During 2021 12/31/2023 22%
During 2019 12/31/2023 40% Before 2022 1/1/2024 or After 10%
• Solar ITC guidance published by IRS in 2018 is consistent with
previous wind PTC guidance
– Safe harbor is deemed satisfied if taxpayer incurs 5% of the construction
costs and property is placed in service within four calendar years
– ITC guidance covers storage that is at least 75% charged by the solar
ITC facility
47Reconciliation of Earnings Per Share Attributable to
NextEra Energy, Inc. to Adjusted Earnings Per Share
1) Net of approximately $0.08 of income tax benefit at FPL
48Definitional information NextEra Energy, Inc. Adjusted Earnings Expectations This presentation refers to adjusted earnings per share expectations. Adjusted earnings expectations exclude the cumulative effect of adopting new accounting standards, effect of non-qualifying hedges, the transitional impacts of tax reform, NEP net investment gains, as well as unrealized gains and losses on equity securities held in NextEra Energy Resources’ nuclear decommissioning funds and OTTI, none of which can be determined at this time, and operating results from the Spain solar project , impairment losses and merger related expenses. In addition, adjusted earnings expectations assume, among other things: normal weather and operating conditions; continued recovery of the national and the Florida economy; supportive commodity markets; current forward curves; public policy support for wind and solar development and construction; market demand and transmission expansion to support wind and solar development; market demand for pipeline capacity; access to capital at reasonable cost and terms; no divestitures, other than to NextEra Energy Partners, LP, or unannounced acquisitions; no adverse litigation decisions; and no changes to governmental tax policy or incentives. Expected adjusted earnings amounts cannot be reconciled to expected net income because net income includes the effect of non-qualifying hedges and net OTTI losses on certain investments, none of which can be determined at this time. NextEra Energy Resources, LLC. Adjusted EBITDA Adjusted EBITDA includes NextEra Energy Resources consolidated investments, excluding Spain, its share of NEP and forecasted investments, as well as its share of equity method investments. Adjusted EBITDA represents projected (a) revenue less (b) fuel expense, less (c) project operating expenses, less (d) corporate G&A, plus (e) other income, less (f) other deductions. Adjusted EBITDA excludes the impact of non-qualifying hedges, other than temporary impairments, certain differential membership costs, and net gains associated with NEP’s deconsolidation beginning in 2018. Projected revenue as used in the calculations of Adjusted EBITDA represents the sum of projected (a) operating revenue plus a pre-tax allocation of (b) production tax credits, plus (c) investment tax credits and plus (d) earnings impact from convertible investment tax credits. NextEra Energy Resources, LLC. Adjusted EBITDA by Asset Category Adjusted EBITDA by Asset Category includes NextEra Energy Resources consolidated investments, excluding Spain, its share of NEP and forecasted investments, as well as its share of equity method investments. Adjusted EBITDA by Asset Category represents projected (a) revenue less (b) fuel expense, less (c) project operating expenses, less (d) a portion of corporate G&A deemed to be associated with project operations, plus (e) other income, less (f) other deductions. Adjusted EBITDA by Asset Category excludes the impact of non-qualifying hedges, other than temporary impairments, corporate G&A not allocated to project operations, and certain differential membership costs. Projected revenue as used in the calculations of Adjusted EBITDA by Asset Category represents the sum of projected (a) operating revenue plus a pre-tax allocation of (b) production tax credits, plus (c) investment tax credits and plus (d) earnings impact from convertible investment tax credits. 49
Cautionary Statement And Risk Factors That May Affect
Future Results
This document contains forward-looking statements within the meaning of the Private Securities Litigation Reform Act of 1995.
Forward-looking statements are typically identified by words or phrases such as “may,” “will,” “anticipate,” “estimate,” “expect,”
“project,” “intend,” “plan,” “believe,” “predict,” and “target” and other words and terms of similar meaning. Forward-looking statements
involve estimates, expectations, projections, goals, forecasts, assumptions, risks and uncertainties. NEE cautions readers that any
forward-looking statement is not a guarantee of future performance and that actual results could differ materially from those contained
in any forward-looking statement. Such forward-looking statements include, but are not limited to, statements about the anticipated
benefits of the proposed acquisitions from Southern Company of Gulf Power Company, Florida City Gas and two gas-fired plants
(Southern Company assets), including future financial or operating results of NEE or the Southern Company assets, NEE’s or the
Southern Company assets’ plans, objectives, expectations or intentions, the expected timing of completion of the transactions, the
value of the transactions, as of the completion of the transactions or as of any other date in the future, and other statements that are
not historical facts. Important factors that could cause actual results to differ materially from those indicated by any such forward-
looking statements include risks and uncertainties relating to: the risk that NEE or Southern Company may be unable to obtain
governmental and regulatory approvals required for the transactions, or required governmental and regulatory approvals may not be
obtained on expected terms or in the time period anticipated and delay the transactions or result in the imposition of conditions that are
not anticipated and could cause the parties to abandon the transactions; the risk that a condition to closing of the transactions may not
be satisfied; the expected timing to consummate the proposed transactions; the risk that the businesses will not be integrated
successfully; disruption from the transactions making it more difficult to maintain relationships with customers, employees or suppliers;
the diversion of management time and attention on transaction-related issues; general worldwide economic conditions and related
uncertainties; the effect and timing of changes in laws or in governmental regulations (including environmental); fluctuations in trading
prices of securities of NEE and in the financial results of NEE or the Southern Company assets; the timing and extent of changes in
interest rates, commodity prices and demand and market prices for electricity or gas; and other factors discussed or referred to in the
“Risk Factors” section of NEE’s or Southern Company’s most recent Annual Reports on Form 10-K filed with the Securities and
Exchange Commission. Additional risks and uncertainties are identified and discussed in NEE’s and Southern Company’s reports filed
with the SEC and available at the SEC’s website at www.sec.gov. Each forward-looking statement speaks only as of the date of the
particular statement and NEE does not undertake any obligation to update or revise its forward-looking statements, whether as a result
of new information, future events or otherwise.

50
Cautionary Statement And Risk Factors That May Affect
Future Results (cont.)
This presentation contains “forward-looking statements” within the meaning of the safe harbor provisions of the Private Securities
Litigation Reform Act of 1995. Forward-looking statements are not statements of historical facts, but instead represent the current
expectations of NextEra Energy, Inc. (NextEra Energy) and Florida Power & Light Company (FPL) regarding future operating results and
other future events, many of which, by their nature, are inherently uncertain and outside of NextEra Energy's and FPL's control. Forward-
looking statements in this presentation include, among others, statements concerning adjusted earnings per share expectations and
future operating performance, and statements concerning future dividends. In some cases, you can identify the forward-looking
statements by words or phrases such as “will,” “may result,” “expect,” “anticipate,” “believe,” “intend,” “plan,” “seek,” “potential,”
“projection,” “forecast,” “predict,” “goals,” “target,” “outlook,” “should,” “would” or similar words or expressions. You should not place
undue reliance on these forward-looking statements, which are not a guarantee of future performance. The future results of NextEra
Energy and FPL and their business and financial condition are subject to risks and uncertainties that could cause their actual results to
differ materially from those expressed or implied in the forward-looking statements, or may require them to limit or eliminate certain
operations. These risks and uncertainties include, but are not limited to, the following: effects of extensive regulation of NextEra Energy's
and FPL's business operations; inability of NextEra Energy and FPL to recover in a timely manner any significant amount of costs, a
return on certain assets or a reasonable return on invested capital through base rates, cost recovery clauses, other regulatory
mechanisms or otherwise; impact of political, regulatory and economic factors on regulatory decisions important to NextEra Energy and
FPL; disallowance of cost recovery by FPL based on a finding of imprudent use of derivative instruments; effect of any reductions or
modifications to, or elimination of, governmental incentives or policies that support utility scale renewable energy projects of NextEra
Energy Resources, LLC and its affiliated entities (NextEra Energy Resources) or the imposition of additional tax laws, policies or
assessments on renewable energy; impact of new or revised laws, regulations, interpretations or other regulatory initiatives on NextEra
Energy and FPL; capital expenditures, increased operating costs and various liabilities attributable to environmental laws, regulations
and other standards applicable to NextEra Energy and FPL; effects on NextEra Energy and FPL of federal or state laws or regulations
mandating new or additional limits on the production of greenhouse gas emissions; exposure of NextEra Energy and FPL to significant
and increasing compliance costs and substantial monetary penalties and other sanctions as a result of extensive federal regulation of
their operations and businesses; effect on NextEra Energy and FPL of changes in tax laws, guidance or policies as well as in judgments
and estimates used to determine tax-related asset and liability amounts; impact on NextEra Energy and FPL of adverse results of
litigation; effect on NextEra Energy and FPL of failure to proceed with projects under development or inability to complete the
construction of (or capital improvements to) electric generation, transmission and distribution facilities, gas infrastructure facilities or other
facilities on schedule or within budget; impact on development and operating activities of NextEra Energy and FPL resulting from risks
related to project siting, financing, construction, permitting, governmental approvals and the negotiation of project development
agreements; risks involved in the operation and maintenance of electric generation, transmission and distribution facilities, gas
infrastructure facilities and other facilities; effect on NextEra Energy and FPL of a lack of growth or slower growth in the number of
customers or in customer usage; impact on NextEra Energy and FPL of severe weather and other weather conditions; threats of
terrorism and catastrophic events that could result from terrorism, cyber attacks or other attempts to disrupt NextEra Energy's and FPL's
business or the businesses of third parties; inability to obtain adequate insurance coverage for protection of NextEra Energy and FPL
against significant losses and risk that insurance coverage does not provide protection against all significant losses; a prolonged period
of low gas and oil prices could impact NextEra Energy Resources’ gas infrastructure business and cause NextEra Energy Resources to
delay or cancel certain gas infrastructure projects and for certain existing projects to be impaired;

 51
Cautionary Statement And Risk Factors That May Affect
Future Results (cont.)
risk to NextEra Energy Resources of increased operating costs resulting from unfavorable supply costs necessary to provide NextEra
Energy Resources' full energy and capacity requirement services; inability or failure by NextEra Energy Resources to manage
properly or hedge effectively the commodity risk within its portfolio; effect of reductions in the liquidity of energy markets on NextEra
Energy's ability to manage operational risks; effectiveness of NextEra Energy's and FPL's risk management tools associated with their
hedging and trading procedures to protect against significant losses, including the effect of unforeseen price variances from historical
behavior; impact of unavailability or disruption of power transmission or commodity transportation facilities on sale and delivery of
power or natural gas by FPL and NextEra Energy Resources; exposure of NextEra Energy and FPL to credit and performance risk
from customers, hedging counterparties and vendors; failure of NextEra Energy or FPL counterparties to perform under derivative
contracts or of requirement for NextEra Energy or FPL to post margin cash collateral under derivative contracts; failure or breach of
NextEra Energy's or FPL's information technology systems; risks to NextEra Energy and FPL's retail businesses from compromise of
sensitive customer data; losses from volatility in the market values of derivative instruments and limited liquidity in OTC markets;
impact of negative publicity; inability of NextEra Energy and FPL to maintain, negotiate or renegotiate acceptable franchise
agreements with municipalities and counties in Florida; occurrence of work strikes or stoppages and increasing personnel costs;
NextEra Energy's ability to successfully identify, complete and integrate acquisitions, including the effect of increased competition for
acquisitions; environmental, health and financial risks associated with NextEra Energy Resources’ and FPL's ownership and
operation of nuclear generation facilities; liability of NextEra Energy and FPL for significant retrospective assessments and/or
retrospective insurance premiums in the event of an incident at certain nuclear generation facilities; increased operating and capital
expenditures and/or result in reduced revenues at nuclear generation facilities of NextEra Energy or FPL resulting from orders or new
regulations of the Nuclear Regulatory Commission; inability to operate any of NextEra Energy Resources' or FPL's owned nuclear
generation units through the end of their respective operating licenses; effect of disruptions, uncertainty or volatility in the credit and
capital markets on NextEra Energy's and FPL's ability to fund their liquidity and capital needs and meet their growth objectives;
inability of NextEra Energy, FPL and NextEra Energy Capital Holdings, Inc. to maintain their current credit ratings; impairment of
NextEra Energy's and FPL's liquidity from inability of credit providers to fund their credit commitments or to maintain their current
credit ratings; poor market performance and other economic factors that could affect NextEra Energy's defined benefit pension plan's
funded status; poor market performance and other risks to the asset values of NextEra Energy's and FPL's nuclear decommissioning
funds; changes in market value and other risks to certain of NextEra Energy's investments; effect of inability of NextEra Energy
subsidiaries to pay upstream dividends or repay funds to NextEra Energy or of NextEra Energy's performance under guarantees of
subsidiary obligations on NextEra Energy's ability to meet its financial obligations and to pay dividends on its common stock; the fact
that the amount and timing of dividends payable on NextEra Energy's common stock, as well as the dividend policy approved by
NextEra Energy's board of directors from time to time, and changes to that policy, are within the sole discretion of NextEra Energy's
board of directors and, if declared and paid, dividends may be in amounts that are less than might be expected by shareholders;
NEP’s inability to access sources of capital on commercially reasonable terms could have an effect on its ability to consummate future
acquisitions and on the value of NextEra Energy’s limited partner interest in NextEra Energy Operating Partners, LP; and effects of
disruptions, uncertainty or volatility in the credit and capital markets on the market price of NextEra Energy's common stock. NextEra
Energy and FPL discuss these and other risks and uncertainties in their annual report on Form 10-K for the year ended December 31,
2017 and other SEC filings, and this presentation should be read in conjunction with such SEC filings made through the date of this
presentation. The forward-looking statements made in this presentation are made only as of the date of this presentation and NextEra
Energy and FPL undertake no obligation to update any forward-looking statements.

 52
53
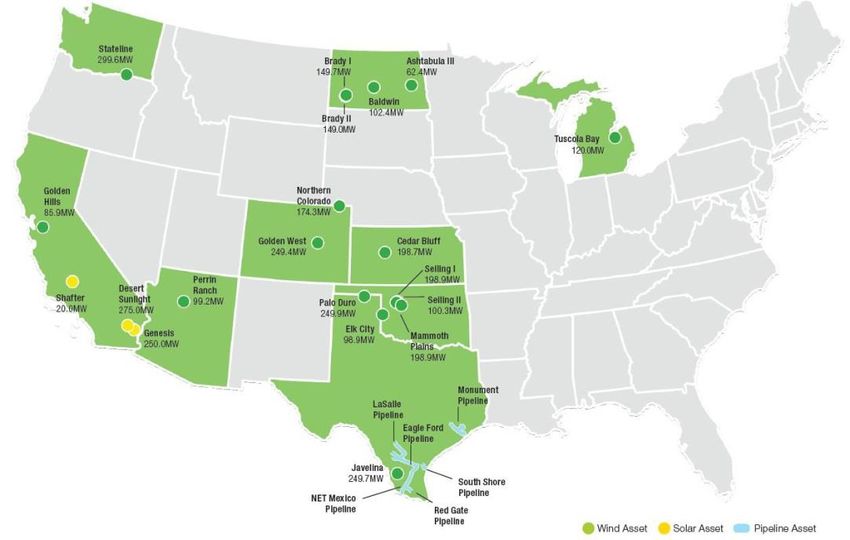
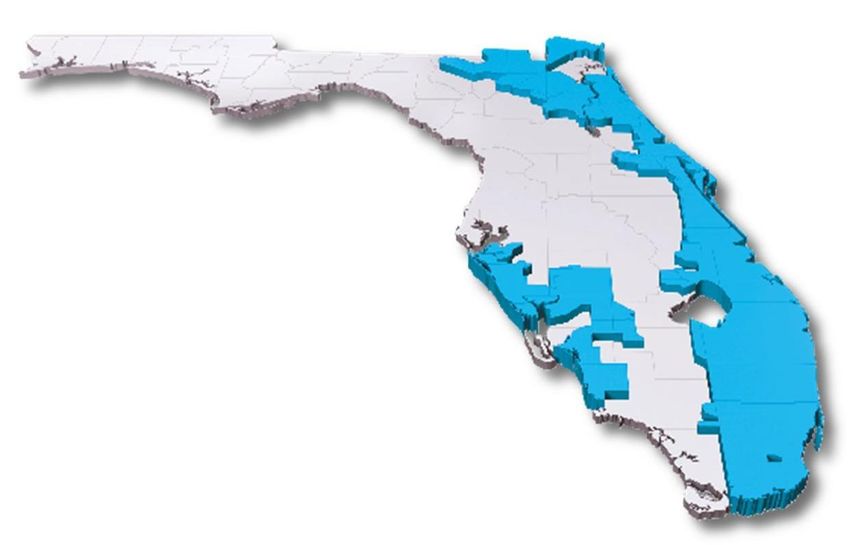
NEP’s portfolio is comprised of ~4.7 GW of renewable
assets plus seven natural gas pipelines with an ~17 year
weighted average remaining contract life
                                                Portfolio Overview(1)
             Project                         COD           Location       Net MW           Technology         Counterparty Credit   PPA Life
             Ashtabula III                  Dec-10           ND              62               Wind                    A3              20
             Baldwin                        Dec-10           ND             102               Wind                  Baa1              23
             Brady I                        Nov-16           ND             150               Wind                  Baa1              28
             Brady II                       Dec-16           ND             149               Wind                  Baa1              28
             Cedar Bluff                    Dec-15           KS             199               Wind                  Baa1              17
             Elk City                       Dec-10           OK              99               Wind                    A3              11
             Golden West                    Oct-15           CO             249               Wind                    A3              22
             Golden Hills                   Dec-15           CA              86               Wind                 Aa2, N/A           17
             Javelina                       Dec-15           TX             250               Wind                Baa2, Aa2           13
             Mammoth Plains                 Dec-14           OK             199               Wind                  Baa1              16
             N. Colorado                    Aug-09           CO             174               Wind                    A3              15
             Palo Duro                      Dec-14           TX             250               Wind                  Baa1              16
             Perrin Ranch                   Jan-12           AZ              99               Wind                    A2              19
             Seiling I                      Nov-14           OK             199               Wind                    A3              17
             Seiling II                     Nov-14           OK             100               Wind                    A2              16
             Stateline                      Dec-02           WA             300               Wind                  Baa2               8
             Tuscola Bay                    Dec-12            MI            120               Wind                    A2              14
             Desert Sunlight 250            Dec-14           CA             125               Solar                   A3              16
             Desert Sunlight 300            Dec-14           CA             150               Solar                   A3              21
             Genesis                        Mar-14           CA             250               Solar                   A3              20
             Shafter                        May-15           CA              20               Solar                   A3              17
             Rush Springs Wind              Dec-16           OK            249.9              Wind                Baa1/Ba3            13
             Javelina Wind II               Nov-16           TX             200               Wind                   NR               18
             Ninnescah Wind                 Dec-16           KS            208.3              Wind                  Baa1              18
             Kingman Wind                   Dec-16           KS            206.6              Wind                  Baa1              18
             Mountain View                  Jan-14           NV              20               Solar                 Baa1              20
             Carousel                       Nov-15           CO            149.7              Wind                  Baa1              23
             Breckinridge                   Sep-15           OK             98.1              Wind                   NR               17
             Bluff Point                    Oct-17            IN           119.7              Wind                  Baa1              19
             Cottonwood                     Nov-17           NE             89.7              Wind                   NR               22
             Golden Hills North             Nov-17           CA              46               Wind                   NR               19
             Total Renewables                                              4,719                                                      18
             Net Midstream                  Dec-14           TX          3.2 Bcf/d(2)   Natual Gas Pipeline         Baa2(3)            13
                                                                                                                                         (4)
             Total Portfolio                                                                                                          17
     1)   Portfolio as of December 31, 2018
     2)   Contracted pipeline capacity
     3)   Average rating of Texas Pipelines contract counterparties
     4)   Weighted on calendar year 2019 Cash Available for Distribution (CAFD) expectations for portfolio as of
54        December 31, 2018; see Appendix for definition of CAFD expectations
Portfolio Financing Summary Terms(1)
Key Terms Summary
Funding Amount: BlackRock to fund $750 MM; NEP to fund the balance of the $1,275 MM Energy Resources portfolio purchase price
Issuer: Newly-formed private HoldCo managed and operated by affiliates of NEP
BlackRock to purchase Class B Common Equity Units from Issuer, representing an approximately 59% investment in
Units:
HoldCo
Draw Timing: Funds to be drawn no later than 12/31/2018
Cash distributions to occur on a monthly basis; for the first three years BlackRock will receive 15% of all distributions and
Cash
NEP will receive 85% which is expected to result in an implied yield of approximately 2.5% per annum. Thereafter, if the
Distributions:
buyout right has not been exercised, BlackRock will receive 80% of all distributions and NEP will receive 20%
During the 4th year following the Draw Date, NEP will have the option to purchase 100% of the Class B Units for a
purchase price equal to $750 million plus a fixed return of 7.75% (the “Buyout Amount”)
NEP has the right to pay at least seventy percent of the Buyout Amount in non-voting NEP common units at an issuance
Buyout
price based on the then-current market price of NEP common units (without discount), with the balance paid in cash. NEP
Right:
will enter into a registration rights agreements for the units issued in consideration for the Buyout Amount substantially
similar to those executed for the Series A Preferred transaction
Buyout right is subject to certain limitations and extensions
Change of Upon a change of control of NEP, BlackRock may elect to force a repurchase of the Class B units for cash or NEP
Control: common units (or a combination) at NEP’s election at a 10% IRR
Transfer Prior to expiration of the buyout period, BlackRock may not transfer its Class B Units without the consent of NEP;
Provisions: afterward, BlackRock may transfer without consent to anyone not defined as a competitor. NEP may not transfer its Class
A Units without the consent of BlackRock
Governance: BlackRock will have limited governance rights
1) Summary of terms; please refer to the NextEra Energy Partners 8-K filed on September 5, 2018 for additional
details
55You can also read