A fracture mechanics framework for optimising design and inspection of offshore wind turbine support structures against fatigue failure - WES
←
→
Page content transcription
If your browser does not render page correctly, please read the page content below
Wind Energ. Sci., 6, 677–699, 2021
https://doi.org/10.5194/wes-6-677-2021
© Author(s) 2021. This work is distributed under
the Creative Commons Attribution 4.0 License.

         A fracture mechanics framework for optimising design
             and inspection of offshore wind turbine support
                    structures against fatigue failure
                              Peyman Amirafshari, Feargal Brennan, and Athanasios Kolios
                Department of Naval Architecture, Ocean and Marine Engineering, University of Strathclyde,
                                           Glasgow, G4 0LZ, United Kingdom
               Correspondence: Peyman Amirafshari (peyman.afshari@gmail.com) and Athanasios Kolios
                                                (athanasios.kolios@strath.ac.uk)
                                     Received: 20 March 2020 – Discussion started: 6 April 2020
                            Revised: 2 March 2021 – Accepted: 21 March 2021 – Published: 20 May 2021

       Abstract. Offshore wind turbine (OWT) support structures need to be designed against fatigue failure under
       cyclic aerodynamic and wave loading. The fatigue failure can be accelerated in a corrosive sea environment.
       Traditionally, a stress–life approach called the S–N (stress–number of cycles) curve method has been used for
       the design of structures against fatigue failure. There are a number of limitations in the S–N approach related to
       welded structures which can be addressed by the fracture mechanics approach. In this paper the limitations of the
       S–N approach related to OWT support structure are addressed and a fatigue design framework based on fracture
       mechanics is developed. The application of the framework to a monopile OWT support structure is demonstrated
       and optimisation of in-service inspection of the structure is studied. It was found that both the design of the weld
       joint and non-destructive testing (NDT) techniques can be optimised to reduce in-service inspection frequency.
       Furthermore, probabilistic fracture mechanics as a form of risk-based design is outlined and its application to the
       monopile support structure is studied. The probabilistic model showed a better capability to account for NDT
       reliability over a range of possible crack sizes as well as to provide a risk associated with the chosen inspection
       time which can be used in inspection cost–benefit analysis. There are a number of areas for future research,
       including a better estimate of fatigue stress with a time-history analysis, the application of the framework to
       other types of support structures such as jackets and tripods, and integration of risk-based optimisation with a
       cost–benefit analysis.

1   Introduction                                                      Since the power production of a wind turbine is directly
                                                                   related to the wind velocity at the hub, the developments of
Wind turbines are playing a key role in decarbonising world        offshore wind turbines (OWTs) are expected to grow in or-
power production systems. The share of energy from renew-          der to harvest more power from offshore sites where wind
able sources in the European Union (EU) countries set out          speed is generally higher compared to onshore. Furthermore,
by national energy and climate plans (NECPs) is targeted           OWTs are socially more accepted as there are concerns about
to reach 32 % by 2030 and 100 % by 2050. In 2018 the to-           onshore wind turbines regarding their astatic aspects, noise
tal share of energy from renewable sources was 18 % in the         pollution, and their risk for birds (Tavner, 2012).
EU and 16 % in the United Kingdom (European Environ-                  Despite their higher wind power capacity, the biggest dis-
ment Agency, 2019). Thanks to the commitment of European           advantage of OWTs is their construction and maintenance
countries to achieve the above targets the prospects for the       costs. Due to their remote location, their inspection and
offshore renewable industry for further growth continue to         maintenance are challenging and expensive. Therefore, op-
be strong (Fraile et al., 2019).                                   timising the design and maintenance of these structures can

Published by Copernicus Publications on behalf of the European Academy of Wind Energy e.V.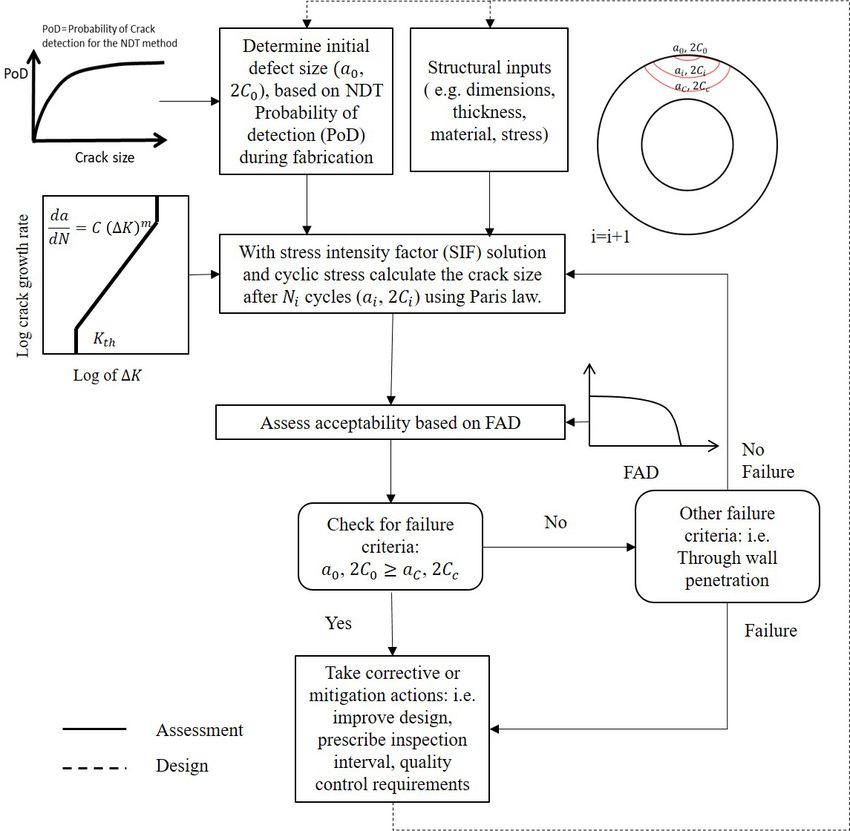
678 P. Amirafshari et al.: Optimising design and inspection of offshore wind turbine support structures
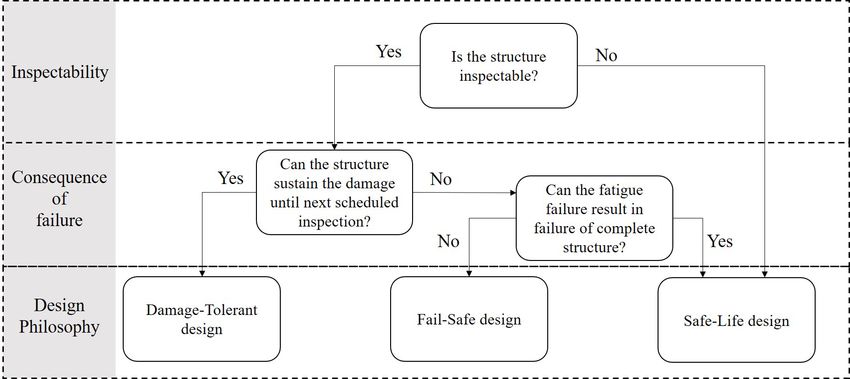
Figure 1. Relationship between inspection and fatigue design philosophy.
decrease the levelised cost of electricity (LCOE) (Baum et Despite its popularity, a number of limitations exist with
al., 2018; Luengo and Kolios, 2015). the S–N data approach concerning offshore wind turbine
OWT support structures constantly experience cyclic structures:
stress imposed by wind turbulence and wave loading which Design for inspection. Many structures are designed con-
makes them prone to fatigue failure (Barltrop and Adams, sidering a damage-tolerant philosophy where the structure is
1991). The fatigue damage accumulation could be further ac- expected to tolerate certain levels of fatigue damage until
celerated if exposed to the corrosive marine environment. the next scheduled inspection (Fig. 1). The expected crack
There are two approaches for quantifying fatigue damage: size at the time of the inspection is estimated using frac-
the S–N (stress vs. number of cycles) method and the fracture ture mechanics, and a suitable non-destructive testing (NDT)
mechanics (FM) approach. technique capable of detecting the critical crack size is pre-
Standards such as IEC 61400-3 (IEC, 2009), DNVGL- scribed. The S–N approach can only quantify the accumu-
ST-0126 (DNVGL, 2016a), DNVGL-ST-0437 (DNVGL, lated damage without providing any information about the
2016b), and DNVGL-RP-C203 (DNV, 2010) are commonly size and dimensions of the damage. Fracture mechanics on
used for the design of offshore wind turbines against fatigue the other hand estimates time-dependent fatigue crack size.
failure. Current design approaches are solely based on the S– In OWT structures, due to access restrictions, the choice of
N method. In this approach, the fatigue life of a structural the NDT method can be limited to a certain NDT method
element is determined using a relevant S–N curve, recom- with a specific detection capability. Therefore, it may be nec-
mended by one of the standards or derived from bespoke fa- essary to consider the probability of non-detection (PoND)
tigue test programmes. Service-induced stresses, contribut- and improve the design for such a scenario.
ing to fatigue damage accumulations, are determined from Effect of larger defect sizes. S–N data are based on the
structural analysis; then a suitable joint class capable of re- assumption that the initial defect sizes are small, typically
sisting those stresses is specified. Alternatively, if the joint between 0.04 and 0.2 mm (BSI7608, 2015), assuming that
class is known, maximum allowable fatigue stresses for the an appropriate fabrication quality control programme is in
intended life of the structure are determined from the relevant place which can detect larger fabrication defects. In practice,
S–N curve (Hobbacher, 2016). the reliability and efficiency of such a programme and the
Fatigue design of steel structures using S–N data is com- NDT techniques are uncertain and vary considerably among
monly preferred to the fracture mechanics approach due to fabrication yards (Amirafshari, 2019). Assessment and de-
its simplicity (Naess, 1985). The S–N approach is also con- sign of the welded joints considering the presence of large
sidered more reliable since it is based on fatigue testing defects is only possible using a fracture mechanics approach.
compared to fracture mechanics which is based on calcula- An improved joint design can be achieved allowing for pos-
tions where additional input variables (e.g. crack growth rate, sible fabrication defects by specifying, for example, larger
toughness, and residual stress distributions) need to be con- thicknesses, higher-toughness steels, or post-weld heat treat-
sidered (Anderson, 2005). ment (Zerbst et al., 2015).
New welding processes. There are always efforts to im-
prove structural resistance, fabrication efficiency, and weld
Wind Energ. Sci., 6, 677–699, 2021 https://doi.org/10.5194/wes-6-677-2021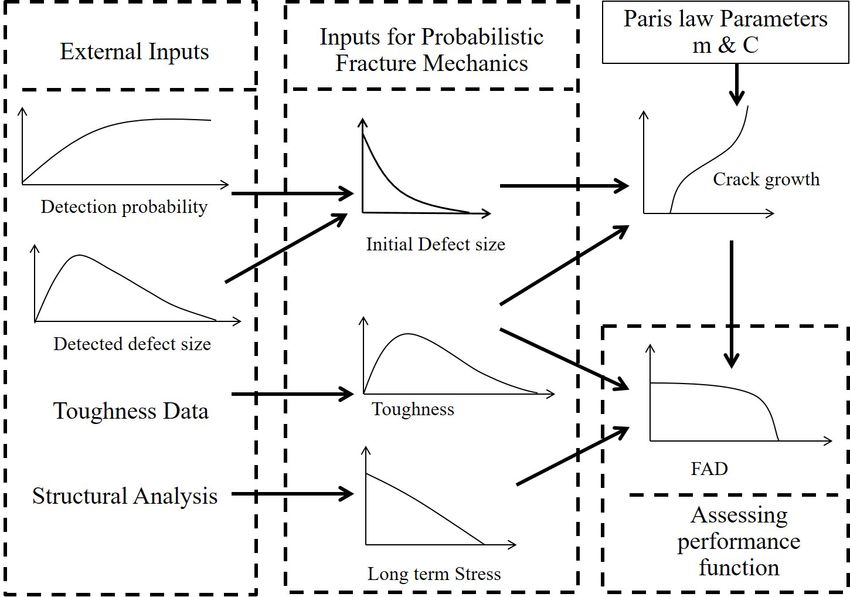
P. Amirafshari et al.: Optimising design and inspection of offshore wind turbine support structures                                 679

Figure 2. Crack growth curve diagram.

Figure 3. Schematic of crack propagation curve according to the
Paris–Erdogan law (Amirafshari, 2019).                               Figure 4. Schematic of crack growth models by the Paris law.

quality by developing and implementing new welding tech-                Shakedown and compressive residual stresses. Fracture
nologies. Those processes may inevitably have altered                failure of welded joints is directly related to weld residual
characteristics (defect rates, sizes, and geometry; residual         stresses. Tensile residual stresses reduce fatigue life by re-
stresses; material toughness; etc.), which affect fatigue fail-      ducing fracture capacity and moving the compressive part of
ure of the joint. Considering these variables using S–N data         cyclic stress to the tensile stress region. Part of these stresses
requires the development of a bespoke fatigue test pro-              can be relieved under service or fabrication loads, which is
gramme which is not always feasible (Lassen and Recho,               commonly known as the “shakedown” effect (Li et al., 2007).
2013). A more efficient and cost-effective solution is the ap-       In pile foundations, on the other hand, since the structure
plication of fracture mechanics.                                     is driven to the soil, a considerable number of compressive
   New materials. Development and use of new steel grades            residual stresses are induced into the pile (Da Costa et al.,
with higher tensile strength and weld consumables with supe-         2001), which can potentially improve the fatigue and frac-
rior weldability characteristics affect fatigue life; i.e. higher-   ture performance. The effect of compressive residual stress
strength steel will be capable of resisting higher stresses, but     and the shakedown phenomena and its interaction with var-
the fatigue resistance does not increase proportionally (Oku-        ious flaw sizes can be addressed using a fracture mechanics
moto et al., 2009). Contrary to the S–N method, these vari-          approach.
ables can be directly considered in the fatigue life prediction         In this paper the fracture mechanics principals are briefly
using fracture mechanics.                                            described, and a framework for an optimised design of struc-

https://doi.org/10.5194/wes-6-677-2021                                                        Wind Energ. Sci., 6, 677–699, 2021
680 P. Amirafshari et al.: Optimising design and inspection of offshore wind turbine support structures
tures based on fracture mechanics is developed. Then, prob- where a is flaw size, σ is stress at the flaw, and Y is the ge-
abilistic fracture mechanics for risk and reliability-based de- ometry function which depends on both the geometry under
sign approaches is outlined. Finally, the application of the de- consideration and the loading mode. There are several ways
veloped methods to a monopile support structure is demon- in which solutions for Y can be obtained. Although it is pos-
strated. sible to derive solutions for simple geometries analytically,
e.g. using “weight functions”, numerical techniques are more
commonly used (finite element, finite difference, or bound-
2 Fracture mechanics approach
ary element methods).
Fatigue cracks in welded structures are initiated from weld The number of cycles to failure is calculated by rearrang-
fabrication defects at the joints. Even sound welded joints ing and rewriting Eq. (1):
often contain small undercuts (Fig. 2).
Zaf
The fracture mechanics approach uses the Paris equation da
to predict crack growth under cyclic stress. The method is N = (3)
C(1K)m
based on the assumption that an initial flaw is present in the a0
structure. The initial flaw size depends on the rigour of the (1− m ) (1− m )
1 af 2 − a0 2
fabrication quality control (QC) programme (Jonsson et al., = m · .
2016). The reliability of the NDT method that is used during A · Y m · 1σ m · π 2 1 − m2
the QC, the extent of the inspection (100 % or partial), and
Offshore structures are not subjected to constant-amplitude
the flaw acceptance criteria will influence such rigour.
stress but a variable-amplitude stress spectrum. If the long-
The fracture mechanics enables the efficient application of
term stress distribution is converted into a step function of
NDT methods for in-service inspection by specifying inspec-
n blocks, generally of equal length in log N, the crack size
tion interval(s) and the most effective NDT method which
increment for step i is
has the capability to reliably detect the predicted crack size
with required confidence. This is illustrated in Fig. 2, where
1ai = C(1Ki )m 1Ni . (4)
the NDT inspection (I1 ) detects cracks greater than the initial
flaw size (a0 ). If all such cracks are found and repaired, the Moreover, the final crack size at the end of the N cycles is
crack growth curve will be shifted down. obtained by summing Eq. (4) for the n stress blocks:
2.1 Crack growth prediction N
X
aN = a0 + 1ai . (5)
Fracture mechanics (FM) enables the prediction of crack i=1
propagation by using the crack growth rate, illustrated in
Fig. 3. Region A is where the crack growth rate occurs as Equation (4) is only valid for small values of 1ai since 1Ki
soon as 1K ≥ 1Kth , where 1Kth is the threshold value of depends on the crack size, which requires dividing the stress
1K. The threshold value depends on a number of factors range spectrum into a large number of stress blocks.
such as the stress ratio Kmax /Kmin , sequence effect, residual The number of cycles to failure may, alternatively, be cal-
stresses, loading frequency, and environment. Region B is culated according to Eq. (6) using an equivalent constant-
where the crack growth rate increases with 1K to a constant amplitude stress range 1σeq giving the same amount of dam-
power. Region C is where the crack growth rate increases age (Naess, 1985):
rapidly until failure occurs as soon as K ≥ Kcritical . 1/β
Z∞
In the FM approach crack growth rate is commonly de-
scribed by the Paris–Erdogan equation (Eq. 1): 1σeq = 1σ β p1σ (1σ ) d1σ , (6)
0
da
= C · 1K m , (1)
dN where β is the contribution factor. For the central part of the
crack growth curve, β is often taken as the slope of the of
da
where dN is the rate of crack growth to load cycles, 1K is the crack growth line. p1σ (1σ ) is the probability density
the change in stress intensity factor, and C and m are ma- function of the stress range 1σ .
terial constants. Recently a bilinear crack growth model has
been used as well (Fig. 4). The BS 7910:2019-recommended
model (British Standard, 2019) is the bilinear model, and the 2.2 Failure criteria
simplified model is cited as well. 2.2.1 Through thickness
Stress intensity factor is described by
√ In the through-thickness criterion, the initial fatigue crack is
1K = Y σ π a, (2) assumed to be a surface-breaking flaw growing along the
Wind Energ. Sci., 6, 677–699, 2021 https://doi.org/10.5194/wes-6-677-2021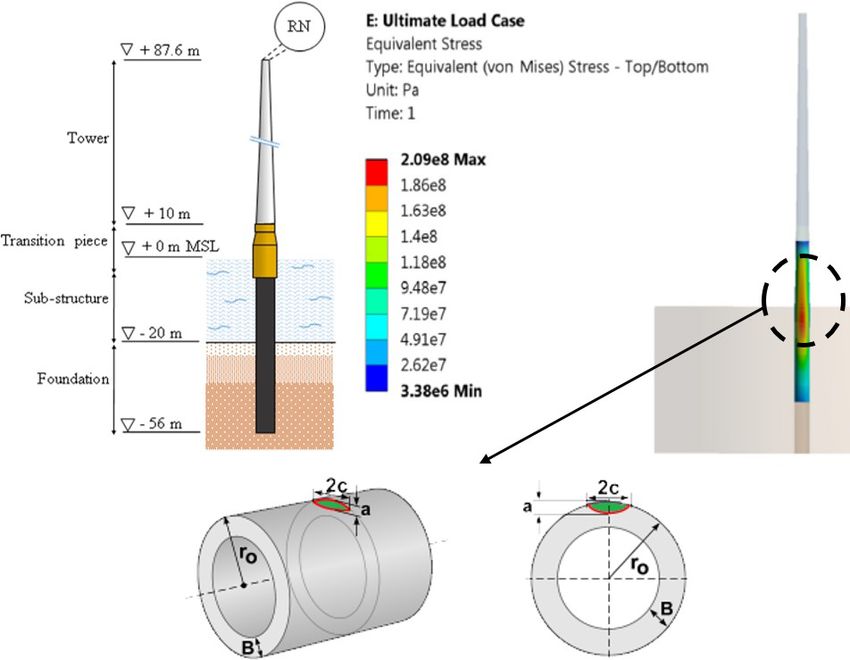
P. Amirafshari et al.: Optimising design and inspection of offshore wind turbine support structures                              681

                                                                     Figure 6. Diagram of the remaining ligament in a semi-spherical
                                                                     crack.

                                                                        The critical size may then be reduced to account for further
                                                                     safety factors.

Figure 5. Diagram of a surface crack penetrating the wall.           Based on the geometry of the structural member

                                                                     For ductile structures, it is common to take the material thick-
height (a) and length (2C) of the flaw. The failure hap-             ness as the critical crack height (af = acr = thickness). How-
pens when the crack height penetrates through the thick-             ever, normally the assumption is that the crack grows under
ness of the wall (Fig. 5). This criterion is, particularly, com-     cyclic loading which corresponds to normal service loading
monly adopted for structures containing pressurised contain-         until it occurs through the thickness. In reality, failure often
ments, e.g. pipelines, pressure vessels, or for air-filled off-      happens during extreme load occurrences. The cracked struc-
shore structures, where the pressure or absence of water in-         ture may fail under such extreme loading through the failure
side the structure can be used as a simple way to detect             of the thickness ligament (Fig. 6). The brittle or elastoplastic
through-thickness cracks.                                            ligament failure may also occur in structures with low frac-
                                                                     ture toughness.
2.2.2   Total collapse criteria                                         To address the above limitation a failure assessment dia-
                                                                     gram (FAD) may be adopted.
Many structures have the capacity to sustain through-
thickness cracks until the crack length reaches a critical
length. Thin wide plates that are primarily subjected to mem-
brane stress and redundant structures such as jacket type plat-      Based on the failure assessment diagram (FAD)
forms and stiffened plate hull structures are examples of such
structures.                                                          A failure assessment diagram (FAD) can assess the failure
   In structural reliability analysis, the probability of a col-     of the through-thickness crack as well as implement extreme
lapse can be considered the probability of a fatigue crack           load occurrences by treating them as the primary stress. The
failure, PF , times the probability of a collapse given that there   approach is explained below.
is a fatigue failure in the structure, PSYS . The probability of        When a crack propagates through a structure, the crack
the total structural collapse due to fatigue failure should be       size ultimately reaches a critical size af . af corresponds to
below a target probability of failure, Pt :                          a critical stress intensity factor, usually taken as character-
                                                                     istic of the fracture toughness Kmat , at which fracture hap-
PF · PSYS ≤ Pt .                                              (7)    pens. Alternatively, if the applied load is high and the struc-
                                                                     ture tensile strength is low, the structure may reach its tensile
For jacket structures, the method of removing one mem-               strength capacity and fail by plastic collapse. The latter is
ber has been commonly used to assess the residual capacity           more favourable as it is usually associated with large defor-
against overall collapse (DNV, 2015).                                mations prior to failure providing some level of warning. In
                                                                     between brittle fracture and global collapse is an elastoplastic
2.2.3   Critical crack size                                          failure mode, where failure occurs before reaching the plas-
                                                                     tic capacity or toughness limit; this has been best described
Fatigue failure is considered to occur when the crack size           by a failure assessment diagram (FAD) in the R6 procedure
reaches a critical value. There are generally two ways to de-        in 1976 and improved over time by e.g. including the options
termine the critical size, which are explained in the coming         available to model specific material properties. The body of
sections:                                                            knowledge encapsulated in R6 has affected the development
  1. based on the geometry of the structural member                  of British Standards Institution documents in various ways
                                                                     over the years, leading to BS 7910:1999 and the latest ver-
  2. based on the failure assessment diagram.                        sion at the time of writing (British Standard, 2019).

https://doi.org/10.5194/wes-6-677-2021                                                       Wind Energ. Sci., 6, 677–699, 2021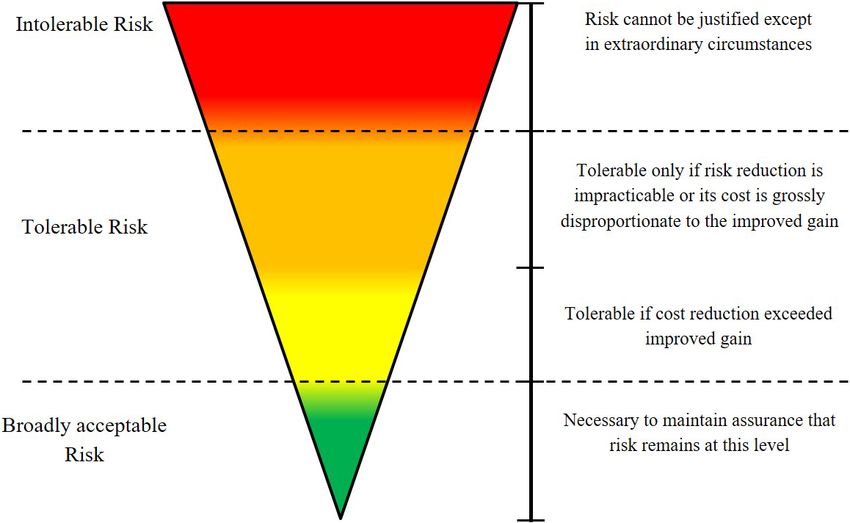
682                       P. Amirafshari et al.: Optimising design and inspection of offshore wind turbine support structures

Figure 7. Failure assessment diagram (FAD) (Amirafshari, 2019).

Figure 8. Fracture mechanics flow diagram for assessment and design of structures against fatigue failure.

Wind Energ. Sci., 6, 677–699, 2021                                                           https://doi.org/10.5194/wes-6-677-2021
P. Amirafshari et al.: Optimising design and inspection of offshore wind turbine support structures 683
Figure 9. Schematic representation of damage-tolerant fracture mechanics approach, adapted from Anderson (2005).
Figure 10. Relationship between crack size distribution, probability of detection, and detected crack size distribution (Amirafshari, 2019).
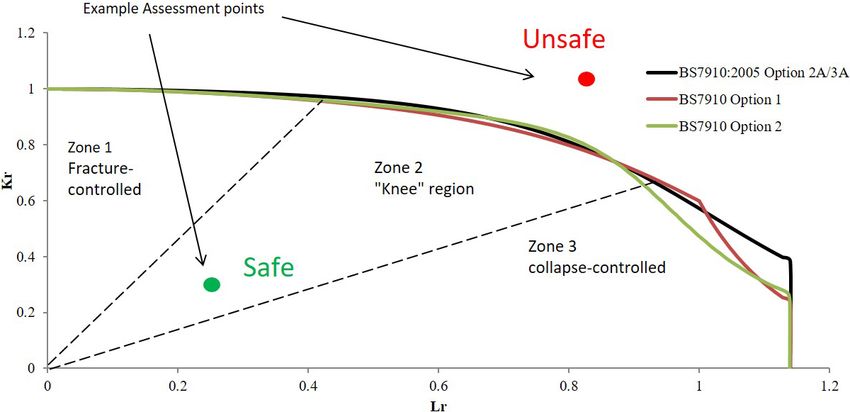
The failure assessment line (FAL) represents the nor- The flow stress is the average of the yield and ultimate
malised crack driving force: stresses:
σY + σU
σflow = . (10)
Kelastic 2
Kr = . (8)
Kelastic plastic If the assessment point lies inside the envelope (below the
FAL), the fracture mechanics driving parameter is lower than
Kr is equal to 1 where the applied load is zero and declines the material resistance parameter and the part should be safe;
as the ratio between the applied load and yield load (Lr ) in- otherwise, there is a risk of failure. The failure assessment
creases towards the collapse load (see Fig. 7). diagram can be determined with one of the procedures pro-
The plastic collapse load is calculated based on yield vided by British Standard (2019). As it is illustrated in Fig. 7,
stress. However, the material has further load carrying ca- FAD may be categorised into three different zones: Zone 1 is
pacity as it work hardens through yield to the ultimate ten- the fracture-dominant zone; Zone 2 is the elastoplastic region
sile stress. To take this into account the rightward limit of the or the knee region; and Zone 3 is the collapse-dominant zone.
curve is fixed at the ratio of the flow stress to the yield stress: British Standard (2019) has three alternative approaches:
Option 1, Option 2, and Option 3. These are of increasing
σflow complexity in terms of the required material and stress anal-
Lr = . (9) ysis data but provide results of increasing accuracy.
σY
https://doi.org/10.5194/wes-6-677-2021 Wind Energ. Sci., 6, 677–699, 2021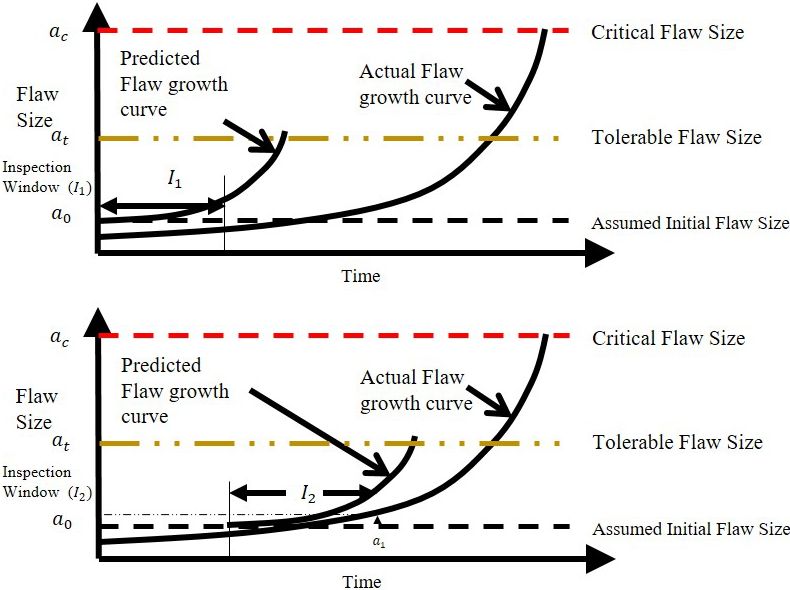
684                       P. Amirafshari et al.: Optimising design and inspection of offshore wind turbine support structures

Figure 11. DNV PoD for surface NDE. Replotted from DNV (2015).

Figure 12. Probabilistic fracture assessment using the Monte Carlo method and based on FAD (Amirafshari, 2019).

   Options 1 and 2 (British Standard, 2019) and options 2A               In OWT support structures fatigue failure initiates from the
and 3A (British Standard, 2019) for structural steel with ul-         welded connection; thus, the fatigue design often involves
timate tensile stress of 550 MPa and yield stress of 450 MPa          prescribing local improvements to the welded connection.
are illustrated in Fig. 7. It can be seen that the greatest differ-   However, since fatigue life is related to dynamic character-
ence between the three plotted loci is in the collapse region.        istics of the structure, the global dimensions of the struc-
For discussions about BS 7910 options, reference is made to           ture may also need alterations to achieve higher fatigue re-
British Standard (2019) and TWI (2015).                               sistance.
                                                                         The fatigue damage prediction model could be the S–N
                                                                      curve method or linear elastic fracture mechanics (LEFM).
                                                                      Here, a LEFM method is adopted to address the limitations of
3   Fracture mechanics framework for structural
                                                                      the S–N curve method. Figure 8 shows the proposed frame-
    design
                                                                      work.
                                                                         First, the required inputs, such as structural dimensions
The common practice in structural design is to specify di-            (determined by structural design based on the ULS), initial
mensions of the structural component based on the most crit-          flaw size, material toughness and tensile properties, stress
ical limit state, usually ultimate limit state (ULS), and check       at the flaw, and parameters of the Paris equation, are deter-
or modify the design based on other limit states such as the          mined. Using the Paris equation for a chosen increment of
serviceability limit state (SLS) or fatigue limit state (FLS).

Wind Energ. Sci., 6, 677–699, 2021                                                       https://doi.org/10.5194/wes-6-677-2021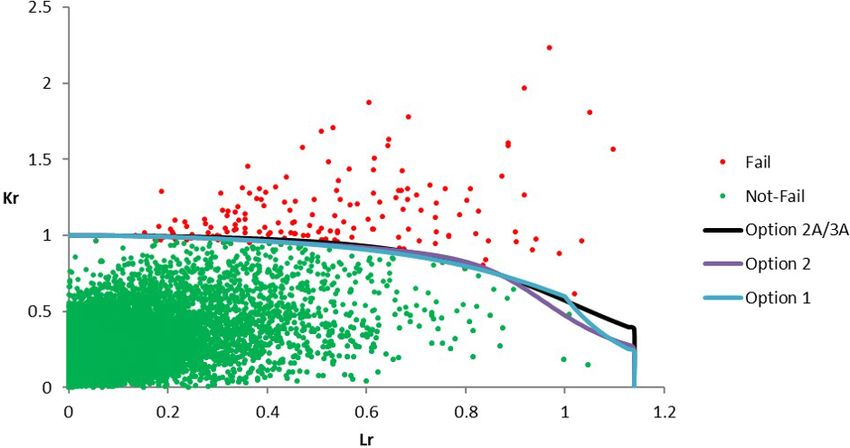
P. Amirafshari et al.: Optimising design and inspection of offshore wind turbine support structures                                  685

Figure 13. A schematic presentation of the inputs to probabilistic fracture mechanics (Amirafshari, 2019).

                                                                        ophy allows flaws to remain in the structure, provided they
                                                                        are well below the critical size.
                                                                           Once the critical crack size, ac , has been estimated, a
                                                                        safety factor is applied to determine the tolerable flaw size at .
                                                                        The safety factor should be based on uncertainties in the in-
                                                                        put parameters (e.g. stress, parameters in the Paris equation,
                                                                        and toughness). Another consideration in specifying the tol-
                                                                        erable flaw size is the crack growth rate; at should be chosen
                                                                        such that da/dt at this flaw size is relatively small, and a rea-
                                                                        sonable length of time is required to grow the flaw from at to
                                                                        ac (Anderson, 2005). This is shown schematically in Fig. 9.
Figure 14. Example of a time-dependent fatigue and fracture relia-
bility curve.                                                           3.2   Inspection reliability
                                                                        NDT techniques can only detect a limited number of defects
                                                                        of a certain size. For instance, an NDT method with 50 %
time (Ni ), the increase in initial crack size is estimated. The        probability of detection at a certain size is expected to miss
predicted crack size is then compared against failure criteria.         50 % of the defects of that size; in other words, the real num-
The procedure is repeated for the next time increment until             ber of defects with that size is likely to be 100 % more than
the failure. If the failure is predicted to occur before the in-        the number detected. In structural integrity assessment, it is
tended life of the structure, the fatigue life may be enhanced          often convenient to plot detection probability against defect
by changing variables that affect the fatigue failure such as           size, which constructs the so-called probability of detection
structural dimensions, quality control requirements (initial            curve (Fig. 11). Detection capabilities of NDT methods are
flaw size), or post-fabrication improvements (e.g. post-weld            directly related to the sizing of flaws (Georgiou, 2006). The
heat treatment) or by specifying inspection interval(s).                bigger the flaw sizes, the more likely that they are detected.
                                                                        Figure 10 shows the relationship between detected defect
3.1   Damage-tolerant design                                            size distribution, the probability of detection of defect sizes,
                                                                        and the actual defect size distribution that is present in the
The term damage-tolerant fracture mechanics normally                    structure.
refers to a design methodology in which fracture mechanics                 Probabilities of detection (PoDs) for NDT methods are
analyses predict remaining life and specifies inspection inter-         highly dependent on various factors such as the operator
vals. This approach is typically applied to structures prone to         skills, testing environment, test specimen (thickness, geom-
time-dependent crack growth. The damage tolerance philos-               etry, material, etc.), type of flaw, and orientation and loca-

https://doi.org/10.5194/wes-6-677-2021                                                           Wind Energ. Sci., 6, 677–699, 2021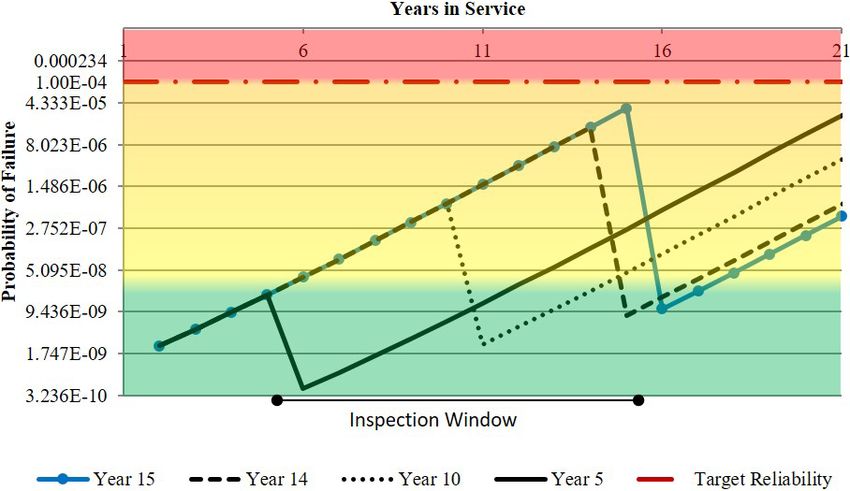
686                       P. Amirafshari et al.: Optimising design and inspection of offshore wind turbine support structures

Figure 15. A typical risk matrix diagram.

Figure 16. ALARP carrot diagram based on HSE (2001).

tion of the flaw (Førli, 1999). Hence, an accurate estimation           Generally, there are two strategies in the inspection
of PoD curves requires individual PoD test programmes for            of structures that are susceptible to damage mechanisms:
specific projects. However, a number of lower-bound generic          fixed (periodic maintenance) and non-fixed (condition-based
models are available in the literature for some specific NDT         maintenance) inspection schedules.
methods. Two such models that are relevant to this work are
given in Fig. 11 and Table 1.
   Further information about derivation, application, and lim-       3.3.1   Inspection schedules are fixed (periodic
itations of PoDs can found in Georgiou (2006).                               maintenance)

3.3   Inspection strategy                                            Here, the fracture mechanics can be used to design the struc-
                                                                     ture so that the possible fatigue cracks remain below toler-
Fracture mechanics assessment is closely tied to the inspec-         able limits. The crack size at the time of the inspection is
tion method. The inspection method provides input to the             predicted using the Paris law to select an appropriate NDT
fracture mechanics assessment, which in turn helps to define         method.
inspection intervals. A structure is inspected during construc-
tion for quality control purposes. Choice of the NDT method
varies between fabrication yards, but as a general rule, all         3.3.2   Inspection schedules are not fixed
weldments are visually inspected and may be complemented                     (condition-based maintenance)
by inspection of a limited number of checkpoints using more
reliable NDT techniques on a sampling basis (Amirafshari et          In this case, the inspection interval and the NDT method can
al., 2018). If no significant flaws are detected, the initial flaw   be optimised in such a way that the inspection results in a
size is set at an assumed value a0 , which corresponds to the        safer condition or a minimised cost of maintenance and fail-
largest flaw that might be missed by NDT.                            ure.

Wind Energ. Sci., 6, 677–699, 2021                                                      https://doi.org/10.5194/wes-6-677-2021
P. Amirafshari et al.: Optimising design and inspection of offshore wind turbine support structures 687
Table 1. NDT reliability (BS7910, 2015).
Method Condition Flaw length (mm) Flaw through thickness (mm)
Magnetic particle inspection (MPI) Machined or ground 5 1.5
As-welded With local dressing 10 2
With poor profile 20 4
Ultrasonic testing (UT) Convectional 15 3
Table 2. Design constraints for damage-tolerant fracture mechanics design.
Design constraint
Limit state Deterministic Allowable damage, stress, etc.
Probabilistic Target levels of reliability
Inspection capabilities During fabrication – Extent of inspection
– NDT PoD
During service – Inspection schedule (fixed periodic inspections)
– NDT method (e.g. PoD, access restrictions, costs)
3.4 Design inputs stress and flaw size, with lower-bound values of resistance
variables such as fracture toughness. In reality, the proba-
Design inputs can be categorised into design constraints (Ta- bility of all unfavourable conditions occurring at the same
ble 2) and design variables (Table 3). Here, only design vari- time is very low and often a too-conservative assumption.
ables related to a fracture mechanics method are considered. An alternative approach is a probabilistic analysis, in which
Further information about the design of offshore wind tur- uncertain variables are treated stochastically and as random
bine support structures can be found in Arany et al. (2017) variables.
and Van Wingerde et al. (2006). In probabilistic assessments, all possible combinations of
Depending on the chosen maintenance strategy, the in- input variables leading to failure are compared against total
spection capabilities may be considered a design constraint possible combinations, and a probability of failure is esti-
or a design variable. mated instead of a definite fail or not-fail evaluation. Proba-
If a probabilistic approach is employed instead of the con- bilistic analysis is also in line with the damage-tolerant phi-
ventional deterministic approach, the variables are consid- losophy. The failure probability for the limit state function
ered stochastically and target probabilities of failures are may be estimated using one of the available analytical, nu-
used instead of allowable deterministic values (Table 2). merical, or simulation methods such as the Monte Carlo sim-
ulation. Figure 12 shows a probabilistic fracture assessment
using the Monte Carlo method and based on the FAD.
4 Probabilistic fracture mechanics One limitation of deterministic fracture mechanics is that
conservative prediction of critical defect size and the time
Fracture mechanics approaches are commonly used deter- to the failure may reduce inspection efficiency by targeting
ministically and generally have a hierarchical nature; i.e. the the wrong defect sizes at the wrong time in service, whereas
analyst may progressively reduce the level of conservatism in probabilistic assessment will provide a more efficient result
assumptions by increasing the complexity level of the anal- (Lotsberg et al., 2016). Probabilistic failure assessment of the
ysis and consequently the precision of results until the op- structures is also known as reliability analysis. These two ter-
eration of the structure is found to be fit for service. Other- minologies are often used interchangeably.
wise, the structure will require a repair, a reduction in service Figure 13 shows the schematic presentation of the in-
(for example lowering primary stress), or resistance improve- puts to probabilistic fracture mechanics. Probabilistic fatigue
ments (i.e. reduction in secondary stresses by stress relief and fracture analysis will predict the time-dependent failure
techniques). This type of approach is particularly useful in probability of the structure (Fig. 14). The predicted reliability
the assessment of safety cases where the aim is to demon- will then need to be compared against an appropriate target
strate that the structure is safe. reliability level.
In deterministic analyses, uncertainty in variables is dealt
with by taking the upper bound and lower bound of those
variables – upper-bound values of applied variables such as
https://doi.org/10.5194/wes-6-677-2021 Wind Energ. Sci., 6, 677–699, 2021688 P. Amirafshari et al.: Optimising design and inspection of offshore wind turbine support structures
Table 3. Design variables for damage-tolerant fracture mechanics design.
Design variables Inspection and monitor- NDT methods
ing options (condition-
based maintenance)
Condition monitoring
Design options Structural design options:
– thickness
– redundancy
– material selection
Fabrication specifications:
– weld profile improvements
– post-weld heat treatment
– quality control (i.e. NDT during fabrication, tolerance limits)
Figure 17. Schematics of crack-growth-curve-based risk profile.
4.1 Target reliability levels with this approach compared to applying a predefined
reliability level is that the same probabilistic approach
Target reliability values may be employed to ensure that a re-
is applied in the definition of the inherent reliability of
quired level of safety is achieved. The target reliability mea-
the code-specified structure and the considered struc-
sures depend on the failure consequence as well as on the
ture, reducing the influence of the applied uncertainty
cost and effort to reduce the risk of failure. The consequences
modelling in the determination of the target reliability
of failure can be the risk of human injury and fatality, eco-
level.
nomic consequences, and social impacts. The target relia-
bility should always correspond to a reference period, e.g. 3. The target level for risk assessment is based on failure
annual or service life probability of failure. If the relevant experiences. This method is particularly useful when the
consequence is the risk to human life, annual failure proba- functional reliability of the system is more important
bilities are preferred to ensure a consistent level of tolerable than the reliability of individual components. In the au-
risks at any time. Target reliabilities may be defined in four tomotive industry or electronic-component manufactur-
different ways: ing, component reliability is determined by failure rate
1. The standard developers recommend a reasonable data of real components. The failure rate data are then
value. This method is used for novel structures. used in system reliability calculations (Bertsche, 2008).
2. Reliability is implied by standards. The level of risk is 4. Economic value analysis (cost–benefit analysis) is per-
estimated for a design standard that is considered to be formed. Target reliabilities are chosen to minimise total
satisfactory. This method has been commonly used for expected costs over the service life of the structure. In
standard revisions, particularly where the intention has theory, this would be the preferred method, but it is of-
been to provide a more uniform safety level for differ- ten impractical because of the data requirements for the
ent structural types and loading types. By carrying out a model.
reliability analysis of the structure satisfying a specific
code using a given probabilistic model, the implicit re- Examples of target reliabilities prescribed by codes and stan-
quired level in this code will be obtained, which may dards are listed in Table 4. For further information about
be applied as the target reliability level. The advantage available models for developing target reliability levels for
Wind Energ. Sci., 6, 677–699, 2021 https://doi.org/10.5194/wes-6-677-2021P. Amirafshari et al.: Optimising design and inspection of offshore wind turbine support structures 689
Figure 18. Monopile welded connections (twd, 2019).
Figure 19. The case study structure diagrams and FEA contour plots for the support structure.
novel structures, reference is made to Bhattacharya et al. results of the risk analysis with the established risk criteria to
(2001). determine where additional action is required (ISO-31000,
2018). The overall procedure for risk analysis and risk eval-
uation is a risk assessment (ISO-31000, 2018).
4.2 Risk-based design
A commonly used method of risk evaluation is the so-
The purpose of risk analysis is to comprehend the nature called risk matrix model in which the failure probability is
of risk and its characteristics including, where appropriate, shown on one axis and the consequence of failure on the
the level of risk. Risk analysis involves a detailed consid- other. The failure probability and consequence failure may be
eration of uncertainties, risk sources, consequences, likeli- specified quantitatively, qualitatively, or semi-quantitatively,
hood, events, scenarios, and controls and their effectiveness. depending on the complexity of the model and the availabil-
An event can have multiple causes and consequences and ity of data. Each combination of failure probability and con-
can affect multiple objectives (ISO-31000, 2018). The risk sequence of failure will then be assigned a corresponding risk
remaining after protective measures are taken is called resid- level. It is useful to show these levels according to a specific
ual risk (ISO-14971, 2012). The purpose of risk evaluation is colour-coding convention. One such convention is an adapted
to support decisions. Risk evaluation involves comparing the traffic light convention in which low risk levels are shown in
https://doi.org/10.5194/wes-6-677-2021 Wind Energ. Sci., 6, 677–699, 2021690 P. Amirafshari et al.: Optimising design and inspection of offshore wind turbine support structures
Table 4. Examples of target levels of reliabilities specified by standards.
Scope Limit state function Minimum reliability Maximum probability
index of failure
Eurocode: Basis of Buildings and civil en- Ultimate limit state 3.3 to 4.3 for 50-year 4.83 × 10⁻⁴ to 8.54 ×
structural design (BSI, gineering works (ULS) and 4.2 to 5.2 for an- 10−6 for 50-year and
2005) nual reference period 1.33 × 10⁻⁵ to 9.96 ×
10−8 for annual refer-
ence period
Residential and of- Fatigue limit state 1.5 to 3.8 for 50-year 6.68 × 10⁻² to 7.23 ×
fice buildings, public (FLS) reference period 10−5 for 50-year refer-
buildings where conse- ence period
quences of failure are
medium (e.g. an office
building)
DNV (DNV, 1992) Marine structures 3.09 to 4.75 1.00 × 10⁻³ to 1.02 ×
10−6
IEC 61400-1 Offshore wind ULS and FLS 3.3 5.00 × 10⁻⁴
turbines
DNV-OS-J101 Offshore wind ULS 1.00 × 10⁻⁴
turbines
(unmanned structures)
DNV-OS-J101 Offshore wind ULS 1.00 × 10⁻⁵
turbines
(manned structures)
green, extreme risks in red, and medium risk levels in yel- associated with the corresponding risk levels, as schematised
low. It is also possible to refine this colour coding further, in Fig. 17.
for example, by including light yellow and dark yellow, to
allow for more risk levels. An example risk matrix is shown
in Fig. 15. 5 Case Study 1 – monopile OWT support structure
To assign an appropriate risk level (i.e. colour in the risk
matrix) it is necessary to establish risk acceptance levels. Fatigue design based on a baseline NREL 5 MW offshore
If a system has a risk value above the accepted levels, ac- wind turbine (OWT) supported on a monopile structure
tions should be taken to improve safety through risk reduc- (Fig. 19) is presented here. The framework illustrated in
tion measures. One challenge in this practice is defining ac- Fig. 8 is used to conduct the fracture mechanics assessment.
ceptable safety levels for activities, industries, structures, etc. Table 5 summarises the input parameters used in this study.
Since the acceptance of risk depends upon society percep- Further information about the structure and the finite element
tions, the acceptance criteria do not depend on the risk value analysis can be found in Gentils et al. (2017).
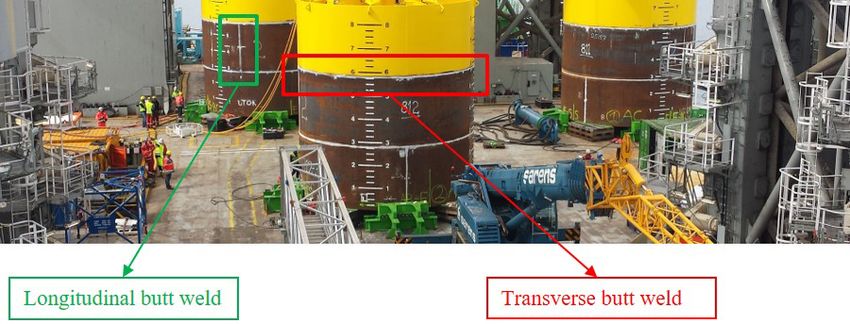
alone (Ayyub et al., 2002). Transverse butt welds (weld line perpendicular to the nor-
Another common risk evaluation method is the ALARP, mal stress) are more prone to fatigue damage than the lon-
which stands for “as low as reasonably practicable”, or gitudinal butt joints (weld line parallel to the normal stress).
ALARA (as low as reasonably achievable) method (HSE, Figure 18 shows these joints in a monopole structure. A fa-
2001). The ALARP basis is that tolerable residual risk is tigue crack growing at the transverse butt weld toe located
reduced as far as reasonably practicable. For a risk to be in the mud-line (Fig. 19) is considered the most critical loca-
ALARP, the cost in reducing the risk further would be tion.
grossly disproportionate to the benefit gained. The basis of Fatigue cracks normally initiate from small toe undercut
the ALARP method is illustrated by the so-called carrot dia- weld defects (Fig. 2); thus, in this study, a semi-spherical
gram in Fig. 16. flaw growing in the heat-affected zone (HAZ) of the joint is
By adopting a risk-based approach in fracture mechanics considered. NDT inspection techniques are used during fab-
for a chosen design parameter the structural design may be rication as part of the quality control scheme. MPI and UT
assessed against the corresponding risk. As an example, the are effective and commonly used methods to detect surface
design stress levels for a particular initial crack size will be breaking and embedded flaws, respectively. Here, the initial
flaw size is conservatively assumed to be equal to 90 % PoD
of the chosen NDT methods (Table 1). The primary fracture
Wind Energ. Sci., 6, 677–699, 2021 https://doi.org/10.5194/wes-6-677-2021P. Amirafshari et al.: Optimising design and inspection of offshore wind turbine support structures 691
Table 5. Inputs for fatigue and fracture mechanics assessment.
Case description
Structure NREL 5 MW OWT
Material properties Young’s modulus 210 MPa (Gentils et al., 2017)
Poisson’s ratio 0.38 (Gentils et al., 2017)
Yield stress (σY ) 355 MPa (Gentils et al., 2017)
Tensile strength 550 MPa (Gentils et al., 2017)
Toughness 200 MPa · m0.5 assumed
Fatigue assumptions Crack growth model Single-slope crack growth
Cyclic stress Equivalent constant-amplitude stress 51.2 MPa
Stress intensity solution A surface flaw in a plate
Paris law constants m = 3.9, C = 3.814 · 10−16 for crack growing in HAZ and in air; m =
3.3, C = 4.387 · 10−14 for crack in HAZ and in with free corrosion (for
da/dN in mm per cycle and 1K in N mm−0.5 ) (Mehmanparast et al.,
2017)
Design cycles in life Nlife = ηa · ηrated · (20 [yr] · 365 [d yr−1 ] · 24 [h d−1 ] · 60 [min h−1 ]), for
this structure 1.253 · 108 (Gentils et al., 2017)
Fracture assumptions FAD BS 7910 Option 1
Primary stress 209 MPa (Gentils et al., 2017)
Secondary stress Weld residual stress = 100 MPa, assumed
Thickness (B) 60 mm (Gentils et al., 2017)
Initial flaw dimensions (a · 2C) (1.5 mm · 5 mm)
stress is taken as caused by ultimate limit state (ULS) de- Table 6. Results for crack growth in HAZ and in Air environment.
sign stress (Fig. 19) corresponding to the parked wind tur-
bine, under the 50-year extreme wind model (EWM) with Assessment results
the 50-year reduced wave height (RWH) and extreme current Critical crack size ac = 45 mm 2Cc = 116 mm
model (ECM), defined as in the Design Load Case (DLC)
Tolerable crack size (assumed) at = 5.2 mm 2Ct = 12 mm
6.1b and 2.1 for IEC (2019) and DNV (2013) standards, re-
Lrt = 0.592 Krt = 0.128
spectively. The crack growth stress is taken as the fatigue
load case which corresponds to an operating state under the
normal turbulence model (NTM) and normal sea state (NSS)
where wave height and cross zero periods are obtained from
the joint probability function of the site, assuming no current; of safety factors (Anderson, 2005). As described earlier, the
it corresponds to DLC 1.2 from the IEC standard (IEC, 2019) chosen tolerable crack size needs to be determined in a region
and is assumed to represent the entire fatigue state (Gentils et of the crack size where the crack growth rate with respect to
al., 2017). Paris law parameters reported by Mehmanparast et time is small to allow for a long time before failure but large
al. (2017) for offshore wind monopile weldments have been enough to be detected by the in-service inspection technique.
adopted. Other key assumptions and inputs for fatigue and Here, a tolerable crack height of 5.2 mm is chosen which, de-
fracture mechanics assessment are given in Table 5. pending on the inspection condition (Fig. 11), gives a 70 %
to 90 % PoD. As shown in Fig. 20, this will provide a good
5.1 Crack growth in air environment margin of safety and at least 6 years before failure (Fig. 21).
Figure 20 shows assessment points from initial crack prop-
Crack growth parameters in the Paris equation for ferritic agation at the start of service life to the final year of service.
steels depend on the cyclic stress ratio and environmental If the service continues beyond the design life (20 years), the
conditions (Amirafshari and Stacey, 2019). In the presence structure is likely to fail in the elastoplastic mode, providing
of effective corrosion protection measures, in-air conditions a reasonable level of plasticity from a safety point of view.
apply (British Standard, 2019). As explained earlier a damage-tolerant design is closely
Fatigue and fracture assessment results for cracks prop- tied to in-service inspection. Here, it is assumed that an MPI
agation in the air environment are given in Table 6. In a is carried out at year 12. When no crack is detected or re-
damage-tolerant design, the tolerable crack sizes need to be paired if detected, the predicted crack size is updated and re-
selected far below critical sizes by considering some level duced back to the initial crack size. This is shown with solid
https://doi.org/10.5194/wes-6-677-2021 Wind Energ. Sci., 6, 677–699, 2021692 P. Amirafshari et al.: Optimising design and inspection of offshore wind turbine support structures Figure 20. Failure assessment diagram (FAD) for crack growth in HAZ and in air environment without inspection. Figure 21. Crack growth curves for propagation in HAZ and in the air environment. lines after year 12 in Fig. 21. The final-year crack size re- tected after inspection. Figure 23 shows the predicted crack mains below the tolerable limits. size compared to inspection with MPI. It is observed that to The weld profile condition may be as-welded or ground keep the crack size below a tolerable size, three inspections flushed depending on fabrication specification and could be are required instead of one inspection using MPI. altered by the design engineer. The effect of such a condition was studied by considering the influence of the weld pro- file on the PoD for the MPI method. MPI can find smaller 5.2 Effect of environment cracks in the welds with ground-flushed crowns (Table 1). As In the event of insufficient corrosion protection, the fatigue shown in Fig. 22, improving the weld joint design by speci- crack growth will be accelerated. The accelerated crack fying the ground flushing requirement reduces the inspection growth rate is reflected in fracture mechanics by changing frequency from twice to once in 20 years of service. the Paris law constants to those observed in the corrosive en- The effect of choice of NDT for in-service inspection was vironment. This is shown in Figs. 24 and 25, where the pre- studied by considering a case were UT is chosen as the in- viously studied defect is assessed under a free-corrosion en- spection method. The detection reliability specified in Ta- vironment instead of the air environment. It is observed that ble 1 is used to determine the crack size that can be left unde- failure is predicted to occur as early as 3.4 years after com- Wind Energ. Sci., 6, 677–699, 2021 https://doi.org/10.5194/wes-6-677-2021
P. Amirafshari et al.: Optimising design and inspection of offshore wind turbine support structures                                693

Figure 22. Effect of weld profile condition on in-service inspection.

Figure 23. Selection of NDT method based on probability of detection and crack size at the time of inspection.

missioning. One strategy could be increased attention to the               Here, the application of probabilistic fracture mechanics
execution of corrosion protection measures before commis-               to such a structure is demonstrated. The assumed inputs are
sioning. Additionally, the joint should be inspected for signs          listed in Table 7.
of corrosion at least every 3 years.                                       Figure 27 shows fatigue and fracture reliability of the
                                                                        structure under three levels of equivalent constant-amplitude
6   Case Study 2 – probabilistic fracture mechanics                     cyclic stress. As a starting point, 21 MPa cyclic stress which
    application to a plate failure                                      corresponds to the extreme stress of 0.62σY is selected. A
                                                                        target reliability level of 1.00 × 10⁻⁴ from Table 4 for off-
Many structural members of offshore structures can toler-               shore wind turbines (unmanned structures) is selected. The
ate cracks even after they penetrate through the wall. These            structure will reach the target tolerable probability of failure
structures may be idealised by plates containing through-               just before year 17, suggesting that the structure should be
thickness cracks (Fig. 26). This can be for example for a less          inspected prior to this time. As it is shown in Fig. 28, such an
critical location of the structure in Case Study 1 with lower           inspection will reduce the failure probability below the target
stress levels.                                                          level for the rest of the intended service life.

https://doi.org/10.5194/wes-6-677-2021                                                          Wind Energ. Sci., 6, 677–699, 2021
694 P. Amirafshari et al.: Optimising design and inspection of offshore wind turbine support structures Figure 24. Failure assessment diagram (FAD) for crack growth in HAZ and with free corrosion. Figure 25. Crack growth curves for propagation in HAZ and with free corrosion. If the aim had been to design the structure according to left by 2 and 3 years, respectively. It is evident that the struc- the safe-life design philosophy, the stress would have needed ture can sustain higher levels of stresses provided that the ap- to be reduced below the current level. This, however, may propriate time window for inspection is determined and also not be an economical option since the current extreme stress other required limit states are not violated. level already possesses a significant safety factor (0.62 · σY ) The effect of an inspection schedule is considered for the and reducing the stress will require bigger cross-sectional di- case of a through-thickness crack under 21 MPa cyclic stress. mensions and, hence, a heavier and more expensive structure. It was shown previously in Fig. 27 that the structure is pre- Integrating in-service inspection options into design can po- dicted to reach the target tolerable probability of failure just tentially result in a more efficient design. before year 17; thus, the inspection should be scheduled prior Furthermore, the design cyclic stress may be increased to this time. Here, a number of inspection options are consid- considering the availability of in-service inspection. Two ered. stress levels are considered here: an upper-bound limit value Any inspection earlier than year 6 appears to have little of 35 MPa corresponding to extreme stress equal to the benefit as the failure probabilities are below 5.0 × 10⁻⁸ , a yield stress and a moderate value of 26 MPa. As depicted in very low probability of failure. The reduction in the proba- Fig. 27, the probability-of-failure curve will be shifted to the bility of failure is on the order of 1, and the structure is likely Wind Energ. Sci., 6, 677–699, 2021 https://doi.org/10.5194/wes-6-677-2021
P. Amirafshari et al.: Optimising design and inspection of offshore wind turbine support structures                                      695

Figure 26. Through-thickness crack geometry diagram.

Table 7. Inputs for probabilistic fatigue and fracture mechanics assessment.

                                                                 Case description
           Case study structure      Offshore topside platform with long-term stress shape parameter of 0.85 and load
                                     cycle rate of 5.063 cycles min−1
                                     Maximum design stress = 0.62 · yield stress
           Material properties       Young’s modulus                       210 MPa constant (Gentils et al., 2017)
                                     Poisson’s ratio                       0.3 constant (Gentils et al., 2017)
                                     Yield stress (σY )                    450 MPa constant (Gentils et al., 2017)
                                     Tensile strength                      560 MPa constant (Gentils et al., 2017)
                                     Toughness                             200 MPa · m0.5 assumed
           Fatigue assumptions       Crack growth model                    Single-slope crack growth
                                     Cyclic stress                         Equivalent constant-amplitude stress 21 MPa
                                     Stress intensity solution             Through-thickness flaw in an infinite plate
                                     Paris law parameters                  BS 7910-recommended values
                                                                                                   cycles
                                     Design cycles in life                 Nlife = load cycle rate( min ) · (20 [yr] · 365 [d yr−1 ] ·
                                                                           24 [h d ] · 60 [min h ]), for this structure 5.322 · 107
                                                                                  −1             −1

           Fracture assumptions      FAD                                   BS 7910 Option 1
                                     Primary stress                        A Weibull distribution with scale parameter 9.47 MPa
                                     Secondary stress                      Weld residual stress = constant 100 MPa, assumed
                                     Thickness (B)                         60 mm (Gentils et al., 2017)
                                     Initial flaw dimensions (2a)          Exponential distribution with a mean value of 2 mm
           Inspection capabilities   In-service surface inspection         Surface inspection for ground welds above the water
                                                                           surface (Fig. 11)

to exceed the target level of reliability again close to the final         bilities. The structural design can significantly benefit from
year of service. Inspection between years 10 and 15 shows                  the inspectability of the structure by considering the damage-
the most effective results by keeping the structure far below              tolerant nature of many offshore structures. Fracture mechan-
the target level throughout and up to the end of service life,             ics is a powerful tool capable of addressing a wide range of
ensuring a considerable level of safety as well as providing               limitations associated with the S–N approach.
further life extension possibilities in the final years of de-                In this work, a framework for the design of offshore struc-
signed service life.                                                       tures based on fracture mechanics was developed and its ap-
                                                                           plications to a monopile wind turbine support structure were
                                                                           demonstrated. Additionally, the probabilistic fracture me-
7   Conclusions
                                                                           chanics approach and its application in optimising in-service
                                                                           NDT inspection for a plated structure under sea wave loading
This paper presented a new approach to the fatigue design
                                                                           was presented.
of offshore wind turbine support structures. Traditionally,
                                                                              It was found that the design of the structure can be en-
the design of offshore renewable structures against fatigue
                                                                           hanced by specifying weld crown improvements which leads
failure has been performed using the so-called S–N curve
                                                                           to better fatigue performance and reduced in-service inspec-
method. This approach, however, suffers from several limita-
tions, such as limited ability to integrate the inspection capa-

https://doi.org/10.5194/wes-6-677-2021                                                                Wind Energ. Sci., 6, 677–699, 2021
696 P. Amirafshari et al.: Optimising design and inspection of offshore wind turbine support structures Figure 27. Fatigue reliability (FM) of a welded joint in an offshore structure for three different constant-amplitude stresses. Figure 28. Crack growth curves of case study through thickness in a plate considering different first inspection times. tion. The MPI will allow for thrice the inspection interval window than UT. The probabilistic model was shown to have the capabil- ity to account for uncertainty in design and inspection vari- ables including NDT reliability. It also provides a likelihood of failure which can be used to calculate the risk associated with the chosen inspection time and in turn for optimising inspection using, for example, a cost–benefit analysis. Additionally, the proposed optimisation model can be used for any application of structural optimisation of OWT sup- port structures. Wind Energ. Sci., 6, 677–699, 2021 https://doi.org/10.5194/wes-6-677-2021
P. Amirafshari et al.: Optimising design and inspection of offshore wind turbine support structures                      697

Appendix A: Nomenclature                                            Abbreviation    Explanation
                                                                    DLC             Design load case
 Symbol             Explanation                                     ECM             Extreme current model
 a                  Flaw size                                       EU              European Union
 a0                 Initial flaw size                               EWM             Extreme wind model
 af                 Failure flaw size                               FAD             Failure assessment diagram
 acr                Critical flaw size                              FAL             Failure assessment line
 at                 Tolerable flaw size                             FLS             Fatigue limit state
 C                  Material constant in the Paris–Erdogan          FM              Fracture mechanics
                    equation                                        HAZ             Heat-affected zone
 2C                 Crack length                                    LCOE            Levelised cost of electricity
 I1                 First inspection                                LEFM            Linear elastic fracture mechanics
 J                  J integral                                      MPI             Magnetic particle inspection
 Je                 Elastic component of J integral                 NDT             Non-destructive testing
 1K                 Stress intensity factor                         NECPs           National energy and climate plans
 1Kth               Threshold stress intensity factor               NSS             Normal sea state
 Kr                 The ratio of applied stress intensity factor    NTM             Normal turbulence model
                    to the fracture toughness of the component      OWT             Offshore wind turbine
                    material in the failure assessment diagram      PoD             Probability of detection
 Kelastic plastic   Elastic plastic stress intensity factor         PoND            Probability of non-detection
 Kelastic           Elastic stress intensity factor                 QC              Quality control
 Kmax               Maximum stress intensity factor                 RWH             Reduced wave height
 Kmin               Minimum stress intensity factor                 SLS             Serviceability limit state
 Kmat               Fracture toughness                              S–N             Stress–number of cycles to failure
 Kcritical          Critical fracture toughness value               ULS             Ultimate limit state
 Lr                 The ratio of the applied load to the load       UT              Ultrasonic testing
                    required to cause plastic collapse of the
                    flawed section
 m                  Paris equation slope
 Ni                 Cycle increment
 PF                 Probability of a fatigue crack failure
 PSYS               Probability of a collapse given that there is
                    a fatigue failure in the structure
 Pt                 Target probability of failure
 p1σ (1σ )          Probability density function of stress range
                    1σ
 Y                  Geometry function
 da
 dN                 Rate of crack growth to load cycles
 σ                  Stress at flaw
 1σeq               Equivalent constant-amplitude stress range
 β                  Stress contribution factor
 σflow              Flow stress
 σY                 Yield stress
 σU                 Ultimate tensile stress
 εref               The true strain obtained from the uniaxial
                    tensile stress–strain curve

https://doi.org/10.5194/wes-6-677-2021                                                Wind Energ. Sci., 6, 677–699, 2021
You can also read