City health check
How design can save lives and money
←
→
Page content transcription
If your browser does not render page correctly, please read the page content below

City health check How design can save lives and money
2
Contents

Executive summary                                                                2

Introduction: Designs on health                                                  6

Case study 1: How can good design create active places?                          8

The cost of unhealthy places                                                    10

Role of the built environment                                                   12

Case study 2: How can good design create active places?                         14

The City health check                                                           16

Public health preferences: Survey results                                       28

Case study 3: How can good design create active places?                         30

City breakdown: How to design fitter cities                                     32

Recommendations                                                                 42

Appendix: methodology and city data                                             45

Written and researched by:
Rebecca Roberts-Hughes

Edited by:
Anna Scott-Marshall

With thanks to the Sounding Board:
David Buck, The King’s Fund
Steve Cole, Neighbourhoods Green, National Housing Federation
Stephen Hodder, RIBA President
Adrian Judd, PRP Architects
Dr Jenna Panter, Centre of Excellence for Diet and Activity Research (CEDAR),
University of Cambridge

Copyright: Royal Institute of British Architects (RIBA) December 2013
Executive summary

                                                                                   75%
Do our cities support healthy, active choices on a daily basis?
Does the architecture and urban design of our cities impact
on public health? In this health check we compare three
serious health problems in the nine most populated cities                    If
in England. These health problems relate to our urban
environment and how people behave in cities, specifically
                                                                  of people failing to exercise
the amount of exercise they take.                                 enough across the county did meet
                                                                  recommended levels of walking,
We ask residents in each major English city what would

                                                                  £675
encourage them to walk more. We then make practical
recommendations to local authorities and developers about
actions they can take to create healthy places. Case studies
illustrate how urban and architectural design can create
healthy, walkable environments in urban areas.                                                         million
                                                                  could be saved each year.
Our City health check uncovers two clear lessons:

First, there is a clear link between
land use and public health in cities.
Second, people say it is the quality,
not quantity, of streets and parks that
will encourage them to walk more.

                                                                    The healthiest local authorities in our major cities
                                                                        have almost half the housing density and a
                                                                   fifth more green space than the least healthy ones.

2
The report reveals that:

                 One in eleven                75% of people in
                 early deaths
                 could be                     our major cities
                 avoided1 and                 who do not meet
                 £900 million
                 could be saved
                                              recommended
                 every year2 if               levels of exercise
                 everyone met                 say they could
                 recommended
                 levels of                    be encouraged
                 exercise, such               to walk more
                 as walking for
                 20 minutes                   each week.
                 5 days a week.

                 Streets and parks designed
                 to be safer and more
                 attractive were the most
                 common changes people
                 reported would encourage
                 them to walk more.

                                                                   3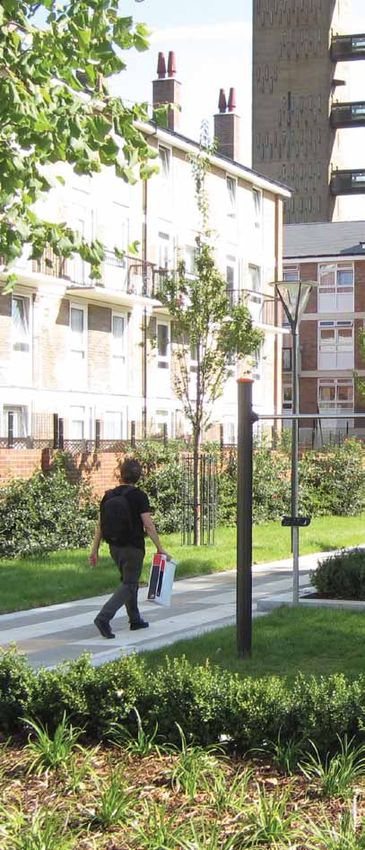
Executive summary

Safety and aesthetics are more important to residents
than more direct routes to destinations or an increase in the
number of streets and parks. If we want people to walk
more, it is a matter of the quality, not the quantity, of routes.   Recommended actions for
We believe there are six actions which would make a real
difference to safer and more attractive cities, and help to
                                                                    local authorities:
save the NHS £675 million each year. Local and central
government, developers and architects need to work together         1. Local authorities that are comprised of less than
to deliver these six actions for healthier cities.                  50% green space and/or have a housing density
                                                                    of over 5% should produce a Healthy Infrastructure
                                                                    Action Plan as part of their Local Plan in conjunction
If we design places people want to use                              with their Health and Wellbeing Boards. They
we can, quite literally, lay the foundations                        should outline their strategy for making streets and
for regular physical activity and thereby                           parks safer and more attractive and outline the
                                                                    principles they expect new developments to meet
reduce obesity, related health problems, and                        in order to gain planning permission.
their public cost.
                                                                    2. Local authorities that are comprised of less than
                                                                    50% green space and/or have a housing density
                                                                    of over 5% should redirect a proportion of their
                                                                    Community Investment Levy to fund their
                                                                    Healthy Infrastructure Action Plan.

4
Recommended actions for                                     Recommended actions for
central government:                                         built environment developers:

3. Guidance as to how planners and developers               5. Developers and architects should commit to
can aid healthy lifestyles should be embedded within        Pledges 3 and 5 of the Responsibility Deal Physical
National Planning Practice Guidance.                        Activity Network.

4. 7 of the 10 city local authorities with the worst        6. Developers should use the Design and Access
health performance have not received the higher             Statement to prove how their new development will
growth rate of ring fenced grants to spend on               benefit public health through their design of the
providing public health services. These local authorities   public realm and its links to existing infrastructure.
should be prioritised in the next round of grants and
should use the increase to invest in actions specified
in their Health Infrastructure Investment Plan.

                                                                                                                     5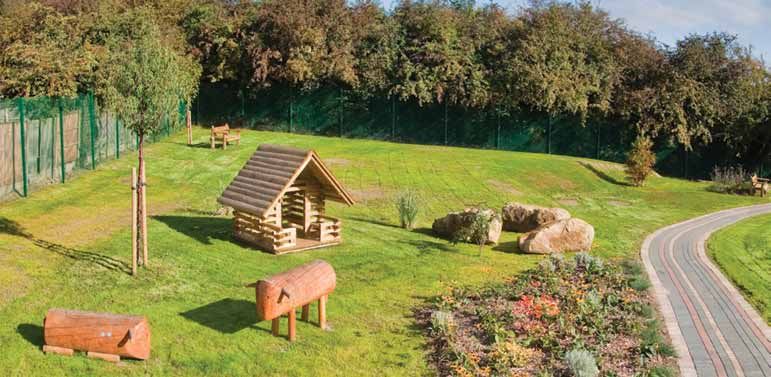
Introduction:
designs on health

England’s cities are home to over half the country’s              To achieve this, active travel needs to be integrated into
population.3 The way our cities are planned has a major           our daily lives and the physical design of our cities and
impact on our transport, food and exercise choices. Whether       communities can either support or inhibit walking and cycling.
we walk to the shops or whether children walk to school is        By designing places people want to use, we can create the
often influenced by the safety, appearance and quality of our     conditions for regular physical activity and thereby reduce
streets, pathways and green spaces.                               obesity and related health problems, like diabetes. There are
                                                                  benefits beyond health too: active travel reduces noise, air
With an expanding ageing population who tend not be as            pollution and carbon dioxide emissions9 and good parks and
physically active as they should and increasing levels of         green infrastructure can help create better quality places
obesity amongst the wider population the focus on increasing      and higher value properties.10
levels of physical activity to improve our health and wellbeing
has never been more important.4 However, recent research          The World Health Organisation (WHO) defines the role of the
by the Department for Transport has found that walking trips      built environment in cities as “A healthy city offers a physical
have fallen by 27% over the last 15 years.5 The Department        and built environment that supports health, recreation and
has also stated that if short car journeys were instead taken     well-being, safety, social interaction, easy mobility, a sense of
on foot or by bike, most motorists would achieve recommended      pride and cultural identity and that is accessible to the needs
levels of physical activity.6 Even small increases in walking     of all its citizens.”11
and cycling could benefit our health,7 and people who report
walking or cycling to work are healthier and less likely to       Local authorities have, as of April 2013, a responsibility to
be overweight than those who do not.8                             join local health policy up with other strategies such as housing,
                                                                  transport infrastructure and planning.12 This affords an
                                                                  opportunity for health professionals and urban designers to
                                                                  work together. This report examines how architects and
                                                                  urban designers can play a role in promoting better health.

6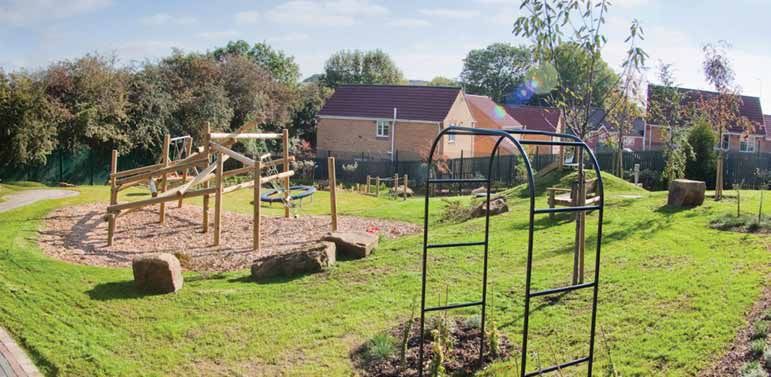
There is a wealth of research on health and cities and we
 already know a lot about the interaction between public health
 and the way our cities are built. We know:
• That green space is important for health13
• That the quality of green space is important14
• That health facilities need to be run in buildings that
   are situated in the community15
• That planning decisions have complex impacts on health16

 This report does not cover the same ground, but instead
 shows the role that design can play in creating healthier cities.
 We focus on the shared urban areas which people use on a
 daily basis, and reveal how physically healthy activities such
 as walking can be encouraged through the design of those
 areas. Specifically, we focus on how architecture can encourage
 regular walking and the impact it could have on the health
 of our cities.

         Recent research by
         the Department for
         Transport has found
         that walking trips
         have fallen by 27%
         over the last 15 years.5

                                                                     7
How can good design
create active places?
Case study 1
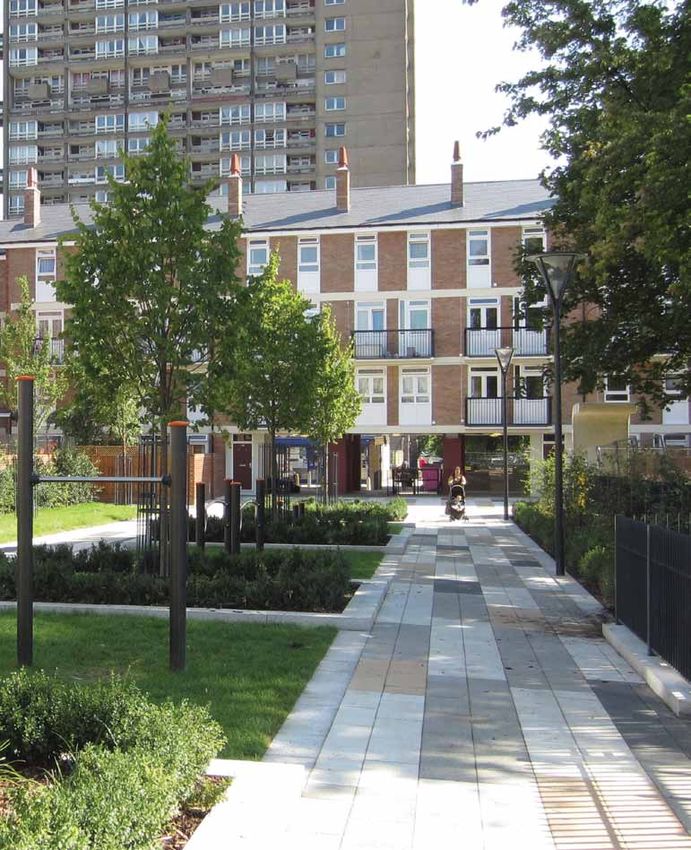
Brownfield Estate, London
Developer:
Poplar HARCAR,
Architect and urban designer:
PRP
Local authority:
London Borough of Tower Hamlets
This urban regeneration project was treated as an opportunity
to rethink a neighbourhood and transform a run-down and
poorly-connected estate.
Revitalising spaces and routes
The more used and most useful routes and destinations
were identified and revitalised, and new routes were created
where they were needed. New trees were planted to create
a green grid along these routes throughout the estate. The
underused spaces on the estate were reactivated through
a redesign that created functional public spaces, to give
people a reason for using them. For example, places for play
were identified throughout the estate and there is now a
new play space on Adderley Street and a refurbished play
space along Willis Street.
Visual appeal
The parking on the estate was rationalised to help make
streets more attractive and easier for pedestrians to navigate.
The public and private spaces were better defined to give
the estate more structure and create the right balance between
privacy and community. Street trees, boundary planting and
new spaces provide focus and new public art brings colour
and identity to the area. A generous budget of £7 million
has been allocated for all phases within Brownfield.
Copyright to PRP Architects
89
The cost of unhealthy places

The Department of Health recommends that adults should             The estimated cost of health problems relating to obesity
undertake 150 minutes of physical activity a week.17 Meeting       and lack of exercise are significant. In 2004 the Department
recommended levels of physical activity can reduce the             of Health estimated that physical inactivity cost the NHS
risk of heart disease, stroke and type 2 diabetes by up to         £8.2 billion a year; heart disease is estimated to cost the
50%,17 avoid one in eleven early deaths18 and save the NHS         NHS £6.4 billion per year with £1.6 billion attributed to
£900 million every year in the UK.19 150 minutes a week is         physical inactivity.25 Nuffield Health research found that if
30 minutes five times a week, and every 10 minutes of exercise     each obese person were to complete about five days of
counts and it is recommended on a daily basis.20                   moderate activity a week, there would be a 7% decrease in the
                                                                   likelihood of being obese; this reduction in obesity would
There are health benefits to increasing moderate exercise and      imply a cost saving to the NHS of £360 million per annum.26
risks if people do not exercise enough. The World Health
Organisation estimates that in Europe physical inactivity causes   In 2010 Professor Sir Michael Marmot’s review reported that
an estimated 600,000 deaths per year and leads to a loss           “Action taken to reduce health inequalities will benefit society
of 5.3 million years of healthy life expectancy per year.21 9%     in many ways. It will have economic benefits in reducing losses
of deaths from Chronic Heart Disease in the UK could               from illness associated with health inequalities. These
be avoided if people who are currently sedentary or conduct        currently account for productivity losses, reduced tax revenue,
a low level of physical activity increased their activity to a     higher welfare payments and increased treatment costs.”27
moderate level.22                                                  There are therefore significant economic and social benefits
                                                                   to increasing the amount of physical exercise we do.
Lack of physical activity is one of the causes of obesity. Over
two-thirds of men and over half of women are overweight            The choice to walk and cycle is strongly influenced by urban
or obese, which increases the risk health problems such as         settings and transport policy, and planners have a crucial
Type 2 diabetes and cardiovascular disease. There were             role in ensuring residents have cycling and walking options.28
over 5,000 NHS hospital admissions with a primary diagnosis        But it is not just how walkways are planned that makes a
of obesity in 2007/08, almost seven times greater than             difference; their design can also encourage people to walk
the number ten years earlier.23 Obesity on average reduces         more often.
life expectancy by six to seven years.24

10
The Department of Health recommends
that adults should undertake
150
minutes
of physical activity a week.17
Meeting recommended levels of physical activity
can reduce the risk of heart disease,
stroke and type 2 diabetes by
18
Policy Context: up to 50% avoid
planning for public health
Health and Social Care Act 2012
1 in 11
The Act gives upper-tier and unitary local early deaths21 and save the NHS
authorities a duty to improve the health of local
people, embedding public health in local
government. Local health policy now has to be
£900 million
joined up with a range of other strategies, such every year in the UK.19
as housing, planning and the environment. Health In Europe physical inactivity causes an estimated
and Wellbeing Boards in local authorities are
tasked with joining up health and wellbeing
strategies at a local level, and Clinical
Commissioning Groups were empowered to
600,000
lead the local healthcare system. deaths per year
and leads to a loss of
The Public Health Outcomes Framework
for England, 2013-2016
The Framework provides the overarching vision
5.3 million
for public health, the outcomes government years of healthy life expectancy per year.21
wants to achieve and the indicators to measure
public health.
9%
National Planning Policy Framework of deaths from CHD in the UK
and guidance could be avoided if people who are currently
The National Planning Policy Framework (NPPF) sedentary or have a light level of physical activity
section on design demands that “Good design increased their activity to a moderate level.22
is a key aspect of sustainable development,
is indivisible from good planning, and should
contribute positively to making places better
for people” (Paragraph 51).
Over 2/3 of men and over 1/2
of women are overweight or obese, which increases
the risk health problems such as Type 2 diabetes
and cardiovascular disease.23
There were over
5,000
NHS hospital admissions with a primary diagnosis of
obesity in 2007/08, almost seven times greater
than the number ten years earlier.23
Obesity on average reduces life expectancy by
24
6 to 7 years.
11Role of the built environment The built environment should support healthy choices, The quality and safety of the built environment can like walking rather than driving. The Department of Transport influence public perceptions of an area and whether people suggests that if short car journeys were instead taken on report exercising there. Accessibility and quality have been foot or by bike, these trips ‘would enable most motorists to found to be important in the use of green space.35 The Foresight achieve recommended levels of physical activity.’29 The report ‘Tackling Obesity’ found evidence of a relationship distance between shops, workplaces and schools provide between the perceived and actual safety, greenery, aesthetics opportunities for walking and these routes need to be and upkeep of neighbourhoods and physical activity.36 For connected30 by pedestrian-friendly streets.31 Whilst it is difficult play spaces to be used by children, the safety,36 functionality for research to prove over time that a specific intervention and accessibility37 of the recreational area is important to directly causes a change in public behaviour, there are studies parents, as well as their perceived quality38 of the areas. which support the principle that the built environment can encourage exercise. Research has found an association between the number of parks and sports grounds in an area and increased levels of cycling and walking,32 and meeting recommended levels for walking has been associated with access to a park or green space.33 A study in 2005 found that people with very good access to large, attractive public open spaces were 50% more likely to achieve high levels of walking.34 12
Cabe found that in ethnically diverse urban areas, the quality   Natural England recommends that every household should
and safety of green spaces have an impact on how much            live within 300 metres of two hectares of natural green space,
they are used and how happy members of the local community       which is about the size of two football pitches.41 But urban
feel. They found that, amongst other things, “Poor design        environments that encourage exercise are not simply about
such as high perimeter walls blocking views in and out, heavy    providing green spaces – the type of space, where it is, the
vegetation and lack of lighting made a place feel unsafe,        scale of it and how it looks and feels all have a role in whether
as well as inadequate maintenance and management.”39 The         people use it. A recent study of over 3,400 British adults
Fitter for Walking programme by Living Streets used a            across three locations found that people would drive to green
combination of street improvements led by the local authority,   spaces for recreational walking, which may not be as
community-led clean-ups and promotional activities to improve    advantageous as walking regularly to local green spaces, or
streets and their use. In Weddell Wynd in Wolverhampton,         walking more briskly rather than taking a recreational stroll.42
for example, changes included improving walkways, replacing
a high curb with flat and more accessible tarmac, resident-      Not all cities or areas within them have equal access to green
led bulb planting and installing bins and benches along a        space, so there is a role for architects and urban designers
route.40 A 25% change in levels of walking was found across      in mitigating the impact of a lack of green space and creating
the five projects evaluated.                                     environments to support walking. Walking routes can link
                                                                 to what green space there is, or be more attractive in and of
                                                                 themselves to encourage walking as a transport choice.

There is a role for architects and urban
designers in mitigating the impact
of a lack of green space and creating
environments to support walking.

                                                                                                                                13
How can good design
create active places?
Case study 2 Places for People manage around 80 homes in this
neighbourhood in the former mining town of Huthwaite in
north Nottinghamshire. With funding from the Big Lottery
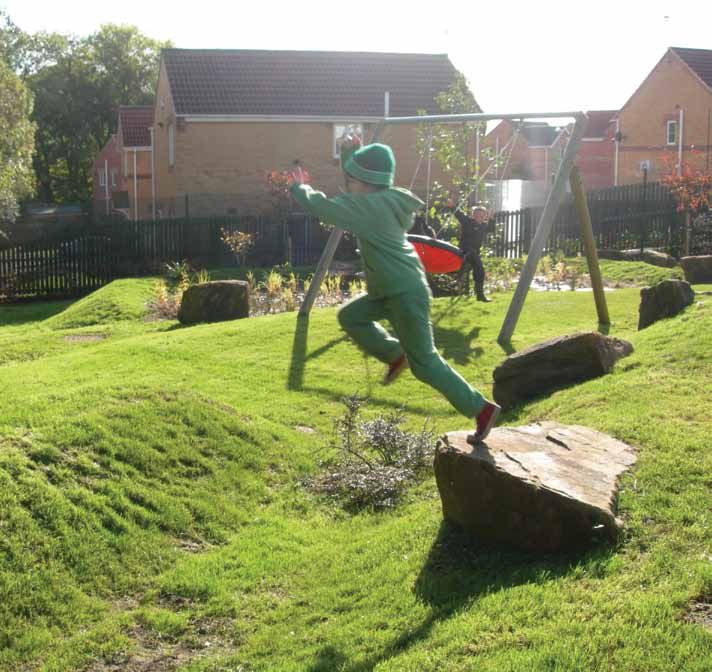
High Hazels, Huthwaite, Nottinghamshire Fund’s Changing Spaces Programme they sought to use the
transformation of a local green space into a new community
facility as a catalyst for wider social change.
Developer:
Places for People Play spaces
Through community engagement exercises, residents
Landscape architect: identified the priorities for their neighbourhood as facilities
Groundwork Creswell, Ashfield & Mansfield for young people and a community centre. A disused field
was identified for development and was transformed through
Local authority: new landscaping to provide a natural children’s play area
Ashfield District Council with play equipment, a play water fountain and wetland area.
The variety of safe play equipment attracts children and
their parents for healthy play.
Character and context
The new park also includes sensory planting and a meeting
place for parents. Pathways are decorated with bricks designed
by residents through an arts project, so that pathways are
more visible, attractive and are intimately linked to the local
community. An underused green space has been transformed
into an inviting and walkable community facility. Some of
the volunteers who helped transform the space have gone
on to set up a community food growing club utilising under
used gardens to grow fruit and vegetables. A range of regular
events and activities take place in the park which encourages
positive use of the space.
Copyright to David Baird
1415
The City health check

Local authorities have taken on new responsibilities for public
health. They have to make decisions that will improve life
expectancy and reduce health inequalities.43 One way identified
by the government to improve health outcomes is for
local authorities to ensure a strategy for health is integrated
                                                                       Our analysis finds
                                                                       a clear correlation
with their strategies for housing and planning. But is this
evidence clear, will focusing on housing and planning really
improve health outcomes and make a significant difference
to cities?
                                                                       between the least
To understand whether the design and planning of cities
is linked to public health outcomes we compared publicly
available data on health indicators for different local authorities.
                                                                       healthy local
                                                                       authority areas in
We looked at the availability of green space and housing
density and examined how that relates to health outcomes.

We looked at local authorities in the eight core cities44 and
the capital, London, together these are the nine cities with the       cities, and the
highest populations in England. We looked at the most
and least healthy local authorities across all these cities, and
compared the amount of green space in that area. We also
                                                                       amount of green
                                                                       space and housing
compared the percentage of land occupied by housing.

Our analysis finds a clear correlation between the least
healthy local authority areas in cities, and the amount of
green space and housing in those areas.                                in those areas.
To assess health outcomes we looked at life expectancy,
diabetes, obesity in children and physical activity. We also
examine the impact of deprivation.

16
Newcastle upon Tyne
Population 829,300
Gateshead MCD
Newcastle upon Tyne MCD
North Tyneside MCD
South Tyneside MCD
Leeds
Population 751,500
Leeds MCD
Manchester Sheffield
Population 1,876,200 Population 810,000
Bury MCD Rotherham MCD
Manchester MCD Sheffield MCD
Oldham MCD
Salford MCD Nottingham
Stockport MCD Population 640,900
Tameside MCD Nottingham UA
Trafford MCD
Liverpool
Population 787,600
Knowsley MCD
Liverpool MCD
St Helens MCD
Birmingham
Population 2,419,500
Birmingham MCD
Dudley MCD London
Sandwell MCD Population 9,480,600
Solihull MCD
Walsall MCD Barking & Dagenham LB Hounslow LB
Wolverhampton MCD Barnet LB Islington LB
Bexley LB Kensington & Chelsea LB
Bristol Brent LB Kingston upon Thames LB
Population 691,000 Bromley LB Lambeth LB
Camden LB Lewisham LB
Bristol UA Croydon LB Merton LB
South Gloucestershire UA Ealing LB Newham LB
Enfield LB Redbridge LB
Greenwich LB Richmond upon Thames LB
Hackney LB Southwark LB
Hammersmith & Fulham LB Sutton LB
Haringey LB Tower Hamlets LB
Harrow LB Waltham Forest LB
Havering LB Wandsworth LB
Hillingdon LB City of Westminster LB
17The City health check
In England the average life expectancy for men is 78.6 years Across England, 11.2% of adults report levels of exercise that
and for women it is 82.6 years. In seven out of the nine meet the recommended minimum. In three out of the nine
core cities for men and in five out of nine cities for women, cities (1 in 3) the percentage of physically active adults was
life expectancy was lower than the national average. In the lower than the national average. In all other cities the
remaining cities life expectancy was about the same (within percentage was roughly the same (within 1% either way)
one year) as the national average; in two of these life or better than the national average.46
expectancy was marginally better. 45
When comparing the best and worst performing local
authorities across all nine cities. The total percentage of green
space in the five worst performing local authorities outside
London is 51.2%, and the percentage of land occupied by
housing is 6.1%. The five best performing local authorities
outside London are 73.2% green space and only 3% housing.
Table A: Life expectancy
Male life expectancy Female life expectancy
Longest Longest
1. Bristol 79.05 1. London 83.3
2. London 79.0 2. Bristol 83.2
3. Leeds 77.9 3. Leeds 82.2
4. Sheffield 77.6 4. Birmingham 81.9
5. Birmingham 77.4 5. Sheffield 81.4
6. Newcastle 76.9 6. Manchester and
upon Tyne Newcastle
upon Tyne
7. Manchester 76.5 – Joint place 81.0
8. Liverpool 75.8 7. Nottingham 80.7
9. Nottingham 75.7 8. Liverpool 80.1
Shortest Shortest
The areas in our cities in which the fewest people
exercise have twice the housing density and a
fifth (20%) less green space than the most areas
with the most active population.
18Land use in the best and worst performing
(highest and lowest levels of physical
activity) local authorities outside London.
Healthiest (highest levels of activity) Least healthy (lowest levels of activity)
73.2% green space 51.9% green space
3% housing 6.1% housing
23.8% other 42% other
Table B: Levels of physical activity in adults
Least active Most active
Ranking 9 8,7 6 5 4 3 2 1
Physically active adults Birmingham London Liverpool Manchester Bristol Nottingham Sheffield Leeds
Newcastle
Joint place
Participation in moderate 8.9 9.9 10.4 10.5 10.6 10.9 11.05 11.1
exercise (%)
19The City health check
Land use in the best and worst performing Diabetes in adults
Across England 5.5% of adults are registered diabetic
(highest and lowest levels of diabetes) although Diabetes UK estimates that 850,000 people have
local authorities outside London. diabetes but have not been diagnosed.47 Cities within 0.1
of this figure were deemed to be the same as the national
average. In four out of nine cities the percentage of diabetic
Healthiest (lowest levels of diabetes) adults was higher than the national average. In all other
68.7% green space cities the percentage was roughly the same (within 0.1) as
the national average.
3.6% housing
27.7% other The total percentage of green space in the five local
authorities outside London with the highest rates of adult
diabetes is 43.5%, and the percentage of land occupied
by housing is 7.1%. The five local authorities outside London
with the lowest rates of adult diabetes are 68.7% green
space and only 3.6% housing.
Comparing the
prevalence of adults
with diabetes, the least
healthy areas in our cities
Least healthy (highest levels of diabetes) have twice the housing
43.5% green space density and a quarter
7.1% housing
50.6% other less green space than the
most healthy areas.
20Table C: Levels of adults with diabetes
Ranking
highest number of adults Prevalence (%) of
with diabetes adults with diabetes
Adults with diabetes
Birmingham 9 6.7
Liverpool 8 6.1
Sheffield 7 5.9
Newcastle upon Tyne 6 5.8
Manchester 5 5.6
London 4 5.4
Leeds and Nottingham 3,2 4.9
Joint place 4.9
Bristol 1 4.7
Lowest number of people
with diabetes
21The City health check
Land use in the best and worst performing Obesity in children
Across England 19% of children are obese. In five out of the
(lowest and highest levels of obesity) local nine cities the percentage of obese children was higher than
authorities outside London. the national average. In two cities the percentage was roughly
the same as the national average (1% either way) and in
one city the proportion of children who were obese was lower
Healthiest (lowest levels of obesity) than the national average.
71.4% green space
The total percentage of green space in the five local
3.1% housing authorities outside London with the highest rates of childhood
25.5% other obesity is 44.7%, and the percentage of land occupied by
housing is 6.8%. The five local authorities outside London with
the lowest rates of childhood obesity are 71.4% green space
and only 3.1% housing.
Comparing the prevalence of obese children, the least
healthy areas in our cities have twice the housing density and
nearly a third less green space than the most healthy areas.
Policy Context:
Obesity
Government policy Healthy Lives, Healthy People:
A call to action on obesity in England (October 2011)
calls for local government to develop comprehensive
strategies to tackle obesity including “synergies with
sustainable transport plans; application of planning
Least healthy (highest levels of obesity) rules to benefit healthier lifestyles; use of green
44.7% green space spaces and other opportunities for physical activity
6.8% housing and sport”. 48
48.5% other The Government has committed to the Healthy
Places Planning Resource, which help local authorities
identify regulatory options for promoting health,
for example through supporting green infrastructure
(regulating it through green space development
control) or promoting active travel (regulating it through
local byelaws and car-free developments).49
Ageing population
Government policy Living Well for Longer: A Call
to action to reduce avoidable premature mortality
(March 2013) announced a ring-fenced budget
of £5.45 billion over two years for local authorities to
reduce preventable early death The NHS is to reduce
early mortality focused on health care interventions,
and local health and wellbeing boards are tasked with
looking at local priorities to strategically improve
the current and future health of residents.
22Responsibility deal
The Public Health Responsibility Deal encourages 4. We will increase physical activity in the workplace,
organisations to support public health through for example through modifying the environment,
their commercial and community activities. Physical promoting workplace champions and removing
Activity Pledges include: barriers to physical activity during the working day.
1.
We will use our local presence to get more children 5. We will tackle the barriers to participation in
and adults more active, more often including physical activity faced by some of the most inactive
engaging communities in planning and delivery. groups in society.
2. We will contribute to the communication and Organisations which sign up to this pledge must submit
promotion of the Chief Medical Officers’ revised a delivery plan, setting out how they intend to meet
physical activity guidelines. each of the pledges.
3. We will promote and support more active
travel (walking and cycling). We will set measurable
targets for this health enhancing behaviour.
Table D: Levels of obesity amongst children
Most obese
Least obese
Ranking 9 8 7 6 5 4 3 2 1
Obese children Liverpool Newcastle Nottingham Birmingham London Sheffield Leeds Manchester Bristol
(%) of obese children 22.8 22.6 22.2 22 21.9 20.9 19.9 19.6 17.3
23The City health check
Total land area (sqm)
Green space and density
Each of the three health indicators (physical activity, diabetes Best performing local authorities
and childhood obesity) seem to show that the areas that 2,369,908,400
perform most poorly tend to have less green space and a
higher housing density. Grouping the indicators together
we find that the density of housing is almost double in local
authorities that perform poorly and have the highest levels
of health problems. They also have a fifth less green space Worst
between them. This shows a prominent correlation – a performing
dense urban environment lacking green space is home to local authorities
a population that exercises less, and has higher levels of 1,220,521,000
obesity and diabetes.
Table E: Land use in the best and worst The land area occupied by the healthiest local authorities
performing local authorities outside London is nearly double that of the least healthy ones.
% occupied by housing % occupied by green space
Worst performing local authorities 7% Best performing local authorities 67%
Worst performing local
authorities
48%
Best performing
local authorities
4%
Healthy areas have a lower housing The most healthy areas have 20% more green space
density (almost half). (one fifth) than the least healthy areas.
This tells us is that in dense urban environments, the public
realm is important and needs to work to ensure healthy lifestyle
choices – such as walking to local destinations – is an attractive
and commonplace option.
24Table F: Levels of deprivation
Deprivation
Professor Sir Michael Marmot’s review reported that City City average Ranking (least
“In England, people living in the poorest neighbourhoods, deprived = 1)
will, on average, die seven years earlier than people living
in the richest neighbourhoods”.
England 19.8
Given deprivation has such a clear link to poor health outcomes
how does that link to our findings on green space. Are those
areas that have the least amount of green space and higher Bristol 12.9 1
housing density the ones that are the most deprived? Using
data from the Index of Multiple Deprivation we can see
deprivation levels across the nine cities (Table F).
London 26.1 2
But the relationship between wealth, health and place is
complex. The Scottish Government found that “better health is
related to green space regardless of socio-economic status.54”
Leeds 28.6 3
Looking at our analysis of the three health indicators and
how they relate to green space and then correlating with
deprivation we can see a strong link. Manchester 32.8 4
Sheffield 33.8 5
‘Better health is Newcastle 34.9 6
related to green space
regardless of socio- Birmingham 41.8 7
economic status.’ 54
Nottingham 51.5 8
Liverpool 52.8 9
25The City health check
Three of the five local authorities outside London with
highest childhood obesity are also in the five most deprived
local authorities. Of the five with the lowest rates of childhood Policy Context: equality and health
obesity, four are in the five least deprived local authorities.
However, health is included in the formation of measures of Marmot Review: Fair Society, Healthy Lives
deprivation, which goes some way to explaining the strong
correlation. With adult diabetes the link was less pronounced; Fair Society, Healthy Lives stated that “the more
two of the five most deprived local authorities outside favoured people are, socially and economically, the
London also featured in the five highest areas for diabetes in better their health” and concluded that six policy
adults, and one of the least deprived local authorities had objectives could reduce health inequalities including:
one of the five lowest rates of diabetes. This suggests that E. Create and develop healthy and sustainable
deprivation has a higher impact on children than adult places and communities
health, and signals the importance of investing in deprived
areas now to prevent an even greater health and obesity The following policy recommendations from the
epidemic in our future.53 Marmot review are addressed through urban and
architectural design.
This City health check reveals the complexity of health
indicators. A city might have broadly average life expectancy Policy recommendations
and rates of diabetes but have more obese children than 1. Prioritise policies and interventions that reduce
the national average: this is the case for London for example. both health inequalities and mitigate climate
The health check also revealed that at local authority level, change, by:
the areas that performed worst for child obesity, and diabetes • Improving active travel across the social gradient
and physical activity in adults, had a fifth less public green • Improving the availability of good quality open
space than the best performing areas. Deprivation clearly plays and green spaces across the social gradient
a role here too; it could be that areas with less green space • Improving the food environment in local areas
are less affluent and home to more deprived households and across the social gradient
wealthier households could afford to live in higher quality areas. • Improving energy efficiency of housing across
the social gradient.
This report looks at how the design of our cities can help to
2. Fully integrate the planning, transport, housing,
ease – rather than exacerbate – the effects deprivation can
environmental and health systems to address
have on health. 54
the social determinants of health in each locality.
3. Support locally developed and evidence based
community regeneration programmes that:
• Remove barriers to community participation
and action
• Reduce social isolation.
Whilst cities will always have richer and poorer
demographic areas, the quality of public spaces
should enable everyone to make healthy choices,
such as taking short journeys on foot.
26Funding health equality
How does funding compare across England’s cities? Across the best performing local
authorities, the funding per head is generally lower. However, 7 of the 10 worst performing
local authorities did not receive a higher than average increase in funding, whereas
8 of the 11 best performing local authorities did. In this report we make recommendations
for prioritising funding and we suggest how each city should invest in a better built
environment to encourage healthy behaviour. 57
Funding
Table G: Worst performing local authorities Table H: Best performing local authorities
Local authority Cumulative 2013-14 grant Local authority Cumulative 2013-14 grant
(poorest city growth in funding per head (best city health) growth in funding per head
health) for public health for public health
Birmingham 5.7% 73 Bristol 17.3% 66
Dudley 5.7% 60 Bury 15.7% 51
Gateshead 5.7% 78 Leeds 21.0% 52
Knowsley 5.7% 111 North Tyneside 10.1% 53
Manchester 21.0% 86 Nottingham 5.7% 89
Newcastle
5.7% 74 Oldham 21.0% 65
upon Tyne
Sandwell 15.2% 69 Sheffield 7.6% 54
St. Helens 5.7% 74 Solihull 5.7% 47
Southup
Walsall 16.2% 58 21.0% 27
Gloucestershire
Wolverhampton 5.7% 76 Stockport 10.6% 45
Trafford 5.7% 45
27Public health preferences:
Survey results
To understand better whether particular design interventions How did the cities differ?
would make a difference we asked people in each of the Five of the nine cities surveyed exclusively feature safer
core cities how much exercise they took each week, and what and more attractive design in their top three changes. All nine
they believed would increase the amount of brisk walking cities feature safer or more attractive design in the top
they do. three changes that would encourage residents to walk more.
Closer parks and public green spaces were popular for
Our public survey, undertaken by YouGov, asked respondents residents of Newcastle, Nottingham and Leeds, and more
how design could encourage them to walk more in their direct routes features in the top three motivators for
local area, each week. We surveyed 1,330 people living in the residents of Bristol and Leeds.
nine largest cities in England57 to find out how much exercise
they take each week, and whether any changes to their local This survey is a measure of public perception. The results in
area would encourage them to walk more often. this survey suggest higher levels of exercise than are recorded
in the official Public Health Observatory statistics. Whilst
Our survey revealed that public perceptions and preferences should not be acted upon
• 59% of people reported not exercising enough (the levels in isolation, they are useful to consider alongside other
they reported on a weekly basis did not meet recommended forms of research into how people can be encouraged to be
weekly levels of moderate exercise like walking nor healthier and more active.
vigorous exercise).
In shaping the public realm, we can make it as easy as
• 75% of people who do not exercise enough could be
possible for people to walk by removing issues that may
convinced to walk more each week and 25% of all
discourage them and instead enticing people to use the
respondents said nothing would encourage them to walk
streets and parks available.
more each week.
• S treets and parks designed to be safer and more attractive
were the most common changes people reported would
encourage them to walk more.
Pooling the results for all cities, the
top four changes that respondents
said would encourage them to walk
more were:
1. Safer design of pathways
2. More attractive public parks
and green spaces
3. More attractive streets
and pathways
4. Safer design of public parks
and green spaces
28Survey results to the question:
Thinking about your local area… Which THREE, if any, of the following would
MOST encourage you to walk more often than you currently do each week?
(Please tick up to three options)
Total % of Total % of respondents
respondents overall who do not meet minimum
levels of exercise
Safer design of pathways
24% 23%
(e.g. better lit or overlooked, more pedestrians etc.)
More attractive public parks and green spaces 23% 24%
More attractive streets and pathways 20% 20%
Safer design of public parks and green spaces
19% 20%
(e.g. better lit or overlooked, more pedestrians etc.)
More direct routes to key destinations
17% 17%
(e.g. work, shops, social venues, etc.)
Wider pathways, and pedestrian friendly crossings 16% 15%
Closer public parks and green spaces to
14% 15%
where I live
Bigger public parks and green spaces 14% 12%
Other 12% 12%
More streets and pathways 4% 4%
Don’t know 4% 6%
Not applicable – Nothing would encourage me
25% 25%
to walk more often that I currently do each week
29How can good design
create active places?
Case study 3
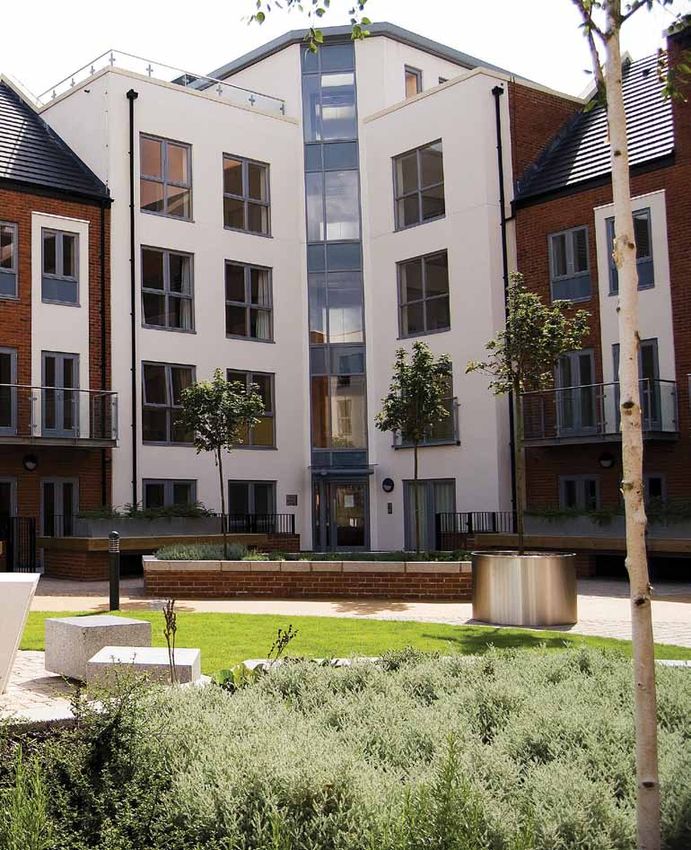
New City Quarter, Hungate, York
Developer:
Lendlease and Evans Property Group
Architect and urban designer:
John Thompson & Partners
Local authority:
City of York County Council
Lendlease and Evans Property Group in conjunction with
The City of York County Council set out to develop a new
riverside quarter on a brownfield site located within the
city’s walls but outside its Conservation Area. The result
is over 700 apartments and houses and 19,800 sqm of
employment, retail, leisure and community buildings and
public spaces.
Designing city links
Hungate now includes a network of pathways connecting
the new development to the established areas of the city,
from the historic city walls to the thriving shopping areas.
The designers studied the city, and the routes taken by
pedestrians, to incorporate the urban design characteristics
of York into the new streets, squares and public spaces.
Hungate was designed to reflect York’s narrow streets; its
plan creates variety and order amongst the new streets,
spaces and views that connects to them to the surrounding
areas. The architecture responds to local character, such as
the scale and form of the fragmented buildings, the undulating
roof scape and local materials. The urban design therefore
both knits the old and new communities together and
provides safe, inviting and well overlooked attractive routes
between them.
Communal appeal
To ensure the public spaces would be well-used, a
Community Forum fed into the design and planning process.
A Community Development Trust has been set up to help
ensure the spaces and community facilities remain attractive
and appealing, so that people continue to use them. The
Community Development Trust was actively involved in the
archaeological work and a series of events and newsletters
have been produced for members of the new community.
Copyright to PRP John Thompson & Partners
3031
City breakdown:
how to design fitter cities

Local authorities can focus their planning policies        design and attractive design mean to local residents.
towards active transport and take preventative             Safety can relate to fear of crime or attack in secluded
measures against poor health caused or exacerbated         areas, or it can mean being able to cross the road
by lack of exercise.                                       without being worried about traffic that is moving too
                                                           fast or hidden by blind corners. How attractive a
Across all nine cities, safer and more attractive design   place is can relate to the design of buildings, how green
for streets and public parks would be the most             the streets and roads are, or whether a park has a
encouraging for the residents surveyed. All nine cities    variety of uses and functions designed into it, from
should focus their efforts on these design priorities.     play areas for different age groups to benches
Local consultation will be needed to define what safe      overlooking local views.

32
Public survey results
London Top 3 changes to encourage walking
Population 9,480,600 All London respondents
Life expectancy men ranking 2
Life expectancy women ranking 1 1 More attractive public
Physical activity ranking 8 parks and green spaces 19%
= Safer design of pathways 19%
Diabetes ranking 4
= Safer design of public
Obesity ranking 5 parks and green spaces 19%
Deprivation 2 % who will not walk more 30%
1 healthiest city, 9 least healthy
London respondents who did not meet
London was the second least deprived city of those we minimum exercise levels (55%)
compared but its health performance varied. Life expectancy
in London is similar to the national average, and London 1 More attractive public
performed well compared to other cities (top for men and
second for women). London’s proportion of adults with diabetes parks and green spaces 24%
was also similar to the national average, putting London in 2 Safer design of pathways 23%
fourth place. However, London has a higher rate of childhood 3 More attractive streets 20%
obesity than England and was ranked fifth out of the nine = and pathways
cities analysed here. Physical activity is also lower than the
national average putting London in joint eighth place with = Safer design of public
Newcastle, with only 9.9% of adults meeting recommended parks and green spaces 20%
exercise levels according to Public Health Observatory (PHO) % who will not walk more 30%
data. Our own survey suggests that a larger figure, 45% of
London adults, self-report meeting minimum levels of activity. (Based on average % of each city, not original numbers)
Our survey suggests that to improve physical activity London’s
local authorities should include a focus on more attractive
designs for public parks. Safe, attractive and playable parks
could help to combat high childhood obesity, as well as safe
and attractive routes to school.
‘P laces can be designed to promote
health, for example by providing attractive
spaces that promote active lifestyles.
The Mayor and boroughs will seek to
support the delivery of new and improved
facilities for sport, walking, cycling, play
and other forms of physical activities.’
London Plan 201158
Nando Machado / Shutterstock.com
33City breakdown:
how to design fitter cities
Public survey results
Birmingham Top 3 changes to encourage walking
Population 2,419,500 All Birmingham respondents
Life expectancy men ranking 5
Life expectancy women ranking 4 1 More attractive public
Physical activity ranking 9 parks and green spaces 33%
2 Safer design of pathways 29%
Diabetes ranking 9
3 More attractive streets
Obesity 6 and pathways 27%
Deprivation 7 % who will not walk more 16%
1 healthiest city, 9 least healthy
Birmingham respondents who did not meet
Birmingham was one of the worst performing cities in our minimum exercise levels (59%)
comparison of health indicators, coming bottom of the nine
cities twice. It was one of only two cities performing below 1 More attractive public
the English average on every health indicator we compared
(the other was Newcastle). Birmingham had the highest parks and green spaces 40%
prevalence of adults with diabetes (6.7%) and the lowest levels 2 Safer design of pathways 31%
of physically active adults; only 8.9% exercise enough 3 More attractive streets
according to PHO data. Our own survey suggests that a larger and pathways 30%
figure, 41%, self-report meeting minimum levels of activity.
% who will not walk more 12%
Birmingham had the clearest results in our public poll, (Based on average % of each city, not original numbers)
with a strong call for more attractive public parks and green
spaces. 40% of residents who do not exercise enough
claimed this would encourage them to walk more, which was
the highest proportion of people backing any option in this
question across the entire survey. 31% of those that do not
meet the recommended level of exercise wanted safer ‘Our priority over the next 20 years
designed pathways and 30% wanted more attractive streets
and pathways. Birmingham could also see the biggest
will be to extend the existing
improvement, as only 12% of people who do not exercise network of spaces building upon
enough said nothing would encourage them to walk more – the successes to date.’
the lowest proportion out of all the cities.
Birmingham Big City Plan 2010.59
Mihai-Bogdan Lazar / Shutterstock.com
34Public survey results
Manchester Top 3 changes to encourage walking
Population 1,876,200 All Manchester respondents
Life expectancy men ranking 7
Life expectancy women ranking 7 1 More attractive streets
Physical activity 5 and pathways 26%
2 More attractive public
Diabetes 5
parks and green spaces 19%
Obesity in children 2 3 Safer design of pathways 24%
Deprivation 4 % who will not walk more 25%
1 healthiest city, 9 least healthy
Manchester respondents who did not meet
Manchester has the highest level of self-reported inactivity, minimum exercise levels (66%)
with 66% of respondents failing to meet recommended levels
of exercise. It performs better in comparison to other cities 1 More attractive streets
in the PHO data on physical exercise coming in at a similar
level to the national average. Levels adults with diabetes and pathways 25%
and obese children were also similar to the national average, 2 More attractive public
although life expectancy in Manchester was lower than the parks and green spaces 24%
English average. In our survey Manchester residents showed 3 Safer design of pathways 23%
a preference for safer and more attractive designs for streets
to encourage them to walk more each week. Aesthetics are = Safer design of public
the most important for everyone surveyed in this city, giving parks and green spaces 23%
local authorities a clear mandate to encourage design that % who will not walk more 26%
is proven to appeal to the local communities.
(Based on average % of each city, not original numbers)
Aesthetics are
important for
those surveyed
in Manchester,
giving local
authorities a
clear mandate
to encourage
design that
appeals to local
communities.
35City breakdown:
how to design fitter cities
Public survey results
Liverpool Top 3 changes to encourage walking
Population 787,600 All Liverpool respondents
Life expectancy men ranking 8
Life expectancy women ranking 9 1 Safer design of pathways 22%
Physical activity 6 = Safer design of public
parks and green spaces 22%
Diabetes 8
2 More attractive public
Obesity 9 parks and green spaces 21%
Deprivation 9 % who will not walk more 29%
1 healthiest city, 9 least healthy
Liverpool respondents who did not meet
Liverpool ranked poorly in our comparison of health indicators, minimum exercise levels (61%)
with the highest percentage of obese children of all the
cities, and second highest levels of adult diabetes and lack 1 Safer design of public
of activity. It was also the most deprived city of the nine
we compared. parks and green spaces 26%
2 Safer design of pathways 21%
In our poll, Liverpool has the highest proportion of people who 3 More attractive public
do not exercise enough and cannot be encouraged to walk parks and green spaces 21%
more; 33% of those failing to meet recommended levels of
exercise said nothing would encourage them to walk more % who will not walk more 33%
each week. It also had the second highest level of self- (Based on average % of each city, not original numbers)
reported inactivity, with 61% of respondents failing to meet
recommended levels of exercise. For those that could be
encouraged to walk more, safer design was a clear priority.
Safety should be a critical focus for local authorities in
Liverpool: health inequality and deprivation are difficult issues
for this city and safer design can be used to encourage an Safer design can be used to
increase in activity.
encourage an increase in activity
in Liverpool.
Tupungato / Shutterstock.com
36Public survey results
Newcastle upon Tyne Top 3 changes to encourage walking
Population 829,300 All Newcastle respondents
Life expectancy men ranking 6
Life expectancy women ranking 7 1 More attractive public
Physical activity 8 parks and green spaces 22%
= Safer design of pathways 22%
Diabetes 6
2 More attractive streets
Obesity in children 8 and pathways 20%
Deprivation 6 = Safer design of public
1 healthiest city, 9 least healthy parks and green spaces 20%
% who will not walk more 21%
Newcastle was one of only two cities to perform below the
English average on every health indicator we compared (the
other was Birmingham). It was worst but one for levels of Newcastle respondents who did not meet
obesity in children and lack of activity amongst adults, levels minimum exercise levels (55%)
of exercise in our own survey were similar to those of other
cities with 45% reporting that they meet recommended levels. 1 More attractive public
parks and green spaces 24%
Only 19% of people who do not exercise enough could not 2 Closer public parks
be convinced to walk more, meaning that positive changes
to the environment could improve levels of activity for over
and green spaces 23%
80% of those who need to exercise more. Parks and green = Safer design of pathways 23%
spaces could encourage those residents, with more attractive, = Safer design of public
closer and safer parks ranking as more popular motivators parks and green spaces 23%
they would like to see. Local authorities in Newcastle should
look to improve public parks and green spaces because
3 More attractive public
they could encourage residents surveyed to walk more often parks and green spaces 21%
than they currently do, including those who do not exercise % who will not walk more 19%
enough but could be encouraged to do so. (Based on average % of each city, not original numbers)
Local authorities
in Newcastle should
look to improve
public parks
and green spaces
to encourage
residents to
walk more.
ATGImages / Shutterstock.com
37City breakdown:
how to design fitter cities
Public survey results
Sheffield Top 3 changes to encourage walking
Population 810,000 All Sheffield respondents
Life expectancy men ranking 4
Life expectancy women ranking 5 1 Safer design of pathways 28%
Physical activity 2 2 More attractive streets
and pathways 24%
Diabetes 7
3 More attractive public
Obesity in children 4 parks and green spaces 22%
Deprivation 5 % who will not walk more 24%
1 healthiest city, 9 least healthy
Sheffield respondents who did not meet
In our tables comparing health indicators, Sheffield tended minimum exercise levels (64%)
to rank in the middle of the list, neither best nor worst on
any of the indicators. However, this does not make it healthy; 1 Safer design of pathways 28%
despite having similar levels of physical activity to the national
average, according to PHO data, Sheffield performed below 2 More attractive streets
the national average on all other indicators; life expectancy, and pathways 24%
adults with diabetes and childhood obesity. 3 More attractive public
parks and green spaces 22%
In our own survey, Sheffield had the second highest level
of self-reported inactivity, with 64% of respondents failing to % who will not walk more 25%
meet recommended levels of exercise. Of these, 75% could (Based on average % of each city, not original numbers)
be encouraged to walk more and the top changes that could
encourage them to do so were safer designed streets, followed
by more attractive streets and parks. Safer street design
should be considered an urban design and planning priority
for Sheffield’s local authorities.
75% of responders to the survey
Sheffield City Region Transport Strategy
“In order to enable active travel there is a need to ensure
in Sheffield could be encouraged
that streets are well designed, so that they function as both to walk more.
places and movement routes. Where streets balance these
roles effectively, they can enhance the quality, and improve the
viability, of a place. Good quality design can help reduce
accidents, create areas for people to socialise and encourage
walking, cycling and use of public transport.”
38Public survey results
Leeds Top 3 changes to encourage walking
Population 751,500 All Leeds respondents
Life expectancy men ranking 3
Life expectancy women ranking 3 1 More attractive public
Physical activity 1 parks and green spaces 29%
2 Closer public parks and
Diabetes 3
green spaces 23%
Obesity in children 3 3 More direct routes to
Deprivation 3 key destinations 19%
1 healthiest city, 9 least healthy % who will not walk more 27%
Leeds performed very well in our comparison of health Leeds respondents who did not meet
indicators, with all results either better than or similar to the minimum exercise levels (58%)
English average. It came top for levels of physical activity
from PHO data, with 11.1% of adults meeting recommended 1 More attractive public
levels, but it did not come top in our own poll despite 42%
reporting they do meet recommended levels.
parks and green spaces 29%
2 Closer public parks and
Closer public parks and green spaces would encourage Leeds green spaces 24%
residents surveyed (the only city where this was the case) 3 More direct routes to
and also for those who did not exercise enough. More direct
routes were also important to both groups of residents;
key destinations 17%
Leeds was the only city in our poll in which two of the top % who will not walk more 27%
changes selected by residents related to the lay out of the
(Based on average % of each city, not original numbers)
infrastructure rather than its design. Urban planning will be
important in helping Leeds maintain its current health
performance, and local authorities should focus on the design
of public parks. Since closer parks may motivate residents
to exercise, improvements to public transport links could also
be investigated by the local authority. Leeds was the only city where
Priority in Leeds Local Implementation Plan residents wanted public parks and
& Transport Strategy 2011 – 2026 green spaces closer.
“Investment in active, healthy travel to support the Council
and LTP goals for greater sustainability.”
39You can also read