Community Health Needs Assessment - Approved by the Grays Harbor County Public Hospital District No. 2 Board of Commissioners. November 24th, 2020 ...
←
→
Page content transcription
If your browser does not render page correctly, please read the page content below

Community Health Needs Assessment
Approved by the Grays Harbor County Public Hospital District No. 2 Board of Commissioners.
November 24th, 2020
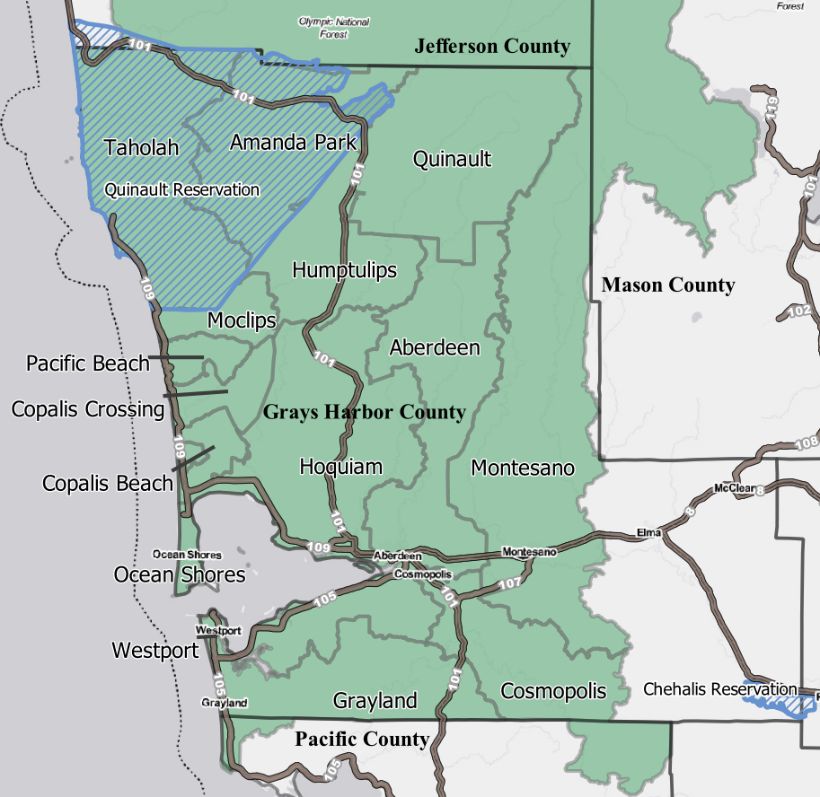
Table of Contents
Introduction/Overview ................................................................................ 2

Community Description............................................................................... 4

2017 CHNA and Accomplishments ............................................................... 6

Methodology ................................................................................................8

Demographics and Social Determinants of Health...................................... 11

The District’s Health Status ....................................................................... 18

Health Risk Behaviors and Outcomes ........................................................ 19

Behavioral Health and Substance Use........................................................ 21

Access to Care ............................................................................................ 24

Community Convening .............................................................................. 29

2020-2022 CHNA Priorities ....................................................................... 33
Introduction/Overview

Grays Harbor Community Hospital (GHCH) is a 140-bed licensed acute care community
hospital located in Aberdeen, Washington, the largest city in mostly rural Grays Harbor
County. GHCH is designated by Medicare as a Sole Community Hospital (SCH). The
SCH program was created by Congress to support small rural hospitals which "by
reason of factors such as isolated location, weather conditions, travel conditions, or
absence of other hospitals, is the sole source of inpatient hospital services reasonably
available in a geographic area to Medicare beneficiaries”.

GHCH opened as Aberdeen General Hospital in 1897 and was renamed as GHCH in
1945. In 1956, the hospital was found to no longer meet State licensing requirements,
and the Board made the decision to build a replacement hospital. The project was
financed through public donation (60 percent) and Hill-Burton Act funds (40 percent).
The current hospital building opened in December 1959.

Well into the 1960s Grays Harbor County, named after the           Grays Harbor
large estuarine bay near the County’s southwestern corner,       Community Hospital
was largely dependent on the logging and fishing industries.
In the 1960s, foreign mills began outbidding local timber                Mission
companies based on price, and in the 1980s, threats to the        To heal, comfort and
spotted owl and salmon lead to Federal restrictions and high      serve our community
rates of unemployment. Fishing and clamming, once                   with compassion.
important to the county’s economy, also deteriorated based
on depleted stocks.                                                       Vision
                                                                 To provide every patient
Today, charter fishing and ocean beaches bring considerable        superior service and
tourism to the area, and as a result, employment is largely in    safety, exceptional by
the lower-wage services sector. The County has consistently           any standard.
experienced higher rates of unemployment and poverty than
the State.

In addition to acute inpatient care (OB, intensive care and medical/surgical), GHCH
provides, among other services, a 24/7 emergency department, radiology, physical
therapy, laboratory, imaging, rehabilitation, surgery, chemical dependency, cardiac,
wound care, ambulatory infusion, and respiratory care. GHCH, through its operating
subsidiary, Harbor Medical Group, also owns and operates primary care and specialty
clinics, with a total of approximately 24 providers.

                                                                               2|Page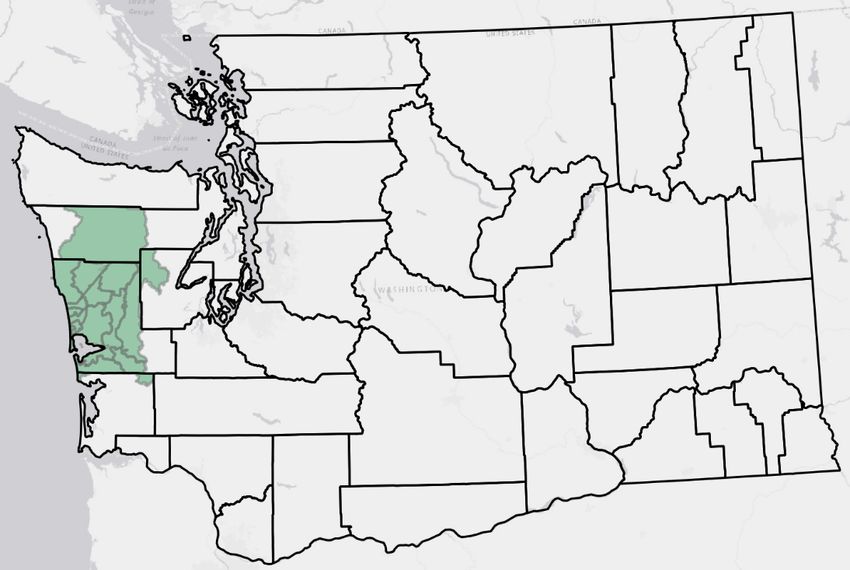
Nearly 80% of GHCH patients have Medicare or Medicaid as their payer or are receiving
charity care. Today, of Washington’s 100+ hospitals, GHCH ranks 5th highest in its
patient’s reliance on governmental payers (that do not typically pay cost) and patients
requiring charity care. In August 2014, residents voted to create Grays Harbor Public
Hospital District #2 (the District). The defined District boundaries largely parallel
western Grays Harbor County, with a population of nearly 60,000. The purpose of
establishing a public health district was, in part, to allow GHCH to benefit from a
revenue stream that the State Legislature appropriated for District hospitals that are
also SCHs. In January of 2015, the District began operations with a board of seven
elected commissioners; replacing the previous community citizen board.

While the addition of the District has helped financial viability, the challenges GHCH
faces daily remain: GHCH has experienced an operating loss each year since conversion
to a District. 2019 witnessed improvements associated with several factors, including
ongoing administrative efforts to streamline operations, reduce inefficiencies, increase
emphasis on prevention and outsource various administrative functions. It also resulted
from the Legislature’s willingness to further increase Medicaid reimbursement for two
SCHs in the State, including GHCH, which are now paid at 150% of the normal Medicaid
reimbursement rate.

The financial impact of the COVID-19 Pandemic is still unknown, but hospitals in general
have been hard hit. The statewide ban on elective cases and patient unease about seeking
health care, even for emergencies has resulted in significant reductions in primary and
specialty care visits, outpatient visits, ED visits and hospitalizations. Despite these
ongoing challenges, GHCH continues to be committed and hopeful that it will achieve
financial stability, continue to find avenues to improve health and assure access for
District residents.
When GHCH’s 2017 CHNA was developed, Robert Wood Johnson’s County Health
Rankings listed Grays Harbor County as the 35th lowest (out of Washington’s 39
counties) for overall health outcomes. This ranking has worsened, with the County in
2020 now ranking 37th out of Washington’s 39 counties. During the same timeframe, the
County improved in health factors rankings, moving from 36th in 2017 to 33rd in 2020.
Health outcomes represent how healthy an area is. It also reflects the physical and
mental well-being of residents within a community through measures representing the
length and quality of life. Health factors represent those things a community can modify
to improve the length and quality of life for residents including health behaviors, clinical
care, social and economic factors, and physical environment.

                                                                                 3|Page
It is within this context that GHCH’s 2020-2022 Community Health Needs Assessment
(CHNA) was undertaken. This assessment heavily relies on data from numerous
community and public organizations throughout Grays Harbor County. Health Facilities
Planning & Development, a consulting firm in Seattle, Washington with more than 30
years of experience working with Washington hospitals and data, facilitated the CHNA
process and supported GHCH in finalizing the CHNA and implementation plan.

                                            Figure 1. GHCH District Boundaries &
                                               Primary Service Area (PSA) Map

Community
Description                                 Tribal Lands

Grays Harbor County covers more than 1,900 square miles in western Washington State,
and its western border is the Pacific Ocean. The County is as large as the State of Delaware
and includes 76,627 residents. It is predominantly rural. The hospital itself is located in
the city of Aberdeen, the largest city in the County. The population of Aberdeen was
approximately 16,756 as of July 2019 estimates. The next largest city is Hoquiam
(population 8,655).

                                                                                 4|Page
The District is fully contained in the County and its geographic boundaries largely
parallel the area commonly referred to as Western Grays Harbor County. The District
includes about 77% of the total population of Grays Harbor County. Over 85% of
GHCH’s inpatient discharges were generated by individuals residing within the District,
and for these reasons, the District’s boundaries are considered the primary service area
(PSA) for this CHNA. The defined PSA is the same geography as used in the GHCH’s
2017 CHNA and can be seen in Figure 1. The District/PSA is defined as the following
zip codes1:
 98520 (Aberdeen)               98587 (Taholah)              98562(Moclips)
 98550 (Hoquiam)                98547 (Grayland)             98566 (Neilton)
 98569 (Ocean Shores)           98535 (Copalis Beach)        98536 (Copalis Crossing)
 98563 (Montesano)              98571 (Pacific Beach)        98575 (Quinault)
 98595 (Westport)               98526 (Amanda Park)          98583 (Satsop)
 98537 (Cosmopolis)             98552 (Humptulips)

The Quinault Indian Nation’s home is embedded within the geography of the District,
along the coastal areas of the County and consists of the Quinault and Queets tribes. Major
highways in Grays Harbor County include State Route 101, which runs north/south along
the coast, and Highways 12 and 8, which run east/west, and ultimately connects to
Interstate Highway 5 in the east. The state highways converge in the cities of Aberdeen
and Hoquiam. Driving time from the city of Aberdeen to the next largest city, Olympia, is
roughly one hour. Driving time to either Seattle or Portland, Oregon is about two and a
half hours. It takes about an hour to drive from Lake Quinault in the north end of the
District/PSA to Aberdeen.

Throughout this CHNA, where possible, data was collected specific to the District/Service
Area, and where not, County level data was used.

As depicted throughout this CHNA, the District/PSA and the County both face a number
of health and socioeconomic challenges, including health care access being compromised
by a low provider to population ratio, higher death rates than the State at large, higher
rates of teen pregnancy, lower birth outcomes and higher rates of behavioral health
concerns, including use of opioids, heroin and higher rates of suicide. The CHNA also
depicts that the social and economic factors—the social determinants that can contribute
to poorer health—are more of a burden within the boundaries of the District and Grays
Harbor County than in most other areas of Washington State.

1For some zip codes, a portion of the geography and population are outside of the District boundaries.
Population and demographic data was adjusted to account for only the percentage that resides within the
District.
                                                                                           5|Page
2017 CHNA and Accomplishments
GHCH’s 2017 CHNA identified significant health needs related to health care access,
health status and health behaviors in the District/PSA as well as Grays Harbor County in
general. The 2017 CHNA identified the following priorities and strategic actions:

            Priority                                           Achievements

 Behavioral Health                   § GHCH’s inpatient and outpatient providers participate weekly in
                                       the UW Psychiatry and Addictions Case Conference Series and
 Action: Advocate and secure           utilize the UW Psychiatry phone consultation service to expand
 adequate resources to improve         their mental health and addiction care capacity.
 access to behavioral health care
 by integrating into primary         § GHCH is working with the UW to implement tele-Medication
 care and address the opiate           Assisted Treatment services.
 crisis.
                                     § Crisis de-escalation training has been implemented in key
 Strategies:                           departments.

 §   Evaluate Telemedicine           § GHCH now provides Medically Assisted Treatment (MAT)
 §   Conduct Crisis intervention       services through our Substance Use Disorder unit at HarborCrest.
     Training                          We have also worked in partnership with Grays Harbor Public
 §   Continue evidence-based           Health to distribute Naloxone kits throughout the community and
     MAT Programs and                  with the Harbor Strong Coalition to distribute opioid lock boxes in
     Distribution of Naloxone          the community.
     kits
 §   Conduct Opioid                  § GHCH held an Opiate Symposium on November 8, 2017. We had
     Symposium                         111 people attend the event and 67% of the attendees gave
                                       feedback on the event that have guided (and will continue to
                                       guide) services and program development.

 Economic Development

 Action: Active participation in
 Economic Development, with
 specific interest in advocacy for   § GHCH leadership participated in economic development
 more family wage jobs, more           committees with Greater Grays Harbor, served in board positions
                                       for the Greater Grays Harbor Economic Development board, and
 affordable housing and better         developed a partnership with the City of Hoquiam and the
 transportation.                       Washington State Department of Commerce to develop a
                                       prioritized list of economic development projects.
 Strategies:
                                     § GHCH works collaboratively with CPAA to coordinate entry into
                                       their housing and shelter programs for those who are housing
 §   Commitment of Leadership          insecure and coordinate access to food and transit through
     time and Board level              community partnerships.
     resources to actively
     advocate and support
     enhancements in
     community infrastructure

                                                                                               6|Page
Priority                                           Achievements

Prevention and                      § GHCH participated in a train the trainer program. Two employees
                                      are now equipped to run health education classes. We are
Management of Chronic
                                      evaluating virtual options to implement during the COVID-19
Conditions                            Pandemic.
Action: Manage chronic
                                    § Within the primary care clinics, specific measurable workflows
diseases by improving care
                                      were identified to manage diabetic patients.
coordination and self-
management programs.                § Also, within primary care, a Contact Center for primary care
Strategies:                           providers was established in an effort to offer more robust
                                      appointment and follow up services.
§   Implement Chronic Care
    Model: Stanford Chronic         § A Prompt Care clinic was established to help those who use the ER
    Disease Self-Management           for chronic health issues gain access to primary care. GHCH is also
§   Evaluate feasibility of           reestablishing its EDIE program to establish comprehensive care
    adding coordination staff or      plans to minimize ER visits for those with chronic disease.
    community health workers
§   Provide phone call              § For patients with COPD who come to the ER for treatment, GHCH
    reminders and schedule            works directly with Lincare, a respiratory therapy provider in the
    follow-ups                        community, to ensure patients follow-up on their respiratory
§   Educate about benefits of         therapy appointments.
    physical activity and eating
    healthy foods                   § GHCH trained a number of employees to be Navigators to assist
§   Advocate for more                 those with chronic care needs gain access to health insurance and
    recreational spaces, and for      access providers via Apple Care.
    policies to reduce tobacco
    use                             § GHCH has also implemented community education and
                                      engagement opportunities including: Diabetes classes that also
                                      included a coupon for fresh vegetables at the end; and a smoking
                                      cessation program developed by GHCH’s Cardiopulmonary
                                      Director

Health Promotion and
Education
                                     § GHCH coordinated a speaker series that covered several health
Action: Outreach that                  promotion topics and coordinated an annual Health Fair
supports healthy living and self-      including booths focused on exercise and healthy eating.
management.
                                     § The GHCH Website has been completely rebuilt and is being
                                       updated weekly. Blogs are being established so that providers can
Strategies:                            educate the community.
§   Speaker sessions on healthy
    eating and physical activity     § GHCH is part of the Grays Harbor Partner Coalition which is
§   Further enhancements to            headed by Grays Harbor Public Health. The group seeks to
    website to make                    facilitate communication between community entities working to
    information accessible             manage addiction services across the county.
§   Care coordination to
    support chronic care self-
    management

                                                                                             7|Page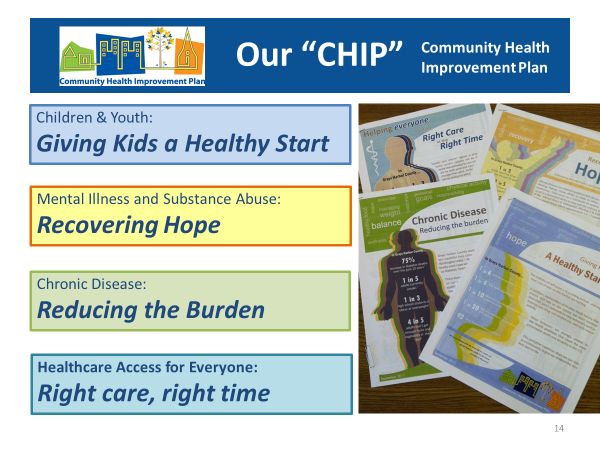
Methodology

This CHNA builds off the GHCH’s 2017 CHNA. In addition, since the September 26, 2017
adoption of our CHNA, a number of other CHNAs were completed that include all or
portions of the District as well as the County. These CHNAs were developed by the
Cascade Pacific Action Alliance (CPAA), Grays Harbor Public Health, and Grays Harbor
County Public Hospital District No. 1, dba Summit Pacific Medical Center. A brief
description of each entity and a summary of its CHNA priorities follows.
   Cascade Pacific Action Alliance: CPAA exists to improve community health and safety while
   advancing the Triple Aim: improving the patient experience of care, including quality and
   satisfaction; improving the health of populations; and reducing per capita health care costs. It
   operates in a seven-county region of Central Western Washington, which includes Cowlitz, Grays
   Harbor, Lewis, Mason, Pacific, Thurston, and Wahkiakum counties. CPAA is also the Accountable
   Community of Health (ACH) for the seven counties, meaning that the State Health Care Authority
   (HCA) has named it the regional entity leading Medicaid transformation and pursuing projects
   aimed at transforming the Medicaid delivery system. Washington’s transformation projects focus
   on health systems capacity building, care delivery redesign, prevention and health promotion, and
   increased use of value-based payment (VBP) models that reward providers for quality of care
   rather than the volume of services and procedures provided. GHCH’s CEO, Mr. Tom Jensen is on
   the Board of CPAA and is its immediate past chair.
   CPAA’s Regional Health Improvement Goals are to improve health equity and health outcomes for
   all residents in the communities it serves, with a focus on addressing the social determinants of
                                                                                     health; to keep
   Figure 2. CPAA 2017 Priorities                                                    residents healthy as
                                                                                     long as possible and
                                                                                     address all health
                                                                                     needs with a focus
                                                                                     on prevention and
                                                                                     early interventions;
                                                                                     and to reduce per-
                                                                                     capita health care
                                                                                     costs while
   improving the quality of care provided to residents in our communities. CPAA’s regional priorities
   were developed through region-wide engagement. In developing these, each county hosted a local
   forum to identify local health priorities and then shared regional priorities and actions that align
   with the local action agenda were adopted. CPAA’s current regional priorities include are depicted
   in Figure 2.

   Grays Harbor County Public Health and Social Services Department’s
   (GHCPH) mission is to improve the health and well-being of the people of Grays
   Harbor. Its vision is of Grays Harbor as a place where all people can be healthy
   throughout their lives.

                                                                                             8|Page
GHCPH’s 2016 Community                Figure 3. Grays Harbor Public Health
   Health Improvement Plan:                            Priorities
   Creating a Healthier Grays
   Harbor used a collaborative
   county-wide process and
   gathered the community to
   detail the serious health
   challenges that exist, to
   describe the efforts underway
   and to create a vision for a
   healthier tomorrow. Its
   priorities are detailed in
   Figure 3.

   Grays      Harbor        County
   Public Hospital District No. 1, dba Summit Pacific Medical Center is a public
   hospital district that operates a Critical Access Hospital with a level IV trauma
   designation, two rural healthcare clinics and a seven day a week urgent care clinic in
   Eastern Grays Harbor County. Its vision is ‘to build the healthiest community in the
   Nation.” Summit Pacific’s 2020-2022 Community Needs Health Assessment (CHNA)
   was developed over several months, using internal and external data and community
   feedback. In the late fall of 2019, three community sessions were convened specifically
   to provide input on community health needs. At these sessions, health rankings and
   other related information were reviewed, priorities were discussed, and the
   community’s input was solicited.

The priorities of each of these organizations as well as those contained in GHCH’s 2017-
2020 CHNA are identified in Figure 4 on the next page.

                                                                               9|Page
Figure 4. Grays Harbor County Health Priorities from Recent Community
Health Assessments
Cascade Pacific Grays Harbor Public Summit Pacific Grays Harbor
Action Alliance Health Medical Center Community Hospital
(2017) CHIP (2016) Forum (2020) (2017)
Children & Youth:
Improve Healthcare
Giving Kids a Healthy Health Behaviors Behavioral Health
Access
Start
Improve Care Mental Illness and
Coordination & Substance Abuse: Clinical Care Economic Development
Integration Recovering Hope
Social, Economic Prevention and
Prevent & Manage Chronic Disease:
& Physical Management of Chronic
Chronic Disease Reducing the Burden
Environment Conditions
Prevent & Mitigate Healthcare Access for
Health Promotion and
Adverse Childhood Everyone: Right care,
Education
Experiences (ACES) right time
Enhance Economic &
Educational
Opportunities
In addition to consideration of these community priorities, both primary and secondary
data was incorporated to create a comprehensive understanding of the District and
County’s health, health status and health care needs. Demographics, health behaviors,
mortality and access to health care were among the indicators that were examined. As
noted earlier, where possible, data was collected specific to the District, and where not,
county level data was used.
Data sources include, but are not limited to the following:
§ Behavioral Risk Factor Surveillance Survey
§ American Community Survey (ACS), US Census Bureau
§ OFM Public Hospital District Statistics and Chart Book
§ Robert Wood Johnson County Health Rankings
§ Department of Health and Human Services National Vital Statistics
§ Grays Harbor 2019 Public Health Snapshots
§ Washington Healthy Youth Survey 2018 Grays Harbor County
§ Washington Health Care Authority
§ HRSA Data Warehouse
§ University of Washington Alcohol & Drug Abuse Institute
§ Employment Security Department
§ Washington State Department of Commerce
10 | P a g eDemographics and Social Determinants of Health
Demographics:
The population is expected to grow much more slowly in the District/PSA and County
than in the rest of the state between today and 2024 (2.2%, 2.6% and 6.2% respectively).
Today, the percentage of the District and County’s population that is 65+ is already higher
than the state (22% compared to 15.9%). It is also the cohort expected to continue to grow
through 2024. In fact, as shown in Table 1, the 0-64 age cohort is projected to decrease
in the District and County (-0.8% and -4.8% respectively).
Table 1. District, County and State Population, by Age
District Grays Harbor County Washington State
Population 2019 % Chg. 2019 %Chg. 2019 % Chg.
2019- 2010- 2010-
2024 2024 2024
Total 59,169 2.2% 76,627 2.6% 7,572,102 6.2%
Population
% 0-64 78% -0.8% 78.5% -4.8% 84.1% 3.4%
% 65+ 22% 11.5% 21.5% 13.6% 15.9% 21.1%
Source: Claritas 2019
Table 2 provides more detail on the District and demonstrates that the 0-64 cohort
decreased by 6.0% between 2010-2019, with the most significant decrease (9%) in the 45-
64 population. The 0-64 population is expected to decrease another 0.8% by 2024; again,
led by a decrease in the 45-64 population (5.3%).
11 | P a g eTable 2. The District Population
2010 Pct of 2019 Pct of Pct 2024 Pct of Pct
Tot Est Tot Pop Chg Proj Tot Pop Chg
Pop 2010- 2019-
2019 2024
Tot. Pop. 58,751 100% 59,169 100% 0.7% 60,502 100% 2.2%
Pop. By Age
0-17 12,222 21% 11,655 20% -4.9% 11,748 19.4% 0.8%
18-44 18,886 32% 18,149 31% -4.1% 18,507 30.6% 1.9%
45-64 17,739 30% 16,269 27% -9.0% 15,452 25.5% -5.3%
65-74 5,729 10% 8,299 14% 31.0% 9,670 16.0% 14.2%
75-84 2,951 5% 3,486 6% 15.3% 3,696 6.1% 5.7%
85+ 1,223 2% 1,311 2% 6.7% 1,429 2.4% 8.3%
Tot. 0-64 48,848 83% 46,072 78% -6.0% 45,707 75.5% -0.8%
Tot. 65 + 9,903 17% 13,097 22% 24.4% 14,795 24.5% 11.5%
Source: Claritas 2019
Table 3 depicts that within the District, 73.1% of the population is white (a decrease of
4.2% since 2010). In comparison, at 11.1%, the Hispanic population has increased 23.2%
since 2010.
The District is slightly more diverse than the County, but significantly less so than the
state. For example, 64% of the population statewide is white, and 13% is Hispanic. The
Asian population statewide is almost 8% compared to 1.2% in both the County and
District. The only cohort that represents a higher percentage of the population in the
County vs the State is American Indian, at 4.1% within the District, 4.5% in the County
and only 1.3% statewide.
12 | P a g eTable 3. District Population by Race and Ethnicity
2010 Pct of 2019 Pct of Pct 2024 Pct of Pct
Tot Est Tot Chg Proj Tot Pop Chg
Pop Pop 2010 2019-
-2019 2024
Tot. Pop. 58,751 100% 59,169 100% 0.7% 60,502 100% 2.3%
Pop. By Race
American 2,356 4.0% 2,423 4.1% 2.8% 2,503 4.1% 3.3%
Indian/Alaskan
Native Alone
Asian Alone 789 1.3% 744 1.3% -5.6% 729 1.2% -2.0%
Black/African 688 1.2% 852 1.4% 23.8% 960 1.6% 12.7%
American Alone
Native 140 0.2% 190 0.3% 35.8% 223 0.4% 17.7%
Hawaiian/
Pacific Islander
Alone
Some Other 2,172 3.7% 2,579 4.4% 18.8% 2,860 4.7% 10.9%
Race Alone
Two or More 2,113 3.6% 2,535 4.3% 19.9% 2,823 4.7% 11.4%
Races
White Alone 45,140 76.8% 43,253 73.1% -4.2% 42,957 71.0% -0.7%
Hispanic 5,354 9.1% 6,594 11.1% 23.2% 7,447 12.3% 12.9%
Source: Claritas 2019
Social Determinants of Health
Social determinants of health—the conditions under which people are born, grow, live,
work and play—greatly influence the health of a community and its residents.
Graduation rates, housing affordability, income/poverty and race are all social
determinants. Figure 5 shows that social and economic factors are more of a burden in
Grays Harbor County than in many other areas of Washington State. This includes
poverty and unemployment.
The Median Household Income in the District is 66% of that of the State ($46,650 vs.
$70,116). Rates of poverty in the District (17.1%) are also higher than the County
(16.0%) and are significantly above the state’s rate of 11.5%.
13 | P a g eFigure 5. 2018 Income and Poverty The United Ways of the Pacific
$80,000 18%
Northwest’s ALICE report provides
$70,000 16% county-level estimates of ALICE
$60,000 14% households and households in poverty.
$50,000
12% ALICE is an acronym for Asset
10%
$40,000 Limited, Income Constrained,
8%
$30,000 Employed – households that earn
6%
$20,000 4% more than the Federal Poverty Level
$10,000 2% (FPL), but less than the basic cost of
$0 0% living for the county (the ALICE
District/PSA Grays Harbor Washington
County State
Threshold). Combined, the number of
ALICE and poverty-level households
Household Income Poverty
equals the total population struggling
Source: Social Explorer Tables: ACS 2018, Social to afford basic needs.
Explorer; U.S. Census Bureau, Median Income Inflation
Adjusted *Neilton and Moclips location data not
available
Table 4. ALICE Households, 2018
% Below According to the 2018 United
Total Way ALICE Report data, 46%
Area (Zipcode) Alice
Households of Grays Harbor County
Threshold
households were living below
Aberdeen (98520) 8,310 47%
the ALICE threshold
Copalis Beach (98535) 276 58% compared to 37% statewide.
Cosmopolis (98537) 834 38% This includes 45% of
households of families with
Grayland (98547) 579 49% children, and 50% of senior
Hoquiam (98550) 4,738 48% households (65 & older).
Towns within the District
Humptulips (98552) 184 51% ranged from 37% living
Montesano (98563) 3,023 37% below the threshold to 62%.
Data by town is shown in
Ocean Shores (98569) 3,074 49%
Table 4.
Pacific Beach (98571) 139 62%
Taholah (98587) 237 53%
Westport (98595) 1,249 51%
Grays Harbor County 27,674 46%
Washington State 2,767,682 37%
Source: 2018 Alice Report *Not all locations available
14 | P a g eFigure 6. Social & Economic Factors
120% As can be identified in
100% Figure 6, while the
80% County fairs better than
60% the state in terms of high
40%
school graduation rates, it
20%
0%
fairs far worse than the
High school grad Some college Children in poverty state in terms of children
County WA State Top US Performers in poverty (24% vs. 13%).
Source: County Health Rankings 2020
Figure 7 shows that while more than 10,000 residents have gained access to health
insurance via Washington State’s Medicaid expansion program, Grays Harbor County
still has higher rates of uninsured than the state, and that number has been trending back
up since 2017.
Figure 7. Percent Uninsured: Grays Harbor County and Washington State
Percent Uninsured Uninsured Population Trend:
Population in Grays 2015-2018
Harbor and Washington: 10%
2015 & 2018 8%
10% 6%
5% 4%
0% 2%
Grays Harbor Washington 0%
County State 2015 2016 2017 2018
2015 2018 Uninsured GH Uninsured WA
Source: OFM Chart Book 2020
A recent OFM report (August 2020) assessed the impact of COVID-19 on the state’s
uninsured rate, health coverage changes of newly unemployed workers, and changes in
uninsured rates at the county level. COVID-19 altered the trajectory of a mild, slow rise
in Washington’s uninsured rate to a much sharper increase. At the start of 2020, the
state uninsured rate was 6.7% (up from 6.6% in 2019). In May the rate peaked at 13%
but has since declined to 8.3% in the week ending August 15, 2020. Similarly, Grays
15 | P a g eHarbor County also saw a significant increase in uninsured due to COVID-19, and was at
10.8% in the week ending August 15, 2020, 30% higher than the state.
In the past several years, as can be identified in Figure 8, both the District/PSA and the
County’s unemployment rates have been in the range of 6.4% to 8.5%, about 50% higher
than the state (4.2% to 5.5%). Like uninsured rates, unemployment rates across the
state have also been significantly impacted by COVID-19, with Grays Harbor County
currently experiencing an unemployment rate of 14%, second only to Pend Oreille
County (14.4%) in the Northeastern most portion of the State.
Figure 8. Unemployment in Grays Harbor and Washington Over Time
20%
15%
10%
5%
0%
2015 2016 2017 2018 2019 Jul-20
Grays Harbor County Washington State
Source: Employment Security Department/LMEA; U.S. Bureau of Labor Statistics, Local Area
Unemployment Statistics, July Non-Seasonally Adjusted
The Robert Wood Johnson County Health Rankings provide estimates of individuals who
have ‘severe housing problems,’ meaning individuals who live with at least 1 of 4
conditions: overcrowding, high housing costs relative to income, lack of a kitchen, or lack
of plumbing. Similarly, Robert Wood Johnson defines a “cost burdened” household as a
household that spends 50% or more of their household income on housing.
Figure 9 identifies that while the County’s cost-burdened households and severe housing
problem rates are in-line with the State, the reality is that one fifth of Grays Harbor
County residents do not have safe, affordable housing, and over 140 of community
members are homeless, as measured by the Department of Commerce’s Point in Time
data. Being homeless puts an individual at increased risk of multiple health issues
including psychiatric illness, substance use, chronic disease, musculoskeletal disorders,
skin and foot problems, poor oral health, and infectious diseases such as tuberculosis,
hepatitis C and HIV infection.
16 | P a g eFigure 9. Housing and There is a strong and growing evidence
Homelessness 2019 base also linking stable and affordable
housing to health. When too much of a
paycheck goes toward the rent or
mortgage, it makes it hard to afford to go
to the doctor, cover the utility bills, or
maintain reliable transportation to work
or school. As identified in Table 5, when
drilling down on cost burden households
in the District by type (home ownership
vs. rental costs), the District fairs worse
than both the County and State in terms
of percent income going towards either
home ownership or rental costs. This is
consistent with the higher rates of single
parent households in the District (38.9%)
141
as compared to the County (35.4%) and
the state (25.6%). Children in single-
16,947 parent households are often at-risk for
social isolation, have an increased risk for
illness, and mental health problems, and
Source: County Health Rankings, Washington State
are more likely to engage in unhealthy
Department of Commerce behaviors than their counterparts.
Table 5. Affordable Housing Statistics
PSA Grays Harbor Washington
County State
Cost burdened households: Homeowners Who are
Paying at Least 50% of Income for Ownership 9.3% 8.8% 8.9%
Costs
Cost burdened households: Residents Paying More
22.6% 22.2% 21.4%
than 50% of Income on Rent
Median Gross Rent $766 $778 $1,194
Children Living with Single Parents 38.9% 35.4% 25.6%
Source: Social Explorer Tables: ACS 2018 (5-Year Estimates) (SE), ACS 2018 (5-Year Estimates), Social
Explorer; U.S. Census Bureau
17 | P a g eThe District’s Health Status
The Robert Wood Johnson Foundation’s County Health Rankings compare counties
within each state on more than 30 factors. Counties in each state are ranked according
to summaries of a variety of health
Table 6. County Health Rankings,
measures, and counties are ranked
Grays Harbor County 2017 vs. 2020
relative to the health of other
counties in the same state. The 2017 Composite Score 2017 2020
and 2020 summary composite scores Overall Health Outcomes 35 37
for Grays Harbor County are Length of Life 35 37
identified in Table 6. As the table
Quality of Life 30 35
shows, while there was improvement
Overall Health Factors 36 33
in the County’s Overall Health
Factors ranking and specifically in Health Behaviors 34 32
clinical care and health behaviors, Clinical Care 35 33
Grays Harbor County still ranks in Social & Economic Factors 33 36
the lowest quartile of Washington’s Physical Environment 7 7
39 total counties in both Overall
Source: County Health Rankings, 2017 & 2020
Health Outcomes and Overall Health
Factors and shows a worsening in length of life, quality of life and social and economic
factors.
In 2018, Grays Harbor had the second highest death rate (827.1 per 100,000) in the state,
second only to Pacific County (838 deaths per 100,000). This compares to the state rate
of 664.5 per 100,000. As depicted in Figure 10, and consistent with the state, the leading
causes of death in Grays Harbor County are cancer and heart disease. However, both
cancer and heart disease death rates are significantly higher in the County than the state.
Figure 10. Leading Causes of Death per 100,000
200 40%
30%
150 20%
100 10%
0%
50 -10%
-20%
0 -30%
Alzheimer's Cerebrovascular Accidents Chronic Lower Heart Disease Malignant
Disease Diseases Respiratory Neoplasms
Disease
Grays Harbor WA State GH % Change '15-'18
Source: 2018 Death rates from WA DOH and Vital Statistics Summary
18 | P a g eHealth Risk Behaviors and Outcomes
District residents experience a greater burden of chronic diseases than the rest of
Washington. As can be seen in Table 7, the self-reported rates of diabetes among County
and District residents are over 39% higher than Washington State residents and obesity
is 29% higher in the District than the State.
Table 7. Self-Reported Chronic Health Conditions in Adults
% Answering Yes
Grays
WA
Question District Harbor
State
County
(Ever told) you have diabetes? 16.22% 16.18% 11.62%
During the past month, other than your regular
job, did you participate in any physical 71.92% 72.10% 78.98%
activities or exercises?
(Ever told) you had angina or coronary heart disease? 6.55% 7.13% 5.40%
Calculated body mass index category (obese) 33.77% 32.10% 25.80%
Source: 2014-2018 CDC BRFSS
The most common behavioral contributors to chronic disease, morbidity or mortality
include diet and activity patterns, the use of alcohol, drugs, tobacco, firearms, and motor
vehicle accidents. Importantly, the social and economic costs related to these behaviors
can all be greatly reduced by changes in an individual’s behaviors. Table 8 shows that
Grays Harbor generally ranks significantly worse on health behaviors. Of note are
Physical Inactivity (41% higher than State) and Teen Births (55% higher than State).
Higher teen birth rates in the County are of concern. Younger mothers are less likely to
get prenatal care early in their pregnancies and their pregnancies are more likely to result
in premature births and low birth-weight babies.
According to the Washington State Department of Health Center for Health Statistics, in
2018 11.5% of mothers in Grays Harbor County received late or no prenatal care
compared to 6.5% statewide. Additionally, 6.3% of births were low birthweight
compared to 5.3% statewide, and 12.4% of births were premature compared to 9.4%.
Both the lack of prenatal care and birthweight correlate to poorer overall health over a
person’s lifespan.
19 | P a g eTable 8. Other Health Behaviors in Adults
County Top U.S. WA State
Performers
Percentage of the adult population in a county who both 15% 14% 13%
report that they currently smoke every day or most
days and have smoked at least 100 cigarettes in their
lifetime.
Access to healthy foods by considering the distance an 7.0 8.6 8.1
individual lives from a grocery store or supermarket,
locations for health food purchases in most communities,
and the inability to access healthy food because of cost
barriers.
Percentage of adults ages 20 and over reporting no 24% 20% 17%
leisure-time physical activity in the past month.
Percentage of a county’s adult population that reports 18% 13% 17%
binge or heavy drinking in the past 30 days.
Percentage of motor vehicle crash deaths with 23% 11% 32%
alcohol involvement.
Number of births per 1,000 female population ages 15-19 28 13 18
(Teen Births).
Source: County Health Rankings 2020
Specific to youth, Washington’s Healthy Youth Survey (HYS), a collaborative effort of
the Office of the Superintendent of Public Instruction, the Department of Health, the
Department of Social and Health Service's Division of Behavioral Health and Recovery,
and the Liquor and Cannabis Board, provides important information about youth.
Students in each school district in grades 6, 8, 10, and 12 answer questions about safety
and violence, physical activity and diet, alcohol, tobacco and other drug use, and related
risk and protective factors.
As shown in Figure 11 Grays Harbor County 10th graders have significantly higher rates of
being bullied in the last 30 days, of being obese or overweight, and having had sexual
intercourse.
20 | P a g eFigure 11. Grays Harbor County Healthy Youth Survey Results, 10th Grade
Smoke Cigarettes (last 30 days)
Drink Alcohol (last 30 days)
Bullied (last 30 days)
Ever Had Sexual Intercourse
Obese or Overweight (top 15% of BMI)
Did not meet recommended daily physical
activity
< 5 Fruit or Veg Servings/day
0% 10% 20% 30% 40% 50% 60% 70% 80% 90%
State of WA Grays Harbor County
Source: Healthy Youth Survey, 2018, Grays Harbor County and Washington State, Grade 10
Behavioral Health and Substance Use
Figure 12. Self-Reported Poor Mental Health Days
RWJ’s County Health Rankings collects data on poor
mental health days from CDC’s BRFSS data. A 2014
study in the American Journal of Epidemiology
suggests that counties with more poor mental health
days are more likely to have higher unemployment,
Source: County Health Rankings poverty, percentage of adults who did not complete
2020 high school, mortality rates, and prevalence of
disabilities versus counties with less poor mental health days. As shown in Figure 12,
Grays Harbor County residents self-report an average of 4.6 poor mental health days in
the last 30 days, about 10% higher than the State rate.
21 | P a g eFigure 13. Self-Reported Mental Health Conditions
As can be identified in 30%
Figure 13 on the right, the 25% 24%
25% 22%
CDC’s BRFSS 5-year 2014-
20% 17%
2018 estimates show that 15% 15%
15%
25.12% of the service area
reported being told they 10%
3% 3% 3%
have a depressive disorder 5%
(including depression, 0%
Depressive Disorder Receiving Treatment for Serious Mental Illness
major depression, Mental or Emotional
dysthymia, or minor Health
depression), compared to PSA Grays Harbor County Washington
22.05% for the state.
Source: CDC BRFSS 2014-2018
According to the 2018 Healthy Youth Survey, 42% of Grays Harbor County 10th graders
reported having depressive feelings, compared to 40% of 10th graders statewide.
Table 9. Rate of Suicide 2013-2017
Number of Age-adjusted rate Grays Harbor County
suicides (per 100,000) experienced an overall
Grays Harbor County 72 19.8 suicide rate more than 25%
Washington State 5,669 15.4
higher than the State
Source: 2019 WA DOH Firearm Fatality and Suicide Prevention, average for the 2013-2017-
A Public Health Approach time frame.
As identified in Figure 14, with a 75% increase between the 2002-2004 timeframe and
2016-2018 timeframe, Grays Harbor County now ranks fourth highest of all Washington
Counties for all opioid fatalities, with a rate of 15.95 per 100,000 in 2016-2018, compared
to 10.28 per 100,000 statewide. The County also ranks in the top 5 counties for heroin
overdose deaths with a rate of 7.29 per 100,000 in 2016-2018.
22 | P a g eFigure 14. Top 5 Opioid and Heroin Fatality Counties
Opioid Fatality per 100,000 Heroin Fatality
10
Washington State 10.28 9 8.61
5.71 8.24 8.13
8 7.29
Lincoln 15.55 7
3.25 6.04
6
Grays Harbor 15.95 5
9.1
4
16.16 3
Clallam 8.58
2
16.49 1
Wahkiakum 8.71 0
um
a
an
y
r
17.23
bo
rr
bi
Ferry
Ju
4.52
Fe
m
ak
ar
lu
H
n
ki
Sa
Co
ah
ys
W
ra
0 5 10 15 20
G
2016-2018 2002-2004 Deaths per 100,000
Source: University of Washington Alcohol & Drug Abuse Institute Interactive Database (2020), 2016-
2018 University of Washington Alcohol & Drug Abuse Institute Interactive Database (2020)
Adverse Childhood Experiences (ACEs)
Adverse Childhood Experiences, or ACEs, are traumatic events that occur in childhood
and cause stress that changes a child’s brain development. Exposure to ACEs has been
shown to have adverse health and social outcomes in adulthood, including but not limited
to depression, heart disease, COPD, risk for intimate partner violence, and alcohol and
drug abuse. ACEs include emotional, physical, or sexual abuse; emotional or physical
neglect; seeing intimate partner violence inflicted on one’s parent; having mental illness
or substance abuse in a household; enduring a parental separation or divorce; and having
an incarcerated member of the household.
23 | P a g eFigure 15. Association between ACEs and Negative Health Outcomes
Source: Centers for Disease Control & Prevention, “Association Between ACEs and Negative Outcomes”
ACE burden is defined as the number of ACEs an adult was exposed to during childhood.
The highest ACE score is 8. In Washington, 62% of adults 18-64 have at least one ACE;
26.5% have 3 or more; 5% have 6 or more. According to Grays Harbor Public Health
Department 2019 Snapshots, 38% of Grays Harbor adults had three or more ACEs. 75%
of 8th grade students believe they can discuss important things with the adults in their
neighborhood or community.
Access to Care
Access to care when and where it is needed is impacted by income, health insurance,
transportation, and the supply of providers, among other factors. While more than 10,000
County residents have gained access to health insurance via Medicaid expansion, the
County still has higher rates of uninsured than the state, and that number has been
trending back up since 2017.
The Federal Health Resources & Service Administration (HRSA) deems geographies and
populations as Medically Underserved Areas (MUAs), Medically Underserved
Populations (MUPs) and/or Health Professional Shortage Areas (HPSAs). MUAs and
MUPs identify geographic areas and populations with a lack of access to primary care
services. Similarly, a HPSA designation identifies a critical shortage of providers in one
or more clinical areas.
There are also several types of HPSAs depending on whether shortages are wide spread
or limited to specific groups of people or facilities including: a geographic HPSA wherein
the entire population in a certain area has difficulty accessing healthcare providers and
the available resources are considered overused; or a population HPSA wherein some
groups of people in a certain area have difficulty accessing healthcare providers (e.g. low-
income, migrant farmworkers, Native Americans).
24 | P a g eOnce designated, per Figure 16 below, HRSA scores HPSAs on a scale of 0-26, with higher
scores indicating greater need. HPSA designations are available for three different areas
of healthcare: primary medical care, primary dental care, and mental health care.
Figure 16 HPSA Scoring Criteria
Three scoring criteria are common across all disciplines of HPSA:
§ The population to provider ratio,
§ The percentage of the population below 100% of the Federal Poverty Level (FPL), and
§ The travel time to the nearest source of care (NSC) outside the HPSA designation.
You can review the HPSA scoring methodology, differentiated by discipline, below:
The following figure provides a broad overview of the four components used in Primary Care HPSA scoring:
The entirety of Grays Harbor County has been designated as a HPSA for primary, dental,
and mental health care. These designations are important as more than 30 federal
programs depend on the shortage designation to determine eligibility or funding
preference to increase the number of physicians and other health professionals who
practice in those designated areas. Table 10 reflects Grays Harbor County’s HPSA
designations and scoring.
Table 10. Grays Harbor County HPSA Designations
HPSA Designation Type Designation Date Score
Primary Care Low-Income: Entire County 8/01/2017 16
Dental Care Geographic: Entire County 8/24/2017 18
Mental Health Geographic: Entire County 8/03/2017 17
Source: HRSA Data Warehouse – HPSA Find
Figure 17 demonstrates the number of Primary Care Physician FTEs per 100,000 is
considerably lower than Washington State’s at 34 versus 97 per 100,000 and U.S. Top
Performers at 85 per 100,000.
25 | P a g eFigure 17. Number of Primary Care Physician FTEs per 100,000 population
Grays Harbor County
34 per 100,000
Washington State
97 per 100,000
Top US Performers
85 per 100,000
Source: 2020 County Health Rankings =10 Primary Care Providers
For healthcare access, and as shown in Table 11, Grays Harbor ranks below the state on
all 7 healthcare access measures developed and reported in 2020 by County Health
Rankings. This includes an uninsured rate almost 30% higher and 31% more preventable
hospital stays per 100,000 Medicare enrollees.
Table 11. Healthcare Access
Grays Top U.S. WA
Harbor Performers State
County
Uninsured 9% 6% 7%
Primary care physicians 2,910:1 1,030:1 1,180:1
Dentists 2,000:1 1,240:1 1,230:1
Mental health providers 340:1 290:1 270:1
Preventable hospital stays 3,888 2,761 2,969
Mammography screening 36% 50% 39%
Flu vaccinations 42% 53% 46%
Source: County Health Rankings 2020
An ambulatory care—sensitive condition (ACSC) is defined as a condition for which
timely and effective primary care or outpatient care can potentially reduce the risk of
subsequent hospitalization. Hence, a hospitalization for an ACSC is also called a
preventable hospitalization or avoidable hospitalization. Theoretically, as
ACSC hospitalization is preventable with a proper supply of “ambulatory care”, it is
considered to be a negative index for primary care. In other words, Preventable Hospital
Stays could be classified as both a quality and access measure, as some literature
describes hospitalization rates for ambulatory care-sensitive conditions primarily as a
proxy for access to primary health care.
26 | P a g eAmbulatory care-sensitive conditions include convulsions, chronic obstructive
pulmonary disease, bacterial pneumonia, asthma, congestive heart failure,
hypertension, angina, cellulitis, diabetes, gastroenteritis, kidney/urinary infection, and
dehydration. This measure is age-adjusted.
Lower numbers on this measure are the goal. Grays Harbor County ranks well below the
nation but is higher than the Washington State average but demonstrated improvement
between 2016 and 2107. In 2019, County Health Rankings reported preventable hospital
stays by race.
Figure 18. Preventable Hospital Stays Over Time
Source: County Health Rankings, 2013-2019
27 | P a g eThough Grays Harbor’s overall rates for mammogram screenings and flu vaccinations are
generally better than the state, 2017 rates are lower for specific racial and ethnic minority
populations as depicted in Figure 19. Data for the American Indian/Alaska Native and
Black populations in Grays Harbor County were higher than the overall County rates
(9,950 American Indian/Alaskan Native, 6,523 for Black, and 3,762 for White.
Figure 19. Flu Vaccinations and Mammogram Screenings by Race
60%
40%
20%
0%
Flu vaccinations mammogram screenings
American Indian & Alaska Native Asian Black Hispanic White
Source: County Health Rankings 2020
Data from the Arcora Foundation indicate Figure 20. % Who Had All
potential dental health access issues in Permanent Teeth Extracted
Grays Harbor County. For example, the 65 and older (2018)
percent of adults who have seen a dentist in
the last year in the County is significantly
WA State 9%
lower than the percent statewide (51% vs.
69%). Importantly, and as can be identified
in Figure 20, data also demonstrates that Grays Harbor
17%
County
adults have worse dental outcomes than
the State with 17% of residents over the age 0% 5% 10% 15% 20%
of 65 having all permanent teeth extracted
compared to only 9% statewide.
The situation is slightly better for
Figure 21. Missed School Days due to a
Toothache (2018)
school age youth in the County. While
fewer Grays Harbor 8th grade students
10%
8% 8% have seen the dentist in the last year
8% 7% than students statewide (82% vs.
6% 6%
6% 5% 87%), as seen in Figure 21, by 12th
4%
grade Grays Harbor is doing better
than the state (81% compared to 79%).
2%
However, more students in 8th- 12th
0% grade in the County are missing school
Grade 8 Grade 10 Grade 12
due to a toothache than students
Grays Harbor County WA State statewide.
28 | P a g eCommunity Convening
In prior CHNAs, GCHC undertook robust in-person community convenings to assess,
identify, and prioritize community needs. After much discussion, this year, due to COVID,
we chose to distribute an online survey to District/PSA and County leaders as well as to
organizations that serve the vulnerable, including the following organizations listed in
Table 12 below:
Table 12. Survey Recipients and Their Target Populations/Communities
City Government Officials Grays Harbor County
Aberdeen, Cosmopolis, Westport, Emergency Management
Montesano, and Hoquiam Countywide
GHCH Foundation Port of Grays Harbor
District Countywide
Low Income/vulnerable
populations
School Districts Behavioral Health
Students, Teachers and Families Resources
in Aberdeen, North Beach, Countywide. Behavioral
Ocosta health focus
Grays Harbor County Public Law Enforcement/Chief
Health of Police
Countywide, Low Income and Residents of Aberdeen,
Vulnerable Populations, Hoquiam, Montesano
Homeless
Quinault Nation First Responders (Ocean
Quinault and Queets tribes and Shores and Grays
descendants of five other coastal Harbor County Fire)
tribes: Quileute, Hoh, Chehalis,
Chinook, and Cowlitz. Countywide and community
specific
Grays Harbor Community YMCA of Grays Harbor
Foundation Low Income/vulnerable
Youth, families, vulnerable populations.
populations, homeless
Focus on equity.
GHCH Foundation State and Federal
Low income/vulnerable Representatives
populations Residents of the 24th
Legislative and 6th
Congressional Districts
29 | P a g e36 surveys were sent, with a Figure 22. 2017 CHNA Priorities. Little to
response rate of nearly 50%. no Improvement (Ranked 1-2 out of 5)
Given that many recipients
were working remotely during 80% 69% 69%
70% 63%
this timeframe and given the
60% 50%
alignment of the responses from 50%
those we received, we are 40%
confident that we received valid 30%
input. 20%
10%
0%
The survey was designed to Behavioral Economic Chronic Health
solicit feedback on perceived Health Development Disease Promotion
Management and
improvements in the areas Education
prioritized in GHCH’s 2017
CHNA. It also requested input on other or new health needs and gaps of the community.
Specifically, the survey posed questions related to the four GHCH 2017 CHNA Priorities,
restated below:
§ Behavioral Health: Advocate and secure adequate resources to improve access
to behavioral health care by integrating with primary care, and address the opiate
crisis
§ Economic Development: Active participation in Economic Development, with
specific interest in advocacy for more family wage jobs, more affordable housing
and better transportation
§ Prevention and Management of Chronic Conditions: Manage chronic
diseases by improving care coordination and self-management programs
§ Health Promotion and Education: Outreach that supports healthy living
and self-management
The questions specifically asked were:
On a scale from 1 (no improvement) to 5 (great improvement), please indicate
the improvement you have experienced either personally or within the
community over the past three years in relationship to the priority.
Do you think the priority should continue to be a CHNA priority action in the
coming years?
30 | P a g eAs shown in Figure 22, respondents generally indicated that they—either personally or
in their profession--- experienced little to no improvement in the last three years in
areas including behavioral health access/opioid crisis, economic development and
health promotion and education. Half of the respondents also indicated that they
experienced little to no improvement related to chronic disease management.
As identified in Figure 21, the vast majority of respondents also concluded that GHCH’s
2017 priorities should continue to be priorities in the upcoming years with health
promotion and education receiving the highest rating (88%) and economic development
the lowest (but still at nearly 70% of respondents).
Based on the data collected in preparation for the 2020 CHNA, and after participation
in, and/or close review of the Community Needs Assessment and Health Improvement
Plans produced by Public Health, CPAA and Summit Pacific Medical Center, the survey
also asked respondents to prioritize an additional priority that rose to the top in those
Reports; that priority was health care access. 94% of respondents thought health care
access should be a priority.
Figure 23. 2017 Priorities – Should the Priority Continue to be a Focus?
Health promotion and education
Chronic Disease
Economic Development
Behavioral Health
0% 10% 20% 30% 40% 50% 60% 70% 80% 90% 100%
Don't Know/Not Familiar No Yes
The Community Convening process ultimately asked respondents to rank each of the
2017 CHNA priorities as well as the additional health care access priority, specifically
asking:
Of the priorities referenced in this survey: Behavioral/Mental Health,
Prevention and Management of Chronic Diseases (this is a combination of the
current CHNA priorities: chronic conditions and health promotion/education),
Economic Development, and Healthcare Access, which two do you identify as
the top priorities?
31 | P a g eThe responses are depicted in Figure 23. When ranked compared to other priorities,
Healthcare Access (69%) and Behavioral Health (56%) rose to the top, with Prevention
and Management of Chronic Disease ranking in the top two for only 37.5% of
respondents. Economic development ranked in the top two for only 25% of respondents.
Figure 24. Respondents’ Top Priorities
Healthcare Access 69%
Behavioral/Mental Health 56%
Prevention and Management of Chronic Diseases* 38%
Economic Development 25%
Respondents were also asked if there were other areas of health needs that were not
addressed in earlier questions. One respondent provided a particularly in-depth
response, as follows:
Diet and lifestyle are a major component of health care and addressing the needs
of other indicators such as Mental and Behavioral Illness and Chronic Disease.
The Blue Zones initiative at Summit Pacific is a huge undertaking and GHCH
should consider the work that goes into creating partnerships with grocery
stores, school districts, gyms, and area businesses to support a community that
is health conscious. Changing human behavior is difficult if the environment does
not change. But if you change the environment (the community) and make health
the focus at work, school, church, etc, we begin to change the environment and
thus the behaviors are easier to change.
Other areas of health needs identified by community respondents included early
intervention programs, satellite clinics and facilities, and more training for clinical staff.
Access to care specific to the underinsured/uninsured and more recruitment of
providers, another access issue, were also noted.
32 | P a g eYou can also read