Tennessee Department of Health: Suicide Prevention Report 2020 - TN.gov
←
→
Page content transcription
If your browser does not render page correctly, please read the page content below
2020

   Tennessee
   Department of
   Health: Suicide
   Prevention Report

                   1|Page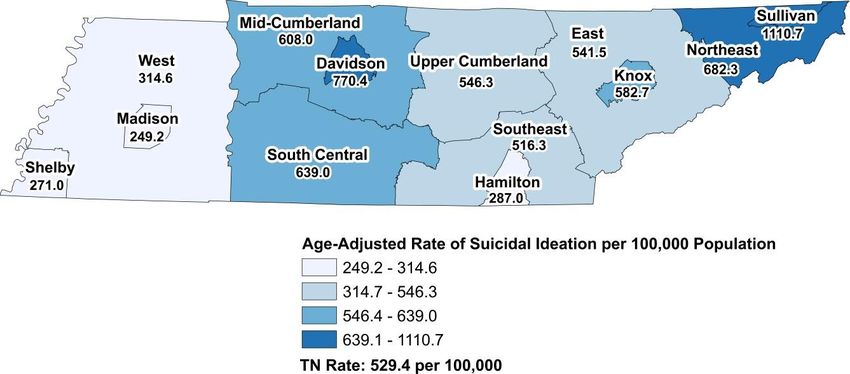
Table of Contents
Acknowledgements .....................................................................................................................3
Executive Summary ....................................................................................................................5
Summary of 2020 Recommendations .........................................................................................7
Key Definitions ............................................................................................................................9
Introduction ...............................................................................................................................10
   Background ...........................................................................................................................11
   Suicide Prevention Act of 2018..............................................................................................11
   Suicide Prevention Program Overview ..................................................................................12
Impact of Suicide in Tennessee: Data Overview .......................................................................14
   Suicide Fatalities ...................................................................................................................14
   Intentional Self-Harm Injury and Suicidal Ideation..................................................................19
   Youth Risk Behavior Survey Data..........................................................................................27
   Behavioral Risk Factor Surveillance Survey……………………………………………………….27
   Suicide Prevention Needs Assessment Survey…………………………………………………...28
Suicide Prevention Programs and Services in Tennessee ........................................................29
   Suicide Prevention Gatekeeper Trainings ..............................................................................29
   Suicide Prevention Programs and Trainings that Protect Children and Youth ........................30
   Suicide Prevention Programs for Healthcare Professionals ...................................................31
   Crisis Services.......................................................................................................................32
   Upstream Prevention Activities……………………………………………………………………...32
Suicide Prevention Recommendations for Tennessee ..............................................................34
   Legislative Policies ................................................................................................................34
   State and Community Agencies.............................................................................................34
   Clinics and Hospital Systems ................................................................................................35
   Healthcare Providers .............................................................................................................36
   Public Safety and Emergency Response Agencies ...............................................................36
   Educational Institutions ..........................................................................................................37
   Individuals, Families, and Friends..........................................................................................37
Conclusion ................................................................................................................................39
Appendices ...............................................................................................................................40
   Appendix 1: Tennessee Statewide Suicide Prevention Programs and Services.....................40
   Appendix 2: Tennessee Statewide Suicide Prevention: Description of Programs ..................45
   Appendix 3: Tennessee Statewide Suicide Prevention Description of Services .....................50
   Appendix 4: List of Figures ....................................................................................................52

                                                                                                                              2|Page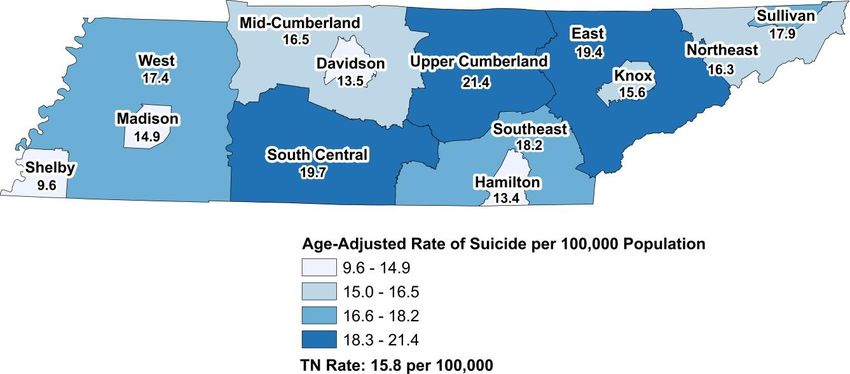
Acknowledgements
The Tennessee Department of Health (TDH) expresses its extreme gratitude to the individuals
who contributed their time to participate on the Suicide Prevention Stakeholder Task Force. The
task force brought together a diverse group of stakeholders to ensure broad representation
across all sectors involved in suicide prevention activities across the state.

TDH Program Staff

Ibitola Asaolu, DrPH, MPH                          Terrence Love, MS
Rachel Heitmann, MS                                Morgan McDonald, MD, FAAP, FACP
Erin Hodson, MPH                                   Brittany Willis, BS
Kimberly Lamar, PhD, MPH, MSEH

2019-2020 Suicide Prevention Stakeholder Task Force Members
Linzi Anderson, BSE                                         Nichelle Foster, MMFT
First Presbyterian Church                                   Metro Nashville Health Department

Monique Anthony, MPH, CHES                                  James Gay, MD, MMHC
TN Department of Health                                      Division of General Pediatrics
                                                             Vanderbilt
John Averitt, Ph.D.
Cookeville Regional Medical Center                           Jeff Heston, BS
                                                             Wilson County Men’s Shed
Michelle Bauer, BA
TN Army National Guard                                       Jameson Hirsch, Ph.D.
                                                             East TN State University
Kat Cloud, BS
American Foundation for Suicide Prevention                   Anthony Jackson
                                                             TN Department of Mental Health
Karin Collins, DVM                                           and Substance Abuse Services
Animal Wellness Veterinarian Hospital
                                                             Lynn Landrum Julian, MA
Paula Denslow, CBIS                                          Crestwyn Behavioral Health
TN Disability Coalition
                                                             Natasha Kurth, MBA, MHA
Sarah Elliott, MPH                                           Children's Emergency Care
TN Commission on Aging and Disability                        Alliance at Vanderbilt

                                                                                      3|Page
Misty Leitsch, BBA, BSW              Shaquallah Shanks, MPH
TN Suicide Prevention Network        TN Department of Health

Adele Lewis, MD                      Raquel Shutze, LPC-MHSP
TN Department of Health              Youth Villages

Carol McDonald, BA                   Heather Sifford, BSPH
TN Department of Agriculture         Johnson City Medical Center

Brook McKelvey, MPH, MA              Joey Smith, BS
Metro Nashville Health Department    Montgomery County Health
                                     Department
Eve Nite, BA
Erlanger Behavioral Health           Kevin Spratlin, MS, NRP
                                     Memphis Fire Department
Ashley Nott, MSW
JourneyPure                          Becky Stoll, LCSW
                                     Centerstone
Lori Paisley, MA
TN Department of Education           Elizabeth Strand, LCSW
                                     University of Tennessee Colleges
                                     of Social Work and Veterinary
Kelsey Palladino, MPH, BSN, RN       Medicine
TriStar Skyline Medical Center
                                     Purnima Unni, MPH, CHES
Shalini Parekh, MPH                  Monroe Carell Jr. Children’s
TN Department of Health              Hospital at Vanderbilt

Joanne Perley, MPH                   Janet Watkins, MA
TN Department of Mental Health and   TN Department of Education
Substance Abuse Services
                                     Megan Williams, MA
                                     Centerstone

                                                             4|Page
Executive Summary
The Suicide Prevention Act of 2018 (T.C.A. § 68-3-703) recognizes suicide as a serious public
health issue in Tennessee and provided authorization for a suicide prevention program to be
created within the Department of Health. The goal of the suicide prevention program is to review
existing data and resources to identify promising practices and gaps in services for preventing
suicide. This report describes deaths by suicide in Tennessee, along with the demographic
characteristics of those deaths. The report also describes emergency department and
hospitalization visits for suicide attempt and ideation. Through a comprehensive review of data
and resources, along with input from key stakeholders, this report identifies specific
opportunities for prevention of deaths by suicide. Below are key findings and recommendations:
Key Findings: Suicide Fatalities in Tennessee
The total number of deaths by suicide increased by 23% from 2014 to 2018 (945 vs.
1,159 deaths). The rate of deaths by suicide increased by 19% from 2014 to 2018 and
remains 16% higher than the national rate in 2018.
In 2018, the suicide death rates were highest among adults aged 25-64 (22.5 per
100,000) and lowest in children/youth aged 10-24 (10.7 per 100,000).
Seventy-six percent of suicide decedents in 2018 were males (26.8 per 100,000) and
24% were females (7.9 per 100,000).
Ninety-one percent of suicide deaths in 2018 were among white individuals and the rate
for Whites (19.8 per 100,000) was over twice that of Blacks (8.0 per 100,000).
Firearms accounted for 60% of all 2018 suicide deaths in Tennessee.
The burden of suicide varied across Tennessee regions with Shelby County having the
lowest rate and Upper Cumberland having the highest (9.6 vs. 21.4 per 100,000
population) for 2014-2018 combined.
Key Findings: Suicidal Ideation and Suicide Attempts in Tennessee
In 2018, there were 7,854 emergency department (ED) visits and 2,648 inpatient
hospitalizations for nonfatal intentional self-harm injuries. In addition, there were 28,104
ED visits and 12,187 inpatient hospitalizations with suicidal ideation but no
accompanying self-harm injury.
For 2016-2018, females accounted for 61% of all ED visits for nonfatal intentional self-
harm injuries in Tennessee with poisoning as the most common method of injury.
From 2016 to 2018, white individuals experienced higher rates of nonfatal intentional
self-harm injury and suicidal ideation than black individuals, though this gap was
narrower than that seen for suicide deaths.
5|Page The total cost associated with ED visits and hospitalizations for nonfatal intentional self-
harm injury in 2018 was over $150 million, and the total cost for suicidal ideation-related
ED visits and hospitalizations was over $500 million.
Key Findings: 2019 Suicide Prevention Needs Assessment Stakeholder Survey
Sixty-two percent of survey respondents reported that individuals served by their
organization face barriers in receiving suicide prevention services.
Only 55% of respondents said they have screening/assessment policies in place in their
affiliated organizations.
Key themes for prevention from survey respondents included a need for better mental
health insurance coverage, increased awareness of suicide prevention training,
implementation of standardized screening in primary care and pediatric offices,
increased need for treatment services specifically for children and young adults,
increased access to mental health services, including crisis and treatment, particularly in
rural areas, and increased efforts to reduce the impact of adverse childhood
experiences.
6|PageSummary of 2020 Recommendations
Legislative Policies
Hospitals in Tennessee should be required to report into the ESSENCE database
Mental health facilities across the state should comply with legislation that allows mental health
records of patients who have died by suicide to be shared with medical examiners and state fatality
review programs
Health insurers in Tennessee should comply with the rules and requirements of the Mental Health
Parity and Addiction Equity Act
State and Community Agencies
Increase access to adequate mental health care for all Tennesseans
Expand awareness of suicide and encourage help-seeking behavior
Support the widespread use of standardized behavioral health assessment protocols and tools
Increase funding to strengthen the crisis response infrastructure within Tennessee, with particular
emphasis on children and rural communities across the state
Develop a centralized Tennessee Suicide Prevention Resource directory
Support suicide prevention programs and training
Clinics and Hospital Systems
Maintain “suicide safe” facilities
Increase the use of certified peer recovery specialists or other paraprofessionals in appropriate
crisis, treatment, and recovery support settings
Promote the integration of primary care and behavioral health care to increase access to behavioral
health services in primary care settings
Healthcare Providers
Provide education to all patients on the signs of suicide
Obtain training on depression and anxiety screening, suicide risk assessment, safety planning, and
lethal means counseling
Collaborate with mental health centers to ensure patients receive appropriate mental health
referrals, follow-up, treatment, and care
Counsel gun owners on safe firearm storage practices
7|PagePublic Safety and Emergency Response Agencies
Increase collaboration between law enforcement and other emergency response agencies in
responding to a suicidal event or mental health crisis
Promote partnerships between behavioral healthcare facilities, local law enforcement, local
transportation agencies, and local emergency medical services to expand the Crisis Assessment
and Response to Emergencies Program
Encourage local law enforcement agencies, local fire departments, and local EMS agencies to
create work environments that are safe, protective, and supportive of their staff members
Educational Institutions
Incorporate suicide prevention education into school curricula
Increase the availability of mental health screening and services provided in schools
Provide training opportunities for mental health and suicide prevention to students, school teachers,
school support staff, and other adults that interact with children and youth
Implement mental health and suicide prevention programs within elementary school classrooms
and peer-to-peer suicide prevention support programs within middle and high schools
Individuals, Families, and Friends
Seek care with the earliest symptoms of depression or signs of suicide
Complete suicide prevention gatekeeper trainings to learn the risk factors, how to reach out for help
and how to respond appropriately to someone at risk for suicide
Encourage conversations of suicide prevention awareness within the community
8|PageKey Definitions
Definitions of terms used to describe suicide and suicide-related behavior by the Centers for
Disease Control and Prevention (CDC) are outlined in the table below.
Term Definition
Suicidal Ideation Passive thoughts about wanting to be dead or active thoughts about
killing oneself, not accompanied by preparatory behavior
Preparatory Acts and Acts or preparation toward making a suicide attempt, but before
Suicidal Behavior potential for harm has begun. This can include anything beyond a
verbalization or thought, such as assembling a method or preparing
for one’s death by suicide
Self-Harm (also referred Injury inflicted by a person on himself or herself deliberately, but
to as self-injury) without intent to die
Suicidal Crisis An incident where an emotionally distraught person seriously
considers or plans to imminently attempt to take his or her own life
Suicide Plan An individual’s thinking about a suicide attempt comprising elements
such as timeframe, method, and place.
Suicide Attempt (also Non-fatal self-directed potentially injurious behavior with any intent to
referred to as suicidal die as a result of the behavior. A suicide attempt may or may not
act) result in injury
Suicide Death caused by self-directed injurious behavior with any intent to
die because of the result of the behavior
Suicidality (also referred Term encompassing suicidal thoughts, ideation, plans and
to as suicidal behavior) preparatory acts, suicide attempts, ad completed suicide
Precipitating Factors for Stressful events or experiences that can trigger a suicidal crisis in a
Suicide vulnerable person
Warning Signs for Behaviors indicate whether someone may be at immediate risk for
Suicide suicide
Risk Factors for Suicide Characteristics of a person or his or her environment or society that
increase the likelihood of suicide death
Protective Factors for Personal or environmental characteristics that reduces the likelihood
Suicide of suicide death
Prevention Strategy or approach that reduces the likelihood of risk of onset, or
delays the onset of adverse health problems or reduces the harm
resulting from conditions or behaviors.
Intervention Strategy or approach intended to prevent an outcome or to alter the
course of an existing condition (e.g. providing lithium for bipolar
disorder or strengthening social support in a community).
Postvention Strategy or approach implemented after a crisis or traumatic event
has occurred.
9|PageIntroduction
Suicide is a leading cause of death across the United States and continues to be a growing
public health problem in Tennessee. The effect of suicide on individuals, families, friends, and
communities is long-lasting and profound. In 2018, there were 48,344 suicide deaths in the
United States, at a rate of 14.8 per 100,000 person population1. While suicide can affect
persons of any age, race, gender, or socioeconomic background, the rate of suicide death
across the nation is higher among certain groups than others. Across the U.S., there is a higher
rate of suicide deaths among men, non-Hispanic Whites, non-Hispanic Alaska Native/American
Indians, and veterans and other military personnel1. There are also significantly higher rates of
suicide for those who work in certain occupations such as, but not limited to, doctors, nurses,
veterinarians, dentists, and those that work in construction or production2. In 2018, suicide was
the second leading cause of death among Americans aged 10 to 34 years 1.
Unfortunately, suicide death data only highlights a small fraction of individuals across the
nation impacted by suicide or suicide-related behavior. In fact, for every suicide death in the
United States, there are approximately twenty-five more individuals across the nation who will
attempt suicide, and an even larger number of people who suffer with suicidal ideations. In
2018, 10.7 million Americans seriously considered suicide, 3.3 million Americans had a suicide
plan, and 1.4 million Americans made a non-fatal suicide attempt3. Suicide and suicide-related
behavior are responses to multiple internal risk factors (e.g. depression, family history of
mental illness or suicide, or substance abuse) and external risk factors (e.g. lack of social
support, financial stress, or lack of access to behavioral health care.). To reduce the number of
people across the nation and across Tennessee who attempt or die by suicide, we must offer
support, protection, and care throughout the community, rather than leaving it to be the
responsibility of healthcare systems alone.
Through continued data collection and analysis, Tennessee Department of Health (TDH) aims
to improve suicide prevention efforts across the state by; continuing to work collaboratively with
multiple state and local agencies; supporting the expansion of current suicide prevention
programs and policies offered throughout the state; and utilizing data-driven approaches to
develop and implement innovative initiatives targeting those most at risk for suicide.
The purpose of the 2020 Suicide Prevention Report is to:
Describe how suicide and suicidality impacts Tennessee
Provide a comprehensive overview of the current programs, resources, and services
available to those individuals living in Tennessee who may be at-risk for suicide
Review evidence-based strategies and promising practices for suicide prevention
Recommend suicide prevention programs, services, and resources to reduce deaths by
suicide
1
CDC. Suicide Deaths. Available from https://www.cdc.gov/injury/wisqars/index.html
2
CDC, Morbidity and Mortality Weekly Report, Vol. 67, No. 45, Available from
https://www.cdc.gov/mmwr/volumes/67/wr/mm6745a1.htm?s_cid=mm6745a1_w
3
SAMHSA. 2018 National Survey of Drug Use and Health (NSDUH). Key Substance Use and Mental
health Indicators in the U.S. Available from http://www.samhsa.gov/data/release/2018-national-survey- drug-use-and-health-
nsduh-releases
10 | P a g eBackground
Throughout the nation’s history, programs and practices related to the prevention of suicide
have primarily been regulated within systems and organizations that support and provide mental
health care and treatment. At the end of the twentieth century, there became a developing
interest across the nation to address suicide as a public health issue, rather than just a mental
health issue. In 2001, acknowledging the devastating impact and costs of suicide, the U.S.
Surgeon General issued the first National Strategy for Suicide Prevention. In 2012, a revised
National Strategy was issued to build upon achievements and incorporate recent advances in
suicide prevention.
In Tennessee, the Department of Mental Health and Substance Abuse Services (TDMHSAS)
has been the primary state agency to receive both state and federal funding to implement
suicide prevention services and programs across the state. In 2001, the Tennessee Suicide
Prevention Network (TSPN) was established, and in alignment with the 2001 National Strategy
for Suicide Prevention, the network implemented the Tennessee Strategy for Suicide
Prevention. Since 2001, TSPN, TDMHSAS and TDH have made great strides in suicide
prevention in Tennessee and continues to provide education, training, and resources to local
communities across the entire state. The TDH has supported suicide prevention efforts across
the state by:
Providing data on suicide attempts and death to inform prevention efforts utilizing multiple
data sources
Coordinating and participating in collaborative meetings in a variety of settings across sectors
Providing QPR trainings to internal staff in TDH and members of the community
Promoting available suicide prevention resources, programs, and services
In 2018, in response to increasing rates of suicide across the state, the Tennessee General
Assembly enacted the “Suicide Prevention Act of 2018”. This Act provided TDH an opportunity
to create a suicide prevention program to increase the department’s capacity to provide data-
driven recommendations and support the implementation of statewide suicide prevention
strategies and programs.
Suicide Prevention Act of 2018
On May 21, 2018, Governor Bill Haslam and the Tennessee General Assembly passed the
Suicide Prevention Act of 2018 (T.C.A. § 68-3-703). This Act recognized suicide as a serious
public health issue in Tennessee and provided the Commissioner of Health authorization to
create a suicide prevention program within the Department of Health. The Act required the
Department to establish a team that would (T.C.A. § 68-3-703(b)):
1. Compile existing data on suicide deaths
2. Review existing resources and programs related to suicide prevention
3. Identify evidence-based or promising practices related to the prevention of suicide
4. Convene relevant stakeholders to review existing data and existing programs and
resources and identify opportunities to improve data collection, analysis and
programming
5. Submit a report to the general assembly no later than June 30, 2020, and by June 30th
every two years thereafter, recommending any necessary programs or policies to
prevent suicide deaths in Tennessee
The act took effect on January 1, 2019 and a suicide prevention program director was hired in
March 2019.
11 | P a g eSuicide Prevention Program Overview
The TDH suicide prevention program is housed within the Division of Family Health and
Wellness. Since its implementation in January 2019, the suicide prevention program has worked
diligently to fulfill the requirements of the Suicide Prevention Act of 2018. Over the past year, the
program assessed suicide prevention infrastructure in Tennessee, reviewed suicide prevention
strategies, analyzed data on trends in suicide deaths and suicide-related behaviors, and
provided evidenced-based recommendations. In the program’s first year and continuing into its
second year, the TDH’s suicide prevention program:
Formed the Suicide Prevention Stakeholder Task Force Team, a diverse group of
professionals with broad representation across all state and local sectors in Tennessee.
Task force members are comprised of individuals who work in healthcare organizations,
behavioral health care organizations, law enforcement, community-based organizations,
emergency response, faith-based organizations, higher education institutions, substance
abuse treatment facilities, crisis services, military and veteran affairs, and local schools.
Multiple statewide agencies represented in the task force include TSPN, TDMHSAS,
Tennessee Department of Education (TDE), the Tennessee Department of Agriculture
(TDA), and the Tennessee Commission on Aging and Disability (TCAD). From January
2019 to March 2020, the Team convened five times to discuss suicide ideation,
attempts, and death, at-risk populations, suicide prevention practices in healthcare
organizations, and suicide response protocols. The task force also advised on
recommendations put forth in this report.
Developed a needs assessment survey for stakeholders in suicide prevention. One of
the first requests of the Task Force was the development of a statewide survey to gain
insight to: identify gaps in mental health and suicide prevention programs; determine the
type of support needed for individuals at-risk for suicide; and assess statewide
collaborations among suicide prevention agencies. The 25-minute survey was
distributed throughout the entire month of September 2019 to mental health
professionals, health professionals, school personnel, higher education representatives
and others with an interest in suicide prevention. Data from 281 respondents are
reflected in this report.
Conducted weekly surveillance of suicide-related emergency department visits in
children aged 18 and under. The visits were monitored using the Electronic Surveillance
System for the Early Notification of Community-Based Epidemics (ESSENCE) software,
a database with data on emergency department visits for a suicide attempt, intentional
self-harm, or thoughts of suicide.
Developed a model for rapid prevention response using surveillance data from
ESSENCE. The rapid prevention response plan assists state and local partners to
target areas in the state showing increased emergency department visits for suicide-
related behavior in children 18 and under. The plan includes increasing awareness
and offer suicide prevention resources, services, and programs within a county seeing
increases in near real time.
Participated in a National Child Safety Learning Collaborative (CSLC) through the
Children’s Safety Network. This collaborative aimed to spread Question, Persuade, and
Refer (QPR) suicide prevention gatekeeper trainings to youth impactors across the
state. Through our work in the CSLC and in partnership with TSPN, 142 gatekeeper
trainings have been provided to 4,666 youth impactors across the state since January
2019.
12 | P a g e Partnered with the TDH Rape Education Program to provide QPR trainings to staff
members in organizations that provide services to survivors of sexual assault and
intimate partner violence.
Partnered with TCAD to provide Question, Persuade, Refer (QPR) trainings to Family
Caregiver Support Coordinators across the state.
Coordinated a Be the One Suicide Prevention Workforce Campaign Train the Trainer
session for selected TDH employees in both central and regional health offices in an
effort to create a supportive and protective workplace culture for all TDH employees.
While the program has met numerous benchmarks in its first year, more effort is needed to
improve suicide prevention programming and services across the state. Therefore, TDH’s
suicide prevention program will persist in:
Leading the Suicide Prevention Stakeholder Task Force team to review data and
services on suicide-related behavior and provide opportunities for improving suicide
prevention strategies in Tennessee.
Identifying populations (e.g. occupational groups) who are most at-risk for suicide and
identifying prevention strategies to be implemented for those vulnerable populations.
Analyzing suicide-related data from various sources, including child death review,
maternal mortality review, national violence death reporting system (NVDRS) and vital
records, to inform data-driven suicide prevention policies, programs, and services.
Performing weekly surveillance of suicide-related emergency department visits in
children aged 18 and under, and expanding ESSENCE surveillance to other age groups
across the lifespan.
Developing and implementing rapid prevention response plans for all Tennesseans
using ESSENCE surveillance to help state and local partners target high-risk populations
and areas in the state more effectively.
Participating in the CLSC’s Suicide and Self-Harm Collaborative team to train youth
impactors across the state in QPR.
Partnering with state and local agencies to implement data-driven suicide prevention
strategies.
Implementing the Be the One Suicide Prevention Workforce Campaign in TDH by
providing trainings to employees.
Serving as a member on key advisory and stakeholder groups.
Providing suicide prevention reports and fact sheets to key stakeholders throughout
Tennessee.
13 | P a g eImpact of Suicide in Tennessee: Data Overview
To fully understand the impact of suicide in Tennessee and improve prevention efforts, we must
continually review suicide-related data to identify the groups of people most at-risk for suicide.
This section includes data on suicide fatalities, suicidal ideation, suicide attempts, and suicide-
risk factors from the Youth Risk Behavioral Surveillance System, along with data on mental
health and crisis services.
Suicide Fatalities
Number and Rate of Suicide Deaths
In 2018, 1159 people in Tennessee died from suicide resulting in a suicide rate of 17.1 deaths
per 100,000 person population. Within the past five years, Tennessee’s suicide rate (deaths per
100,000 people) increased by 19%, from 14.4 deaths in 2014 to 17.1 deaths in 2018 (Figure 1).
Over the past five years, Tennessee’s suicide death rate has remained higher than the average
national rate (Figure 1). In 2018, Tennessee’s suicide rate (17.1 deaths per 100,000 person
population) was 16% higher than the national average rate (14.8 deaths per 100,000 person
population).
Figure 1: Number and rate of suicide deaths per 100,000 person population, Tennessee
and United States, 2014-2018
TN Deaths TN Rate U.S. Rate
2000 20
17.3 17.1
16.7
16.1
Rate per 100,000 Population
14.4
1500 15
Number of Deaths
14.5 14.8
13.7 13.9
13.4
1000 10
1110 1163 1159
500 1065 5
945
0 0
2014 2015 2016 2017 2018
Data source: Tennessee Department of Health, Office of Vital Records and Statistics, Death Statistical File, 2014-2018.
14 | P a g eSex/Gender
Males have over three times the rate of suicide death compared to females. In 2018, the
suicide death rate for males in Tennessee was 26.8 deaths per 100,000 males compared to
7.9 deaths per 100,000 females (Figure 2). Although the burden of suicide death is higher
among Tennessee males, over the five-year span (2014 through 2018) shown here, suicide
death rate increased more among Tennessee females (32%) than males (15%).
Figure 2: Gender-specific suicide rate, Tennessee, 2014-2018
Males Females
30 27.7 26.8
26.0 26.4
25 23.3
Rate per 100,000 Population
20
15
10 7.4 7.4 7.9
6.0 6.7
5
0
2014 2015 2016 2017 2018
Data source: Tennessee Department of Health, Office of Vital Records and Statistics, Death Statistical File, 2014-2018.
Age
he burden of suicide death varied across age groups and gender. Suicide has increased
across all age groups over the last five years. Individuals aged 25-64 had the highest rate of
suicide death in 2018 (22.5 deaths per 100,000 person population); (Figure 3). Also, as the
population ages, the gender gap in suicide also widens. Males aged 65 years and older had at
least six times higher suicide death rates than females of the same age group. Among adults
aged 25 to 64 years, however, males had a three-fold higher rate of suicide death than
females.
Figure 3: Rate of suicide deaths by age group, Tennessee, 2014-2018
10-24 years 25-64 years 65+ years
30
Rate per 100,000 population
25 22.2 22.9 22.5
20.9
19.2
20
20.8 19.8 20.0
19.5
15 17.1
10
10.0 10.3 10.9 10.7
5 8.9
0
2014 2015 2016 2017 2018
Data source: Tennessee Department of Health, Office of Vital Records and Statistics, Death Statistical File, 2014-2018.
15 | P a g eRace
The rate of suicide death is higher among Whites than Blacks in Tennessee. In 2018, the
suicide rate (deaths per 100,000 person population) among Whites was 19.8 compared to 8.0
among Blacks (Figure 4). Compared to 2014, the suicide death rate in 2018 increased more
among Blacks (78%) than Whites (16%) in Tennessee.
Figure 4: Race-specific suicide rate, Tennessee, 2014-2018
White Black
25
Rate per 100,000 Population
20.4 19.8
19.4
20 18.2
17.1
15
10 8.0
7.0 6.4
4.5 5.3
5
0
2014 2015 2016 2017 2018
Data source: Tennessee Department of Health, Office of Vital Records and Statistics, Death Statistical File, 2014-2018.
Method of Suicide Deaths
In Tennessee, firearms are the most prevalent means of suicide death, accounting for 3 out of 5
(60%) suicide deaths in 2018. Hanging was the next most common method, representing 24%
of Tennessee’s suicide deaths in 2018 (Figure 5). Also, the means of suicide death differed by
decedent’s gender. Firearms were the method used for 64% of male suicides compared to 42%
of female suicides.
Figure 5: Method of suicide deaths, Tennessee, 2014-2018
Poison Hanging Firearms Other Means
70%
63% 61% 61%
60% 60%
Percent of Suicide Deaths
60%
50%
40%
30%
19% 21% 20% 22% 24%
20%
14% 13% 13% 11% 10%
10% 4% 5% 6% 5% 6%
0%
2014 2015 2016 2017 2018
Data source: Tennessee Department of Health, Office of Vital Records and Statistics, Death Statistical File, 2014-2018
16 | P a g eEducational Status
Figure 6 shows the rate of suicide death by educational level among Tennessee residents aged
18 and older. The five-year (2014-2018) trend for the suicide death rate shows that individuals
with at least a Bachelor’s degree had the lowest rate of suicide death while those with lower
educational achievement had higher rates of suicide.
Figure 6: Suicide rate by educational level in Tennessee residents 18 and older (2014-
2018)
Less than High School High School/GED
Some College/Associate Degree Bachelor's Degree or Higher
35
31.0 30.7
28.9
30 27.3
Rate per 100,000 population
27.3
25 23.5 25.9 25.5 24.8
20 21.8
17.5
16.6 16.4
14.4 15.0
15
10 12.8 12.4 12.7 12.3
12.0
5
0
2014 2015 2016 2017 2018
Data source: Tennessee Department of Health, Office of Vital Records and Statistics, Death Statistical File, 2014-2018 and
American Community Survey, United States Census Bureau.
Data displayed for suicide deaths among Tennessee residents 18 years and older.
Marital Status
The rate of suicide death by marital status among Tennessee residents aged 15 years and older
is presented in Figure 7. In 2018, the rate of suicide death was highest among divorced
individuals (36.7 per 100,000) and significantly different from other categories. In 2018, the
suicide death rate was lowest among those who were currently married at time of death (15.3
per 100,000). Although, the rate of suicide deaths was higher among widowed decedents (24.6
per 100,000) than decedents who were never married (22.3 per 100,000), the difference in
suicide rates between these two groups was not significant. For certain groups, however, there
was a variation in suicide rate in the five-year span presented in this report. Between 2014 and
2018, the rate of suicide death among individuals who were widowed and those who were never
married increased by 33% and 40% respectively.
17 | P a g eFigure 7: Suicide rate by marital status in Tennessee residents 18 and older (2014-2018)
Married Widowed Divorced Never Married
50
45 41.9
39.5
40 37.0 36.7
Rate per 100,000 population
35.3
35
30
23.5 23.6 24.6
25 20.9
18.5
20 22.3
18.9 21.4
15.9 19.2
15
15.7 15.4 15.3
10 14.3 14.1
5
0
2014 2015 2016 2017 2018
Data source: Tennessee Department of Health, Office of Vital Records and Statistics, Death Statistical File, 2014-2018 and
American Community Survey, United States Census Bureau. Data displayed for suicide deaths among Tennessee residents 15
years and older.
Geographic Distribution of Suicide Deaths in Tennessee
The five-year age-adjusted rate of suicide death for the thirteen regions in Tennessee is
presented in Figure 8. From 2014-2018, the rate of suicide death was lowest in Shelby region
(9.6 deaths per 100,000 population) and highest in the South Central (19.7 deaths per 100,000),
Upper Cumberland (21.4 deaths per 100,000), and East (19.4 deaths per 100,000) regions of
Tennessee.
Figure 8: Age-adjusted rate of suicide death by region, 2014-2018
Data source: Tennessee Department of Health, Office of Vital Records and Statistics, Death Statistical File.
18 | P a g eIntentional Self-Harm Injury and Suicidal Ideation
While prevention efforts often focus on data related to suicide death, completed suicides
represent the tip of the iceberg in terms of the full spectrum of suicidal behavior. In addition to
the 2018 count of suicide deaths, Figure 9 includes data from an additional source: the
hospitalization and emergency department (ED) data collected from all acute care hospitals in
Tennessee. As shown in Figure 9, in addition to the 1,159 suicide deaths that occurred in 2018,
there were 7,854 ED visits and 2,648 inpatient hospitalizations for nonfatal intentional self-harm
injuries. Furthermore, as demonstrated in the next level of the pyramid, over 40,000 patients
were hospitalized or treated in the ED with suicidal ideation, but not self-harm injury. Combined,
the number of patients treated at acute care hospitals with either intentional self-harm injuries or
suicidal ideation is over forty times greater than the number of completed suicides alone.
The bottom layer of the pyramid represents cases that experience suicidal ideation or intentional
self-harm injury without receiving treatment at an acute care hospital. Because these individuals
do not visit the hospital and may receive no care at all, they cannot be captured using the
available surveillance systems and the true number is therefore unknown. According to the
Youth Risk Behavior Survey, in 2017, 8.3 percent of Tennessee high school students reported
attempting suicide in the prior 12 months but only 2.9 percent reported a suicide attempt
resulting in an injury, poisoning, or overdose that was treated by a doctor or nurse. Adult survey
data also indicate that the number of individuals who attempt or consider suicide is much
greater than what can be estimated from hospitalization data alone. Data from the 2017
National Survey on Drug Use and Health indicates that 4.3 percent of U.S. adults 18 and older
had thoughts of suicide in the past year and 0.6 percent attempted suicide, figures that would
translate to an estimated 226,000 and 31,000 Tennessee adults respectively.
Figure 9: Number of suicide deaths, nonfatal intentional self-harm injuries, and patients
with suicidal ideation but no self-harm injury, Tennessee, 2018
Suicide Death
1,159
Nonfatal Intentional
Self-Harm Injury
7,854 2,648
ED Visits Hospitalizations
Suicidal Ideation (No Injury)
28,104 12,187
ED Visits Hospitalizations
Suicide Attempts or Ideation Not Seen at the Hospital*
*Numbers are unknown because these are individuals that sought care somewhere
other than a hospital or did not seek care at all; however national estimates show
4.3% of adults has had suicidal ideation and .6% of adults have attempted suicide
without seeking care in an ED or being hospitalized making this the largest category.
Data Sources: Tennessee Department of Health, Division of Population Health Assessment, Hospital Discharge Data System;
Office of Vital Records and Statistics, Death Statistical File.
19 | P a g eFigure 10 demonstrates the trend of ED visits and inpatient hospitalizations due to nonfatal
intentional self-harm injuries for the past three years, 2016-2018. Over this time frame, the
number of patients remained fairly consistent, with slight decreases each year. Data is not
shown for a longer time frame because 2016 is the first full year of hospital data to utilize the
International Classification of Diseases, Tenth Revision, Clinical Modification (ICD-10-CM)
coding system. Prior years used the Ninth Revision (ICD-9-CM) and data collected using the
two coding schemes are not comparable.
Figure 10: Number of ED visits and inpatient hospitalizations for nonfatal intentional self-
harm injury, Tennessee, 2016-2018
ED Visits Inpatient Hospitalizations
10,000
Number of Patients
8,058 7,938 7,854
8,000
6,000
4,000
2,737 2,688 2,648
2,000
0
2016 2017 2018
Data Source: Tennessee Department of Health, Division of Population Health Assessment, Hospital Discharge Data System.
Figure 11 includes data for ED visits and inpatient hospitalizations with suicidal ideation over
the same time frame. In contrast to the trend seen for intentional self-harm injuries, the number
of patients treated with suicidal ideation increased substantially from 2016 to 2018.
Figure 11: Number of ED visits and inpatient hospitalizations with suicidal ideation,
Tennessee, 2016-2018
ED Visits Inpatient Hospitalizations
30,000 28,104
26,539
Number of Patients
25,000 22,018
20,000
15,000 12,187
8,979
10,000
5,184
5,000
0
2016 2017 2018
Data Source: Tennessee Department of Health, Division of Population Health Assessment, Hospital Discharge Data System.
20 | P a g eSex/Gender
The breakdown by sex for inpatient hospitalizations and ED visits showed a different trend
compared to that seen for suicide deaths. Females made up just 24% of suicide deaths in 2018,
but as shown in Figure 12, females made up the majority of patients treated in the ED (61%)
and hospitalized (58%) for nonfatal intentional self-harm injuries. Patients treated for suicidal
ideation with no accompanying intentional self-harm injury were split evenly across males and
females. This difference in the gender breakdown for suicide death versus intentional self-harm
injury ED visits and hospitalizations relates to choice of method: men are more likely to use
firearms while females more often use less lethal methods such as poisoning.
Figure 12: Percent of patients by sex for ED visits and inpatient hospitalizations,
Tennessee, 2016-2018
Female Male
Nonfatal Intentional Self-Harm Injury 61% 39%
ED Visits
st
si
i
V
D
E Suicidal Ideation 45% 55%
Hospitalizations
ns Nonfatal Intentional Self-Harm Injury 58% 42%
ati
o
zi
al
ti
Suicidal Ideation 50% 50%
os
p
H
0% 20% 40% 60% 80% 100%
Percent of Patients by Sex
Data Source: Tennessee Department of Health, Division of Population Health Assessment, Hospital Discharge Data System.
Method of Intentional Self-Harm Injury
Figure 13 demonstrates the methods of injury for ED visits and hospitalizations. The most
common methods of injury differed greatly for nonfatal intentional self-harm injury ED visits and
hospitalizations compared to suicide deaths. Firearms consistently account for the majority of
deaths by suicide in Tennessee; however, for the nonfatal ED visits and hospitalizations,
firearms were the method of injury used for only a small percentage of patients (0.5% of ED
visits and 2% of hospitalizations). The second most common method of suicide death, hanging,
was also almost entirely absent among the nonfatal injury cases: hanging represented nearly
one in four (24%) suicide deaths in 2018, but just one percent of both ED visits and
hospitalizations.
Poisoning was the method of injury for the majority of ED visits and inpatient hospitalizations for
nonfatal intentional self-harm injuries in 2018. This method, which accounted for just 10% of
suicide deaths in 2018, made up 57% and 88% of ED visits and inpatient hospitalizations,
21 | P a g erespectively. The vast majority (approximately 95%) of both the ED visits and inpatients
hospitalizations due to intentional poisoning were drug overdoses, while the remaining five
percent were nondrug poisonings involving substances such as ethanol, isopropyl alcohol, and
carbon monoxide from motor vehicle exhaust. Among the drug overdoses, the most common
substances used were benzodiazepines (which include familiar brand names such as Valium
and Xanax) and acetaminophen (most common brand name is Tylenol).
Intentional self-harm by sharp object, or cutting, was the next most common method for both ED
visits and hospitalizations, though it was a distant second among hospitalizations (5% of cases)
and a much more sizeable proportion among ED visits. About one in four (26%) of the self-harm
injuries treated in the ED were due to cutting. This again differed sharply with the methods seen
for suicide deaths, where cutting represented just 1% of cases.
Figure 13: Percent of patients by method of injury for ED visits and inpatient
hospitalizations, Tennessee, 2016-2018
Poisoning 57%
st Sharp Object 26%
ED Visits
si
i
V Hanging 1%
D
E Firearms 0.5%
Other/Unspecified 15%
Poisoning 88%
Hospitalizations
ns
Sharp Object 5%
ati
o
zi Hanging 1%
al
ti Firearms 2%
os
p Other/Unspecified 4%
H
0% 20% 40% 60% 80% 100%
Percent of Patients by Method of Injury
Data Source: Tennessee Department of Health, Division of Population Health Assessment, Hospital Discharge Data System.
Sex/Gender
Figure 14 demonstrates the methods of injury for nonfatal intentional self-harm injury ED visits
and inpatient hospitalizations by sex. This reveals that poisoning was a particularly common
method for female patients treated in the ED or hospitalized for self-harm injuries, accounting for
64% of ED visits and 94% of hospitalizations compared to 47% and 80% for men. Self-harm by
sharp object, otherwise known as cutting, was the method of injury for comparatively large
proportions of male patients: this was the method used for 29% of male patients seen in the ED
(compared to 24% of female patients) and 8% of hospitalized male patients (compared to 2% of
female patients). As previously stated, the percentage of nonfatal injuries due to firearm and
hanging were extremely low for both male and female patients, but the number of patients
injured using these methods was larger for men than for women.
22 | P a g eFigure 14: Percent of patients by sex and method of injury for ED visits and inpatient
hospitalizations, Tennessee, 2016-2018
Female Male
Poisoning 64%
47%
Sharp Object 24%
ED Visits
st 29%
si
i 0.3%
V Hanging
1%
D
E 0.2%
Firearms
1%
Other/Unspecified 11%
22%
Poisoning 94%
80%
Hospitalizations
ns 2%
Sharp Object
8%
ati
o 0.4%
zi Hanging
2%
al
ti
1%
Firearms
os 4%
p 3%
H Other/Unspecified
6%
0% 20% 40% 60% 80% 100%
Percent of Patients by Method of Injury
Data Source: Tennessee Department of Health, Division of Population Health Assessment, Hospital Discharge Data System.
Race
Figures 15 and 16 show the three year trend by race for nonfatal intentional self-harm injuries
and suicidal ideation, with ED visits and inpatient hospitalizations combined. For both intentional
self-harm injuries and suicidal ideation, the age-adjusted rates were higher for white
Tennesseans each year, but the gap was narrower than that seen for suicide death. To
compare, in 2018: i) the rate of suicide death was 147.5% higher for Whites than Blacks; ii) the
rate of self-harm injury was 40.6% higher for Whites than Blacks; and iii) the rate of suicidal
ideation was just 4.0 percent higher for Whites than Blacks. Black Tennesseans also
experienced sharper increases during the three year time frame shown. For intentional self-
harm injuries, the rate for whites decreased slightly while the rate for blacks marginally
increased. For suicidal ideation, both groups increased significantly in 2018 compared to 2016,
with a 55% increase for blacks and 42% increase for whites. This increase in the rate of hospital
encounters for suicidal ideation in the black population was primarily driven by black females.
23 | P a g eFigure 15: Age-adjusted rate of nonfatal intentional self-harm injury inpatient
hospitalizations and ED visits (combined) by race, Tennessee, 2016-2018
200 TN overall Black White
183.3
Age-Adjusted Rate per 100,000 Population
177.8 174.1
180
160 170.1 167.1 164.2
140
120
120.3 123.8
116.7
100
80
60
40
20
0
2016 2017 2018
Data Source: Tennessee Department of Health, Division of Population Health Assessment, Hospital Discharge Data System.
Figure 16: Age-adjusted rate of suicidal ideation inpatient hospitalizations and ED visits
(combined) by race, Tennessee, 2016-2018
TN overall Black White
700
Age-Adjusted Rate per 100,000 Population
623.5
600 560.4 615.6
599.7
547.3
500
438.1 504.6
424.1
400
386.3
300
200
100
0
2016 2017 2018
Data Source: Tennessee Department of Health, Division of Population Health Assessment, Hospital Discharge Data System.
24 | P a g eAge
As stated in the previous section, the rate of nonfatal intentional self-harm injury and suicidal
ideation differed substantially across age groups. Figure 17 presents the age-specific rates for
self-harm injury and suicidal ideation. Youths between the ages of 15 and 24 experienced the
highest rates for both self-harm injury and suicidal ideation. This trend differed significantly from
that seen for suicide death with the 2018 rate of suicide death highest for individuals aged 45 to
64.
Figure 17: Rate of nonfatal intentional self-harm injury and suicidal ideation inpatient
hospitalizations and ED visits (combined) by age group, Tennessee, 2016-2018
Nonfatal Intentional Self-Harm Injury Suicidal Ideation (No Injury)
900 852.3
800
Rate per 100,000 Population
734.3
700
600 521.3 540.8
500
397.0
400
300 220.8
203.4 191.6
200 118.6 136.3
100 31.5 14.7
0
10-14 yrs 15-24 yrs 25-44 yrs 45-64 yrs 65-84 yrs 85+ yrs
Age Group
Data Source: Tennessee Department of Health, Division of Population Health Assessment, Hospital Discharge Data System.
Cost
In addition to the emotional trauma associated with receiving care for intentional self-harm injury
or suicidal ideation, medical treatment for these issues incurs a significant financial cost.
Figure 18 demonstrates the average total charge for an intentional self-harm injury
hospitalization by age group. For each successive age group, the average total charges climbed
higher, reaching a peak of $54,004 for hospitalizations of patients 75 and older. This amount
was three times the average charge associated with hospitalizations of patients in the youngest
age category, which included individuals aged 10 to 14. The higher average charge for
hospitalizations of older patients is related to the fact that these individuals also remained in the
hospital for longer: the average length of stay for patients aged 75 and older was approximately
seven days, compared to two days for patients aged 10 to 14. This increased cost and length of
hospital stay is a result of medical complications associated with injuries of older individuals.
Together, the total cost associated with all intentional self-harm ED visits and hospitalizations in
2018 was over $150 million, and the total cost of ED visits and hospitalizations of patients with
suicidal ideation was over $500 million.
25 | P a g eFigure 18: Average total charge in dollars for nonfatal intentional self-harm
hospitalization by age group, Tennessee, 2016-2018
All ages $35,225
10-14 years $17,911
15-24 years $25,169
Age Group
25-44 years $34,485
45-64 years $43,736
65-74 years $47,185
75+ years $54,004
0 10,000 20,000 30,000 40,000 50,000 60,000
Average Total Charge (Dollars)
Data Source: Tennessee Department of Health, Division of Population Health Assessment, Hospital Discharge Data System.
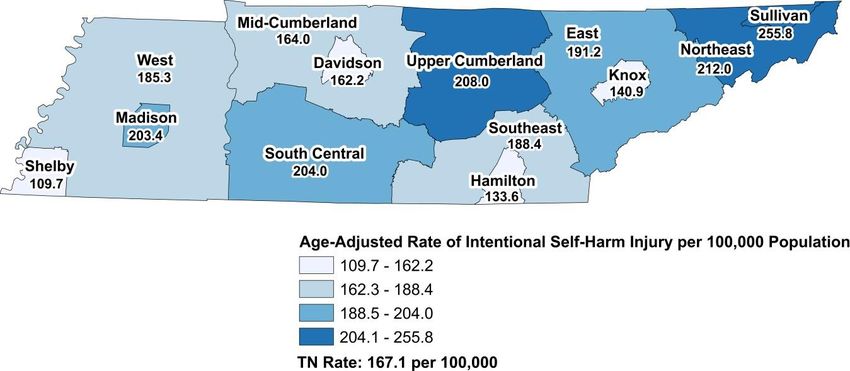
Geographic Distribution of Intentional Self-Harm Injury and Suicidal Ideation in
Tennessee
Figure 19 demonstrates the geographic distribution of intentional self-harm injury inpatient
hospitalizations and ED visits by region for 2016-2018. The rates presented are age-adjusted,
as the age distributions within regions are different (which some regions having older
populations while others are relatively young). The lowest statewide rate of intentional self-harm
injury was for Shelby County. This reflected the pattern seen for suicide death, where Shelby
County also had a much lower rate than any other region. The highest statewide rate was for
Sullivan County, which had a rate of self-harm injury that was significantly higher than
Tennessee as a whole and over twice as high as Shelby County. Notably, the four major metros
of Tennessee (Shelby, Davidson, Hamilton, and Knox) all had rates of intentional self-harm
injury below the statewide average.
Figure 19: Age-adjusted rate of intentional self-harm injury inpatient hospitalizations and
ED visits (combined) by region, 2016-2018
Data Source: Tennessee Department of Health, Division of Population Health Assessment, Hospital Discharge Data System .
26 | P a g eFigure 20 demonstrates a similar trend for ED visits and hospitalizations with suicidal ideation:
residents of Sullivan County were again found to experience the highest rates in the state by far.
The rate of suicidal ideation-related ED visits and hospitalizations was over twice as high for
Sullivan County as for the state as a whole, and over four times as high as the rate for Madison
County, which was the lowest in the state. Shelby County once again fell into the lowest
category, as only Madison County had a lower rate of suicidal ideation-related hospital visits.
Figure 20: Age-adjusted rate of suicidal ideation-related inpatient hospitalizations and ED
visits (combined) by region, 2016-2018
Data Source: Tennessee Department of Health, Division of Population Health Assessment, Hospital Discharge Data System .
Youth Risk Behavior Survey Data4
The 2017 Youth Risk Behavior Surveillance System, a survey administered to high school
students, provides information on risk factors for suicide deaths including suicide ideation and
attempts. Results from the survey shows that about 1 in 6 (16.5%) high school students in
Tennessee seriously considered taking their lives. There are gender disparities in suicide
ideation. In 2017, more Tennessee female (22.7%) than male high school students (10.2%)
seriously considered attempting suicide. Also, approximately 1 in 12 (8.3%) high school
students attempted suicide, with more females (10.8%) than males (5.7%) reporting attempted
suicide . Lastly in 2017, about one in every thirty-three (2.9%) Tennessee high school students
reported attempting suicide that ended up in an injury, overdose, or poisoning that required
treatment by a physician or nurse.
Behavioral Risk Factor Surveillance Survey5
In 2018, one in four Tennesseans (25.2%) reported to have been diagnosed with a form of
depression (i.e. depression, major or minor depression, or persistent depressive disorder), a risk
factor for suicidal behavior. The prevalence of depression is higher among females (32.6%) than
males (17.3%). In addition, depression affects people of various race/ethnicity differently. Over a
third (37.7%) of Tennesseans who identified as multiracial, non-Hispanic had the highest
prevalence of depression compared to non-Hispanic Tennesseans (26.7%) and non-Hispanic
Black Tennesseans (20.9%). Lastly, individuals aged 55-64 years reported the highest prevalence
of depression (31.5%) while those 65 years and older reported the lowest prevalence (18.7%).
4
CDC. Youth Risk Behavior Surveillance System. https://nccd.cdc.gov/youthonline/App/Default.as
5
Data Source: Behavioral Risk Factor Surveillance System (BRFSS). BRFSS Prevalence & Trends Data. 2018. Available from
https://www.cdc.gov/brfss/brfssprevalence/index.html
27 | P a g eSuicide Prevention Needs Assessment Survey Results
A statewide survey was conducted to gain insight to: identify gaps in mental health and suicide
prevention programs; determine the type of support needed for individuals at-risk for suicide;
and assess statewide collaborations among suicide prevention agencies. The survey was
distributed to mental health professionals, health professionals, school personnel, higher
education representatives and others with an interest in suicide prevention. Data from 281
respondents are reflected in the suggestions below. Respondents of the needs assessment
survey were asked what opportunities exist for improvement to suicide prevention in
Tennessee. The most common improvement opportunities reported by respondents included:
Increasing public awareness of suicide (67%)
Providing additional funding for suicide prevention (66%)
Increasing access to affordable mental health care (63%)
Promoting effective help-seeking behavior (62%)
Other reoccurring themes seen within survey responses on ways suicide prevention resources
and services could be improved across Tennessee included:
Better mental health coverage for the underserved and uninsured populations living in
Tennessee
Increased awareness of mental health and suicide prevention in the general population
Increased awareness about the suicide prevention trainings, programs, and services
available across the state
Increased access to mental health services in rural areas
Increased access to crisis and treatment services in rural areas
Crisis and treatment services tailored specifically for children and young adults
Implementation and use of a standardized statewide screening tool, such as the C-SSRS,
especially in primary care and pediatric offices
More thorough and increased suicide prevention trainings are needed in school systems
on both the faculty and peer level
A need for increased upstream prevention strategies to support families and reduce the
impact of adverse childhood experiences
28 | P a g eYou can also read


