Influence of low-level blocking and turbulence on the microphysics of a mixed-phase cloud in an inner-Alpine valley - Recent
←
→
Page content transcription
If your browser does not render page correctly, please read the page content below
Atmos. Chem. Phys., 21, 5151–5172, 2021
https://doi.org/10.5194/acp-21-5151-2021
© Author(s) 2021. This work is distributed under
the Creative Commons Attribution 4.0 License.

Influence of low-level blocking and turbulence on the microphysics
of a mixed-phase cloud in an inner-Alpine valley
Fabiola Ramelli1 , Jan Henneberger1 , Robert O. David2 , Annika Lauber1 , Julie T. Pasquier1 , Jörg Wieder1 ,
Johannes Bühl3 , Patric Seifert3 , Ronny Engelmann3 , Maxime Hervo4 , and Ulrike Lohmann1
1 Institutefor Atmospheric and Climate Science, ETH Zurich, Zurich, Switzerland
2 Department   of Geosciences, University of Oslo, Oslo, Norway
3 Leibniz Institute for Tropospheric Research, Leipzig, Germany
4 Federal Office of Meteorology and Climatology MeteoSwiss, Payerne, Switzerland

Correspondence: Fabiola Ramelli (fabiola.ramelli@env.ethz.ch) and Jan Henneberger (jan.henneberger@env.ethz.ch)

Received: 25 July 2020 – Discussion started: 1 September 2020
Revised: 18 February 2021 – Accepted: 19 February 2021 – Published: 1 April 2021

Abstract. Previous studies that investigated orographic pre-       pated when the low-level flow turned from a blocked to an
cipitation have primarily focused on isolated mountain bar-        unblocked state. Our observations indicate that the low-level
riers. Here we investigate the influence of low-level block-       blocking (due to the downstream mountain barrier) created
ing and shear-induced turbulence on the cloud microphysics         an in-valley circulation, which led to the production of local
and precipitation formation in a complex inner-Alpine val-         updrafts and the formation of a low-level feeder cloud. Al-
ley. The analysis focuses on a mid-level cloud in a post-          though the feeder cloud did not enhance precipitation in this
frontal environment and a low-level feeder cloud induced           particular case (since the majority of the precipitation subli-
by an in-valley circulation. Observations were obtained from       mated when falling through a subsaturated layer above), we
an extensive set of instruments including ground-based re-         propose that local flow effects such as low-level blocking can
mote sensing instrumentation, in situ instrumentation on           induce the formation of feeder clouds in mountain valleys
a tethered-balloon system and ground-based precipitation           and on the leeward slope of foothills upstream of the main
measurements.                                                      mountain barrier, where they can act to enhance orographic
   During this event, the boundary layer was characterized by      precipitation through the seeder–feeder mechanism.
a blocked low-level flow and enhanced turbulence in the re-
gion of strong vertical wind shear at the boundary between
the blocked layer in the valley and the stronger cross-barrier
flow aloft. Cloud radar observations indicated changes in          1   Introduction
the microphysical cloud properties within the turbulent shear
layer including enhanced linear depolarization ratio (i.e.,        Mountains can alter and reorganize incoming weather sys-
change in particle shape or density) and increased radar re-       tems or force air masses to lift and thus produce a large pro-
flectivity (i.e., enhanced ice growth). Based on the ice par-      portion of the Earth’s annual precipitation (Roe, 2005). Be-
ticle habits observed at the surface, we suggest that riming,      sides the total amount of precipitation, also its spatial dis-
aggregation and needle growth occurred within the turbulent        tribution across the mountain range becomes of increasing
layer. Collisions of fragile ice crystals (e.g., dendrites, nee-   importance for public warning (e.g., avalanche, flash flood),
dles) and the Hallett–Mossop process might have contributed        water resources, hydropower production and winter tourism
to secondary ice production.                                       (Stoelinga et al., 2013). In addition to orographic lifting
   Additionally, in situ instrumentation on the tethered-          and the subsequent production of condensate, additional pro-
balloon system observed the presence of a low-level feeder         cesses are required to efficiently form precipitation-sized par-
cloud above a small-scale topographic feature, which dissi-        ticles within the lifetime of the cloud as it crosses the moun-
                                                                   tain barrier (e.g., Smith, 1979; Frei and Schär, 1998; Roe,

Published by Copernicus Publications on behalf of the European Geosciences Union.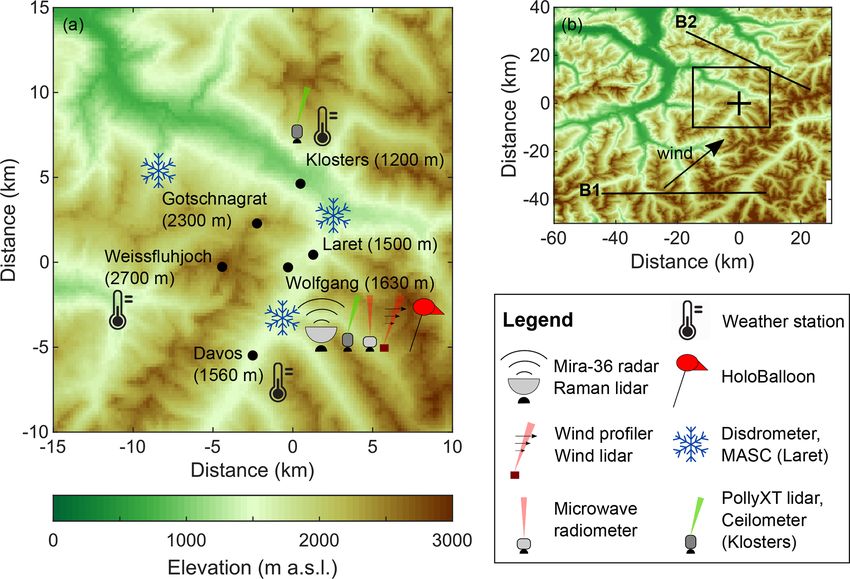
5152                                   F. Ramelli et al.: Influence of low-level blocking and turbulence on the microphysics

2005; Houze, 2012; Smith, 2019). As such, extensive knowl-          over the Oregon Cascade Mountains in regions where the
edge of these physical processes and the interplay between          vertical shear in the horizontal wind exceeded 10 m s−1 km−1
dynamics, microphysics and orography is essential to under-         (Houze and Medina, 2005). Houze and Medina (2005) sug-
stand precipitation formation over complex terrain.                 gested that these turbulent updraft cells can enhance ice
   Numerous mechanisms have been identified to affect the           growth through riming and aggregation. Both mechanisms
airflow and enhance orographic precipitation (e.g., Borys           can lead to rapid conversion of condensate to precipitation-
et al., 2003; Rotunno and Houze, 2007; Lowenthal et al.,            sized particles. More recent studies confirmed the findings
2011; Houze, 2012; Medina and Houze, 2015; Kirshbaum                by Houze and Medina (2005) that turbulent updraft cells en-
et al., 2018; Smith, 2019). For example, if the airflow im-         hance ice growth and precipitation (e.g., Medina and Houze,
pinging on a mountain barrier is sufficiently weak, the moun-       2015; Geerts et al., 2011; Aikins et al., 2016). However,
tain barrier is too high, or the atmosphere is stably stratified,   Geerts et al. (2011) could not draw any conclusions regard-
the low-level flow might be blocked or diverted around the          ing the dominant ice growth processes due to restrictions
mountain. As a consequence, a stagnant blocked layer can            in the aircraft flight level. On the other hand, Aikins et al.
form in front of the mountain barrier, which extends the ef-        (2016) proposed depositional growth and aggregation as the
fective width of the mountain barrier and causes lifting fur-       dominant ice growth mechanisms for their study rather than
ther upstream (e.g., Rotunno and Ferretti, 2001; Medina and         riming due to the low amounts of liquid water observed in
Houze, 2003; Jiang and Smith, 2003). Additionally, a layer          the shear layer. Thus, the dominant growth process within
of strong shear is usually present at the interface between         shear-induced turbulent layers depends on the environmental
the blocked layer and the strong cross-barrier flow aloft,          conditions such as temperature, updraft velocity, and the ice
which can be the source of turbulent motions. This shear-           crystal and cloud droplet size distributions.
induced turbulent layer can enhance orographic precipitation           This work builds on previous studies that investigated the
(e.g., Houze and Medina, 2005; Medina et al., 2005, 2007)           implications of shear-induced turbulence on the cloud mi-
and is the focus of the present study.                              crophysics and precipitation formation and extends the anal-
   Besides the dynamical response of the airflow to the orog-       ysis to a more complex terrain. While previous observa-
raphy, a wide range of microphysical interactions can occur         tional studies have mainly focused on the effect of an iso-
between cloud droplets, ice crystals and water vapor. For ex-       lated mountain barrier, we investigated the role of shear-
ample, individual ice crystals can grow by vapor deposition,        induced turbulence in an inner-Alpine valley near Davos,
can collide and stick together with other ice crystals (ag-         Switzerland. The region around Davos, or more generally
gregation), or can collide with supercooled cloud droplets          the Alpine region, is characterized by complex terrain with
that freeze upon contact (riming) (e.g., Pruppacher and Klett,      narrow valleys and multiple mountain barriers, which can
1980; Lohmann et al., 2016). Turbulence and updrafts can            cause complex interactions between numerous mechanisms
accelerate ice growth through riming and aggregation and            on different scales. This complexity has already been recog-
thus precipitation fallout by sustaining the production of su-      nized during the Mesoscale Alpine Programme (MAP) (e.g.,
percooled liquid water (Rauber and Tokay, 1991) and by              Rotunno and Houze, 2007). In an environment with a series
increasing the collision efficiencies between cloud particles       of parallel mountain ridges, a superposition of upstream and
(Pinsky et al., 2016). Furthermore, enhanced ice–ice colli-         downstream effects can occur. In the present study, we at-
sions can promote mechanical break-up of ice crystals and           tempt to investigate whether a “simple” conceptual mech-
lead to the production of a large number of small secondary         anism as described in Houze and Medina (2005) can also
ice particles (e.g., Vardiman, 1978; Yano et al., 2016). Ad-        be observed in a complex environment that is embedded be-
ditionally, riming can also produce secondary ice through           tween two mountain ridges and which is likely influenced
the Hallett–Mossop process, which is known to be active at          by upstream and downstream effects. In addition, we extend
temperatures between −3 and −8 ◦ C (Hallett and Mossop,             the analysis to lower altitudes, which were inaccessible in
1974).                                                              previous studies due to limits in the flight levels, by using a
   In this study, we investigate the influence of low-level         tethered-balloon system. The balloon-borne profiles can pro-
blocking and shear-induced turbulence on the microphysics           vide information on the microphysical cloud properties in the
and precipitation formation of a mixed-phase cloud in an            lowest part of the boundary layer. These questions are ad-
inner-Alpine valley. Previous studies found that flow block-        dressed in a case study on 7 March 2019, when a blocked
ing and shear-induced turbulence can facilitate rapid ice           low-level flow was observed in a post-frontal air mass dur-
growth and ultimately enhance orographic precipitation (e.g.,       ing the Role of Aerosols and CLouds Enhanced by Topogra-
Marwitz, 1983; Overland and Bond, 1995; Yu and Smull,               phy on Snow (RACLETS) campaign. The multi-instrument
2000; Hogan et al., 2002; Neiman et al., 2002; Neiman et al.,       analysis is based on (1) wind profiler and wind lidar mea-
2004; Houze and Medina, 2005; Loescher et al., 2006; Ol-            surements; (2) observations of a Ka-band polarimetric cloud
son et al., 2007; Olson and Colle, 2009; Geerts et al., 2011;       radar, a Raman lidar and a microwave radiometer; (3) in situ
Medina and Houze, 2015; Grazioli et al., 2015; Aikins et al.,       microphysical measurements on a tethered-balloon system;
2016). For example, turbulent updraft cells were observed           and (4) ground-based precipitation measurements.

Atmos. Chem. Phys., 21, 5151–5172, 2021                                              https://doi.org/10.5194/acp-21-5151-2021
F. Ramelli et al.: Influence of low-level blocking and turbulence on the microphysics                                      5153

   The main measurement locations and instruments are             lowing, we briefly describe the relevant instruments which
briefly described in Sect. 2. An overview of the synoptic         have been used in the present study. More information about
weather situation and the case study is given in Sect. 3. Sec-    the instrumentation can be found in Ramelli et al. (2020b).
tion 4 presents the influence of low-level blocking and shear-
induced turbulence on the cloud microphysics and precipita-       2.2   Instrument setup
tion formation. The findings are discussed in a larger context
and presented in a conceptual model in Sect. 5. A summary         A set of ground-based remote sensing and in situ instru-
of the main findings is given in Sect. 6.                         ments were installed at Wolfgang to study the microphysical
                                                                  cloud structure (Fig. 1a). A vertically pointing Ka-band cloud
                                                                  radar Mira-36 (METEK GmbH, Germany; Melchionna et al.,
2     Measurement location and instruments                        2008; Görsdorf et al., 2015; Löhnert et al., 2015) provided
                                                                  vertical profiles of radar reflectivity factor, Doppler veloc-
The RACLETS campaign took place from 8 February 2019              ity, Doppler spectra, spectral width and linear depolariza-
to 28 March 2019 in the region around Davos in the Swiss          tion ratio (LDR) with a vertical resolution of 31.17 m and
Alps. The main objective of the campaign was to investigate       a temporal resolution of 10 s. A PollyXT Raman and de-
the pathways of precipitation formation in orographic clouds,     polarization lidar (e.g., Engelmann et al., 2016) was de-
covering the entire aerosol–cloud–precipitation–snow distri-      ployed to study the aerosol and cloud properties. Moreover,
bution process chain, in order to improve our understand-         a 14-channel microwave radiometer (HATPRO, Radiometer
ing of orographic precipitation. The overall goal of the          Physics GmbH, Germany; Rose et al., 2005) provided in-
RACLETS campaign was to use the gained process under-             formation about the vertical temperature and humidity pro-
standing of orographic clouds to improve regional precipita-      files as well as the column-integrated water vapor content
tion forecasting in complex terrain. For this purpose, a multi-   (IWV) and liquid water path (LWP). In situ observations of
dimensional set of instruments and measurements were de-          the low-level microphysical cloud structure were obtained
ployed to provide a comprehensive dataset of orographic           with a tethered-balloon system (HoloBalloon; Ramelli et al.,
clouds (see also Ramelli et al., 2020b; Lauber et al., 2020;      2020a). The main component of the measurement platform
Mignani et al., 2020; Georgakaki et al., 2020).                   is the HOLographic cloud Imager for Microscopic Objects
                                                                  (HOLIMO), which can image cloud particles in the size
2.1    Measurement location                                       range of 6 µm to 2 mm (Henneberger et al., 2013; Beck et al.,
                                                                  2017; Ramelli et al., 2020a). It provides information about
A map of the instrument setup and the relevant measurement        the phase-resolved number concentration, water content, size
locations is shown in Fig. 1. Davos is located in the Swiss       distribution and particle shape. Additionally, a ceilometer
Alps in the eastern part of Switzerland. The Alpine mas-          (CL31, Vaisala, Finland) was installed at Klosters, which was
sif is oriented in a southwest–northeast direction and has a      used to identify the height of the cloud base (Fig. 1a).
mean ridge height of around 3000 m a.s.l., or 2400 m above           Observations of the three-dimensional wind fields were
the surrounding lowlands. The Alps represent a barrier for in-    obtained with a radar wind profiler (LAP-3000 Wind pro-
coming weather systems, which predominantly approach the          filer, Vaisala, Finland) and a wind lidar (Windcube 100S,
measurement location in Davos from the northwest or south.        Leosphere, France) at Wolfgang (Fig. 1a). The wind profiler
During the case study presented here, the large-scale flow        had a temporal resolution of 5 min and a vertical resolution of
was from the southwestern direction and thus followed ap-         200 m, whereas the wind lidar provided wind measurements
proximately the direction of the Davos valley. Weather sys-       with a higher vertical resolution of 50 m. The wind profiler
tems approaching Davos from the south are influenced by           was operated at a frequency of 1290 MHz. Both the wind
topography to a larger extent because the main ridge of the       profiler and wind lidar operated in Doppler beam swinging
Alps is located south of Davos (indicated by B1 in Fig. 1b).      (DBS) mode with one vertical and four oblique beams at an
    The main measurement locations consist of two mountain-       elevation angle of 75◦ from horizontal. Additionally, range
top stations (Weissfluhjoch: 2700 m; Gotschnagrat: 2300 m)        height indicator (RHI) scans were performed every 30 min in
and three valley stations (Wolfgang: 1630 m; Laret: 1500 m;       four different azimuth directions (0, 70, 180 and 250◦ ).
Klosters: 1200 m), which are located within a distance of            Precipitation was measured using a set of different ground-
10 km (see Fig. 1a). The region around Klosters and Davos         based precipitation instruments. Three particle size–velocity
is characterized by complex topography. The Klosters val-         (PARSIVEL) disdrometers (OTT Parsivel2, OTT HydroMet,
ley is oriented from northwest to southeast, and the el-          Germany; Tokay et al., 2014) were installed at Wolfgang
evation gradually increases from the lowlands (500 m) to          (1630 m), Laret (1500 m) and Gotschnagrat (2300 m), re-
1200 m. In contrast, the Davos valley is oriented in a            spectively (see Fig. 1a). PARSIVEL disdrometers can mea-
northeast–southwest direction. The height rapidly increases       sure the size and the fall velocity of hydrometeors falling
from Klosters (1200 m) towards Wolfgang (1630 m) before           through the sample volume independently. The particle size
it slowly decreases on the way to Davos (1560 m). In the fol-     is estimated from the signal attenuation, whereas the parti-

https://doi.org/10.5194/acp-21-5151-2021                                           Atmos. Chem. Phys., 21, 5151–5172, 2021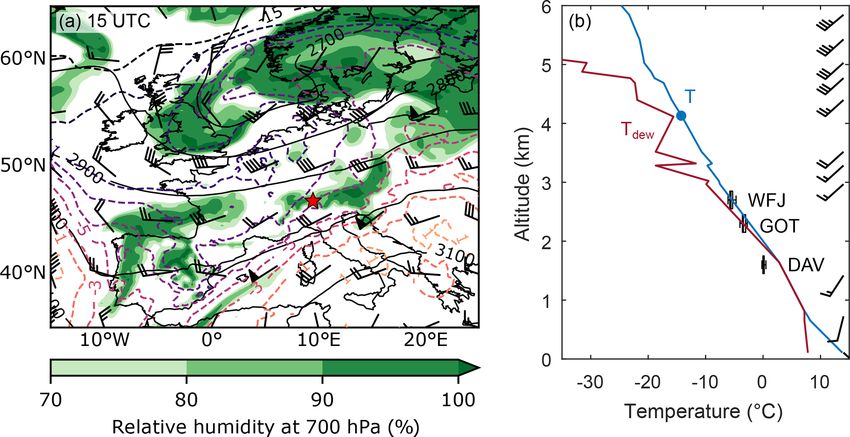
5154                                     F. Ramelli et al.: Influence of low-level blocking and turbulence on the microphysics

Figure 1. Overview of the measurement location and setup. The geographical location of Davos (black cross) and the surrounding topography
are shown in (b). The large-scale wind direction during the event is shown by the black arrow, and the relevant mountain barriers are indicated
by B1 (upstream mountain barrier) and B2 (downstream mountain barrier). An enlarged section of the measurement sites (black rectangle in
b) and the instrument setup are shown in (a). The elevation data were obtained from the digital height model DHM25 of the Federal Office
of Topography.

cle fall velocity is estimated from the duration of the mea-              light precipitation on the south side of the Alps with some
sured signal. Precipitation particles in the size range be-               spillover precipitation on the lee side (i.e., north side) of the
tween 0.2 and 25 mm can be measured by the disdrome-                      Alps. The case study was measured in the post-frontal air
ter with a temporal resolution of 30 s. Additionally, a multi-            mass between 16:00 and 20:00 UTC, when some spillover
angle snowflake camera (MASC) at Laret took photographs                   precipitation reached the measurement locations in the Davos
of hydrometeors from three different angles and measured                  region.
their fall velocity simultaneously (Garrett et al., 2012). The               The temperature at Davos (1600 m) was around 0 ◦ C dur-
MASC is sensitive to particles in the size range of 30 µm to              ing the entire observational period, whereas the temperature
3 cm. Lastly, a snow drift station was installed at Gotschna-             at Weissfluhjoch (2700 m) decreased from −4.5 to −6 ◦ C be-
grat, which provided information about the snow redistribu-               tween 16:00 and 20:00 UTC. Due to the lack of a sound-
tion at the ground and the low-level wind field (Walter et al.,           ing in the Davos area during the measurement period, the
2020).                                                                    vertical temperature profile of a radiosonde ascent from Mi-
                                                                          lan (Italy; at 12:00 UTC), which is located 150 km southwest
                                                                          of Davos, is shown instead (Fig. 2b). The sounding in Mi-
3   Description of the case study                                         lan is assumed to be representative of the upper air situa-
                                                                          tion in Davos as the airflow was from the southwest. In addi-
The observations presented in this case study were measured               tion, the temperatures measured at Gotschnagrat and Weiss-
in a post-frontal environment on 7 March 2019. The syn-                   fluhjoch were in good agreement with the temperature profile
optic situation over Europe was dominated by an occlud-                   of the radiosonde (within 1–2 ◦ C), whereas the temperature
ing low-pressure system (980 hPa) located east of the British             observed in Davos was slightly colder. A cloud top tempera-
Isles. As the low-pressure system continued to propagate to-              ture of around −14 ◦ C was estimated from the observed tem-
wards Scandinavia, it drove a cold front over the Alps, which             perature profile.
passed the measurement location at 08:00 UTC. Based on                       An overview of the microphysical cloud structure is shown
observations, rainfall of up to 50 mm was produced on the                 in Figs. 3 and 4. The cloud radar observations indicate the
southern side of the Alps during the passage of the cold                  presence of a mid-level cloud with a cloud top at around
front (not shown). By 15:00 UTC, southwesterly flow in the                4000 m. The highest reflectivities (> 5 dBZ) were observed
post-frontal air mass continued to advect cold air and mois-              between 2500 and 3500 m (Fig. 3a). The reflectivity de-
ture into the Alpine region (see Fig. 2a), which produced                 creased below 2500 m, suggesting the presence of a subli-

Atmos. Chem. Phys., 21, 5151–5172, 2021                                                      https://doi.org/10.5194/acp-21-5151-2021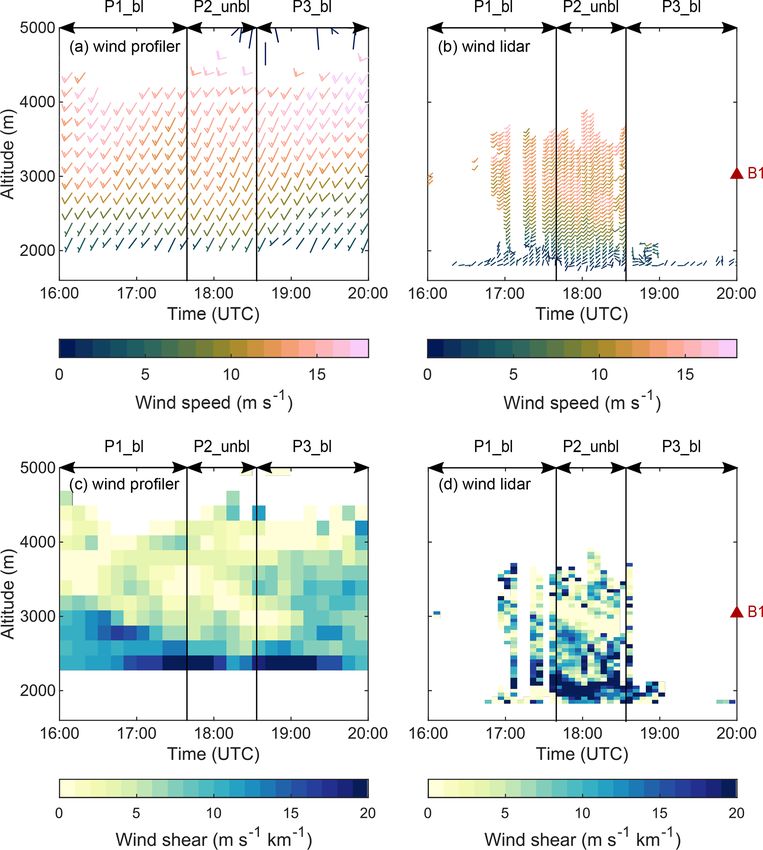
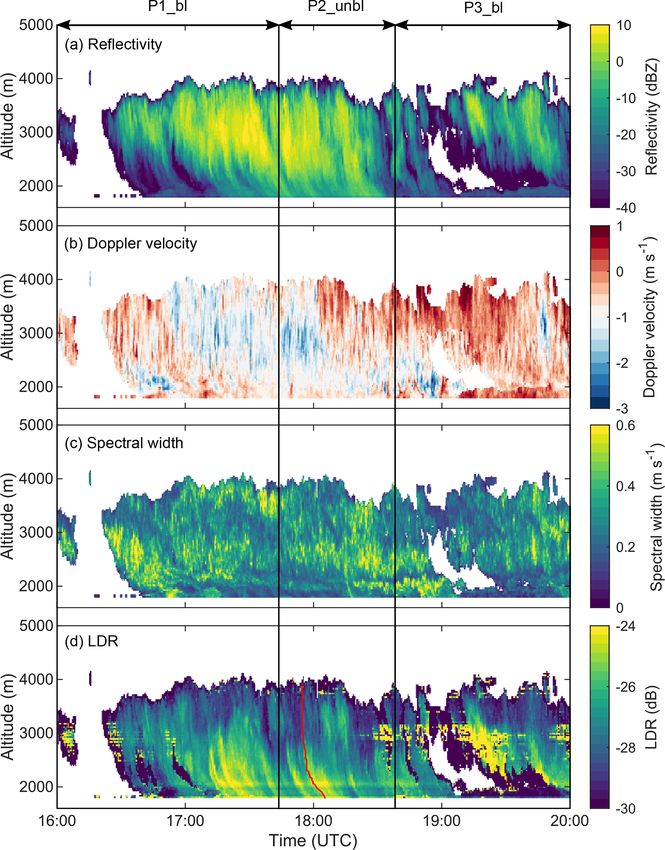
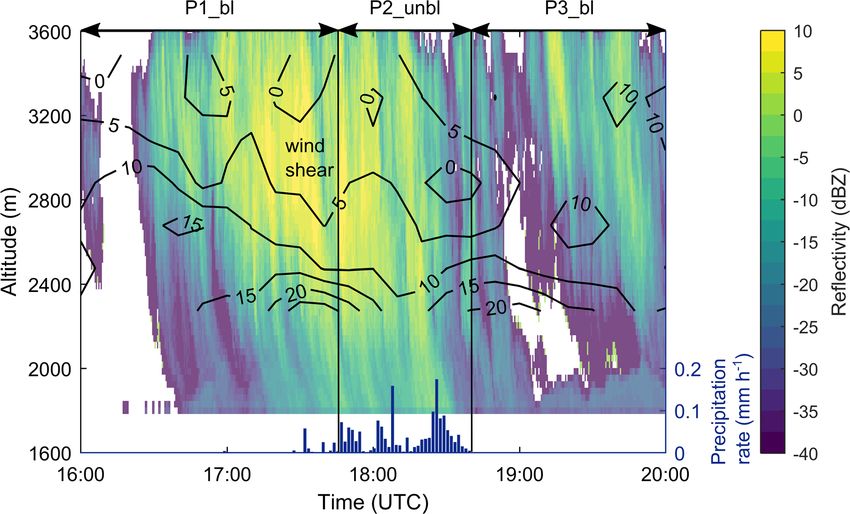
F. Ramelli et al.: Influence of low-level blocking and turbulence on the microphysics                                                   5155

Figure 2. Overview of the synoptic weather situation on 7 March 2019 showing a map of ERA5 reanalysis data at 700 hPa height with
a horizontal resolution of 0.25◦ (a) and the temperature profile of a radiosonde ascent (b). The reanalysis shows the relative humidity in
percent (colored area), the temperature in degrees Celsius (dashed lines), the geopotential height in meters (black lines), and the wind speed
and direction in knots (wind barbs) at the 700 hPa pressure level at 15:00 UTC (data obtained from the C3S Climate Data Store, dataset
by Hersbach et al., 2018). The 700 hPa pressure level was chosen as it represents the mean Alpine ridge height. The red star indicates the
measurement location. The radiosonde was launched from Milan (12:00 UTC; source: UQAM-Montreal Weather Centre) and shows the
temperature (blue) and dew point temperature (red) profiles. The boxplots in (b) show the temperature measured at Davos (DAV; 1600 m),
Gotschnagrat (GOT; 2300 m) and Weissfluhjoch (WFJ; 2700 m) during the measurement period. The cloud top temperature (−14 ◦ C) and
height (4000 m; estimated from cloud radar observations averaged between 17:00 and 18:30 UTC) are indicated by the blue dot. The wind
barbs are shown on the right side.

mation layer. The Doppler velocity showed mainly regions                 fallstreaks at altitudes below 3000 m (Fig. 3d). The band of
with negative Doppler velocity (Fig. 3b). Positive Doppler               enhanced LDR at 2100 m, which was visible during the en-
velocities (i.e., updrafts) were only observed after 18:00 near          tire measurement period, shows the effects of ground clutter
the cloud top and after 19:00 UTC near the ground. Addi-                 (i.e., echoes received from objects on the ground or sidelobes
tionally, several regions of enhanced spectral width were ob-            reflected from nearby mountains).
served (Fig. 3c). High values in the spectral width can be the              The lidar signal was mainly attenuated due to the pres-
result of enhanced turbulence and/or indicate the presence               ence of a low-level liquid cloud (Fig. 4). When the low-level
of multiple particle populations with different fall speeds              liquid cloud dissipated (17:45–18:40 UTC), the lidar signal
(e.g., Shupe et al., 2004, 2006). The linear depolarization              indicated the presence of an embedded liquid layer at an al-
ratio (LDR) ranged between −32 and −22 dB (Fig. 3d)                      titude of around 3500 m. This can be seen by the enhanced
and provides information about the shape and density of                  attenuated backscatter signal (Fig. 4a) and the low lidar de-
cloud particles. A perfectly spherical particle (e.g., small             polarization ratio (Fig. 4b). Indeed, the LWP measured by
cloud droplet) has no depolarization and thus has an LDR                 the microwave radiometer ranged between 20 and 100 g m−2
of −∞ dB, whereas a particle with a high aspect ratio has an             during the measurement period (Fig. 4c), suggesting the pres-
LDR close to 0 dB. The LDR of a specific hydrometeor type                ence of liquid water in some regions (likely at the top) of the
depends on the elevation angle (North et al., 2014). Since a             mid-level cloud.
vertically pointing cloud radar was used in this study, the ob-             The case study was divided into three periods: period
served LDR signal can only differentiate between isometric               P1_bl (16:00–17:45 UTC) and P3_bl (18:40–20:00 UTC)
particles (e.g., droplets, plates, dendrites) and prolate parti-         were characterized by blocked low-level flow and the pres-
cles (e.g., needles, columns). Furthermore, the LDR depends              ence of a low-level liquid cloud at around 2000 m. The low-
on the particle refractive index. Liquid water has a higher re-          level blocking weakened, and the low-level feeder cloud dis-
fractive index (0.88 for Ka-band) than ice (0.197) (Houze,               sipated during period P2_unbl (17:45–18:40 UTC). In the
2014). For ice particles, the refractive index is related to the         following, we characterize the dynamics of the flow during
particle density, such that hail and graupel have a higher               the measurement period (Sect. 4.1). In a second step, we in-
refractive index compared to snowflakes (Bringi and Chan-                vestigate the influence of shear-induced turbulence on the
drasekar, 2001). Therefore, changes in the LDR are indica-               cloud microphysics and precipitation formation (Sect. 4.2).
tive of changes in the particle shape and/or particle density            Lastly, the role of the low-level blocking for the formation of
(e.g., riming). The LDR signal was enhanced locally in some              a low-level feeder cloud is discussed in Sect. 4.3.

https://doi.org/10.5194/acp-21-5151-2021                                                    Atmos. Chem. Phys., 21, 5151–5172, 2021
5156                                     F. Ramelli et al.: Influence of low-level blocking and turbulence on the microphysics

Figure 3. Cloud radar observations of the radar reflectivity (a), Doppler velocity (b), spectral width (c) and linear depolarization ratio (d)
measured on 7 March 2019. Note that the color bar in (b) is centered at −1 m s−1 to approximately account for the hydrometeor fall speed.
The red line in panel (d) indicates the track of the 18:00 UTC LDR fallstreak, which is investigated in Fig. 10. The measurement period
is divided into three periods, where P1_bl and P3_bl indicate blocked low-level flow, and P2_unbl indicates unblocked low-level flow (see
Sect. 4.1 for more details).

4     Results                                                            wind lidar revealed a second layer of increased wind speed
                                                                         between 2500 and 3000 m (Fig. 5b), which was not cap-
4.1    Low-level flow blocking and wind shear                            tured by the wind profiler due to its lower resolution. The
                                                                         layer of increased wind speed lowered between 17:00 and
The horizontal wind fields were measured with a radar wind               18:30 UTC, suggesting stronger downward propagation of
profiler and a wind lidar at Wolfgang (Fig. 5). Both wind                the cross-barrier flow. The large-scale wind direction was
profiler and wind lidar data are shown as the wind lidar was             from the southwest. Only in the lowest 100 m of the bound-
attenuated during most of P1_bl and P3_bl due to the pres-               ary layer was a flow from the northeast observed by the wind
ence of a low-level liquid cloud (see Sect. 4.3). The wind               lidar.
speed measured by the wind profiler increased from around                   The counterflow at low levels with respect to the large-
4 m s−1 at 2200 m up to 18 m s−1 at 3500 m (Fig. 5a). The                scale flow as well as the low wind speed close to the sur-

Atmos. Chem. Phys., 21, 5151–5172, 2021                                                     https://doi.org/10.5194/acp-21-5151-2021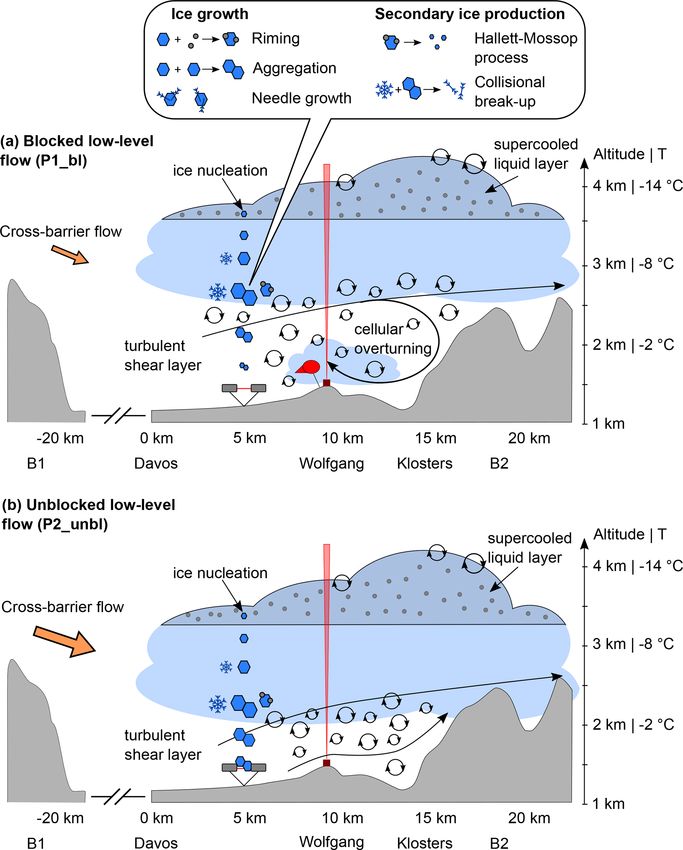
F. Ramelli et al.: Influence of low-level blocking and turbulence on the microphysics                                                      5157

Figure 4. Observations of the (lidar) attenuated backscatter coefficient (a), the lidar linear depolarization ratio (b) and the liquid water path
measured by the microwave radiometer (c). The measurement period is divided into three periods, where P1_bl and P3_bl indicate blocked
low-level flow, and P2_unbl indicates unblocked low-level flow (see Sect. 4.1 for more details).

face is indicative of blocked low-level flow (e.g., Houze and              P3_bl at the valley stations in Davos (Davos, Davos Seehorn-
Medina, 2005). More specifically, the low-level flow at Wolf-              wald, Wolfgang), indicating that the low-level flow changed
gang might have been too weak to ascend over the moun-                     from a blocked (P1_bl, P3_bl) to an unblocked (P2_unbl)
tain barrier located downstream of Wolfgang (B2 in Fig. 1b)                state during the event (see also Fig. 7 for the temporal evo-
and might have generated a counterflow when it impinged on                 lution at Wolfgang). The flow at Klosters Gatschiefer was
the mountain barrier. To test this hypothesis and to study the             still blocked during P2_unbl, suggesting that the blocking
observed pattern in the low-level wind field in more detail,               became weaker and moved closer to the mountain barrier B2
wind measurements from different valley and mountaintop                    located downstream.
weather stations around Davos and Klosters were analyzed                      From a theoretical perspective, the Froude number can be
(Fig. 6). Several valley stations (Davos, Davos Seehorn-                   used to estimate whether a flow that encounters a mountain
wald, Wolfgang, Klosters Gatschiefer) observed the pres-                   barrier can pass over the mountain barrier or not (Smith,
ence of a counterflow (i.e., wind from northeastern direc-                 1979; Durran, 1990; Rotunno and Houze, 2007; Houze,
tion), indicative of blocked low-level flow. The wind pattern              2012). The Froude number Fr is given by the following equa-
at Klosters Madrisa, which is located immediately below the                tion:
mountain barrier B2, was more diverse, showing large varia-
                                                                                   U
tions in the prevailing wind direction. The mountaintop sta-               Fr =      ,                                                       (1)
tions (Weissfluhjoch, Gotschnagrat, Klosters Sant Jaggem)                         hN
observed wind from the south and southwestern direction in                 where U is the wind speed perpendicular to the mountain
accordance with the large-scale wind direction. Therefore,                 barrier, h is the height of the mountain barrier, and N is
the observed wind pattern at the different locations supports              the Brunt–Väisälä frequency (Colle et al., 2013). The Froude
the hypothesis of a blocked low-level flow. It is important to             number was below 1 for all periods (see Appendix A and
note that a counterflow was only observed during P1_bl and                 Fig. 7), indicating that the low-level flow was blocked. The

https://doi.org/10.5194/acp-21-5151-2021                                                      Atmos. Chem. Phys., 21, 5151–5172, 2021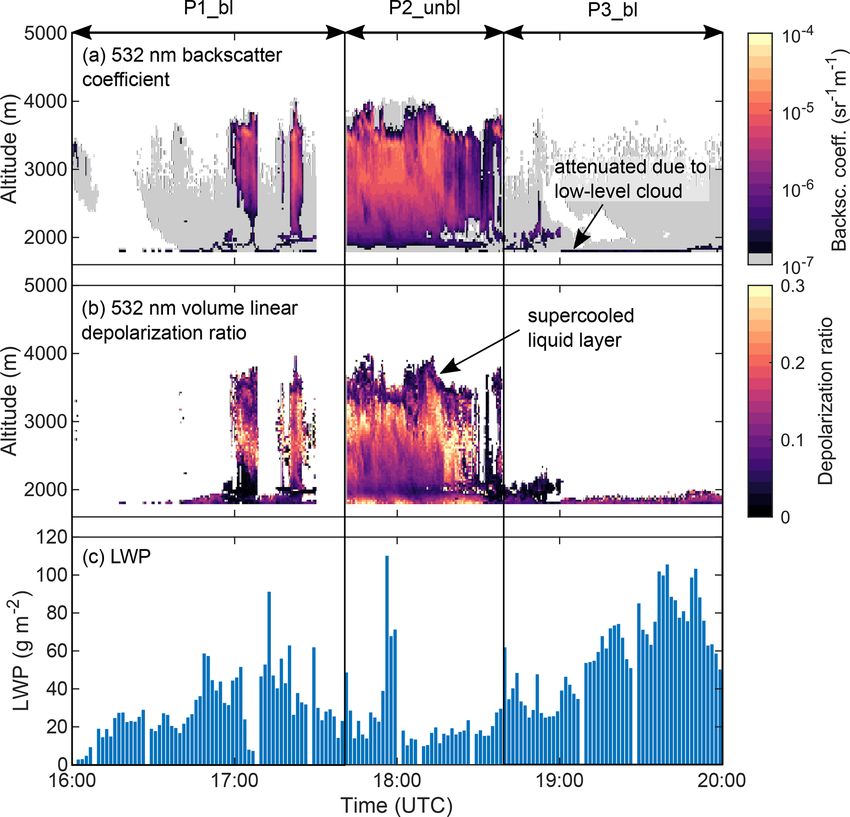
5158                                     F. Ramelli et al.: Influence of low-level blocking and turbulence on the microphysics

Figure 5. Vertical profiles of the horizonal wind speed and direction (a, b) and vertical shear in the horizontal wind (c, d) measured by the
radar wind profiler (a, c) and wind lidar (b, d). The vertical wind shear was calculated from the wind observations, considering changes in
the horizontal wind speed between two adjacent height levels. The red triangle symbol on the right side indicates the mean height of the
upstream mountain barrier B1 (see Fig. 1b).

Froude number increased from 0.75 during P1_bl to 0.94                   influence of the downward-propagating cross-barrier flow
during P2_unbl (Fig. 7), suggesting that the blocking became             weakened, and the strength of the low-level blocking in-
weaker during P2_unbl. We refer to period P2_unbl as un-                 creased again at around 18:30 UTC, the shear layer ascended
blocked flow as no counterflow was observed during this pe-              (Fig. 5c). Thus, the height of the shear layer might be de-
riod at Wolfgang (Fig. 7), even though it can be seen that               termined by a delicate balance of upstream (e.g., blocking)
the flow at low levels was still slowed down, and the Froude             and downstream (e.g., cross-barrier flow) effects as Wolf-
number was slightly below 1. Period P2_unbl could also be                gang is located in an inner-Alpine valley and surrounded by
regarded as a weaker blocking.                                           multiple mountain barriers. Sloping shear features have also
   The wind profiler and wind lidar indicated the presence               been observed in connection with synoptic-scale frontal sys-
of a region of strong vertical wind shear (> 10 m s−1 km−1 )             tems (e.g., Keyser and Shapiro, 1986; Chapman and Brown-
at the boundary between the blocked layer in the valley                  ing, 2001), where similar vertical wind shear values have
and the stronger cross-barrier flow aloft (Fig. 5c and d).               been measured (Chapman and Browning, 2001). The obser-
The region of enhanced vertical wind shear descended from                vations presented here cannot provide conclusive evidence
3000 to 2000 m between 16:00 and 18:00 UTC (Fig. 5c) in                  about whether the observed wind and shear patterns were
accordance with the weaker blocking and stronger down-                   orographically or synoptically driven. We suggest that the
ward propagation of the cross-barrier flow (Fig. 7). As the              sloping shear feature was influenced – at least to some ex-

Atmos. Chem. Phys., 21, 5151–5172, 2021                                                     https://doi.org/10.5194/acp-21-5151-2021
F. Ramelli et al.: Influence of low-level blocking and turbulence on the microphysics 5159
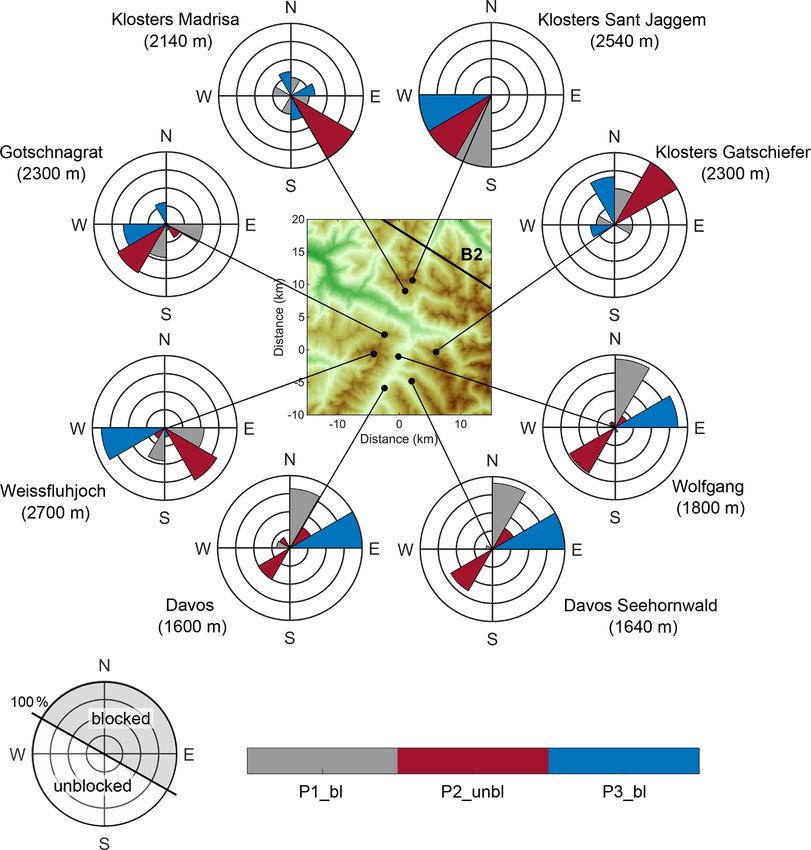
Figure 6. Wind observations at different weather stations around Davos and Klosters, indicating the wind direction observed during the time
periods P1_bl (gray), P2_unbl (red) and P3_bl (blue). The wind directions in the different periods were normalized and binned in sectors of
90◦ (NE, SE, SW, NW). Each line indicates 25 %. The example wind rose on the bottom left shows the wind directions during a blocked
(gray)/unblocked (white) low-level flow in the Davos valley. The wind observations at the weather stations in Davos had a temporal resolution
of 10 min, whereas the stations around Klosters had a temporal resolution of 30 min. The measurements at Wolfgang were obtained from the
wind lidar observations at an altitude of 1800 m and the measurements at Gotschnagrat from a 3D ultrasonic anemometer that was an integral
part of the snow drift station.
tent – by the orography as the height of the shear layer was 4.2 Influence of shear-induced turbulence on the cloud
related to the altitude of the upstream mountain barrier B1 microphysics
and the strength of the blocking and downward-propagating
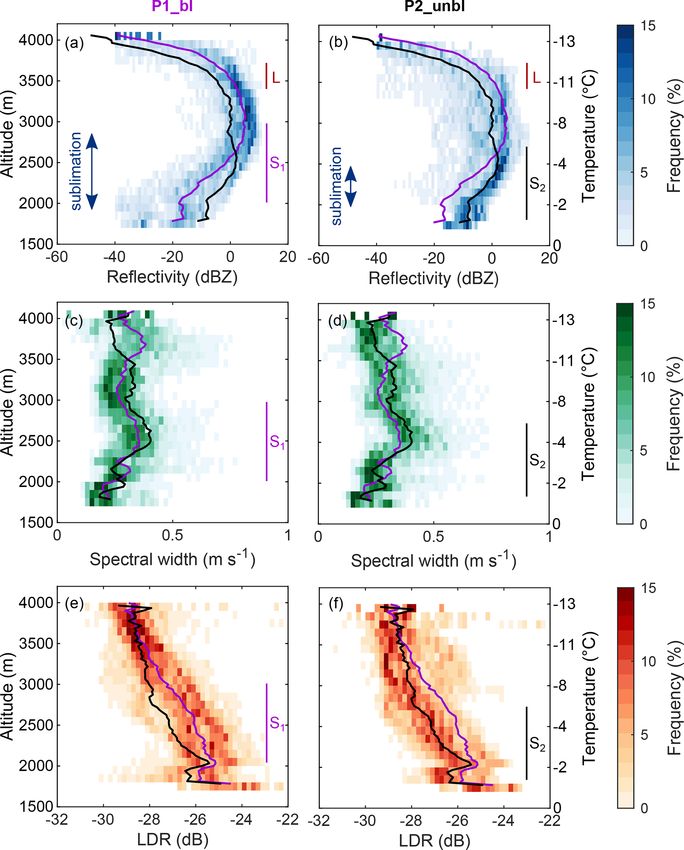
cross-barrier flow (Figs. 5c and d and 7). Contour-frequency-by-altitude diagrams (CFADs) are a use-
Regardless of the formation mechanism, wind shear can ful tool for analyzing the magnitude and the vertical fre-
be a source of turbulence and have important implications quency distribution of cloud properties (e.g., Yuter and
for cloud microphysics. Houze and Medina (2005) defined Houze, 1995). CFADs of the cloud radar reflectivity (a and
a critical threshold of 10 m s−1 km−1 for the formation of b), spectral width (c and d) and LDR (e and f) are shown
shear-induced turbulent cells. The observed wind shear (10– in Fig. 8 averaged over sub-periods of P1_bl (a, c and e)
20 m s−1 km−1 ) was above this threshold value in the entire and P2_unbl (b, d and f). A strong increase in the radar re-
shear layer, suggesting that turbulent cells were embedded flectivity was observed near the cloud top (Fig. 8a and b),
within the shear layer. In the following section, we charac- indicative of ice formation and growth between 4000 and
terize the microphysical cloud structure and investigate the 3500 m. Since the region of rapid increase in radar reflec-
influence of shear-induced turbulence on the cloud micro- tivity was coincident with the height of the supercooled liq-
physics and precipitation formation. uid layer measured by the Raman lidar (L in Fig. 8a and b),
it is likely that this supercooled liquid layer played an im-
https://doi.org/10.5194/acp-21-5151-2021 Atmos. Chem. Phys., 21, 5151–5172, 2021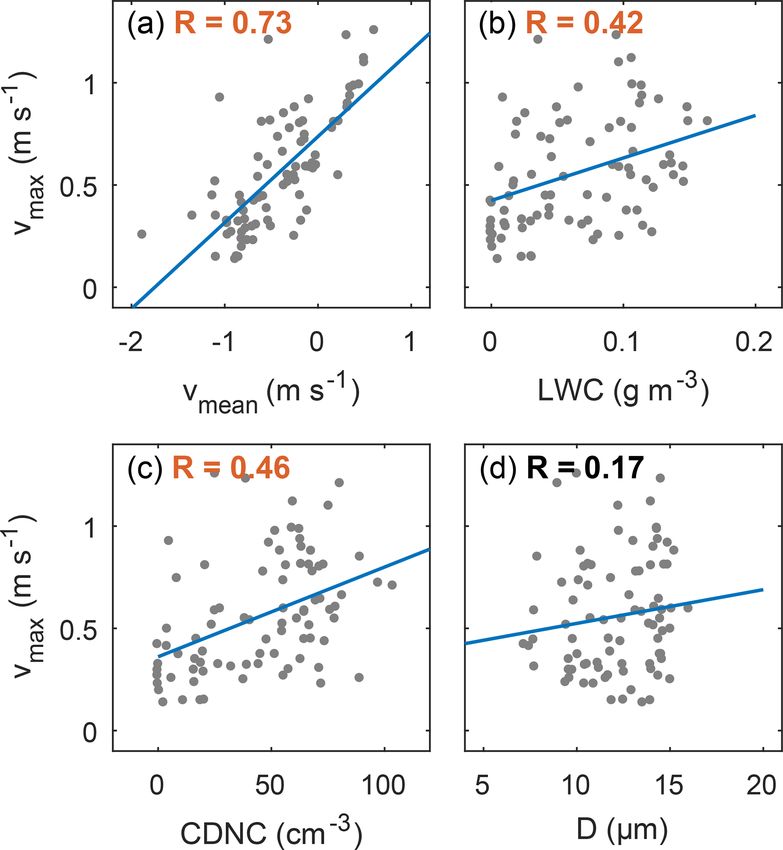
5160                                   F. Ramelli et al.: Influence of low-level blocking and turbulence on the microphysics

Figure 7. Temporal evolution of the horizontal wind speed (blue) and wind direction (red) at Wolfgang obtained from the wind lidar mea-
surements at an altitude of 1800 m. The mean wind speed between 2100 and 2800 m (gray) measured by the wind profiler at Wolfgang is
shown as a proxy for the strength of the downward-propagating cross-barrier flow. The Froude numbers (Fr) for the different periods are
indicated at the top (see Appendix A for calculations).

portant role for ice nucleation and initial ice growth. The           between 4000 and 3000 m (Fig. 10b), we assume that the ice
cloud particles continued growing below 3500 m until they             crystals grew in size by vapor deposition without changing
reached a subsaturated region within the blocked layer in the         their habit. Below 3000 m, the LDR of the faster-falling part
valley, which was identified by the layer of decreasing radar         of the spectrum increased up to −21 dB (Fig. 10b), and the
reflectivity. The sublimation layer lowered between P1_bl             spectrum broadened (Fig. 10a). Interestingly, the increase in
and P2_unbl (Fig. 9), likely as a consequence of the stronger         the LDR was collocated with the region of maximum radar
downward-propagating cross-barrier flow and the subsequent            reflectivity (2900 m; Fig. 10a) and of maximum (negative)
lowering of the region of enhanced vertical wind shear. Con-          Doppler velocity (2900 m; Fig. 10a) as well as the upper part
sequently, the extent of the subsaturated layer decreased be-         of the shear layer. The spatial coincidence between maxi-
tween P1_bl (800 m) and P2_unbl (400 m) (Fig. 8a and b),              mum radar reflectivity, shear layer and increase in LDR was
which enabled the hydrometeors to reach the surface prior to          also observed for other fallstreaks (Fig. 3d), suggesting that
complete sublimation (Fig. 9). The highest radar reflectivities       the enhanced turbulence at the interface between the blocked
were observed within the upper part of the turbulent shear            layer in the valley and the upper cross-barrier flow led to
layer (marked with S1 and S2 in Fig. 8), suggesting that tur-         additional updrafts that helped produce supersaturation and
bulence created updrafts high enough for exceeding ice sat-           enhance hydrometeor growth (e.g., through riming, aggre-
uration and thereby enhanced ice growth. The CFADs of the             gation). The increase in the Doppler velocity might be in-
spectral width (Fig. 8c and d) show two local maxima embed-           dicative of riming. Previous studies observed that an increase
ded within the shear layer (at 2500 and at 2000 m), which can         in the Doppler velocity can be indicative of riming, which
arise from enhanced turbulence and/or the presence of mul-            leads to a higher terminal fall velocity of particles due to
tiple particle populations with different fall velocities. Ad-        the rapid gain of ice particle mass (e.g., Mosimann, 1995;
ditionally, an increase in the LDR was observed within the            Kneifel and Moisseev, 2020). This is further supported by
shear layer (Fig. 8f), which is indicative of a change in the         the increase in the LDR of the faster-falling population of
hydrometeor shape or density.                                         the spectrum as a consequence of the higher particle density.
   To further explore the microphysics within the region of           In addition, turbulence within the shear layer could increase
enhanced vertical wind shear, the Doppler spectra of the              the number of collisions between ice particles and promote
radar reflectivity and LDR along the 18:00 UTC fallstreak             the formation of aggregated particles (e.g., Pinsky and Khain,
(Fig. 10; highlighted by red line in Fig. 3d) and the surface-        1998). Indeed, the hydrometeors observed by the MASC and
based hydrometeor particle observations (Fig. 11) were ana-           HOLIMO show indications of rimed particles and large ag-
lyzed. A mean LDR of around −28 dB was observed near                  gregates (Fig. 11), suggesting that both processes were oc-
the cloud top (Fig. 10b), which is characteristic of oblate           curring.
particles such as dendrites and plates (e.g., Myagkov et al.,            The temperature between 3000 and 2500 m ranged from
2016; Bühl et al., 2016). This is in agreement with the ice           −8 to −4 ◦ C and was thus in the temperature regime of
habit expected to form at a cloud top temperature of −14 ◦ C          columnar growth and of the Hallett–Mossop process. Thus,
(Magono and Lee, 1966; Bailey and Hallett, 2009) and with             secondary ice particles might be produced upon riming,
the ice particles observed by the MASC at the surface (see            which could then rapidly grow by vapor deposition into
D in Fig. 11a). Since a rather constant LDR was observed              column-like particles. These particles would be character-

Atmos. Chem. Phys., 21, 5151–5172, 2021                                                 https://doi.org/10.5194/acp-21-5151-2021
F. Ramelli et al.: Influence of low-level blocking and turbulence on the microphysics                                                   5161

Figure 8. CFADs of the radar reflectivity (a, b), spectral width (c, d) and linear depolarization ratio (e, f) averaged over sub-periods of
P1_bl (left; 17:00–17:45 UTC) and P2_unbl (right; 17:45–18:30 UTC). The following bin sizes were applied: (1) radar reflectivity from −40
to 20 dBZ in 1 dBZ intervals, (2) spectral width from 0 to 0.8 m s−1 in 0.02 m s−1 intervals and (3) LDR from −32 to −22 dB in 0.2 dB
intervals. A height interval of 100 m was used for all radar properties. The solid lines represent the mean vertical profile of P1_bl (purple)
and P2_unbl (black). The temperature profile measured by the radiosonde is shown on the right y axis. The extent of the shear layer (S1 , S2 ;
from wind profiler), the supercooled liquid layer (L; from cloud lidar) and the sublimation layer (blue arrow; from cloud radar) is indicated.

ized by higher LDR values. Furthermore, the ice particles                Da in Fig. 11). The analysis of the Doppler spectra showed
observed by the HoloBalloon platform show indications of                 no evidence of discrete multiple spectral peaks (i.e., the
needle-like structures (e.g., N in Fig. 11b), which might have           presence of multiple particle populations with different fall
grown on the existing ice particles while they fell through              speed), which would support the occurrence of secondary ice
that cloud layer. If fragile ice crystals such as dendrites or           production. However, turbulent regions or sublimation could
needle-like structures collide with large ice particles within           broaden the size distributions and thus mask the presence of
the turbulent shear layer, small ice fragments might break off           discrete multiple peaks in the Doppler spectra.
and lead to the production of secondary ice particles upon                  For a more sophisticated analysis, a larger number of par-
collision (e.g., Vardiman, 1978; Yano et al., 2016). For ex-             ticles would be necessary, but due to the moderate precipita-
ample, the ice particle measured by HOLIMO at 17:45 UTC                  tion rate at Wolfgang and Laret, only a limited number of ice
could be a dendritic arm that broke off upon collision (see              and snow particles were observed. However, in general, the

https://doi.org/10.5194/acp-21-5151-2021                                                    Atmos. Chem. Phys., 21, 5151–5172, 2021
5162                                      F. Ramelli et al.: Influence of low-level blocking and turbulence on the microphysics

Figure 9. Temporal and spatial evolution of the vertical wind shear (in m s−1 km−1 ; black contour lines), the radar reflectivity (colored area)
and the precipitation rate (blue bars). The wind shear was calculated from the wind profiler observations (Fig. 5), and the precipitation rate
was measured with a disdrometer at Wolfgang (1630 m).

Figure 10. Vertical profile of the radar reflectivity (a) and LDR (b) Doppler spectra along the LDR fallstreak at 18:00 UTC averaged over
1 min (see red line in Fig. 3d). LDR values larger than −10 dB are shown in gray. The temperature profile measured by the radiosonde is
shown on the right y axis.

in situ and surface observations of ice particles support the             4.3    Flow blocking as a driver for the formation of
radar-based assumptions above in that (1) dendrites formed                       low-level feeder clouds
near the cloud top, and (2) riming, aggregation and needle
growth occurred within the turbulent shear layer. It remains              In the last part of this study, we focus on the lower part
unclear whether the Hallett–Mossop process and mechanical                 of the boundary layer and investigate the role of low-level
break-up in ice–ice collisions contributed to the formation of            blocking for the formation of a low-level feeder cloud. The
secondary ice particles (see also Sect. 5).                               low-level cloud structure was observed with the measure-
                                                                          ment platform HoloBalloon. Vertical profiles of the in situ
                                                                          cloud properties are shown in Fig. 12. The liquid water con-
                                                                          tent (LWC) showed a rather inhomogeneous cloud structure

Atmos. Chem. Phys., 21, 5151–5172, 2021                                                       https://doi.org/10.5194/acp-21-5151-2021
F. Ramelli et al.: Influence of low-level blocking and turbulence on the microphysics 5163 Figure 11. Photographs of ice crystals and snow particles taken with the MASC (a) and HOLIMO (b). No observations of HOLIMO were available between 17:50 and 18:20 UTC. Please note the different size scale of the particles observed by the MASC and HOLIMO. Examples of crystal types observed by the MASC and HOLIMO are highlighted in red: dendrites (D), dendritic arm (Da), ice particles with needle-like structures (N). The hydrometeors measured by the disdrometer at Wolfgang were primarily in the size range between 0.5 and 1.5 mm (not shown). during P1_bl. Cloud swaths with a cloud droplet number sipated likely due to insufficient upward motion to sustain concentration (CDNC) of up to 100 cm−3 alternated with the production of liquid water. The correlation plots between “cloud-free” regions with low CDNC. No vertical profiles different dynamical (mean and maximum Doppler velocity) were performed between 17:50 and 18:20 UTC because the and microphysical properties (LWC, CDNC, mean diame- low-level cloud dissipated during this time period. This is ter) in Fig. 13 further support the assumption that the up- also visible from the cloud lidar signal, which was not atten- drafts driven by the in-valley circulation induced the forma- uated during P2_unbl in the lower part of the boundary layer tion of the low-level liquid cloud. Moderate positive Spear- (see Fig. 4a and b). A second low-level cloud formed during man’s rank correlation coefficients were observed between P3_bl. This cloud had a more homogeneous structure, with the maximum Doppler velocity (vmax ) and the LWC (0.42) an LWC in the range between 0.1 and 0.2 g m−3 . A low-level and CDNC (0.46), whereas a weak correlation was found be- cloud was also observed by the cloud base observations of tween the maximum Doppler velocity and the mean diame- the ceilometer located in Klosters (not shown). ter D (0.17). Similar correlation coefficients were observed The interesting observation was that the low-level cloud between the mean Doppler velocity and the microphysical dissipated during P2_unbl, when the low-level flow turned properties (not shown). The increase in CDNC with increas- from a blocked to an unblocked state, pointing to the impor- ing updraft velocity (Fig. 13c) suggests that droplet forma- tance of the blocking situation in forming and sustaining the tion was limited by the vertical velocity that generates super- low-level liquid cloud. We suggest that an overturning cell saturation; i.e., velocity-limited conditions were encountered formed as a consequence of the low-level flow impinging at Wolfgang. This aspect is dealt with in more detail in a pa- on the mountain barrier B2 located downstream of Wolfgang per by Georgakaki et al. (2020), where they investigated the (as shown in Fig. 14a), which generated an in-valley circu- drivers of droplet formation in mixed-phase clouds using ob- lation with a low-level counterflow from Klosters towards servations from the RACLETS campaign. Davos. Several weather stations in the Davos region con- The results presented above point to the importance of lo- firm that a counterflow was present during P1_bl and P3_bl calized flow effects that interact with the topography in pro- (Fig. 6). Since Wolfgang is located on a small-scale topo- ducing low-level feeder clouds over small-scale topographic graphic feature (400 m), the low-level flow was forced to rise features. Feeder clouds can enhance orographic precipita- from Klosters (1200 m) to Wolfgang (1630 m) over the local tion through the seeder–feeder mechanism (Bergeron, 1965; topography and thereby acted as an updraft source, which Bader and Roach, 1977; Hill et al., 1981) by providing an en- led to the formation of a low-level feeder cloud. Indeed, vironment where hydrometeors that formed aloft (i.e., in the the cloud radar indicated the presence of higher Doppler seeder region) can “feed” on the low-level liquid layer and velocities and thus higher updraft velocities during P1_bl enhance precipitation by riming and depositional growth. We (0.5 m s−1 ) and P3_bl (0.7 m s−1 ) (Fig. 12). When the block- assume that in the case study presented here, the low-level ing weakened, and the updraft velocity decreased during feeder cloud did not play a crucial role for precipitation en- P2_unbl (0.37 m s−1 ), the low-level cloud at Wolfgang dis- hancement as a significant fraction of the hydrometeor mass https://doi.org/10.5194/acp-21-5151-2021 Atmos. Chem. Phys., 21, 5151–5172, 2021
5164                                   F. Ramelli et al.: Influence of low-level blocking and turbulence on the microphysics

Figure 12. Vertical profiles of the liquid water content measured with the HoloBalloon platform. Data points with a liquid water content
below 0.01 g m−3 are indicated by gray dots. No measurements were obtained between 17:50 and 18:20 UTC. The maximum Doppler
velocity, which was derived from the Doppler spectra and was used as a proxy for the updraft velocity, is shown by the colored area. The
values at the top indicate the mean maximum Doppler velocity for the periods P1_bl, P2_unbl and P3_bl averaged over the height interval
between the surface and 1850 m.

sublimated before reaching the feeder cloud. However, in              enhanced turbulence within the region of strong vertical wind
other cases of the RACLETS campaign, we found that oro-               shear created an ice supersaturated environment and thereby
graphically induced low-level feeder clouds could enhance             influenced the cloud microphysics.
precipitation through the seeder–feeder mechanism and pro-               Previous studies identified flow blocking and shear-
vide an environment for secondary ice production mecha-               induced turbulence as a microphysical pathway for enhanc-
nisms (Ramelli et al., 2020b). We propose that local flow             ing snow growth and precipitation (e.g., Marwitz, 1983;
effects such as low-level blocking can also induce the forma-         Overland and Bond, 1995; Yu and Smull, 2000; Hogan et al.,
tion of feeder clouds in other mountain valleys and in hilly          2002; Neiman et al., 2002, 2004; Houze and Medina, 2005;
regions and suggest that the extent of this effect depends on         Loescher et al., 2006; Olson et al., 2007; Olson and Colle,
the strength of the blocking, the thermodynamics of the at-           2009; Geerts et al., 2011; Medina and Houze, 2015; Grazi-
mosphere and the altitude of the small-scale topographic fea-         oli et al., 2015; Aikins et al., 2016). Different microphysical
ture that is located upstream of the mountain barrier.                processes have been proposed to occur in turbulent layers,
                                                                      such as enhanced growth by riming due to pockets of higher
                                                                      liquid water content (e.g., Houze and Medina, 2005; Medina
5   Discussion                                                        and Houze, 2015 Grazioli et al., 2015) or enhanced growth
                                                                      by aggregation due to increased collisions between hydrom-
The microphysical evolution of the mixed-phase cloud and              eteors (e.g., Geerts et al., 2011; Aikins et al., 2016). Based
the low-level feeder cloud in the inner-Alpine valley was de-         on the cloud radar observations and the ground-based snow
termined by a complex interplay between orography, dynam-             particle measurements, we suggest that riming and aggrega-
ics and microphysics. A conceptual overview of the observed           tion were the dominant ice growth mechanisms in the present
clouds is shown in Fig. 14 (a: blocked state; b: unblocked            case study. The increase in the LDR at the upper edge of the
state). Primary ice nucleation was suggested to occur close to        shear layer was assumed to be related to riming as the LDR
the cloud top in the embedded supercooled liquid cloud layer.         of the faster-falling part of the spectrum was increased, likely
Based on the cloud top temperature and cloud radar and hy-            due to the higher particle density (Fig. 10b). Depending on
drometeor observations, dendrites and hexagonal plates were           the rime mass fraction, riming can have a significant impact
assumed to form, which could rapidly grow by vapor depo-              on the ice particle properties (Li et al., 2018; Moisseev et al.,
sition. The ice particles encountered a turbulent shear layer         2017).
while falling through the cloud, within which changes in the             In addition, secondary ice production processes might
microphysical cloud properties were observed including en-            have been active within the shear layer. The prevailing tem-
hanced radar reflectivity (i.e., increased ice growth) and LDR        perature (from −8 to −5 ◦ C) was in the range of the Hallett–
(i.e., change in particle shape or density). This suggests that

Atmos. Chem. Phys., 21, 5151–5172, 2021                                                  https://doi.org/10.5194/acp-21-5151-2021
F. Ramelli et al.: Influence of low-level blocking and turbulence on the microphysics 5165
ing to precipitation-sized particles and act as a seed to trig-
ger secondary ice production. Additionally, a few laboratory-
based studies suggested that ice fragmentation upon subli-
mation can lead to the production of secondary ice particles
(e.g., Oraltay and Hallett, 1989; Dong et al., 1994; Bacon
et al., 1998). However, secondary ice particles that formed
within a subsaturated environment need to be transported
to an ice supersaturated environment to influence the cloud
microphysics (Korolev et al., 2020). In order to further in-
vestigate the role of secondary ice production in the turbu-
lent shear layer, in situ observations of the cloud properties
would be useful. Unfortunately, the tethered-balloon system
was limited to lower altitudes and could not sample the cloud
properties within the upper part of the shear layer.
While previous research that investigated orographic pre-
cipitation has mainly focused on isolated mountain barriers,
here we studied the role of low-level blocking and shear-
induced turbulence on the cloud microphysics in a more com-
plex terrain with narrow valleys and a series of mountain
barriers. The interface between the blocked layer in the val-
ley and the stronger cross-barrier flow aloft was character-
ized by a region of enhanced turbulence and vertical wind
Figure 13. Correlations among dynamical (vmean , vmax ) and mi- shear. We found that the region of strong vertical wind shear,
crophysical parameters (LWC, CDNC, D) of the low-level cloud the extent of the subsaturated layer within the blocked layer
properties. The dynamical properties that were observed with the in the valley and as a consequence the amount of precipi-
cloud radar were averaged between the surface and 1850 m. The tation reaching the valley were determined by the strength
gray dots represent the 2 min averages for the time periods be- of the downward-propagating cross-barrier flow on the up-
tween 16:20–17:55 and 18:30–19:45 UTC. The blue lines indicate stream mountain barrier B1 and the strength of the low-level
the least-square-regression line. The Spearman’s rank correlation blocking on the windward slope of the downstream moun-
coefficients are shown in the top left corner, where correlation co- tain barrier B2 (Sect. 4.2). Furthermore, we found that local
efficients highlighted in orange indicate correlations significantly flow effects in mountain valleys (i.e., in-valley circulation
different from zero (5 % significance level).
due to blocked low-level flow) can induce the formation of
low-level feeder clouds by producing local updrafts and thus
enhance orographic precipitation through the seeder–feeder
Mossop process. Furthermore, the ice particles observed near mechanism (Sect. 4.3). This case study demonstrates that it
the surface suggest that needle growth occurred on the exist- is challenging to study “simple” conceptual mechanisms in
ing ice particles within the turbulent shear layer (Fig. 11). complex terrain due to numerous interactions between dy-
Previous laboratory studies have observed needle growth at namics, microphysics and orography on different scales, and
temperatures of −5 ◦ C slightly below liquid water saturation the superposition of upstream and downstream effects. Nev-
(Knight, 2012). If fragile ice crystals with needle-like struc- ertheless, it is important to perform field campaigns in com-
tures collide with large rimed particles, small ice fragments plex terrain in order to improve our understanding of these
might break off and lead to the production of secondary ice processes and of orographic precipitation. Field campaigns
particles (e.g., Vardiman, 1978; Yano et al., 2016). Previous in complex terrain should be designed in such a way that
studies have observed a large number of small ice particles an extensive set of complementary instruments are deployed
within turbulent shear layers, which were likely generated over the measurement area. The observations presented here
through secondary ice production mechanisms (e.g., Hogan were obtained within a region of 10 km × 10 km and mostly
et al., 2002; Grazioli et al., 2015). For example, Hogan et al. focused on the vertical structure. Information about the hor-
(2002) observed high concentrations of small ice particles izontal cloud structure (e.g., radar RHI scans, in situ aircraft
(100–1000 L−1 ) in and above a region of embedded con- observations) and observations over a larger area (e.g., cov-
vection, which were likely produced through the Hallett– ering the entire region between upstream and downstream
Mossop mechanism during riming. Since the fall velocity mountain barriers) would be beneficial to obtain a more com-
of small ice particles is low, these secondary ice particles plete picture of the cloud dynamics and microphysics.
were found to recirculate in the updrafts and to feed the re-
gions above the shear layer with ice crystals (Hogan et al.,
2002; Grazioli et al., 2015), where they could continue grow-
https://doi.org/10.5194/acp-21-5151-2021 Atmos. Chem. Phys., 21, 5151–5172, 2021You can also read