Detailed Episodic Memory Depends on Concurrent Reactivation of Basic Visual Features within the Posterior Hippocampus and Early Visual Cortex ...
←
→
Page content transcription
If your browser does not render page correctly, please read the page content below
Cerebral Cortex Communications, 2021, 2, 1–15

                                                                              doi: 10.1093/texcom/tgab045
                                                                              Original Article

ORIGINAL ARTICLE

                                                                                                                                                        Downloaded from https://academic.oup.com/cercorcomms/article/2/3/tgab045/6322941 by guest on 09 December 2021
Detailed Episodic Memory Depends on Concurrent
Reactivation of Basic Visual Features within the
Posterior Hippocampus and Early Visual Cortex
Michael B. Bone1,2 and Bradley R. Buchsbaum1,2
1 Rotman Research Institute at Baycrest, Toronto, Ontario, M6A 2E1, Canada and 2 Department of Psychology;
University of Toronto, Toronto, Ontario, M5S 1A1, Canada
∗ Address   correspondence to Michael B. Bone. Email: michael.bone@mail.utoronto.ca

Abstract
The hippocampus is a key brain region for the storage and retrieval of episodic memories, but how it performs this function
is unresolved. Leading theories posit that the hippocampus stores a sparse representation, or “index,” of the pattern of
neocortical activity that occurred during perception. During retrieval, reactivation of the index by a partial cue facilitates the
reactivation of the associated neocortical pattern. Therefore, episodic retrieval requires joint reactivation of the hippocampal
index and the associated neocortical networks. To test this theory, we examine the relation between performance on a
recognition memory task requiring retrieval of image-specific visual details and feature-specific reactivation within the
hippocampus and neocortex. We show that trial-by-trial recognition accuracy correlates with neural reactivation of low-level
features (e.g., luminosity and edges) within the posterior hippocampus and early visual cortex for participants with high
recognition lure accuracy. As predicted, the two regions interact, such that recognition accuracy correlates with hippocampal
reactivation only when reactivation co-occurs within the early visual cortex (and vice versa). In addition to supporting
leading theories of hippocampal function, our findings show large individual differences in the features underlying visual
memory and suggest that the anterior and posterior hippocampus represents gist-like and detailed features, respectively.

Key words: neocortex, MVPA, memory, hippocampus, fMRI

Introduction                                                                  Bone et al. 2019; Bone et al. 2020). Leading theories of hippocam-
                                                                              pal function posit that it mediates neocortical reactivation by
The ability to mentally re-experience vivid imagery from a past               storing a compressed representation, or “index,” of the neocorti-
event is a defining feature of episodic memory. A large body                  cal activity that occurred during perception, thereby facilitating
of evidence indicates that vivid episodic recollection is imple-              the encoding of arbitrary associations between an event’s con-
mented by the reactivation of neural activity that occurred dur-              stituent features that can later be retrieved by the reactivation
ing the recalled episode—particularly within modality-specific                of a subset of the encoded features (Teyler and DiScenna 1986;
neocortical regions, e.g., the visual cortex for visual memories              McClelland et al. 1995; Nadel et al. 2000; Kumaran et al. 2016; Sek-
(Buchsbaum et al. 2012; Kuhl et al. 2012; Johnson and Johnson                 eres et al. 2018; Barron et al. 2020). Despite being a key element of
2014; St-Laurent et al. 2014; Naselaris et al. 2015; Wing et al. 2015;        current theories of episodic memory and hippocampal function,

Received: 22 June 2021; Revised: 22 June 2021; Accepted: 25 June 2021

© The Author(s) 2021. Published by Oxford University Press.
This is an Open Access article distributed under the terms of the Creative Commons Attribution License (http://creativecommons.org/licenses/by/4.0/),
which permits unrestricted reuse, distribution, and reproduction in any medium, provided the original work is properly cited.

                                                                                                                                               1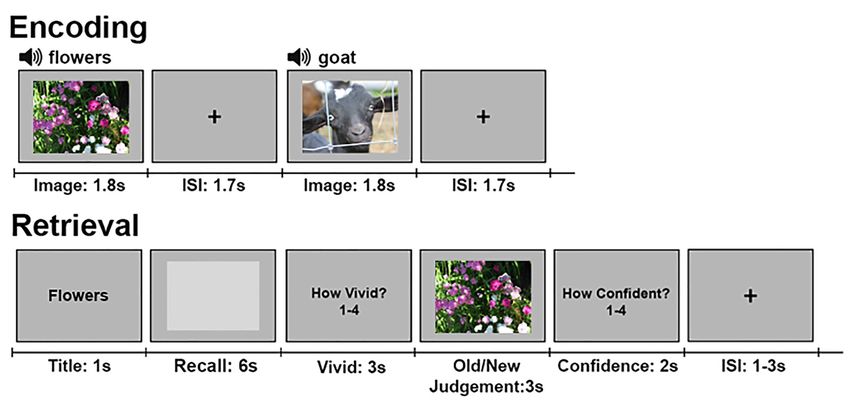
2     Cerebral Cortex Communications, 2021, Vol. 2, No. 3

direct evidence for the belief that episodic memories arise from        perception of specific images (the most common approach within
the interaction of hippocampal and neocortical representations          the memory reactivation literature), whereas feature-specific
of the same information remains limited in humans.                      reactivation refers to reactivation of neural activity that occurred
    Due to the anatomical position of the hippocampus near the          during perception of specific features shared across images.
end of the ventral visual pathway, it is generally assumed that         Cross-validation is used to exclude the encoding trials of the
the constituent features directly indexed by the hippocampus            target image from the feature-specific training set, so the training
are limited to “high-level” representations, such as object cate-       sets for the two measures are different. Features were extracted
gory and the spatiotemporal relations between objects (Barron           from layer node activations of the VGG16 deep neural net
et al. 2020). However, humans have the capacity to vividly and          (DNN) (Simonyan and Zisserman 2014). Activations from the
accurately reconstruct a past visual experience from the original       convolutional layers (1–13), and the fully connected layers (14–16)
perspective—which is severely compromised with damage to                were used, corresponding to low-visual (edges and luminosity;
the hippocampus (Tulving 1993; Rubin et al. 2003). High-level           1–4), middle-visual (simple object parts and patterns; 5–9), high-

                                                                                                                                               Downloaded from https://academic.oup.com/cercorcomms/article/2/3/tgab045/6322941 by guest on 09 December 2021
representations capture statistical regularities shared across cat-     visual (complex object parts, e.g., faces; 10–13) and semantic
egory members, so they generally lack the event-specific infor-         (object category; 14–16) features, respectively. Because feature-
mation that would be required for vivid and accurate visual             specific reactivation is trained across images (excluding the
recall, such as object pose and lighting. Low-level features (e.g.,     target/cued image), the method requires neural representations
edges, luminosity) are not abstracted to the same extent as high-       of visual features to be at least partially shared between images.
level features, so indexing neocortical activity representing a         This would not be possible if memories with shared features are
sparse set of low-level features, in addition to high-level features,   represented by non-overlapping neural patterns (Yassa and Stark
would provide the information necessary to constrain memory             2011). Findings indicate that similar events are represented by
reactivation to be specific to the past event. Therefore, if the        partially overlapping neural patterns within the hippocampus,
hippocampus supports detailed episodic memory, then retrieval           and that the degree of representational overlap varies between
should be facilitated by reactivation of a hippocampal network          hippocampal subfields (Bakker et al. 2008; Yassa and Stark 2011;
that indexes neocortical activity representing low-level visual         Rolls 2013; Berron et al. 2016), so feature-specific reactivation
features—particularly within the early visual cortex.                   should be detectable within the hippocampus.
    The patterns that can be indexed and the features that they             The experiment (see Bone et al. 2020, which addressed neo-
represent are determined by the physical connections between            cortical reactivation using the same experimental data) had two
the hippocampus and neocortex. This connectivity varies along           video viewing runs, used to train the feature-specific encoding
the longitudinal axis, with the posterior hippocampus (pHC)             models, and three sets of alternating encoding and retrieval runs
reciprocally linked to sensory regions of the posterior neocortex,      (Fig. 1). During encoding runs participants memorized a set of
and the anterior hippocampus (aHC) connected to anterior neo-           thirty color images (per run) while performing a 1-back task. In
cortical structures implicated in the representation of schemas         the following retrieval runs, participants’ recall and recognition
(Kier et al. 2004; Catenoix et al. 2011; Poppenk and Moscovitch         memory of the images was assessed. Neural reactivation was
2011; Poppenk et al. 2013). Based on differences in connectivity        measured while participants visualized a cued image within a
and an approximately linear increase in receptive field size            light-gray rectangle, followed by a memory vividness rating. An
(Kjelstrup et al. 2008) along the hippocampal longitudinal axis,        image was then presented that was either identical to the cued
researchers (Poppenk et al. 2013; McCormick et al. 2015) postulate      image or a similar lure, and the participants judged whether they
that the pHC indexes the fine-grained perceptual features of            had seen the image during encoding and provided a confidence
an event, which constitute vivid, perceptually rich memories,           rating. Critically, the lure images carried the semantic and visual
whereas the aHC indexes coarse-grained features, which support          gist of the cued images but had different fine-grained details (see
gist-like memories. Although the bulk of experimental evidence          Supplementary Fig. 1 for example image pairs). Consequently,
supports this hypothesis (Evensmoen et al. 2015; Schlichting            accuracy on the recognition task served as a measure of detailed,
et al. 2015; Brunec et al. 2018; Sekeres et al. 2018; Grady 2020),      rather than gist-like, memory.
at least one recent finding implicates the aHC and pHC in the               We found that the within-subject correlation between
representation of detailed and gist-like memories, respectively         recognition accuracy and image-specific reactivation during
(Dandolo and Schwabe 2018).                                             recall was significantly greater within the pHC relative to the
    The current experiment addresses three questions: First,            aHC for individuals with high lure accuracy. Feature-specific
we ask whether detailed and accurate visual memory is                   reactivation during recall produced a similar result, with the
associated with hippocampal reactivation of neural activity             correlations limited to visual features (i.e., excluding semantic
representing visual features—particularly low-level features.           features). Moreover, low-level visual reactivation within the
Second, is detailed visual memory more strongly associated with         pHC positively interacted with low-level visual reactivation
reactivation within the pHC than the aHC? And third, does the           within the calcarine sulcus, indicating that the correlation
association between memory performance and hippocampal                  between recognition accuracy and hippocampal reactivation
reactivation of low-level visual features depend upon concurrent        depended upon reactivation of the same information co-
reactivation of the same features within the visual cortex, as          occurring within the early visual cortex (and vice-versa). Overall,
predicted by the hippocampus’s role in indexing neocortical             our results show that hippocampal representations extend to
activity?                                                               low-level visual features, and we confirm that the precision
    To this end, we combined functional magnetic resonance              of these representations (including low-, mid-, and high-level
imaging (fMRI) and measures of neural reactivation applied              visual features) varies along the long-axis, such that gist-like
to a challenging recall and recognition task. We defined                and detailed representations occur within the aHC and pHC,
reactivation in two ways: namely, image-specific and feature-           respectively. Our findings also expand upon previous work (Bone
specific reactivation. Image-specific reactivation refers to            et al. 2020) by showing that individual differences in the features
multivoxel reactivation of neural activity that occurred during         underlying visual memory extend to the hippocampus. Finally,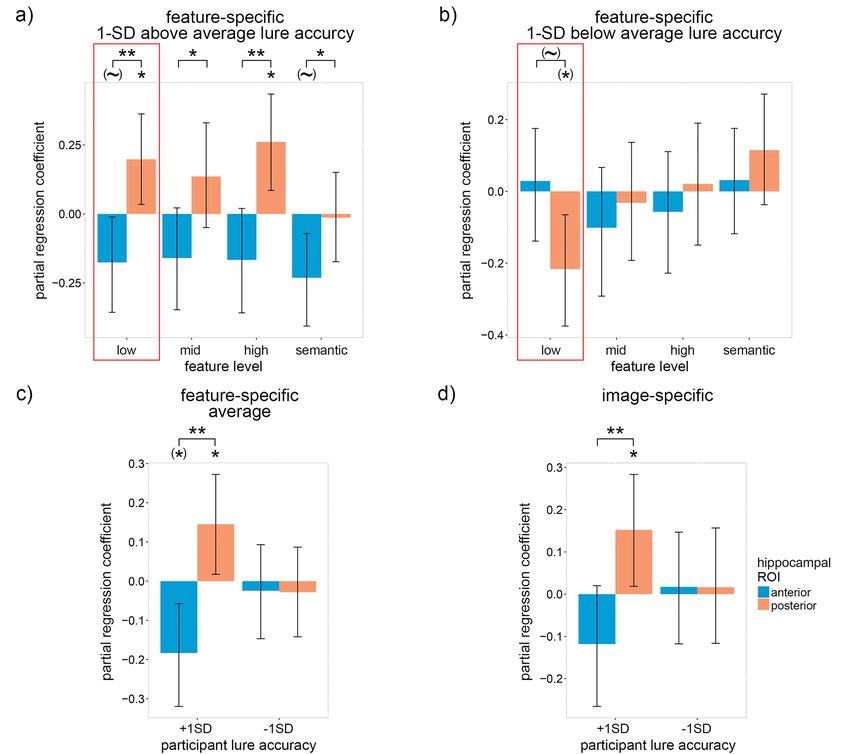
Detailed Episodic Memory Depends on Concurrent Reactivation Bone and Buchsbaum 3
Downloaded from https://academic.oup.com/cercorcomms/article/2/3/tgab045/6322941 by guest on 09 December 2021
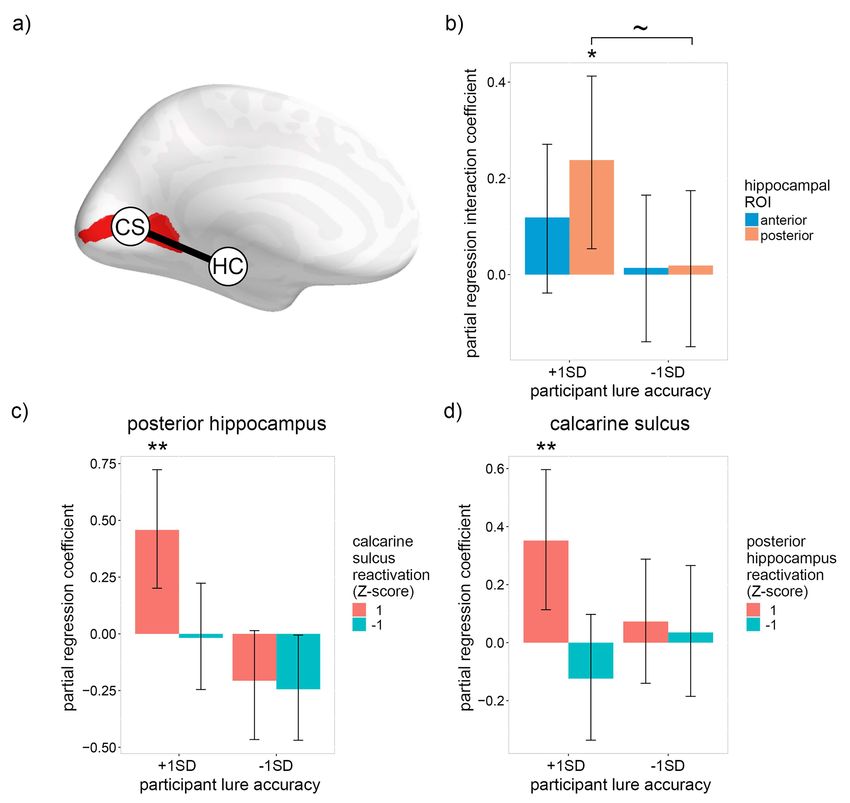
Figure 1. Procedure. Alternating image encoding and retrieval tasks. During encoding, participants performed a 1-back task while viewing a sequence of color
photographs accompanied by matching auditory labels. During retrieval, participants 1) were cued with a visually-presented label, 2) retrieved and maintained a mental
image of the associated photograph over a 6-s delay, 3) indicated the vividness of their mental image using 1–4 scale, 4) decided whether a probe image matched the
cued image, and 5) entered their confidence rating with respect to the old/new judgment. Due to copyright concerns, images used in the study could not be included in
the figure. The images depicted in the figure are for explanatory purposes only.
our results support leading theories that claim the hippocampus task. Two videos used for model training (720 by 480 pixels; 30
implements episodic recall by storing and reactivating a sparse fps; 10 m 25 s and 10 m 35 s in length) comprised a series of short
index of neocortical activity. (∼4 s) clips drawn from YouTube and Vimeo, containing a wide
variety of themes (e.g., still photos of bugs, people performing
manual tasks, animated text, etc.). One additional video cut from
Materials and Methods “Indiana Jones: Raiders of the Lost Ark” (1024 by 435 pixels;
Participants 10 m 6 s in length) was displayed while in the scanner, but the
associated data were not used in this experiment because the
Thirty-seven right-handed young adults with normal or corrected-
aspect ratio (widescreen) did not match the images.
to-normal vision and no history of neurological or psychiatric
disease were recruited through the Baycrest subject pool, tested,
and paid for their participation. Informed consent was obtained,
and the experimental protocol was approved by the Rotman Procedure
Research Institute’s Ethics Board. Subjects were either native or
fluent English speakers and had no contraindications for MRI. Before undergoing MRI, participants were trained on a practice
Data from 12 of these participants was excluded from the final version of the task incorporating 21 practice image pairs. Inside
analyses for the following reasons: excessive head motion (5; the MRI scanner, participants completed three video viewing
removed if > 5 mm within run maximum displacement in head runs and three encoding-retrieval sets. The order of the runs was
motion), fell asleep (2), did not complete experiment (3), trial as follows: first video viewing run (short clips 1), second video
labeling error (1), second video run was cut short due to technical viewing run (short clips 2), third video viewing run (Indiana Jones
difficulties (1). Thus, 25 participants were included in the final clip), first encoding-retrieval set, second encoding-retrieval set,
analysis (13 males and 12 females, 20–32 years old). third encoding-retrieval set. A high-resolution structural scan
was acquired between the second and third encoding-retrieval
sets, providing a break.
Video viewing runs were 10 m 57 s long. For each run, par-
Stimuli ticipants were instructed to pay attention while the video (with
In total, 111 colored photographs (800 by 600) were gathered audio) played within the center of the screen. The order of the
from online sources. For each image, an image pair was acquired videos was the same for all participants.
using Google’s similar image search function, for a total of 111 Encoding-retrieval sets were composed of one encoding run
image pairs (222 images). Twenty-one image pairs were used followed by one retrieval run. Each set required the participants
for practice, and the remaining 90 were used during the in- to first memorize and then recall 30 images drawn from 30
scan encoding and retrieval tasks (see Supplementary Fig. 1 image pairs. The image pairs within each set were selected
for example image pairs). Each image was paired with a short randomly, with the constraint that no image pair could be used
descriptive audio title in a synthesized female voice (https://neo in more than one set. The image selected from each image pair
speech.com; voice: Kate) during encoding runs; this title served to be presented during encoding was counterbalanced across
as a visually presented retrieval cue during the in-scan retrieval subjects. This experimental procedure was designed to limit the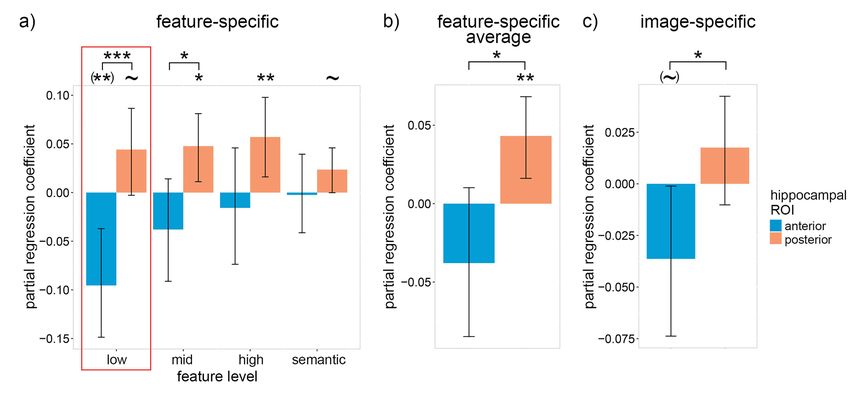
4     Cerebral Cortex Communications, 2021, Vol. 2, No. 3

concurrent memory load to 30 images for each of three consecu-            images were acquired using a multiband EPI sequence sensitive
tive pairs of encoding-retrieval runs.                                    to BOLD contrast (22 × 22 cm field of view with a 110 × 110 matrix
    Encoding runs were 6 m 24 s long. Each run started with               size, resulting in an in-plane resolution of 2 × 2 mm for each of
10s during which instructions were displayed on-screen. Trials            63 2-mm axial slices; repetition time = 1.77 s; echo time = 30 ms;
began with the appearance of an image in the center of the                flip angle = 62◦ ). A high-resolution whole-brain magnetization
screen (1.8 s), accompanied by a simultaneous descriptive audio           prepared rapid gradient echo (MP-RAGE) 3-D T1 weighted scan
cue (e.g., a picture depicting toddlers would be coupled with the         (160 slices of 1 mm thickness, 19.2 × 25.6 cm field of view) was
spoken word “toddlers”). Images occupied 800 by 600 pixels of             also acquired for anatomical localization.
a 1024 by 768 pixel screen. Between trials, a crosshair appeared              The experiment was programmed with the E-Prime 2.0.10.353
centrally (font size = 50) for 1.7 s. Participants were instructed        software (Psychology Software Tools, Pittsburgh, PA). Visual stim-
to pay attention to each image and to encode as many details              uli were projected onto a screen behind the scanner made visible
as possible so that they could visualize the images as precisely          to the participant through a mirror mounted on the head coil.

                                                                                                                                                  Downloaded from https://academic.oup.com/cercorcomms/article/2/3/tgab045/6322941 by guest on 09 December 2021
as possible during the imagery task. The participants also per-
formed a 1-back task requiring the participants to press “1” if
the displayed image was the same as the preceding image, and
“2” otherwise. Within each run, stimuli for the 1-back task were
                                                                          fMRI Preprocessing
randomly sampled with the following constraints: 1) each image            Functional images were converted into NIFTI-1 format, motion-
was repeated exactly four times in the run (120 trials per run;           corrected and realigned to the average image of the first run with
360 for the entire session), 2) there was only one immediate              AFNI’s (Cox 1996) 3dvolreg program. The maximum displacement
repetition per image, and 3) the other two repetitions were at            for each EPI image relative to the reference image was recorded
least 4 items apart in the 1-back sequence.                               and assessed for head motion. The average EPI image was then
    Retrieval runs were 9 m 32 s long. Each run started with              co-registered to the high-resolution T1-weighted MP-RAGE struc-
10s during which instructions were displayed on-screen. Thirty            tural using the AFNI program align_epi_anat.py (Saad et al. 2009).
images were then cued once each (the order was randomized),                   The functional data for each experimental task (video view-
for a total of 30 trials per run (90 for the entire scan). Trials         ing, 1-back encoding task, retrieval task) was then projected to a
began with an image title appeared in the center of the screen            subject-specific cortical surface generated by Freesurfer 5.3 (Dale
for 1 s (font = Courier New, font size = 30). After 1 s, the title was    et al. 1999). The target surface was a spherically normalized mesh
replaced by an empty rectangular box shown in the center of the           with 32 000 vertices that was standardized using the resampling
screen (6 s), and whose edges corresponded to the edges of the            procedure implemented in the AFNI program MapIcosahedron
stimulus images (800 by 600 pixels). Participants were instructed         (Argall et al. 2006). To project volumetric imaging data to the
to visualize the image that corresponded to the title as accurately       cortical surface we used the AFNI program 3dVol2Surf with the
as they could within the confines of the box. Once the box disap-         “average” mapping algorithm, which approximates the value at
peared, participants were prompted to rate the subjective vivid-          each surface vertex as the average value among the set of voxels
ness (defined as the relative number of recalled visual details           that intersect a line along the surface normal connecting the
specific to the cued image presented during encoding) of their            white matter and pial surfaces.
mental image on a 1–4 scale (1 = a very small number of visual                The three video scans (experimental runs 1–3), because
details were recalled, 4 = a very large number of visual details          they involved a continuous stimulation paradigm, were directly
were recalled) (3 s) using a four-button fiber optic response box         mapped to the surface without any pre-processing to the
(right hand; 1 = right index finger; 4 = right little finger). This was   cortical surface. The three retrieval scans (runs 5, 7, 9) were
followed by the appearance of a probe image (800 by 600 pixels)           first divided into a sequence of experimental trials with each
in the center of the screen (3 s), which was either the same as           trial beginning (t = −2) 2 s prior to the onset of the retrieval cue
or similar to the trial’s cued image (i.e., either the image shown        (verbal label) and ending 32 s later in 2-s increments. These
during encoding or its pair). While the image remained on the             trials were then concatenated in time to form a series of 90
screen, the participants were instructed to respond with “1” if           trial-specific time-series, each of which consisted of 16 samples.
they thought that the image was the one seen during encoding              The resulting trial-wise data blocks were then projected onto
(old), or “2” if the image was new (responses made using the              the cortical surface. To facilitate separate analyses of the “recall”
response box). Following the disappearance of the image, partic-          and “old/new judgment” retrieval data, a regression approach
ipants were prompted to rate their confidence in their old/new            was implemented. For each trial, the expected hemodynamic
response on a 1–4 scale (2 s) using the response box. Between             response associated with each task was generated by convolving
each trial, a crosshair (font size = 50) appeared in the center of        a series of instantaneous impulses (i.e., a delta function) over
the screen for either 1, 2 or 3 s.                                        the task period (10 per second; imagery: 61; old/new: 31) with
    Randomization sequences were generated such that both                 the SPM canonical hemodynamic response. Estimates of beta
images within each image pair (image A and B) were presented              coefficients for each trial and task were computed via a separate
equally often during the encoding runs across subjects. During            linear regression per trial (each with 16 samples: one per time
retrieval runs each image appeared equally often as a matching            point), with vertex activity as the dependent variable, and the
(encode A—> probe A) or mismatching (encode A—> probe B)                  expected hemodynamic response values for the “recall” and
image across subjects. Due to the need to remove several sub-             “old/new judgment” tasks as independent variables. The “recall”
jects from the analyses, stimulus versions were approximately             beta coefficients were used in all subsequent neural analyses.
balanced over subjects.                                                   Data from the three encoding scans (runs 4, 6, 8) were first
                                                                          processed in volumetric space using a trial-wise regression
                                                                          approach, where the onset of each image stimulus was modeled
Setup and Data Acquisition
                                                                          with a separate regressor formed from a convolution of the
Participants were scanned with a 3.0-T Siemens MAGNETOM Trio              instantaneous impulse with the SPM canonical hemodynamic
MRI scanner using a 32-channel head coil system. Functional               response. Estimates of trial-wise beta coefficients were then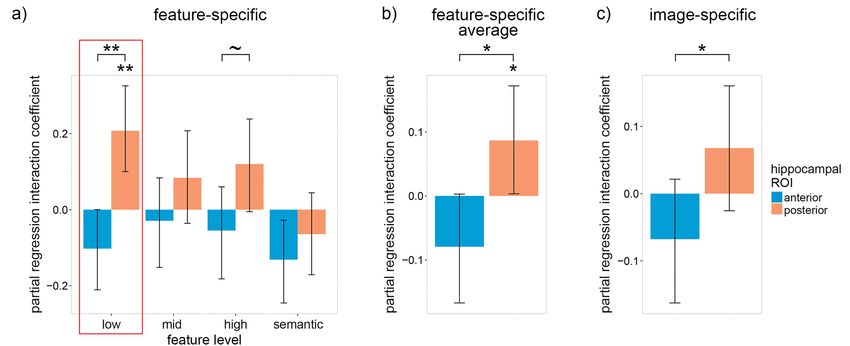
Detailed Episodic Memory Depends on Concurrent Reactivation               Bone and Buchsbaum           5

computed using the “least squares sum” (Mumford et al. 2012)           high-level layer was required to have features that selectively
regularized regression approach as implemented in the AFNI             respond to complex objects (e.g., faces). Layers 10–13 contained
program 3dLSS. The 360 (30 unique images per run, 4 repetitions        such features. There were no a priori demands on the type of
per run, 3 total runs) estimated beta coefficients were then           features represented by the middle layer, so layers 5–9 were
projected onto the cortical surface with 3dVol2Surf.                   selected. We used the fully connected layers (14–16) to approxi-
                                                                       mate semantic features because, unlike the convolutional layers,
                                                                       they are not modeled upon the visual cortex. Instead, the fully
Hippocampal ROI Definition                                             connected layers are designed to learn features (derived from
                                                                       high-level visual features in layer 13) that directly contribute to
To define anterior and posterior hippocampal ROIs, we used the
                                                                       the semantic classification of images.
Freesurfer’s (version 5.3) automated parcellation of the left and
                                                                           To account for the low retinotopic spatial resolution resulting
right hippocampi on the T1-weighted image of each participant.
                                                                       from participants eye movements, the spatial resolution of the

                                                                                                                                                  Downloaded from https://academic.oup.com/cercorcomms/article/2/3/tgab045/6322941 by guest on 09 December 2021
    Based on the finding that receptive field size varies linearly
                                                                       convolutional layers (the fully connected layers have no explicit
along the longitudinal axis in rodents (Kjelstrup et al. 2008),
                                                                       spatial representation) was reduced to 3 by 3 (original resolution
we expected that the level of detail represented would gradu-
                                                                       for layers 1–2: 224 by 224; layers 3–4: 112 by 112; layers 5–7: 56 by
ally increase from the anterior to posterior potions of the hip-
                                                                       56; layers 8–10: 28 by 28; layers 11–13: 14 by 14). Convolutional
pocampus in humans. Consequently, the precise boundaries of
                                                                       layer activations were log-transformed to improve prediction
the “aHC” and “pHC” were not considered to be critical, so the
                                                                       accuracy (Naselaris et al. 2015).
left and right hippocampal ROIs were equally divided into five
sections along the antero-posterior axis, yielding five ROIs per
hemisphere. These ROIs were then used as masks to extract
time-series from the pre-processed and co-registered fMRI data.
                                                                       Encoding–Decoding Analysis for Feature-Specific
    We used five equal longitudinal sections because that would        Reactivation
allow us to exclude the middle (to reduce signal bleed between         Our feature-specific reactivation measure is based on a method
the regions and increase the expected difference between them),        (Naselaris et al. 2015) involving two steps, an encoding step and a
while maintaining a reasonable number of voxels for decod-             decoding step. The goal of the encoding step is to predict activity
ing when the two posterior and anterior regions are grouped            for each voxel when viewing or recalling an image based upon
together.                                                              the relationship (at perception) between DNN feature activations
                                                                       (from a given layer) and neural activity associated with the target
                                                                       image. Once trained, a single encoding model takes DNN features
Deep Neural Network Image Features                                     from one layer of the network as the input and outputs the
                                                                       predicted activity for one voxel. Multiple models are used to cover
We used the pretrained TensorFlow implementation of the
                                                                       all voxels and layers.
VGG16 deep neural network (DNN) model (Simonyan and
                                                                           The goal of the decoding step is to measure reactivation of
Zisserman 2014; see http://www.cs.toronto.edu/~frossa
                                                                       feature-specific neural activity patterns for each retrieval trial
rd/post/vgg16 for the implementation used). Like AlexNet (the
                                                                       and feature-level. This is accomplished by correlating (over vox-
network used in previous studies, e.g., Güçlü and van Gerven
                                                                       els within a ROI) the actual neural activity pattern during recall
2015), VGG16 uses Fukushima’s (1980) original visual-cortex
                                                                       with the encoding models’ (layer-specific) predictions for each
inspired architecture, but with greatly improved top-5 (out of
                                                                       encoded image (i.e., the particular combination of features com-
1000) classification accuracy (AlexNet: 83%, VGG16: 93%). The
                                                                       prising the image) and then comparing how strong the corre-
network’s accuracy was particularly important for this study
                                                                       lation with the target/cued image prediction is relative to all
because we did not hand-select stimuli (images and video
                                                                       the non-target image predictions using a rank measure. A final
frames) that were correctly classified by the net. The VGG16
                                                                       additional step of residualization is used to remove trial-by-trial
model consists of a total of thirteen convolutional layers and
                                                                       variance of the reactivation measure (from the decoding step)
three fully connected layers. 90 image pairs from the memory
                                                                       that is shared by other feature levels and between the aHC and
task and 3775 video frames (3 frames per second; taken from
                                                                       pHC. The three steps are described in more detail in the following
the two short-clip videos; video 1: 1875 frames; video 2: 1900
                                                                       three sections.
frames; extracted using “Free Video to JPG Converter” https://
www.dvdvideosoft.com/products/dvd/Free-Video-to-JPG-Conve
rter.htm) were resized to 224 × 224 pixels to compute outputs
of the VGG16 model for each image/frame. The outputs from              Feature-Specific Encoding Model
the units in all layers were treated as vectors corresponding          Separate encoding models were estimated for all combinations
to low-level visual features (layers 1–4), mid-level visual features   of subject, feature level and brain surface vertex (Naselaris et al.
(layers 5–9), high-level visual features (layers 10–13) and semantic   2015). Let vit be the signal from vertex i during trial t. The encoding
features (layers 14–16).                                               model for this vertex for a given feature level, l, is:
    Convolutional layers (layers 1–13) were selected to repre-
sent visual features because they are modeled after the struc-
                                                                                                   vit = hT flt + ǫ                         (1)
ture of the visual cortex (Fukushima 1980), and previous work
showed that the features contained within the convolutional
layers of AlexNet (which has a similar architecture to VGG16)             Here, flt is a 100 × 1 vector of 100 image features from the
corresponded to the features represented throughout the visual         layer of VGG16 representing the target feature level, l, associated
cortex (Güçlü and van Gerven 2015). The layer activations were         with the current trial/image, t (only the 100 features from layer l
visually inspected to confirm whether they represent the appro-        with the largest positive correlations with the vertex activity, vi ,
priate features. The low-level layers were required to have similar    were selected to make the computation tractable. Correlations
outputs to edge filters. Layers 1–4 best fit that description. The     were performed immediately before each non-negative lasso
6 Cerebral Cortex Communications, 2021, Vol. 2, No. 3
regression using data from the movie and encoding tasks), h Removing Shared Variance Between ROIs and Feature Levels
is a 100 × 1 vector of model parameters that indicate the vox-
To remove the shared variance between feature levels and the
el/vertex’s sensitivity to a particular feature (the superscript T
anterior and posterior hippocampus for the within-subject anal-
indicates transposition) and ǫ is zero-mean Gaussian additive
yses, residuals extracted from linear models were used in the
noise.
place of the reactivation measure. Linear models were run for
The model parameters h were fit using non-negative lasso
all combinations of ROI and feature-level. For image-specific
regression (R package “nnlasso”; Mandal and Ma 2016) trained
reactivation within the hippocampus, trial-by-trial reactivation
on data drawn from the encoding and movie viewing tasks
within the aHC (pHC) was the DV and reactivation within the
(excluding the Indiana Jones video because its widescreen aspect
pHC (aHC) was the IV. For feature-specific reactivation within
ratio differed significantly from the encoded images) using 3-
the neocortex, reactivation of the target feature level was the DV
fold cross validation over the encoding data (cross validation was
and reactivation of the three non-target feature levels were three
performed over images, so trials containing presentations of the
IVs. For feature-specific reactivation within the hippocampus,
Downloaded from https://academic.oup.com/cercorcomms/article/2/3/tgab045/6322941 by guest on 09 December 2021
to-be-predicted image were not included in the training set; all
reactivation of the target feature level within the aHC (pHC) was
movie data was used in each fold). The non-negative constraint
the DV, reactivation of the three non-target feature levels within
was included to reduce the possibility that a complex linear
the aHC (pHC) were three IVs, and reactivation of all feature
combination of low-level features may approximate one or more
levels within the pHC (aHC) were four IVs. The residuals from the
high-level features. The regularization parameter (lambda) was
models were used as measures of feature-specific reactivation in
determined by testing 5 log-spaced values from approximately
all within-subject analyses, replacing the reactivation measures
1/10000 to 1 (using the nnlasso function’s path feature). For each
used as the DVs.
value of the regularization parameter, the model parameters h
were estimated for each vertex and then prediction accuracy
(sum of squared errors; SSE) was measured on the held-out
Bootstrap Statistics
encoding data. For each vertex, the regularization parameter
(lambda) that produced the highest prediction accuracy was For the within-subject LME models, confidence intervals and P-
retained for image decoding during recall. values were calculated with bootstrap statistical analyses (1000
samples) using the BootMer function (Bates et al. 2015). For
the between-subject linear models, confidence intervals and P-
values were generated with bootstrap statistical analyses (1000
Image Decoding samples) with random sampling over subjects.
For feature-specific reactivation, encoding models were used to
predict neural activity during recall for each combination of sub-
Results
ject, feature-level, ROI, and retrieval trial (148 cortical FreeSurfer
ROIs and 10 hippocampal ROIs). The accuracy of this prediction Recognition Accuracy
was assessed as follows: 1) for each combination of subject,
Recognition accuracy, averaged across participants, was 83.3%
feature-level, and ROI, the predicted neural activation patterns
(SD = 6.8%; chance = 50%). Accuracy on old and lure trials was
for the 90 images viewed during the encoding task were gener-
81.7% (SD = 9.8%) and 85.0% (SD = 10.7%), respectively, with no
ated using a model that was trained on the movie and encod-
significant difference in accuracy between the two conditions
ing task data, excluding data from encoding trials wherein the
(t(24) = −1.07, P = 0.295, paired samples, two-tailed t-test) (Sup-
predicted image was viewed using 3-fold cross validation; 2)
plementary Fig. 2). Participants failed to respond within the 3 s
for each retrieval trial, the predictions were correlated (Pear-
old/new response period on 1.0% (SD = 1.5%) of trials. Those trials
son correlation across vertices within the given ROI) with the
were classified as incorrect.
observed neural activity during recall resulting in 90 correlation
coefficients per trial. 3) For each retrieval trial, the 90 correlation
coefficients were ranked in descending order, and the rank of
Recognition Accuracy and Hippocampal Reactivation
the prediction associated with the recalled image was recorded
during Recall
(1 = highest accuracy, 90 = lowest accuracy). 4) This rank was then
subtracted from the mean rank (45.5) so that 0 was chance, and To determine whether detailed low-level visual features are rep-
a positive value indicated greater-than-chance accuracy for the resented by the hippocampus—particularly the pHC—we first set
given trial (44.5 = highest accuracy, −44.5 = lowest accuracy). 5) out to examine the relationship between trial-by-trial recogni-
The ranks were placed into four groups by layer (1–4, 5–9, 10– tion accuracy and feature-specific reactivation within the aHC
13, 14–16) and averaged together within each group, reducing the and pHC. We relied upon the participants’ ability to distinguish
feature-levels from 16 to 4. between their memory of the previously seen image and a similar
For image-specific reactivation, a similar decoding method lure to indicate whether they recalled a detailed and accurate
was used (steps 1–4 ignoring references to feature-levels), except representation of the encoded image. The lures had similar
the predicted neural activation patterns for the 90 images were low-level features and almost identical semantic features to
the average activation patterns (over four trials) when the partic- the old image, so, while low-level features would be the most
ipant viewed each image during encoding. discriminative, the participant would still require a detailed and
The reactivation results were averaged over bilateral ROI pairs accurate memory of those features to perform well, i.e., a “low-
(for cortical and hippocampal ROIs) to produce reactivation val- resolution”/gist-like representation of low-level features would
ues for 74 bilateral cortical ROIs, and 5 bilateral hippocampal be insufficient and potentially misleading.
ROIs. To acquire anterior and posterior hippocampal reactivation We did not solely rely upon our reactivation measure to
values, the two most anterior and the two most posterior hip- distinguish representations with small differences because the
pocampal ROIs (the middle ROI was not included) were averaged amount of visual detail that can be decoded from fMRI scans
together, respectively. is limited—even in best-case scenarios such as scans of theDetailed Episodic Memory Depends on Concurrent Reactivation Bone and Buchsbaum 7
neocortex during perception (Wen et al. 2018, Fig. 8). Fine dis- aHC, pHC, and the four feature levels, residuals extracted from
tinctions between neural representations would be considerably linear models (with the variance shared between the aHC, pHC
more difficult to detect within the hippocampus due to its size, and the four feature levels removed) were used in the place of
the variety of information stored there, and the compression that the reactivation measures in the above analysis (see “Accounting
must therefore occur within the region. Instead, the reactivation for Shared Variance Between ROIs and Feature Levels” in section
measure was used to indicate whether participants were able to Materials and Methods). Residuals were used in this way for all
at least reinstate an accurate “low-resolution” representation on subsequent analysis. The coefficients from these models are
a given trial that was sufficient to distinguish the target image depicted in Figures 2 and 3 (feature-specific: 2a-b, 3a-c; image-
from the other images seen during encoding. More detailed specific: 2c, 3d).
reactivation sufficient to distinguish the target image from the Consistent with previous findings of individual differences
similar lure was inferred from the relation between reactivation within the visual cortex (Bone et al. 2020), a significant
and recognition accuracy. A positive trial-by-trial correlation was positive interaction was found between participants’ average
Downloaded from https://academic.oup.com/cercorcomms/article/2/3/tgab045/6322941 by guest on 09 December 2021
expected only if accurate fine-grained features were reactivated lure accuracy and low-level visual reactivation within the
within the ROI because reactivation of a “low-resolution” gist- pHC [β = 0.21, P = 0.001; one-tailed 1000 sample bootstrap—all
like representation alone would not be sufficient to distinguish bootstrap statistics used 1000 samples] (Fig. 2a). In contrast, the
the old image from a lure. Conversely, a negative trial-by-trial interaction with low-level visual reactivation within the aHC
correlation was expected if successful reactivation of a “low- was negative [albeit not significantly so: β = −0.10, P = 0.102;
resolution” representation was generally associated with reacti- two-tailed bootstrap] and significantly less than the pHC
vation of inaccurate and misleading fine-grained features within interaction [P = 0.001; paired-samples one-tailed bootstrap].
the ROI, as would be the case for individuals who tend to have a A qualitative examination of the interaction coefficients in
strong memory for the gist of a visual scene but a weak memory Figure 2a indicates that this relationship between the pHC
for visual details. and aHC is consistent across visual feature levels. To assess
Aside from allowing one to distinguish gist-like and detailed this trend quantitatively, we averaged the coefficients across
reactivation, correlating reactivation with recognition accuracy feature levels and found that the averaged pHC interaction
also accounts for memory variability, both within- and between- coefficient was significantly greater than zero and the aHC
subjects. Within-subjects, one must account for the fact that the coefficient [pHC: β = 0.09, P = 0.045; one-tailed bootstrap; aHC:
participants did not successfully reactivate the relevant neural β = −0.08, P = 0.112; two-tailed bootstrap; difference: P = 0.010;
patterns and recall the target image on all trials. Incorrect trials paired-samples one-tailed bootstrap] (Fig. 2b). Qualitatively
can be associated with negative reactivation (if the reactivation similar albeit quantitatively weaker interaction coefficients were
pattern is closer to the non-target image patterns than the target found using the image-specific reactivation model [pHC: β = 0.07,
image pattern), resulting in a positive reactivation mean on cor- P = 0.120; one-tailed bootstrap; aHC: β = −0.07, P = 0.204; two-
rect trials potentially being counteracted by negative reactivation tailed bootstrap; difference: P = 0.042; paired-samples one-tailed
on incorrect trials. This issue was mitigated by including trial- bootstrap] (Fig. 2c). Overall, these findings reveal pronounced
by-trial recognition accuracy within our model as the depen- individual differences, which suggest that reactivation within
dent variable (DV) and reactivation as independent variables (IV). the posterior hippocampus, particularly low-level visual reacti-
Between-subjects, one must account for individual differences in vation, is more strongly associated with recognition performance
detailed episodic recall. Accounting for individual differences in for participants with high lure accuracy.
the accuracy of detailed visual memory was necessary because To account for these striking individual differences, the par-
the trial-by-trial correlation between recognition accuracy and tial regression coefficients for the relation between recognition
low-level visual reactivation was expected to be positive for indi- accuracy and neural reactivation were assessed for participant
viduals who tend to have a strong memory for visual details lure accuracy one standard deviation above average (95%; Fig. 3a)
and negative for individuals who tend to have a strong memory and one standard deviation below average (75%; Fig. 3b). We first
for the gist of a visual scene but a weak memory for visual examine the results for individuals with high lure accuracy
details. Individual differences in mean accuracy, particularly lure (Fig. 3a). As hypothesized, the low-level visual reactivation
accuracy, were expected to relate to how successful the partici- coefficient within the pHC was significantly greater than zero
pant was at reactivating neural patterns representing the fine- and was also significantly greater than the corresponding aHC
grained visual features that could be used to distinguish the lure coefficient [pHC: β = 0.20, P = 0.021; one-tailed bootstrap; aHC:
from the encoded image. We therefore accounted for individ- β = −0.18, P = 0.076; two-tailed bootstrap; pHC—aHC: P = 0.006;
ual differences in fine-grained visual memory by including an paired-samples one-tailed bootstrap]. Looking beyond low-level
interaction between reactivation and each subject’s mean lure features, we see that the pHC coefficient was significantly
accuracy. greater than zero for high-level features [β = 0.26, P = 0.018;
A binomial mixed linear effects (MLE) model was constructed one-tailed bootstrap; FDR corrected over feature levels], and
with trial-by-trial accuracy as the dependent variable (DV), the pHC coefficients were significantly greater than the aHC
feature-specific reactivation of four feature levels (low-, mid-, coefficients for all feature levels [mid-level visual: P = 0.022;
high-level visual and semantic) within the aHC and pHC as eight high-level visual: P = 0.006; semantic: P = 0.045; paired-samples
independent variables (IV), the interaction between participants’ one-tailed bootstrap; FDR corrected over feature levels]. Qualita-
average lure accuracy and the four levels of feature-specific tive analysis of Figure 3a suggests that interaction coefficients
reactivation within the aHC and pHC as eight IVs, probe type (old are generally positive within the pHC and negative within
or lure) as an IV (control), and subject and image pair as crossed the aHC. The coefficients averaged over feature levels (Fig. 3c)
random effects (random intercept only due to model complexity confirm this trend [pHC: β = 0.15, P = 0.031; one-tailed bootstrap;
limitations). In addition to the feature-specific reactivation aHC: β = −0.18, P = 0.024; two-tailed bootstrap; pHC—aHC:
model, a similar binomial MLE model was constructed in which P = 0.004; paired-samples one-tailed bootstrap]. As with the
image-specific reactivation replaced the four levels of feature- interaction coefficients, the image-specific reactivation model
specific reactivation. To focus on the unique contributions of the produced qualitatively similar yet quantitatively weaker results8 Cerebral Cortex Communications, 2021, Vol. 2, No. 3
Downloaded from https://academic.oup.com/cercorcomms/article/2/3/tgab045/6322941 by guest on 09 December 2021
Figure 2. The trail-by-trial relation between recognition accuracy and neural reactivation within the anterior and posterior hippocampus differs according to individual
differences in average lure accuracy. (a) Within-subject partial regression coefficients for the interaction between feature-specific neural reactivation and each subjects’
average recognition lure accuracy with respect to trial-by-trial recognition accuracy. (b) The coefficients in (a) averaged over feature levels. (c) The same interaction as
(a) except with item-specific (instead of feature-specific) reactivation. Error bars are 90% CIs; ∼ indicates P < 0.10, ∗ indicates P < 0.05, ∗∗ P < 0.01, one-tailed bootstrap;
FDR corrected over visual feature levels except for low-level features because, in accordance with our hypotheses, low-level features were prioritized (indicated by the
red boxes).
[pHC: β = 0.15, P = 0.031; one-tailed bootstrap; aHC: β = −0.12, the location (and features) of reactivation during successful
P = 0.148; two-tailed bootstrap; pHC—aHC: P = 0.005; paired- recall.
samples one-tailed bootstrap] (Fig. 3d). Taken as a whole, our As predicted, a significantly negative coefficient was found
results support the claim that the pHC represents detailed low- for low-level visual features within the aHC [β = −0.10, P = 0.002;
and high-level visual features (which were expected to facilitate two-tailed bootstrap], whereas the coefficient for low-level fea-
recognition accuracy), while the aHC represents more gist-like tures within the pHC trended positive [β = 0.04, P = 0.064; one-
representations (which were expected to hinder recognition tailed bootstrap; pHC—aHC: P < 0.001; paired-samples one-tailed
accuracy). bootstrap] (Fig. 4a). Positive coefficients were also found for mid-
The above findings only held for individuals with high lure level, high-level and (marginally) semantic features within the
accuracy. For individuals with low lure accuracy, we found the pHC, indicating that individuals with high lure accuracy relied
opposite (Fig. 3b), i.e., the low-level visual coefficient within the to a greater extent upon representations within the pHC [mid-
pHC was significantly less than zero and marginally less than the level visual: β = 0.05, P = 0.020; high-level visual: β = 0.06, P = 0.008;
aHC coefficient [pHC coefficient: β = −0.22, P = 0.032; two-tailed semantic: β = 0.02, P = 0.064; one-tailed bootstrap; FDR corrected
bootstrap; aHC coefficient: β = 0.03, P = 0.380; one-tailed boot- over feature levels]. The coefficients averaged over feature lev-
strap; pHC—aHC difference: P = 0.060; paired-samples two-tailed els (Fig. 4b) support this interpretation [pHC: β = 0.04, P = 0.003;
bootstrap]. No other coefficients were significant. Our results one-tailed bootstrap; aHC: β = −0.04, P = 0.188; two-tailed boot-
indicate that participants with low lure accuracy did not simply strap; pHC—aHC: P = 0.011; paired-samples one-tailed bootstrap].
fail to reactivate low-level visual details, but instead reactivated As with previous results, a variant of the above model using
inaccurate and misleading details that hurt their performance on image-specific reactivation produced qualitatively similar yet
the recognition task. quantitatively weaker results [pHC: β = 0.02, P = 0.173; one-tailed
If individuals with low lure accuracy are unable to accurately bootstrap; aHC: β = −0.04, P = 0.092; two-tailed bootstrap; pHC—
recall detailed low-level features within the pHC, how did they aHC: P = 0.029; paired-samples one-tailed bootstrap] (Fig. 4c). Our
attempt to compensate? Although we see no positive coefficients findings support our hypothesis that individuals with low lure
within Figure 3b that does not necessarily mean that the accuracy attempted to compensate for inaccurate low-level rep-
participants did not recall the associated features. An alternative resentations within the pHC by relying upon gist-like representa-
explanation for the null findings is that the features were not tions within the aHC, although the lack of a significantly positive
sufficient for the difficult recognition task, as we hypothesized low-level aHC coefficient within Figure 3b indicates that this
for sematic features and the gist-like features of the aHC. If strategy was unsuccessful for the current task.
individuals with low lure accuracy relied to a greater extent
upon these suboptimal features, then we should see a negative
relationship between the participants’ average lure accuracy Interaction Between the Hippocampus and Calcarine Sulcus
and feature-specific reactivation. To test this hypothesis, a According to leading theories (Teyler and DiScenna 1986;
between-subject linear model was constructed with participants’ McClelland et al. 1995; Nadel et al. 2000; Sekeres et al. 2018),
average lure accuracy as the dependent variable (DV) and feature- episodic memories are encoded in distributed neural networks
specific reactivation of the four feature levels within the aHC comprising hippocampal and neocortical neurons. Therefore,
and pHC as eight independent variables (IV). Reactivation values hippocampal reactivation should facilitate episodic recognition
from trials with incorrect old/new responses were excluded accuracy only when it co-occurs within relevant neocortical
because we were interested in between-subject differences in regions (and vice versa). To test this claim, a linear model wasDetailed Episodic Memory Depends on Concurrent Reactivation Bone and Buchsbaum 9
Downloaded from https://academic.oup.com/cercorcomms/article/2/3/tgab045/6322941 by guest on 09 December 2021
Figure 3. The trial-by-trial relation between recognition accuracy and neural reactivation within the anterior and posterior hippocampus for participants with low-
and high-average lure accuracy. (a) Within-subject partial regression coefficients from the same model as Figure 2 for the relation between feature-specific neural
reactivation and trial-by-trial recognition accuracy for participant lure accuracy 1 standard deviation above average (95%). (b) the same as (a) but for participant lure
accuracy 1 standard deviation below average (75%). (c) The coefficients in (a) and (b) averaged over feature levels. (d) The same coefficients as (a) and (b) except with
item-specific (instead of feature-specific) reactivation. Error bars are 90% CIs; ∗ indicates P < 0.05, ∗∗ P < 0.01, one-tailed bootstrap; (∼) indicates P < 0.10, (∗ ) indicates
P < 0.05, two-tailed bootstrap; FDR corrected over visual feature levels except for low-level features because, in accordance with our hypotheses, low-level features were
prioritized (indicated by the red boxes).
used to investigate whether a positive interaction exists between calcarine sulcus was expected only for participants with high
low-level visual reactivation within the pHC and calcarine sulcus lure accuracy.
(the neocortical region wherein V1 is concentrated; DeYoe The binomial MLE model for the interaction between the
et al. 1996), with respect to recognition accuracy (Fig. 5a). We hippocampus and calcarine sulcus consisted of trial-by-trial
focused on low-level features for this analysis because low-level accuracy as the dependent variable (DV), reactivation of all four
reactivation correlated with recognition accuracy (indicating feature levels within the anterior and posterior hippocampus as
that the features are useful for the task), and it is known a 8 IVs, low-visual reactivation within the calcarine sulcus as an
priori where low-level visual features are represented within IV, the interactions between low-visual reactivation within the
the neocortex. Given that participants with low lure accuracy calcarine sulcus and all 8 hippocampal reactivation measures
showed no positive relationship between recognition accuracy as 8 IVs, the interactions between participants’ average lure
and hippocampal reactivation (Fig. 3b), indicating that they were accuracy and all measures of reactivation (low-level within the
unable to reactivate an accurate index of early visual cortical calcarine sulcus and all levels within the aHC and pHC) as 9
activity, a positive interaction between the hippocampus and IVs, the three-way interactions between average lure accuracy,10 Cerebral Cortex Communications, 2021, Vol. 2, No. 3
Downloaded from https://academic.oup.com/cercorcomms/article/2/3/tgab045/6322941 by guest on 09 December 2021
Figure 4. Relation between participants’ average recognition lure accuracy and neural reactivation within the hippocampus on correct trials. (a) Between-subject
partial regression coefficients for the relation between feature-specific neural reactivation within the anterior and posterior hippocampus and each subjects’ average
recognition lure accuracy. Only reactivation values on trials with correct old/new responses were included. (b) The coefficients in (a) averaged over feature levels. (c)
The same coefficients as (a) except with item-specific (instead of feature-specific) reactivation. Error bars are 90% CIs; ∼ indicates P < 0.10, ∗ P < 0.05, ∗∗ P < 0.01, ∗∗∗
P < 0.001, one-tailed bootstrap; (∼) indicates P < 0.10, (∗∗ ) P < 0.01, two-tailed bootstrap; FDR corrected over visual feature levels except for low-level features because, in
accordance with our hypotheses, low-level features were prioritized (indicated by the red boxes).
low-visual reactivation within the calcarine sulcus and all 8 claim that the hippocampus facilitates episodic memory by
hippocampal reactivation measures as 8 IVs, probe type (old storing and retrieving a representation, or “index,” of the
or lure) as an IV (control), and subject and image pair as crossed neocortical activity that occurred during perception.
random effects (random intercept only due to model complexity
limitations).
Discussion
Figure 5b depicts the interaction between low-level visual
reactivation within the calcarine sulcus and the hippocampus We investigated the relationship between feature-specific reacti-
(see Supplementary Fig. 3 for all interaction coefficients). As vation within the hippocampus and neocortex and performance
predicted by the hippocampus’s role in indexing neocortical on a recognition task that required retrieval of visual details.
activity, the pHC interaction coefficient was significantly We showed that image-specific and feature-specific reactiva-
greater than zero for individuals with high lure accuracy tion within the pHC, and not the aHC, positively correlated
[pHC: β = 0.24, P = 0.017; aHC: β = 0.12, P = 0.105; one-tailed with recognition accuracy, indicating that the pHC indexes more
bootstrap]. For individuals with low lure accuracy, the interaction detailed features relative to the aHC. Moreover, striking indi-
coefficients were approximately zero [pHC: β = 0.02, P = 0.466; vidual differences were observed such that recognition accu-
aHC: β = 0.01, P = 0.476; one-tailed bootstrap], with the pHC racy was positively associated with low-level visual reactivation
coefficient marginally lower than the corresponding coefficient within the pHC for individuals with above-average recognition
for individuals with high lure accuracy [P = 0.058; paired- lure accuracy, whereas the opposite relationship was observed
samples one-tailed bootstrap]. To elaborate upon the observed for individuals with below-average recognition lure accuracy.
pHC interaction, Figure 5c depicts the pHC partial regression Our results show that representations within the hippocampus
coefficients when reactivation within the calcarine sulcus is extend to low-level visual features, and suggest that individ-
either high (1; Z-scored) or low (−1), and Figure 5d depicts the uals with below-average recognition performance reactivated
calcarine sulcus partial regression coefficients when reactivation inaccurate low-level details within the pHC (i.e., representations
within the pHC is either high (1) or low (−1). For individuals with with small receptive fields) and relied—ineffectually—upon the
high lure accuracy, low-level visual reactivation within both hip- reactivation of less detailed low-level visual features within the
pocampal and early visual ROIs was positively associated with aHC (i.e., representations with large receptive fields) which are
recognition accuracy only when reactivation within the other more likely to overlap with the features of the lure images. Lastly,
ROI was high [high reactivation in the other ROI: pHC: β = 0.46, the correlation between recognition accuracy and low-level reac-
P = 0.001; calcarine sulcus: β = 0.35, P = 0.007; one-tailed bootstrap; tivation within the hippocampus was found to depend upon low-
low reactivation in the other ROI: pHC: β = −0.02, P = 0.890; level reactivation within the early visual cortex (calcarine sulcus),
calcarine sulcus: β = −0.12, P = 0.352; two-tailed bootstrap]. The and vice versa. This mutual dependence between hippocampal
results indicate that trial-by-trial recognition accuracy was only and neocortical feature-specific reactivation supports the claim
associated with low-level visual reactivation when it co-occurred of leading theories of episodic memory that the hippocampus
within the pHC and calcarine sulcus, thereby supporting the mediates neocortical reactivation by storing a sparse representa-You can also read