Microphysical variability of Amazonian deep convective cores observed by CloudSat and simulated by a multi-scale modeling framework - Atmos. Chem ...
←
→
Page content transcription
If your browser does not render page correctly, please read the page content below
Atmos. Chem. Phys., 18, 6493–6510, 2018
https://doi.org/10.5194/acp-18-6493-2018
© Author(s) 2018. This work is distributed under
the Creative Commons Attribution 4.0 License.

Microphysical variability of Amazonian deep convective cores
observed by CloudSat and simulated by a multi-scale
modeling framework
J. Brant Dodson1 , Patrick C. Taylor2 , and Mark Branson3
1 ScienceSystems and Applications, Inc., Hampton, VA, USA
2 ClimateScience Branch, NASA Langley Research Center, Hampton, VA, USA
3 Department of Atmospheric Science, Colorado State University, Ft. Collins, CO, USA

Correspondence: J. Brant Dodson (jason.b.dodson@nasa.gov)

Received: 19 September 2017 – Discussion started: 6 October 2017
Revised: 5 March 2018 – Accepted: 12 March 2018 – Published: 8 May 2018

Abstract. Recently launched cloud observing satellites pro-       in the spatiotemporal distribution of precipitation (includ-
vide information about the vertical structure of deep con-        ing floods and drought), radiation, and other climate sys-
vection and its microphysical characteristics. In this study,     tem elements (Arakawa, 1975). Simulating convection re-
CloudSat reflectivity data is stratified by cloud type, and the   lies on our understanding of the physics controlling and
contoured frequency by altitude diagrams reveal a double-         modulating its behavior, including cloud microphysics, cloud
arc structure in deep convective cores (DCCs) above 8 km.         scale dynamics (updraft/downdrafts), entrainment, and other
This suggests two distinct hydrometeor modes (snow versus         large-scale atmospheric interactions, cloud–surface interac-
hail/graupel) controlling variability in reflectivity profiles.   tions, and cloud–radiation interactions (Randall et al., 2003;
The day–night contrast in the double arcs is about four times     Arakawa, 2004).
larger than the wet–dry season contrast. Using QuickBeam,            Atmospheric convection exhibits variability on multiple
the vertical reflectivity structure of DCCs is analyzed in        timescales, including diurnal and seasonal. The convective
two versions of the Superparameterized Community Atmo-            diurnal cycle (CDC), a well-documented and important mode
spheric Model (SP-CAM) with single-moment (no graupel)            of variability, is particularly pronounced over land (Yang and
and double-moment (with graupel) microphysics. Double-            Slingo, 2001; Nesbitt and Zipser, 2003; Tian et al., 2004;
moment microphysics shows better agreement with observed          Kikuchi and Wang, 2008; Yamamoto et al., 2008). The CDC
reflectivity profiles; however, neither model variant captures    is characterized by a rapid insolation-driven transition from
the double-arc structure. Ultimately, the results show that       shallow to deep convection in the early afternoon, followed
simulating realistic DCC vertical structure and its variabil-     by either a slow decay through the evening and early morn-
ity requires accurate representation of ice microphysics, in      ing, or transition into mesoscale convective systems (MCSs),
particular the hail/graupel modes, though this alone is insuf-    persisting into the next morning (Machado et al., 1998; Nes-
ficient.                                                          bitt and Zipser, 2003). Geostationary satellite observations,
                                                                  in particular, have provided a global view of the spatial com-
                                                                  plexity of the CDC (Yang and Slingo, 2001). However, most
1   Introduction                                                  satellite data sets only observe convective cloud top proper-
                                                                  ties using passively sensed visible and infrared radiances and
As a driver of the hydrological cycle, the frequency and in-      cannot sense the cloud interior. With passive sensors, it is
tensity of atmospheric deep convection influences spatial and     difficult to clearly distinguish between deep convective cores
temporal characteristics of precipitation. Our ability to simu-   (DCCs) and related anvils, the latter having a diurnal cycle
late convective behavior on short (diurnal) and long (climate     offset from DCCs by approximately three hours (e.g., Fu et
change) timescales significantly modifies projected changes       al., 1990; Lin et al., 2000; Zhang et al., 2008).

Published by Copernicus Publications on behalf of the European Geosciences Union.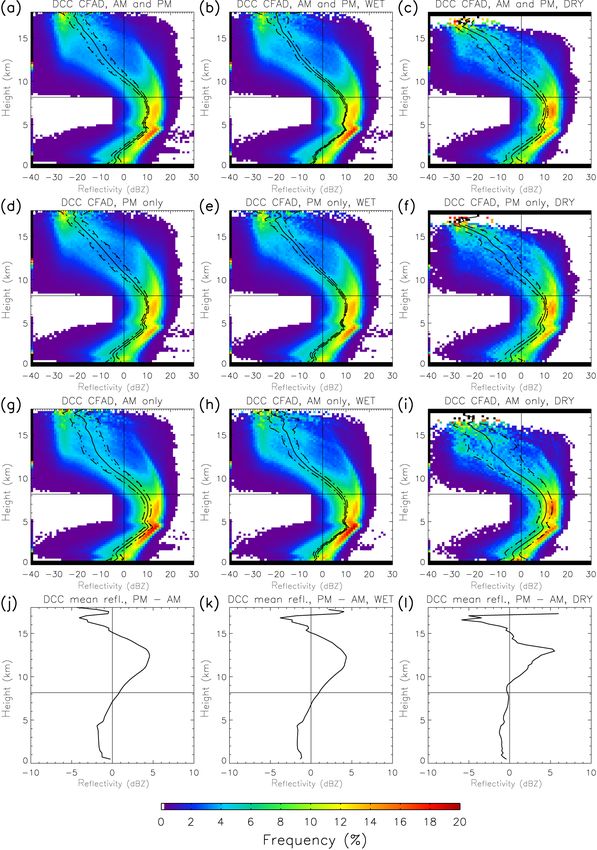
6494                                      J. B. Dodson et al.: Microphysical variability of Amazonian deep convective cores

   A small number of satellites, such as CloudSat (Stephens         natures of different cloud types, including those generated at
et al., 2008), carry radars that penetrate cloud tops, sensing      different times in the convective life cycle, creating a clearer
the interior of deep convection. Spaceborne radars allow the        view of the day–night contrast.
examination of deep convection invisible to most satellites,           The Amazon Basin is an ideal location for studies of the
especially internal structure and microphysics. CloudSat car-       CDC for multiple reasons. First, the Amazon has a well-
ries a W-band radar which is specifically attuned to ob-            defined, high-amplitude continental CDC, peaking regularly
serve smaller cloud liquid and ice hydrometeors. Other satel-       in the mid-afternoon (Yang and Slingo, 2001). Amazonia
lites, such as Tropical Rainfall Measuring Mission (TRMM)           has a prominent recurring propagating coastal squall line,
(Kummerow et al., 1998) and the Global Precipitation Mea-           and various secondary local effects related to orography
surement (GPM) mission (Hou et al., 2014) are attuned               and the Amazon River (Janowiak et al., 2005; Burleyson et
to larger precipitation-sized hydrometeors. A sizable body          al., 2016). However, aside from the aforementioned squall
of literature describes observations of tropical convection         line, it lacks the major diurnally propagating signals ob-
using these satellites (e.g., Petersen and Rutledge, 2001;          served in other continental convective regions (e.g., the cen-
Schumacher et al., 2004; Nesbitt and Zipser, 2003; Liu et           tral United States and southern China) (Wallace, 1975; Dai et
al., 2007; Liu and Zipser, 2015; Liu and Liu, 2016). In addi-       al., 1999; Zhou et al., 2008) that make generalizing regional
tion to radars, there are lidars such as that carried by Cloud-     CDC studies difficult. Second, Amazonia has a well-defined
Aerosol Lidar and Infrared Pathfinder Satellite Observation         wet and dry season, allowing a seasonal examination of the
(CALIPSO) (Winker et al., 2009), which has been used to             CDC including distinct meteorological forcing for convec-
examine the properties of convection and anvils (e.g., Sassen       tion: locally forced (common in the dry season) versus non-
et al., 2009; Riihimaki and McFarlane, 2010; Del Genio et           locally forced (common in the wet season). Finally, the Ama-
al., 2012).                                                         zonian CDC alters the top-of-atmosphere radiative diurnal
   Spaceborne cloud radars, precipitation radars, and lidars        cycle (Taylor, 2014a, b; Dodson and Taylor, 2016), represent-
offer complementary views of tropical convection. Cloud             ing an influence on regional and global climate that meteo-
radars sample the higher altitudes and anvils of DCCs, as           rological reanalyses and climate models struggle to simulate
well as associated stratiform clouds, but are ineffective at        (Yang and Slingo, 2001; Itterly and Taylor, 2014; Itterly et
lower altitudes where precipitation-sized hydrometeors at-          al., 2016).
tenuate the radar beam. Precipitation radars examine the               This paper documents and describes a detailed view of
lower- and mid-level structure of DCCs, but cannot see cloud        the diurnal variability of the convective vertical structure ob-
tops and anvils. Lidars are sensitive to the tops of thick clouds   served by CloudSat. One of the key methods used to accom-
and can measure their altitude with high precision; how-            plish this is to separate the variability in convective frequency
ever, they are unable to penetrate the tops of DCCs and most        from the variability in radar reflectivity. This new perspec-
anvils. In this study, we will focus on the high-level features     tive not only clarifies previous findings, but also reveals a
of DCCs and anvils, where CloudSat is most useful.                  unique, previously unreported double-arc structure in the av-
   CloudSat’s polar orbit, crossing the Equator during early        erage radar reflectivity profile of deep convection. This new
afternoon and early morning, provides two views of the              finding relates to the ice microphysical structure relevant to
CDC, near the beginning and end of the mean precipita-              convective dynamic and thermodynamic properties, includ-
tion diurnal cycle over land. This ability has not been well-       ing precipitation rate, downdraft and cold pool strength (af-
exploited in the literature. The study by Liu et al. (2008)         fected by evaporation and sublimation of hydrometeors), la-
represents one of the few analyses of observed day–night            tent heating vertical profile (and associated warming and dry-
differences using CloudSat. They surveyed day–night con-            ing of the convective environment), and detrained water mass
trasts between reflectivity profiles over both tropical land and    (McCumber et al., 1991; Grabowski et al., 1999; Gilmore et
ocean, finding that high reflectivity clouds occur more fre-        al., 2004; Li et al., 2005). Based on our results, the simulation
quently at night than during the day at all altitudes except at     of deep convective characteristics, and the comparison be-
cloud tops (13 km). The authors interpret this difference as a      tween simulation and observations, benefits from a detailed
consequence of the CDC, in which the peak in deep convec-           representation of ice microphysics.
tive frequency occurs after the 13:30 LST CloudSat overpass
time, while there are still frequent lingering MCSs during the
01:30 LST overpass. However, previous efforts muddle the            2     Data and methodology
physical interpretation by mixing the frequency of both shal-
low and deep convection, the vertical convective reflectivity       2.1    Observations
profile, and the properties of other cloud types. Resolving
these issues, we examine the day–night contrast in the reflec-      Cloud observations are taken from CloudSat, a cloud observ-
tivity profile of mature deep convection after stratifying by       ing member of the A-Train (Stephens et al., 2008), orbiting
cloud type. This methodology allows the separation of con-          at 705 km altitude, 98◦ inclination, and with an equatorial
vective frequency from the individual reflectivity profile sig-     crossing time of 01:30 am/pm local time. The primary in-

Atmos. Chem. Phys., 18, 6493–6510, 2018                                              www.atmos-chem-phys.net/18/6493/2018/
J. B. Dodson et al.: Microphysical variability of Amazonian deep convective cores                                            6495

strument is the Cloud Profiling Radar (CPR), a 94 GHz radar         parameterization (among other things) of the Community At-
with a 1.1 km wide effective footprint and 480 m vertical res-      mospheric Model (CAM) with a cloud-resolving model (the
olution, oversampled to create a 240 m effective vertical res-      System for Atmospheric Modeling, described by Khairout-
olution. CloudSat operated as designed from June 2006 to            dinov and Randall, 2003), coupled within each GCM grid
March 2011, until suffering a battery malfunction. This time        point. This is a study of opportunity, using data made avail-
period serves as the temporal data domain.                          able from past work, and so the time domain is limited to
   For cloud-type stratification, the CPR cloud mask and            an Amazonian dry season in the early 21st century. Only
radar reflectivity fields from the 2B-GEOPROF product               data from 02:00 and 14:00 LST are included in this analysis,
(Marchand et al., 2008) are used. The cloud-type stratifica-        which are closest to the CloudSat overpass times of 01:30
tion identifies the four following cloud types: DCCs, anvils        and 13:30 LST. We use two versions of SP-CAM, employing
(AVN), clouds attached contiguously with DCCs (CLD-D),              single-moment (SPV4) and double-moment (SPV5) micro-
and other clouds (CLD). DCCs are identified using a CPR-            physics. Hydrometeor mixing ratios for cloud ice, cloud wa-
based methodology on a profile-by-profile basis (i.e., with         ter, rain, snow, and graupel (double moment-only) taken from
no consideration to neighboring columns) according to three         the cloud-resolving model (CRM) component of SP-CAM
criteria from Dodson et al. (2013):                                 are used to simulate the associated 94 GHz reflectivity profile
                                                                    using the QuickBeam radar simulator (Haynes et al., 2007).
  1. must be at least 10 km tall
                                                                    The CRM is based on the System for Atmospheric Model-
  2. must have a continuous vertical region of reflectivity of      ing, and is run in two-dimensional mode, with 4 km horizon-
     at least −5 dBZ between 3 and 8 km altitude                    tal spacing and approximately 100 m–1 km vertical spacing
                                                                    (varying by altitude). The formulation of SPV5, and the dif-
  3. the maximum reflectivity value at any altitude in the          ferences between SPV4 and SPV5, are documented by Wang
     middle troposphere (3 to 8 km) must be at least 0 dBZ.         et al. (2011). The only major differences between SPV4 and
The lower altitude bound in criterion 2 is raised to 5 km when      SPV5 of direct relevance to deep convection are the micro-
heavy precipitation is detected (indicated by low surface re-       physical and radiative parameterizations; we attribute pri-
flectivity), accounting for attenuation effects. The latter two     mary differences between SPV4 and SPV5 to microphysics.
criteria restrict the set of profiles with deep cloud layers to        A major difference between the SPV4 and SPV5 micro-
those which likely contain active, vigorous DCCs only. These        physics is the treatment of precipitating hydrometeors. SPV4
criteria are guided by the cloud definitions used in creat-         has diagnostic variables for snow and graupel. The SPV4 mi-
ing the 2B-CLDCLASS product (Wang and Sassen, 2001).                crophysics scheme predicts only non-precipitating and pre-
When the data are stratified by these criteria, CloudSat ob-        cipitating hydrometeors, which are partitioned into frozen
served 187 457 vertical profiles of DCCs in the Amazon over         and liquid by temperature. Snow and graupel are diagnosed
the time domain, with just less than half (92 071, or 49 %)         from frozen precipitating water. However, snow and graupel
occurring during the daytime overpasses.                            as distinct hydrometeor species do not play a role in the prog-
   Figure 1 shows the spatial domain of the analysis region,        nostic microphysical equations in SPV4. In contrast, snow
centered on northern and central South America (25–0◦ S,            and graupel are prognosed hydrometeor types in SPV5, and
70–50◦ W). In addition, a CloudSat overpass through the do-         are treated as a distinct species in the prognostic microphys-
main displays the associated cloud presence, morphologies,          ical equations. So in addition to the reflectivity field calcu-
and radar reflectivity for a single overpass (Fig. 1a–c), as well   lated from precipitating ice in SPV4, we examine the in-
as the identified cloud types in the bottom panel (Fig. 1d).        fluence of partitioning the precipitating ice into diagnosed
This particular overpass provides an example of the stratifi-       snow graupel on the simulated radar reflectivity field. This
cation method, displaying a variety of deep convective cloud        new variant of SPV4 is hereby referred to as SPG4. Note that
systems and associated anvils, including narrow single-cell         there are no differences between SPV4 and SPG4 other than
updrafts to the north, and wider multi-celled convection to         the reflectivity fields simulated by QuickBeam. This lets us
the south. Note, only a subset of the profiles within deep con-     distinguish between the effects of adding graupel to the hy-
vective cloud systems are labeled DCCs – this is deliberate         drometeor species, and the effect of switching from single- to
to include only the profiles which likely contain active con-       double-moment microphysics. Because the hydrometeor pa-
vective updrafts.                                                   rameters in QuickBeam are similar for precipitating ice and
                                                                    snow, the main effect of the partitioning is the increased re-
2.2   Modeling                                                      flectivity from diagnosed graupel.
                                                                       It is difficult to directly compare satellite-retrieved and
To investigate the ability of models to simulate the observed       model-simulated convective cloud ice (Waliser et al., 2009).
DCC vertical structure and the influence of microphysics, we        Radar reflectivity serves as a substitute basis for comparison,
use the Superparameterized Community Atmospheric Model              where model reflectivity is computed with a radar simulator.
(SP-CAM) (Khairoutdinov et al., 2005). SP-CAM is a multi-           However, ice phase microphysical properties of DCCs are a
scale modeling framework (MMF) replacing the convective             key component in determining the model-simulated reflec-

www.atmos-chem-phys.net/18/6493/2018/                                                Atmos. Chem. Phys., 18, 6493–6510, 2018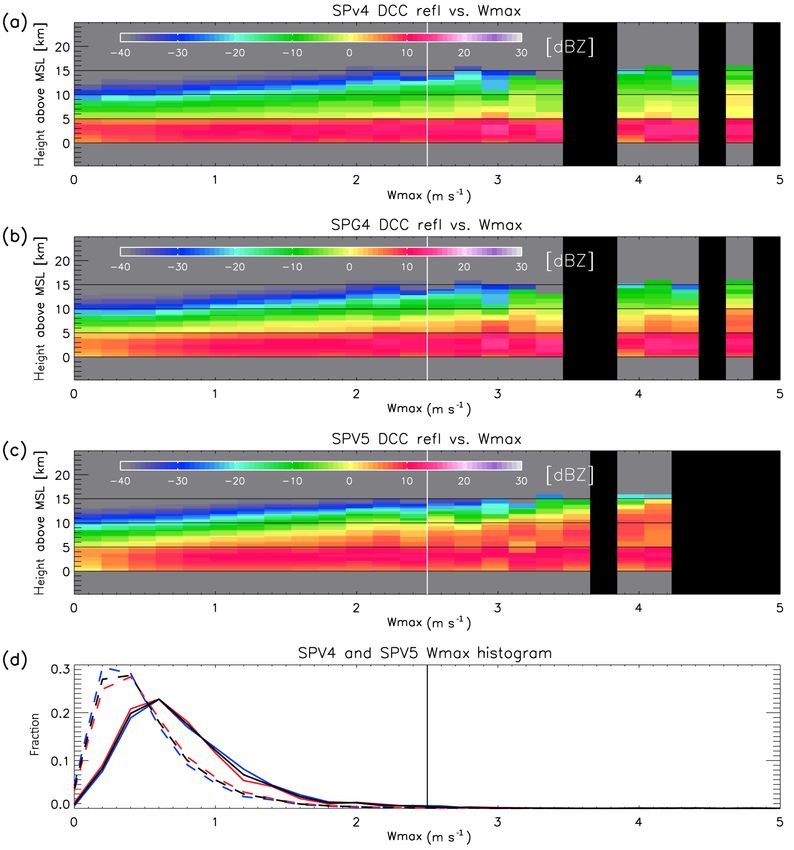
6496                                        J. B. Dodson et al.: Microphysical variability of Amazonian deep convective cores

Figure 1. (a–c) Example of a CloudSat cross-sectional observation of afternoon convection on 11 December 2008 at approx. 17:33 UTC
(13:33 LST). Left-to-right on the x axis corresponds with south-to-north. (a) is the cloud mask product from 2B-GEOPROF, with colors
representing the cloud mask value corresponding with certainty of cloud identification; (b) is radar reflectivity; and (c) is cloud type. Red
indicates DCCs, blue indicates anvils, dark gray indicates clouds attached contiguously with DCCs, and light gray indicates other clouds.
(d) Map of northern South America with the study region (25–0◦ S, 70–50◦ W) marked with the red box. The heavy black line crossing the
study region indicates the path of the CloudSat swath shown in panel (a). The dominant cloud type observed by CloudSat along the path is
indicated by the colored dots.

Atmos. Chem. Phys., 18, 6493–6510, 2018                                                    www.atmos-chem-phys.net/18/6493/2018/
J. B. Dodson et al.: Microphysical variability of Amazonian deep convective cores 6497
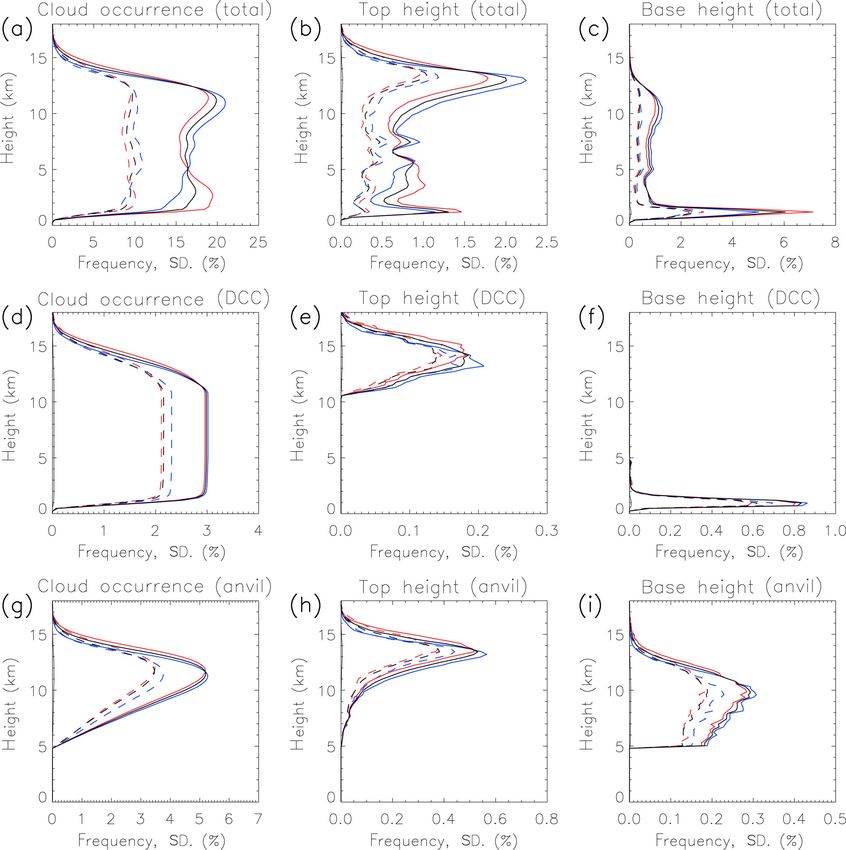
Figure 2. Top row: vertical frequency profiles of (a) cloud occurrence, (b) cloud top heights, and (c) cloud base heights. Black lines are for
day/night, and red (blue) is for day-only (night-only). Solid (dashed) line is the mean (standard deviation). Middle row: same as the top row,
but for (d) DCC-only occurrence, (e) top heights, and (f) base heights. Bottom row: same as the top row, but for (g) anvil-only occurrence,
(h) top heights, and (i) base heights.
tivity profile. This creates a challenge for interpreting simu- 3 Properties of convection as observed by CloudSat
lated reflectivity, as it is difficult to detangle the influence that
model microphysics has on the simulated reflectivity profile 3.1 Mean cloud properties
and its relationship with other properties of simulated con-
vection (e.g., vertical updraft velocity). Observed reflectiv- Untangling the influence of convective frequency on the deep
ity profiles are affected by multiple ice hydrometeor types, convective vertical reflectivity structure benefits from an ex-
including both snow and graupel/hail. In order for models amination of the mean CloudSat-observed cloud properties
to realistically simulate DCC reflectivity profiles, and thus (Fig. 2). First, we will look at the frequency of all cloud
allow for robust statistical reflectivity model/observation in- types, and then subset the clouds into DCCs and anvils.
tercomparison (in the vein of Liu et al., 2008), the models Clouds occur in a layer between 1.5 and 12 km in altitude,
must simulate both ice hydrometeors realistically (a function with small maxima in cloud occurrence frequency (COF)
of the microphysics) and the relationships between the hy- at 11.5 and 2.5 km (Fig. 2a). The vertical profile of cloud
drometeors and other aspects of convection (e.g., vertical ve- top heights (Fig. 2b) shows four regions of interest – a pri-
locity). Therefore, it is difficult to strictly and simply attribute mary maximum at 13 km, a secondary maximum at 1.2 km,
model–observational differences to specific aspects of the pa- a broad enhanced frequency region between 2.5 and 6 km,
rameterizations. Nevertheless, it is still possible and useful and a small maximum at 7.5 km. The cloud base heights
to show the aggregate effects that the choice of microphysics (Fig. 2c) show a large primary maximum at 1.2 km, a broad
have on the simulated reflectivity field, and so (at least par- secondary maximum centered at 11 km, and a small local
tially) account for model-observation differences. maximum at 5 km. These features are consistent with the
identified tri-modal vertical cloud structure in convectively
www.atmos-chem-phys.net/18/6493/2018/ Atmos. Chem. Phys., 18, 6493–6510, 2018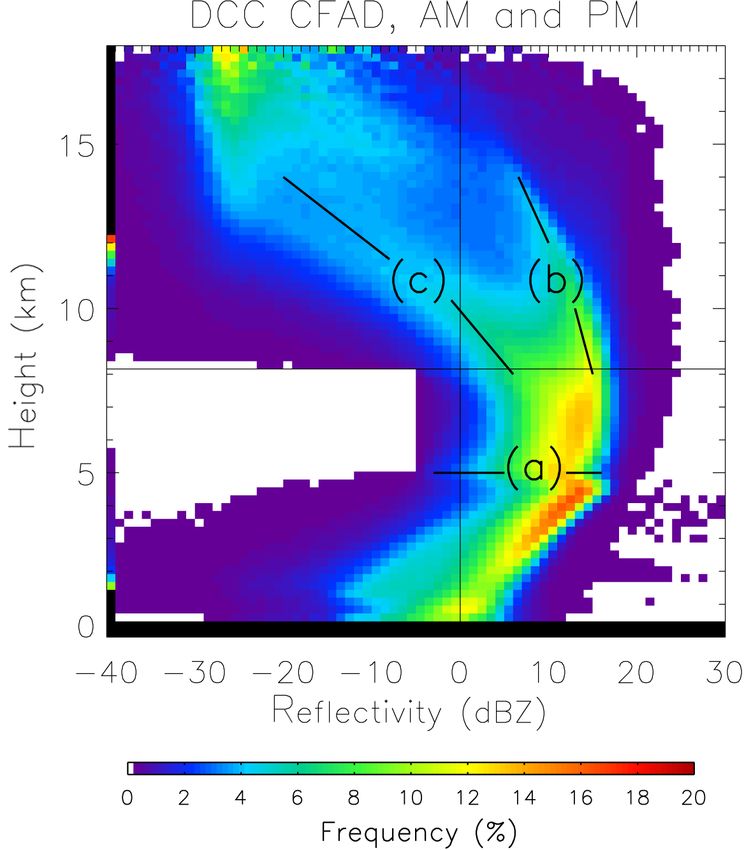
6498                                      J. B. Dodson et al.: Microphysical variability of Amazonian deep convective cores

active tropical regions (Johnson et al., 1999; Khairoutdinov
et al., 2009), with shallow convective clouds, cumulus con-
gestus, and DCCs with associated anvils comprising the bulk
of Amazonian clouds. The DCC-anvil and shallow cumulus
modes are more prominent in the data than the cumulus con-
gestus mode; this might be related to the greater variability
of top heights for congestus than the other cloud types, which
are constrained by the level of neutral buoyancy (for DCCs-
anvils) and the atmospheric boundary layer top (for shallow
cumulus).
   Mean COF vertical profiles differ significantly between
day and night, differences at most altitudes have p values
(two-tailed t test)  0.01. High (low) level clouds are en-
hanced during night (day), and the opposite suppressed. In
addition, high altitude clouds (above 12.5 km) are more fre-
quent during day than night. The cloud top height profiles
(Fig. 2b) show a contribution to high level cloud frequency
from a daytime top height increase (i.e., taller DCCs, likely       Figure 3. The contoured frequency by altitude diagrams (CFADs)
with overshooting tops), indicating that despite there being        of reflectivity for DCCs in Amazonia. The colors represent the prob-
fewer daytime high clouds they are taller than those at night.      ability density function (PDF, as percentage) of radar reflectivity
   DCCs occur in 3 % of CloudSat profiles over Amazonia             at each 240 m tall layer observed by CloudSat. The vertical (hori-
(Fig. 2d), with mean top heights near 14 km (Fig. 2e). The          zontal) black line indicates 0 dBZ (8 km). Three distinct features of
tallest DCCs reach an altitude of 18 km, which penetrate the        the CFAD, discussed in the text, are labeled on the figure. (a) indi-
tropopause and likely contribute to stratosphere–troposphere        cates the dark band, with the horizontal line segments showing the
interactions (Johnston and Solomon, 1979; Corti et al., 2008;       mean altitude. (b) and (c) mark the locations of the high and low
                                                                    reflectivity arcs, respectively. The diagonal line segments show the
Avery et al., 2017). DCCs are on average about 0.5 km taller
                                                                    orientation of each arc, and the rough values of the PDF modes.
during the day than night (also significant at p  0.01).
Anvil cloud frequency (Fig. 2g) peaks at 12 km, with anvil
top heights (Fig. 2h) reaching their maximum at 13.5 km
(0.5 km lower than DCCs). Anvil bases occur in a broad
layer between 5 km (by definition the lowest altitude) and          ing enhanced beam attenuation from melting hydrometeors
11 km, diminishing with height above this altitude (Fig. 2i).       at the freezing level. Reflectivity in the higher cloud alti-
The 5 km lower limit of anvil bases (where 5 km is chosen as        tudes (above 7.5 km) decreases with height primarily through
being near the freezing line) is evidentially an artificial limit   reduction in hydrometeor size – this is because, assuming
imposed by the methodology, and there may be no clear dis-          Rayleigh scattering and ignoring phase changes, hydrom-
tinction between anvil clouds and deeper free-tropospheric          eteor size dominates reflectivity (proportional to the sixth
clouds in nature.                                                   power of diameter) (Battan, 1973). Large hydrometeors fall
                                                                    out of the updraft more rapidly than small hydrometeors,
3.2    Deep convective reflectivity profiles                        leading to vertical size sorting.
                                                                       The CFAD associated with the DCC vertical profile dis-
The frequency component of the data for various cloud types         plays an interesting feature above 8 km. While the CFAD
has been isolated and described, so now the vertical structure      follows the characteristic arc shape at lower altitudes, in the
variability is open for examination. The mean vertical profile      upper troposphere the CFAD splits into two arcs. The low-
of reflectivity in DCCs over the Amazon, as well as the total       reflectivity arc decreases below 0 dBZ at 11 km, whereas
variability, are presented as contoured frequency by altitude       the high-reflectivity arc remains above 0 dBZ at 14 km.
diagrams (CFADs), where the colored shading represents the          The double-arc structure most likely indicates two differ-
probability density function of reflectivity at each altitude       ent modes of hydrometeors: a low-reflectivity arc associated
(Fig. 3). Previous research (e.g., Bodas-Salcedo et al., 2008;      with snow and a high-reflectivity arc associated with graupel
Satoh et al., 2010; Nam and Quaas, 2012) associates deep            and hail. Cloud ice has typical reflectivity values below the
convection with a characteristic arc shape in the reflectivity      minimum detection threshold of CloudSat (−28 dBZ), and
CFAD, maximizing in the middle troposphere and decreas-             does not contribute as much to the CFAD as the other ice hy-
ing at upper and lower altitudes. A similar shape is apparent       drometeor species. This double-arc structure is not obvious
in Fig. 3. Reflectivity is reduced near the surface from radar      (and thus unreported) in previous studies examining radar re-
beam attenuation by raindrops (Sassen et al., 2007). The kink       flectivity profiles in deep convection (e.g., Bodas-Salcedo et
in the reflectivity profile at 5 km is a ”dark band” mark-          al., 2008; Satoh et al., 2010; Nam and Quaas, 2012) largely

Atmos. Chem. Phys., 18, 6493–6510, 2018                                                www.atmos-chem-phys.net/18/6493/2018/
J. B. Dodson et al.: Microphysical variability of Amazonian deep convective cores 6499
Figure 4. (a) The CFAD for DCCs, same as Fig. 3. The black curves near the center of the data are the average reflectivity profiles. Dashed
lines are the standard deviation bounds. (b) Same as (a), but for anvils.
because the DCCs are not cleanly separated from other cloud other convective properties (e.g., frequency, top height, pre-
types, leading to a blurred reflectivity structure. cipitation, radiative effects. Liu et al. (2007) suggest that this
How do we know that the double arcs are associated with metric may be more useful for characterizing convective in-
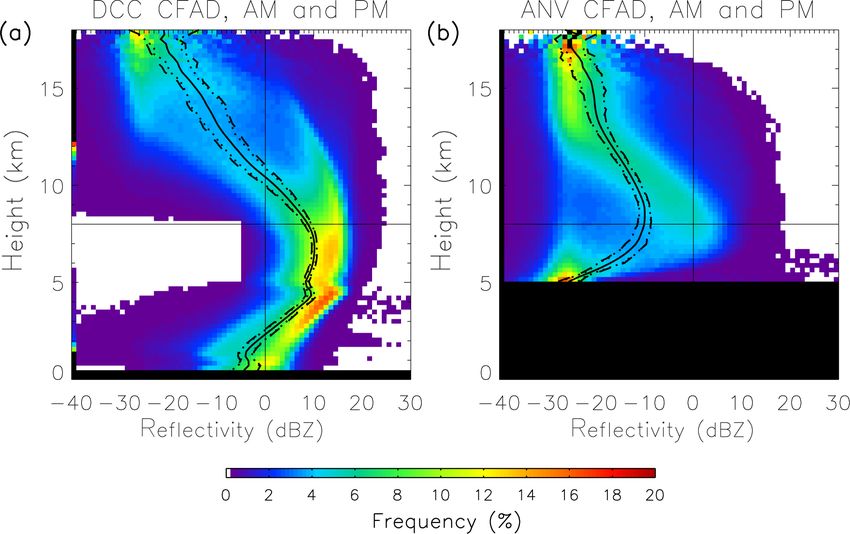
different hydrometeor species? Figure 4b shows the reflec- tensity than cloud top height, a traditional convective metric.
tivity CFADs for anvil clouds. Instead of a double-arc reflec-
tivity structure above 8 km, anvils have a single arc with re- 3.3 Day versus night and wet versus dry season
flectivity well below 0 dBZ above 10 km. The CFAD closely variability
resembles those constructed by Yuan et al. (2011), specifi-
cally for thick anvils, where reflectivity values of 0 dBZ are The DCC reflectivity profiles, in particular the CFAD double-
frequent at altitudes of 8–10 km, and decreases rapidly with arc structure, show significant day–night and wet–dry sea-
height. However, Yuan et al. (2011) show the reflectivity son variability. The day–night contrast results show the up-
maximum extending 1–2 km higher in altitude than Fig. 5 per cloud reflectivity is larger during day than night, by up
does. to 4.5 dBZ at 12.5 km (Fig. 4j–l, solid line), which is caused
This single reflectivity arc corresponds with the low- by a more prominent high-reflectivity arc during the day than
reflectivity (i.e., snow) arc observed in DCCs. This result is night. This feature also supports the conclusion that daytime
consistent with the hydrometeors in anvils consisting of the updraft velocities are higher than nighttime velocities. This is
snow and cloud ice detrained from DCCs (modified by cloud consistent with the continental CDC, as described previously.
processes as the anvils age), while dense ice hydrometeors Nighttime convection (midway between the afternoon peak
either fail to be detrained into the anvil or quickly sediment and morning lull) is likely to be weakening and/or transition-
from the anvil base immediately adjacent to the DCC. This ing to MCSs (Machado et al., 1998), and exists in an envi-
corresponds with in situ measurements of anvil hydrome- ronment partially contaminated by earlier convection and not
teors from West African convection (Bouniol et al., 2010). being rejuvenated by insolation (Chaboureau et al., 2004).
Note that some graupel particles are likely detrained into These results clarify the day–night contrast presented by
the anvils produced by DCCs with strong updrafts (Cetrone Liu et al. (2008). In CloudSat observations, DCCs are more
and Houze Jr., 2009). However, these particles are not large frequent during nighttime than daytime. However, the DCCs
and/or numerous enough to create the double-arc structure in occurring during the daytime overpass have larger updraft
the anvil reflectivity CFADs. velocities than those at night. The positive day–night reflec-
The presence of two distinct groups of hydrometeors in the tivity difference in the upper cloud extends well below 12 km
upper cloud indicates a fundamental mode of variability in (the altitude indicated by Liu et al., 2008), and represents a
the DCC reflectivity profile. Higher (lower) reflectivity in the day–night contrast in the microphysical properties of the ice
upper cloud indicate a larger (smaller) ratio of hail/graupel phase in DCCs. In summary, DCCs observed during the day-
particles to snow. Dense, large, reflective particles generated time overpass are less frequent, but taller, with larger verti-
in DCCs with higher vertical velocities are lofted higher into cal velocities, and more ice hydrometeors in the hail/graupel
the upper cloud (Liu et al., 2007), linking the upper cloud phases, than the DCCs observed at night.
reflectivity to updraft velocity. This relationship can be used The double-arc reflectivity structure in the upper tropo-
as a proxy metric of convective intensity, and compared with sphere exhibits seasonal differences. Amazonian convection
exhibits strong seasonal variations in the frequency and other
www.atmos-chem-phys.net/18/6493/2018/ Atmos. Chem. Phys., 18, 6493–6510, 20186500 J. B. Dodson et al.: Microphysical variability of Amazonian deep convective cores Figure 5. (a–i) The CFADs of reflectivity for DCCs in Amazonia separated by time of day and season. The left column is for all four seasons (wet, dry, wet-to-dry, and dry-to-wet); the middle column is for the wet season (WET); and the right column is the dry season (DRY). The first row is results for both times of day, the second row is day-only, and the third row is night-only. (j–l) The difference between the day and night mean reflectivity profile values – i.e, the second row minus the third row. properties because of changes in forcing mechanisms (Fu et files during the wet and dry seasons. Season-specific results al., 1999; Marengo et al., 2001; Raia and Cavalcanti, 2008), show the same qualitative pattern as the annual results – also connected with variability in day–night contrasts. Fig- higher reflectivity during day (night) than night in the up- ure 5 shows the day–night contrast in DCC reflectivity pro- per (lower) cloud. The amplitude of the difference is similar Atmos. Chem. Phys., 18, 6493–6510, 2018 www.atmos-chem-phys.net/18/6493/2018/
J. B. Dodson et al.: Microphysical variability of Amazonian deep convective cores 6501
in both seasons, but the altitudes of enhanced daytime reflec- ing that including diagnosed graupel enhances the reflectiv-
tivity is limited to above 10 km in the dry season. Overall, ity profile by no more than 4 dBZ. SPV5 microphysics pre-
the day–night radar reflectivity contrast is four to five times dicts graupel, and the upper troposphere reflectivity is larger
larger than the wet–dry season contrast, underscoring day– than SPG4, showing additional improvement in the switch in
night contrasts as a major mode of deep convective variabil- microphysical schemes. But SPV5 has a lesser (but still no-
ity. ticeable) disagreement with observations. No model variant
The CFADs show additional differences between wet and reproduces the observed double-arc structure, suggesting a
dry seasons. Wet season CFADs show a well-defined double fundamental deficiency in representing the behavior of large
arc reflectivity structure in the upper cloud, whereas the dry ice hydrometeors in convective updrafts.
season CFADs do not, particularly at night. This result might Figure 7 shows that the convective updraft velocities in
be a consequence of the drier thermodynamical environment both SPV4 and SPV5 never exceed 5 m s−1 , which is un-
and aerosol characteristics of the dry season environment (in- realistically low for deep convection in the Amazon (Gian-
cluding anthropogenic aerosol from biomass burning) (e.g., grande et al., 2016). This is likely a major contributor to the
Andreae et al., 2004; Lin et al., 2006). However, it may also low reflectivity in the simulated reflectivity above 10 km, and
be a sampling artifact due to the smaller number of DCCs is likely related to the coarse resolution of the CRM (Petch
during the dry season (9616) versus the wet season (78 034). et al., 2002; Bryan et al., 2003; Khairoutdinov et al., 2009).
To test the sample size influence, we implement a Monte However, vertical velocity is not the sole contributor to the
Carlo style random sampling methodology to reduce the wet size of the simulated reflectivity. Surprisingly, the disagree-
season sample size to that of the dry season. Reducing the ment between SPV4 and SPV5 does not directly correspond
sample size of the wet season to that of the dry season ob- with a proportionally large change in simulated updraft ve-
scures the double-arc reflectivity structure (not shown), so locity profile. Despite upper cloud reflectivity being higher
the influence of seasonality on the double-arc structure can- in SPV5 than SPV4, mean updraft velocity in the upper
not clearly be attributed to seasonal changes in the convective cloud decreases (and turns positive in the lower troposphere).
environment. In addition, SPV4 DCCs have net negative velocity below
3 km. This may not seem like an intuitive result initially,
and closer to the properties of stratiform precipitation. How-
4 Comparison with simulated cloud from a multi-scale ever, it likely represents the thermal “bubble” nature of at-
modeling framework mospheric convection (Scorer and Ludlam, 1953; Batchelor,
1954; Carpenter et al., 1998; Sherwood et al., 2013; Morri-
These findings raise questions about ongoing modeling stud- son, 2017). The DCC identification method favors columns
ies that use simulated radar reflectivity as a metric for con- with high reflectivity in the mid- to upper troposphere. These
vective activity. The observed CFADs depict complex struc- columns usually contain strong updrafts at the same altitudes,
ture and variability in convective reflectivity. Can models which is the convective updraft thermal. In contrast, near the
replicate this? In this section, we will examine the ability of surface, the high-buoyancy air has already been evacuated
SP-CAM to replicate the properties of DCCs observed by into the thermal aloft, leaving neutral or negatively buoyant
CloudSat, in particular the double-arc reflectivity structure. air in the lower troposphere. The selection process is not per-
In addition, because the model provides additional informa- fect, and Fig. 7a and b show that strong downdrafts are oc-
tion about the simulated atmosphere that cannot be easily ob- casionally included in the set of DCC profiles. Nevertheless,
served, such as vertical updraft velocity, we will look at the the net sinking motion below 3 km in SPV4 is consistent with
relationships between the radar reflectivity fields and other deep convection.
aspects of the simulated convection.
4.2 Simulated reflectivity stratified by updraft velocity
4.1 Simulated reflectivity and vertical velocity profiles
The argument we present relies critically on the relationship
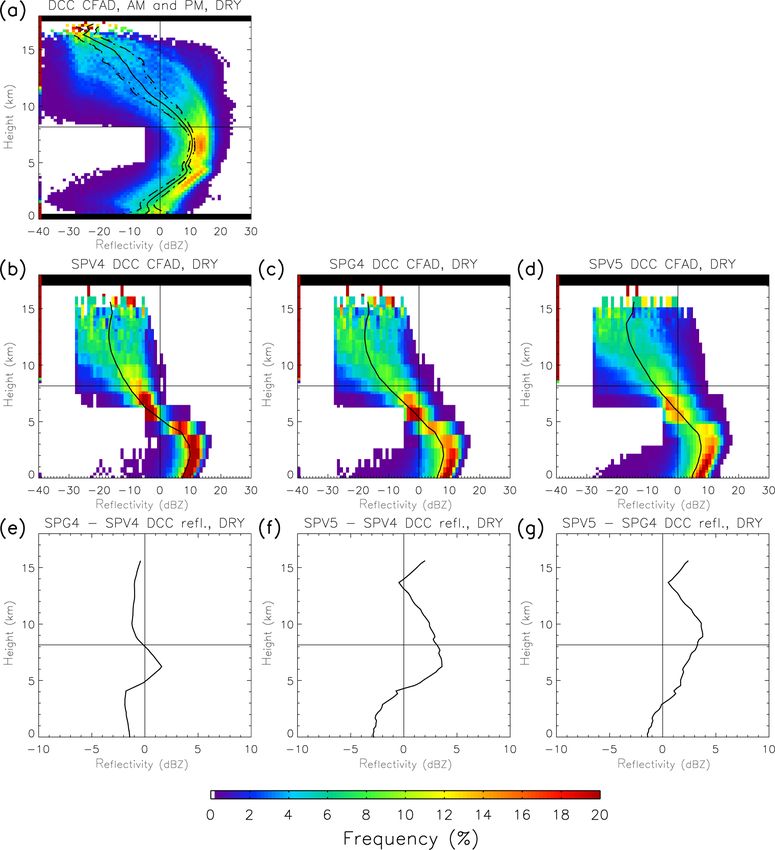
Figure 6 displays the CFADs of Amazonian DCCs for SPV4 between convective updraft velocity, the graupel phase of mi-
and SPV5. Both versions produce reflectivity values more crophysics, and radar reflectivity. These are difficult to un-
than 10 dBZ lower than observed above 5 km in altitude. weave in the observations, because of a lack of direct verti-
Specifically, the observed graupel/hail branch of the reflec- cal velocity observations, and the limitations of microphysi-
tivity arc is missing in both model versions. SPV4 is partic- cal retrievals (particularly in scenes with heavy precipitation
ularly unrealistic, as the microphysics scheme does not rep- for W-band radars, Mace et al., 2007). However, it is pos-
resent graupel. SPG4 diagnoses graupel, but their effect on sible to separate them in the simulation by stratifying ver-
the reflectivity profile is minor. There is an enhancement of tical reflectivity and hydrometeor profiles by updraft veloc-
reflectivity of 2 dBZ at 6 km, and a 1–2 dBZ reduction of re- ity. In Figs. 8–11, the CRM-level vertical profiles associated
flectivity elsewhere in the profile. This is a result of switch- with DCCs are conditionally sampled by the maximum pos-
ing from non-precipitating ice to snow in QuickBeam, mean- itive vertical velocity (denoted hereafter as Wmax ) occurring
www.atmos-chem-phys.net/18/6493/2018/ Atmos. Chem. Phys., 18, 6493–6510, 20186502 J. B. Dodson et al.: Microphysical variability of Amazonian deep convective cores Figure 6. (a, b, c, d) CFADs of dry season DCC reflectivity in Amazonia from (a) CloudSat, (b) SPV4, (c) SPG4 (i.e., SPV4 with diagnosed graupel included), and (d) SPV5, as in Fig. 4. (e, f, g) The difference of the mean vertical reflectivity profile between (f) SPG4 and SPV4, (f) SPV5 and SPV4, and (g) SPV5 and SPG4. Figure 7. (a, b) CFADs of DCC vertical updraft velocity from (a) SPV4 and (b) SPV5. The format is the same as for the reflectivity CFADs. Note that SPV4 and SPG4 vertical velocities (not shown) are identical. (c) The difference between SPV4 and SPV5 mean vertical velocity profiles. Atmos. Chem. Phys., 18, 6493–6510, 2018 www.atmos-chem-phys.net/18/6493/2018/
J. B. Dodson et al.: Microphysical variability of Amazonian deep convective cores                                                  6503

Figure 8. (a) Mean vertical profiles of simulated DCC radar reflectivity in SPV4 sorted by maximum updraft velocity. The vertical lines
at 2.5 m s−1 represent the maximum cut off Wmax value for statistical calculations. Vertical black stripes are updraft values with no DCC
occurrences. (b) Same as (a), but for SPG4 data. (c) Same as (a), but for SPV5 data. (d) PDFs of maximum DCC updraft velocity for (solid)
SPV4 and (dashed) SPV5. The black line represents data from both 02:00 and 14:00 LST, the blue line from 02:00 LST (night-only), and the
red line from 14:00 LST (day-only).

in each profile. The probability density function (PDF) of             and 1.79 km (m s−1 )−1 ). And even with diagnosed graupel
Wmax is also displayed – note that the low Wmax in SPV4 and            included, the slope of 0 dBZ echo top height in SPG4 is only
SPV5 are not confined to either daytime or nighttime. Fig-             a third that of SPV5. This result confirms that the lower re-
ure 8 shows that for SPV4, SPG4, and SPV5, DCC cloud top               flectivity in SPV4 DCCs compared with SPV5 and observa-
height increases as Wmax increases (with regression slopes of          tions is not caused solely by weaker updrafts, and the micro-
1.50, 1.66, and 1.35 km (m s−1 )−1 , respectively, when calcu-         physics scheme plays a key role in upper tropospheric reflec-
lated between 0 and 2.5 m s−1 ). Furthermore, the echo top             tivity.
heights of low reflectivity values in the upper cloud (e.g.,              There are two obvious, simple, possible causes for the lack
−10 dBZ, indicated by dark green) increase with Wmax at                of a double-arc CFAD structure in the CRM component of
similar rates as cloud top heights for SPV4, SPG4 and SPV5             SP-CAM, beyond the lack of prognosed graupel in SPV4 and
(1.29, 1.28, and 1.64 km (m s−1 )−1 ). However, the echo top           SPG4. First, note that there is no discontinuous ”step func-
heights of larger reflectivity values such as 0 dBZ (indicated         tion” jump in the 0 dBZ echo top height. The hypothetical
by yellow) increases almost negligibly with Wmax for SPV4              presence of a discontinuous jump in echo top height as Wmax
(0.00 km (m s−1 )−1 ), compared with SPG4 and SPV5 (0.68               increases would cause a double-arc structure in the simulated

www.atmos-chem-phys.net/18/6493/2018/                                                    Atmos. Chem. Phys., 18, 6493–6510, 2018
6504                                      J. B. Dodson et al.: Microphysical variability of Amazonian deep convective cores

Figure 9. Same as Fig. 8, but for snow water content (SWC). Because SPV4 does not distinguish between snow and graupel, all precipitating
ice is depicted as SWC.

CFAD, similar to observations. In other words, the PDF in                 The second possibility for the discrepancy is that the real
reflectivity in the upper troposphere would be bimodal, with           PDF for Wmax is bimodal, while the simulated PDFs have
the low (high) reflectivity mode representing DCCs with low            only one peak. Observed DCCs in the Amazon occur in
(high) Wmax , Such a jump could arise, for example, if graupel         three main organizational structures: afternoon disorganized
forms at only large values of Wmax , which would discontin-            “pop-up” convection, coastal squall lines, and basin-wide or-
uously boost DCC reflectivity at high Wmax . This could also           ganized convection similar to oceanic mesoscale convective
occur if hail was included in the microphysics. In this hypo-          complexes (Tang et al., 2016). In addition, the Amazon has
thetical case, the low Wmax in the CRM would cause the lack            a wide range of aerosol environments, which may influence
of the double-arc structure, because convective updraft ve-            several properties of convection including updraft velocities
locity would rarely be large enough to cross the jump in echo          (Andreae et al., 2004; Lin et al., 2006; Tao et al., 2012).
top height at large Wmax . Only the low reflectivity mode, i.e.,       These combination of effects may create a bimodal (or multi-
the snow arc, of the CFAD would manifest. However, in the              modal) PDF of real Wmax . While SP-CAM (in particular
real case, this discontinuous jump does not exist in the CRM.          SPV5) can represent certain properties of organized convec-
If the discontinuous jump in reflectivity exists in reality, but       tion, such as diurnal propagation (Kooperman et al., 2013),
the CRM fails to replicate it, then a missing double-arc struc-        the CRM does not allow realistic organization of convection.
ture in SP-CAM is not simply caused by weak updrafts in the            This contributes to a unimodal PDF of Wmax which may
CRM.                                                                   be unrealistic. Until recently, the state of observations did

Atmos. Chem. Phys., 18, 6493–6510, 2018                                                  www.atmos-chem-phys.net/18/6493/2018/
J. B. Dodson et al.: Microphysical variability of Amazonian deep convective cores                                              6505

Figure 10. Same as Fig. 8, but for graupel water content (GWC). Note the absence of GWC for SPV4.

not enable a robust analysis to test these two possibilities;       result shown by Fig. 10 can be summarized in two key points.
large samples of DCC vertical velocity are difficult to collect.    First, SPV5 produces graupel at all values of Wmax ; there-
However, recent observations from field campaigns such as           fore, the difference in reflectivity CFADs between SPV5 and
the Green Ocean Amazon experiment (Martin et al., 2016,             the observations cannot be explained by the assumption that
2017) may be useful for testing.                                    SPV5 simply has convective updrafts too weak to produce
                                                                    graupel. Second, the sensitivity of GWC to Wmax is slightly
4.3   Hydrometeor variability by updraft velocity                   greater than that of SWC (183 versus 166 mg (m s−1 )−1 , re-
                                                                    spectively). This relatively rapid increase of GWC with Wmax
How do the ice hydrometeor species contribute to radar re-          in SPV5 is the best explanation for the rise of the 0 dBZ echo
flectivity? Figures 9 and 10 show the change in snow wa-            top height in SPV5, which is missing in SPV4. The increase
ter content (SWC) and graupel water content (GWC) with              in graupel with Wmax in SPG4 (55 mg (m s−1 )−1 ) is much
Wmax , respectively. In the case of SPV4, precipitating ice is      lower than that of SPV5, contributing to the lower radar re-
classified as SWC. SPV4, SPG4, and SPV5 have SWC in-                flectivity in SPG4.
creasing at all altitudes above 5 km as Wmax increases (146,           Is the error in radar reflectivity for SPV4 related to changes
99, and 166 mg (m s−1 )−1 , respectively), though SPV5 in-          in the convective updraft dynamics? Figure 11 shows vertical
creases somewhat more rapidly than the others. Because both         velocity profiles sorted by Wmax for SPV4 and SPV5 (note
models show similar relationships between SWC and Wmax ,            that vertical velocity in SPV4 and SPG4 are identical). The
SWC alone cannot explain the reflectivity differences. The          vertical structure for both SPV4 and SPV5 relate to Wmax

www.atmos-chem-phys.net/18/6493/2018/                                                 Atmos. Chem. Phys., 18, 6493–6510, 2018
6506 J. B. Dodson et al.: Microphysical variability of Amazonian deep convective cores Figure 11. Same as Fig. 8, but for DCC vertical velocity profiles. Note that the results for SPV4 and SPG4 are identical. in similar manners, with relatively strong ascent above 5 km tion). In addition, it appears insufficient to capture observed to the cloud tops for most values of Wmax , and neutral to variability in the DCC vertical structure, such as the double- weak downdrafts below 5 km. It does not appear that the dif- arc reflectivity structure. Further improvements in micro- ferences in radar reflectivity between SPV4 and SPV5 are physics will likely be necessary for CRMs to produce the related to differences in the vertical velocity profile. full observed variability in the reflectivity field. Improving the microphysical parameterization in CRMs, including both adding ice-phase hydrometeor species and shifting from single- to double-moment microphysics, re- 5 Summary and discussion sults in noticeable improvements to the radar reflectivity fields associated with deep convection. This is consistent We have presented an analysis of the DCC vertical structure with previous studies which found improvements in the rep- in the Amazon observed by CloudSat. While the vertical re- resentation of deep convection as a result of the switch to flectivity structure of convectively active areas has been pre- multi-moment microphysics (e.g., Swann, 1998; Morrison et viously examined, the methodologies mixed together the ver- al., 2009; Dawson et al., 2010; Van Weverberg et al., 2012; tical structure of deep convection, the frequency of deep con- Igel et al., 2015). However, it is also clear that there are other vection, and the attributes of other cloud types. To clarify, we reasons for the low reflectivity in the upper troposphere, such separate vertical profiles from DCCs and examine the vari- as the weak updrafts in both versions of the models (which ability in the vertical structure. The results reveal a distinctive should increase with improved model dynamics and resolu- double-arc structure in the CFAD related to the relative fre- Atmos. Chem. Phys., 18, 6493–6510, 2018 www.atmos-chem-phys.net/18/6493/2018/
J. B. Dodson et al.: Microphysical variability of Amazonian deep convective cores                                                    6507

quencies of snow and graupel/hail in the upper cloud, depict-         Inc. under STARSSIII; and by the NASA Postdoctoral Program.
ing variability in microphysics and updraft velocities. The           The authors thank David A. Randall for providing assistance with
graupel/hail branch of the double arc is more prominent dur-          using SP-CAM.
ing early afternoon than early morning, indicated by higher
upper cloud reflectivity during day than night. This indicates        Edited by: Philip Stier
                                                                      Reviewed by: two anonymous referees
stronger updrafts in mature DCCs during day than night. The
day–night contrast in reflectivity structure is roughly four
times larger than the contrast between the wet season and dry
season, indicating that the day–night contrast is a prominent         References
mode of DCC variability.
   The results show the importance of separating data by              Andreae, M. O., Rosenfeld, D., Artaxo, P., Costa, A. A., Frank,
cloud type before interpretation. This allows for a clearer             G. P., Longo, K. M., and Silva-Dias, M. A. F.: Smoking
process-based analysis of satellite observations, rather than           Rain Clouds over the Amazon, Science, 303, 1337–1342,
a statistical view that mixes meteorological processes reduc-           https://doi.org/10.1126/science.1092779, 2004.
ing their utility for aiding model improvement and process-           Arakawa, A.: Modelling clouds and cloud processes for use in cli-
                                                                        mate models, The Physical Basis of Climate and Climate Mod-
level understanding. Future research should display caution
                                                                        elling, WMO, Geneva, Switzerland, GARP Publications Series
when directly comparing the statistics of observed reflectiv-           No. 16, 100–120, 1975.
ity and simulated reflectivity, and drawing conclusions about         Arakawa, A.: The cumulus parameterization problem: Past, present,
the accuracy of simulated convection from reflectivity statis-          and future, J. Climate, 217, 2493–2525, 2004.
tics alone.                                                           Avery, M. A., Davis, S. M., Rosenlof, K. H., Ye, H., and Dessler,
   In addition, our results indicate that cloud-resolving and           A. E.: Large anomalies in lower stratospheric water vapour and
related models, such as MMFs, are unable to capture the                 ice during the 2015–2016 El Niño, Nat. Geosci., 110, 405–410,
previously unreported double-arc structure, representing a              https://doi.org/10.1038/NGEO2961, 2017.
weakness in the simulation of convection which is at least in         Batchelor, G. K.: Heat convection and buoyancy ef-
part due to ice microphysics. The model–data comparisons                fects in fluids, Q. J. Roy. Meteor. Soc., 80, 339–358,
suggest significant model deficiencies in the representation            https://doi.org/10.1002/qj.49708034504, 1954.
                                                                      Battan, L. J.: Radar Observations of the Atmosphere, University of
of radar reflectivity associated with convection remain; how-
                                                                        Chicago Press, Chicago, Illinois, USA, 324 pp., 1973.
ever more sophisticated model physics (e.g., switching from
                                                                      Bodas-Salcedo, A., Webb, M. J., Brooks, M. E., Ringer, M. A.,
single-moment to double-moment microphysics, including                  William, K. D., Milton, S. F., and Wilson, D. R.: Evaluating
more ice hydrometeor species) can significantly improve the             cloud systems in the Met Office global forecast model using
representation. Until that time, care should be taken when              simulated CloudSat radar reflectivities, J. Geophys. Res., 113,
using radar simulators to compare models with observations,             D00A13, https://doi.org/10.1029/2007JD009620, 2008.
especially when variability in the reflectivity field is being        Bouniol, D., Delanoë, J., Duroure, C., Protat, A., Giraud, V., and
examined. These findings aid us in interpreting the relation-           Penide, G.: Microphysical characterisation of West African MCS
ship between radar reflectivity and convection, and particu-            anvils, Q. J. Roy. Meteor. Soc., 136, 323–344, 2010.
larly when comparing CloudSat observations with simulated             Bryan, G. H., Wyngaard, J. C., and Fritsch, J. M.: Resolution re-
reflectivity profiles in cloud-resolving models.                        quirements for the simulation of deep moist convection, Mon.
                                                                        Weather Rev., 131, 2394–2416, https://doi.org/10.1175/1520-
                                                                        0493(2003)1312.0.CO;2, 2003.
                                                                      Burleyson, C. D., Feng, Z., Hagos, S. M., Fast, J., Machado, L.
Data availability. CloudSat data are available at the CloudSat Data
                                                                        A. T., and Martin, S. T.: Spatial variability of the background
Processing Center of Cooperative Institute of Research in the At-
                                                                        diurnal cycle of deep convection around the GoAmazon2014/5
mosphere (http://www.cloudsat.cira.colostate.edu). SP-CAM data
                                                                        field campaign sites, J. Appl. Meteorol. Clim., 55, 1579–1598,
were provided upon request from the Center for Multi-Scale Mod-
                                                                        https://doi.org/10.1175/JAMC-D-15-0229.1, 2016.
eling of Atmospheric Processes (http://www.cmmap.org).
                                                                      Carpenter, R. L., Droegemeier, K. K., and Blyth, A. M.: Entrain-
                                                                        ment and Detrainment in Numerically Simulated Cumulus Con-
                                                                        gestus Clouds. Part III: Parcel Analysis, J. Atmos. Sci., 55, 3440–
Competing interests. The authors declare that they have no conflict     3455, 1998.
of interest.                                                          Cetrone, J. and Houze Jr., R. A.: Anvil clouds of tropical mesoscale
                                                                        convective systems in monsoon regions, Q. J. Roy. Meteor. Soc.,
                                                                        135, 305–317, https://doi.org/10.1002/qj.389, 2009.
Acknowledgements. This work has been supported by NASA grant          Chaboureau, J.-P., Guichard, F., Redelsperger, J.-L., and Lafore,
# NNH13ZDA001N-TERAQ, “The Science of Terra and Aqua”; by               J.-P.: The role of stability and moisture in the diurnal cycle of
the National Science Foundation Science and Technology Center           convection over land, Q. J. Roy. Meteor. Soc., 130, 3105–3117,
for Multi-Scale Modeling of Atmospheric Processes (CMMAP),              https://doi.org/10.1256/qj.03.132, 2004.
managed by Colorado State University under cooperative agree-         Corti, T., Luo, B. P., de Reus, M., Brunner, D., Cairo, F., Ma-
ment No. ATM-0425247; by Science Systems and Applications,              honey, M. J., Martucci, G., Matthey, R., Mitev, V., dos Santos,

www.atmos-chem-phys.net/18/6493/2018/                                                   Atmos. Chem. Phys., 18, 6493–6510, 2018
6508 J. B. Dodson et al.: Microphysical variability of Amazonian deep convective cores
F. H., Schiller, C., Shur, G., Sitnikov, N. M., Spelten, N., Vöss- Itterly, K. F. and Taylor, P. C.: Evaluation of the tropical TOA flux
ing, H. J., Borrmann, S., and Peter, T.: Unprecedented evidence diurnal cycle in MERRA and ERA-Interim retrospective analy-
for deep convection hydrating the tropical stratosphere, Geophys. ses, J. Climate, 27, 4781–4796, 2014.
Res. Lett., 35, L10810, https://doi.org/10.1029/2008GL033641, Itterly, K. F., Taylor, P. C., Dodson, J. B., and Tawfik, A. B.:
2008. On the sensitivity of the diurnal cycle in the Amazon to con-
Dai, A., Giorgi, F., and Trenberth,K. E. : Observed and model- vective intensity, J. Geophys. Res.-Atmos., 121, 8186–8208,
simulated diurnal cycles of precipitation over the contiguous https://doi.org/10.1002/2016JD025039, 2016.
United States, J. Geophys. Res., 104, 6377–6402, 1999. Janowiak, J. E., Kousky, V. E., and Joyce, R. J.: Diurnal cycle of pre-
Dawson, D. T., Xue, M., Milbrandt, J. A., and Yau, M. K.: Compar- cipitation determined from the CMORPH high spatial and tem-
ison of evaporation and cold pool development between single- poral resolution global precipitation analyses, J. Geophys. Res.,
moment and multimoment bulk microphysics schemes in ideal- 110, D23105, https://doi.org/10.1029/2005JD006156, 2005.
ized simulations of tornadic thunderstorms, Mon. Weather Rev., Johnson, R. H., Rickenbach, T. M., Rutledge, S. A., Ciesielski, P. E.,
138, 1152–1171, https://doi.org/10.1175/2009MWR2956.1, and Schubert, W. A.: Trimodal Characteristic of Tropical Con-
2010. vection, J. Climate, 12, 2397–2418, 1999.
Del Genio, A. D., Chen, Y., Kim, D., and Yao, M.-S.: The MJO tran- Johnston, H. S. and Solomon, S.: Thunderstorms as possible
sition from shallow to deep convection in CloudSat/CALIPSO micrometeorological sink for stratospheric water, J. Geophys.
data and GISS GCM simulations, J. Climate, 25, 3755–3770, Res., 84, 3155–3158, https://doi.org/10.1029/JC084iC06p03155,
2012. 1979.
Dodson, J. B. and Taylor, P. C.: Sensitivity of Amazonian Khairoutdinov, M., Randall, D. A., and DeMott, C.: Simulations
TOA flux diurnal cycle composite monthly variability to of the atmospheric general circulation using a cloud-resolving
choice of reanalysis, J. Geophys. Res.-Atmos., 121, 4404–4428, model as a superparameterization of physical processes, J. At-
https://doi.org/10.1002/2015JD024567, 2016. mos. Sci., 62, 2136–2154, 2005.
Dodson, J. B., Randall, D. A., and Suzuki, K.: Comparison of Khairoutdinov, M. F. and Randall, D. A.: Cloud resolving modeling
observed and simulated tropical cumuliform clouds by Cloud- of the ARM summer 1997 IOP: Model formulation, results, un-
Sat and NICAM, J. Geophys. Res. Atmos., 118, 1852–1867, certainties, and sensitivities, J. Atmos. Sci., 60, 607–625, 2003.
https://doi.org/10.1002/jgrd.50121, 2013. Khairoutdinov, M. F., Krueger, S. K., Moeng, C.-H., Bogenschutz,
Fu, R., Genio, D., Anthony, D., and Rossow, W. B.: Behavior of P. A., and Randall, D. A.: Large-Eddy Simulation of Maritime
deep convective clouds in the tropical Pacific deduced from IS- Deep Tropical Convection, J. Adv. Model. Earth Syst., 1, 15,
CCP radiances, J. Climate, 3, 1129–1152, 1990. https://doi.org/10.3894/JAMES.2009.1.15, 2009.
Fu, R., Zhu, B., and Dickinson, R. E.: How Do Atmosphere and Kikuchi, K. and Wang, B.: Diurnal precipitation regimes
Land Surface Influence Seasonal Changes of Convection in the in the global tropics, J. Climate, 21, 2680–2696,
Tropical Amazon?, J. Climate, 12, 1306–1321, 1999. https://doi.org/10.1175/2007JCLI2051.1, 2008.
Giangrande, S. E., Toto, T., Jensen, M. P., Bartholomew, M. J., Kooperman, G. J., Pritchard, M. S., and Somerville, R. C. J.: Ro-
Feng, Z., Protat, A., Williams, C. R., Schumacher, C., and bustness and sensitivities of central U.S. summer convection
Machado, L.: Convective cloud vertical velocity and mass- in the super-parameterized CAM: Multimodel intercomparison
flux characteristics from radar wind profiler observations dur- with a new regional EOF index, Geophys. Res. Lett., 40, 3287–
ing GoAmazon2014/5, J. Geophys. Res.-Atmos., 121, 12891– 3291, https://doi.org/10.1002/grl.50597, 2013.
12913, https://doi.org/10.1002/2016JD025303, 2016. Kummerow, C., Barnes, W., Kozu, T., Shiue, J., and Simpson, J.:
Gilmore, M. S., Straka, J. M., and Rasmussen, E. K.: Precipitation The Tropical Rainfall Measuring Mission (TRMM) sensor pack-
and Evolution Sensitivity in Simulated Deep Convective Storms: age, J. Atmos. Ocean. Tech., 15, 809–817, 1998.
Comparisons between Liquid-Only and Simple Ice and Liquid Li, X., Sui, C.-H., Lau, K.-M., and Tao, W.-K.: Tropical convective
Phase Microphysics, Mon. Weather Rev., 132, 1897–1916, 2004. responses to microphysical and radiative processes: A 2D cloud-
Grabowski, W., Wu, X., and Moncrieff, M.: Cloud resolving model- resolving modeling study, Meteorol. Atmos. Phys., 90, 245–259,
ing of tropical cloud systems during Phase III of GATE. Part III: 2005.
Effects of cloud microphysics, J. Atmos. Sci., 56, 2384–2402, Lin, J. C., Matsui, T., Pielke Sr., R. A., and Kummerow,
1999. C.: Effects of biomass-burning-derived aerosols on pre-
Haynes, J. M., Marchand, R. T., Luo, Z., Bodas-Salcedo, A., and cipitation and clouds in the Amazon Basin: a satellite-
Stephens, G. L.: A multi-purpose radar simulation package: based empirical study, J. Geophys. Res., 111, D19204,
QuickBeam, B. Am. Meteorol. Soc., 88, 1723–1727, 2007. https://doi.org/10.1029/2005JD006884, 2006.
Hou, A. Y., Kakar, R. K., Neeck, S., Azarbarzin, A. A., Kummerow, Lin, X., Randall, D. A., and Fowler, L. D.: Diurnal vari-
C. D., Kojima, M., Oki, R., Nakamura, K., and Iguchi, T.: The ability of the hydrologic cycle and radiative fluxes:
global precipitation measurement (GPM) mission, B. Am. Me- Comparisons between observations and a GCM, J.
teorol. Soc., 95, 701–722, https://doi.org/10.1175/BAMS-D-13- Climate, 13, 4159–4179, https://doi.org/10.1175/1520-
00164.1, 2014. 0442(2000)0132.0.CO;2, 2000.
Igel, A. L., Igel, M. R., and van den Heever, S. C.: Make Liu, C. and Zipser, E. J.: The global distribution of largest, deepest,
it a double? Sobering results from simulations using single- and most intense precipitation systems, Geophys. Res. Lett., 42,
moment microphysics schemes, J. Atmos. Sci., 72, 910–925, 3591–3595, https://doi.org/10.1002/2015GL063776, 2015.
https://doi.org/10.1175/JAS-D-14-0107.1, 2015. Liu, C., Zipser, E., and Nesbitt, S. W.: Global distribu-
tion of tropical deep convection: Different perspectives from
Atmos. Chem. Phys., 18, 6493–6510, 2018 www.atmos-chem-phys.net/18/6493/2018/You can also read


