The long term potential for deep reductions in household water demand
←
→
Page content transcription
If your browser does not render page correctly, please read the page content below
The long term potential for
deep reductions in household
water demand

Produced for Ofwat
26th April 2018                                                                                                                      This report has been designed to be read on a computer or tablet
                                                                                                                                     screen, please think of the environment before printing, thank you.

                                                                                                                                     The contents of this document are subject to copyright and all rights are reserved. No part of
                                                                                                                                     this document may be reproduced, stored in a retrieval system or transmitted, in any form or by
                                                                                                                                     any means electronic, mechanical, photocopying, recording or otherwise, without the prior
Report Reference:   AR1206                                                                                                           written consent of the copyright owner. This document has been produced by Artesia
                                                                                                                                     Consulting Ltd.
Client:             Ofwat                                                                                                            Any enquiries relating to this report should be referred to the authors at the following address:

                    Rob Lawson, Dene Marshallsay, Daniele DiFiore, Sarah Rogerson, Shana Meeus, Joseph Sanders: Artesia Consulting   info@artesia-consulting.co.uk
Author(s)
                    Bruce Horton: Environmental Policy Consulting                                                                    Telephone: + 44 (0) 1454 320091
    Produced by Artesia Consulting
Reviewer:           Simon Gordon-Walker: Artesia Consulting                                                                          Website: www.artesia-consulting.co.uk
Executive summary: delivering long term deep reductions in household water demand
The study considers the potential for making deep                         Key conclusions:                                                        First steps to delivering deep reductions in household
reductions in household water consumption and water lost                                                                                          demand:
                                                                          It is possible to achieve average household consumption of
from customer supply pipe leaks, up to 2065.                                                                                                      1.   Strong leadership to ensure that water companies,
                                                                          between 50 and 70 l/head/day in 50 years without a reduction
                                                                                                                                                       government, regulators, the supply chain, academia,
The need arises from the pressures of increased demand,                   in the level of utility or quality of water use, but this will not be
                                                                                                                                                       innovators and others work in a concerted and
                                                                          delivered by the industry working in isolation.
driven largely by population growth, and the effects of                                                                                                coordinated way.
climate change on resource availability. These will have long             Technologies and services exist now that can deliver these              2.   Monitor progress towards deep reductions in
term impacts on the water sector’s ability to deliver services            savings if implemented more widely.                                          household water demand, and provide support for the
that are resilient and affordable.                                                                                                                     ongoing business cases for water efficiency.
                                                                          Potential costs and implications are outside the scope of this
                                                                          project, and should be addressed in future studies.                     3.   Meter all domestic properties to facilitate future
We have consulted widely with experts in the UK and
                                                                                                                                                       savings through customer behaviour, utility services,
abroad, and reviewed research in water and energy                         Delivering long term deeper demand savings requires greater                  water saving technologies and further research on
efficiency behaviour change, service provision and                        awareness of water scarcity issues in the UK, combined with                  tariffs.
technology. Future household demands have been                            greater leadership in moving this whole area forward.                   4.   Mandate water labelling for water-consuming products
estimated through the use of scenarios and modelling of                   Actions are required now to move beyond ‘business as usual’                  to help consumers select suitably water efficient
water use in the home. Each view of the future is compared                and start to deliver the reductions needed to meet future long               products.
to the current position in the infographic below.                         term challenges.                                                        5.   Tackle losses from leaky loos through product
                                                                                                                                                       standards for new toilets, along with monitoring and
                                                                                                                                                       fixing of plumbing losses.
        Now               2065             2065           2065                 2065              2065             2065             2065
                                                                                                                                                  6.   Develop a strategy to reduce customer supply pipe
                                                                                                                                                       losses and maintain these assets in the future.
                                                                                                                                                  7.   Prioritise research into behaviour change for
                         10,523                                                                                                                        influencing consumer choice of products and changing
        8,886                              8,831
       Household
                                                           7,366                                                                                       water use practices.
                                                                               6,057
        demand
                                                                                                 4,372                              5,110
         Ml/d                                                                                                     3,482                           8.   Update planning rules to require new developments to
                                                                                                                                                       be water efficient, e.g. through community rainwater
    Current average   If PCC remains   If PCC trend in   Scenario 0          Scenario 1        Scenario 2        Scenario 3       Scenario 4           harvesting and water reuse.
        per capita          at 140      draft WRMPs        Current           Unfocused          Localised      Technology and   Regulation and
     consumption         l/head/day       continues       ambition            frugality       sustainability       service       compliance       9.   Make performance data openly available to encourage
      (PCC) = 140                                                                                                innovation
       l/head/day                                                                                                                                      and facilitate innovation in services and technologies.
                                         PCC = 120       PCC = 105            PCC = 86          PCC = 62         PCC = 49           PCC = 73

   ProducedbybyArtesia
   Produced     Artesia  Consulting
                       Consulting                                     The long term potential for deep reductions in household water demand                                                             2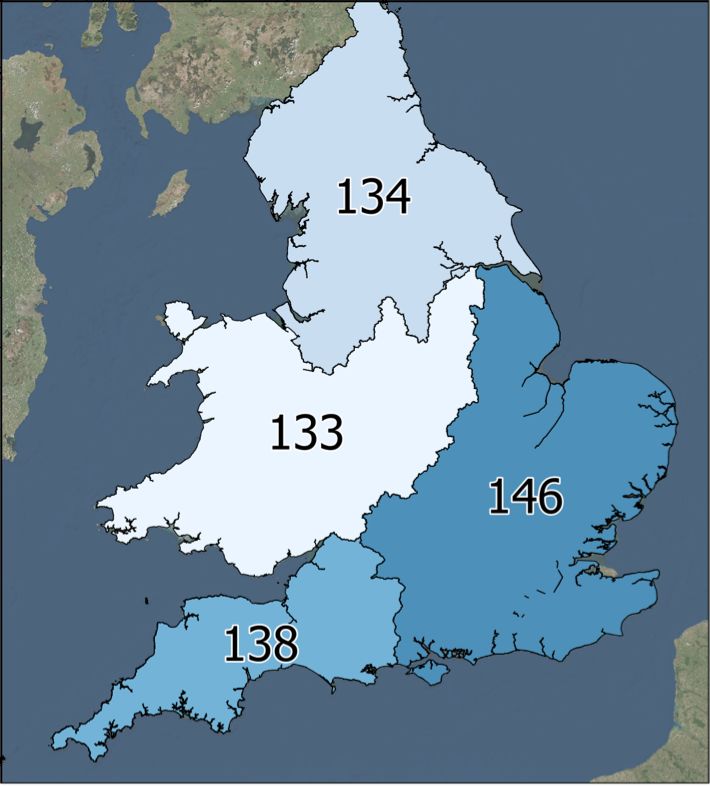
About this report
This report has been produced by Artesia Consulting for                                 Contents                                                        Page
Ofwat to examine the long term potential for managing
water demand.                                                                 1         Introduction                                                        4
The report consists of this main document, and is
supported by a number of technical annexes.
                                                                              2         Household demand for water                                          6

Any enquiries about this report should be directed to:                        3         Supply pipe leakage                                                 14
Rob Lawson at Artesia Consulting at the following email:                      4         Research                                                            16
rob@artesia-consulting.co.uk
                                                                              5         Scenarios                                                           23
                                                                              6         Discussion                                                          31
                                                                              7         First steps to delivering deep reductions in household demand       34
                                                                                        References                                                          35
The primary objective of this project is to understand the
long-term potential for demand management in domestic                                   Annexes (separate documents):
properties in England and Wales. The project will inform
Ofwat's long term strategy, including future price reviews.                   A         Customer supply pipe losses
It will also be used to provide insight and expertise to other
regulators and government departments on topics such as
                                                                              B         Water demand reduction measures
resilience, infrastructure investment and long-term value
                                                                              C         Scenario framework
for money for water consumers.
                                                                              D         Demand forecast model
                                                                              E         Data tables

    ProducedbybyArtesia
    Produced     Artesia  Consulting
                        Consulting                               The long term potential for deep reductions in household water demand                  3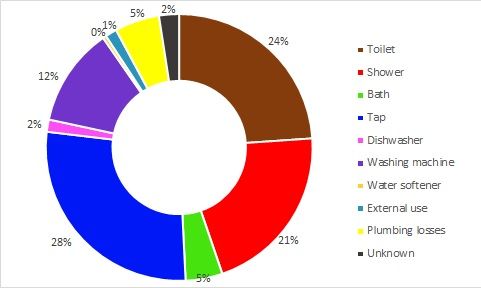
1. Introduction: 1.1. Context
It is widely recognised that pressures from population               Three key documents have been published recently which         The report stated that: “the levels of demand
growth and climate change will reduce the per capita                 highlight the importance of reducing household water           management that have been analysed in this report are
availability of water in the UK generally, and in critical           demand, and delivering benefits such as those in Figure 1.     potentially ambitious and rely on significant behavioural
areas, such as South East England, in particular. Demand                                                                            change as well as significant future innovation.”
                                                                     The Water UK Long Term Water Resources Planning report
management has a key role in addressing this challenge.              (Water UK 2016), demonstrated that there is a significant      The Defra (2018) 25 year Environment Plan says that we
                                                                     and growing risk of severe drought impacts in England and      need to incentivise improved efficiency and less personal
As a statutory body, Ofwat has to meet all its duties, both
                                                                     Wales. It concluded that, in addition increasing supply,       consumption, and has asked WaterUK to advise on a PCC
primary and secondary, set out in the Water Industry Act                                                                            target for 2042.
1991. These include:                                                 there is a case for considering more extensive measures to
                                                                     manage household demand.                                       Waterwise (2017) have recently published their strategy for
•   Protecting the interests of existing and future water                                                                           the UK which sets out a blueprint to deliver a vision of a UK
                                                                      Figure 1: Benefits from delivering water conservation
    consumers, and ensuring affordable bills.                                                                                       in which all people, homes and businesses are water-
                                                                                                                                    efficient, and where water is used wisely, every day,
•   Securing the long term resilience of water and
                                                                        Improves                                                    everywhere . The strategy sets out an action plan for the
    wastewater systems.                                                                      Improves              Improves
                                                                        customer                                                    next 5 years (2017 to 2022) in 7 areas, shown below:
                                                                                            affordability          resilience
                                                                         service
•   Ensuring great customer service, and encouraging
    innovation.                                                                                                                         Waterwise’s strategy actions for the next 5 years:

With a rising population, and an expected increase in                                                                                   •   Why we need to become more water-efficient in
                                                                                                                    Positive                the UK
extreme weather events, companies will face increased
                                                                        Reduces                                  impact on the          •   Improving water efficiency in our urban
challenges to provide water and wastewater services in the                                  Lowers cost
                                                                        water and                                 environment               environment
future. If households continue with a daily per-capita                                        to serve
                                                                       energy bills                                   and
consumption of around 140 litres, and UK population rises                                                        sustainability         •   Integrated water management and resilient
by about 10 million in 50 years, that would add over half a                                                                                 infrastructure and services
trillion litres a year to supply (approximately a 15%                                                                                   •   Water, people and communities
increase in the water taken out of the environment). This                                     Reduced
                                                                                               energy               Reduces             •   Products and labelling
population is also forecast to increase disproportionately in             Less
                                                                                            consumption           leakage and           •   Water company delivery and regulation
the south east of England, where we expect drought                     wastewater
                                                                                             and carbon             demand
events of increasing frequency, duration and severity.                                        emissions                                 •   Water efficiency in retail competition

    ProducedbybyArtesia
    Produced     Artesia  Consulting
                        Consulting                              The long term potential for deep reductions in household water demand                                                      4
1.Introduction: 1.2. Scope and objectives
The scope of this study is to analyse factors that affect
Objective 1: Analyse Objective 4: Consider
domestic water consumption. For example, customer
behaviour, design and use of water-consuming products, How households have used water in the past, and how The role of water pricing and tariffs in reducing water use.
use of water meters, and tariffs, and the Internet of Things homes use water today, including a detailed breakdown The potential for current and future technologies to
(IoT). This study has therefore concentrated on the of the types of use, and considering how usage varies by reduce demand, including the potential for automation
potential to reduce consumption in the home expressed as region, and by property type. and analytics to drive behaviour change.
per-capita consumption (PCC). Note: PCC has been used
What technology and other interventions have worked
through out this report to be consistent with historic
well, and less well, in the UK and from international
reported data.
examples and experience.
The PCC metric does not include supply pipe leakage nor
Objective 2: Illustrate What we can learn from other sectors; particularly from
does it include non-household demand. However, supply
the experience of the energy sector in promoting energy
pipes are the responsibility of the homeowner, and Water company data and forecasts of current and future efficiency and associated behaviour change.
represent a ‘demand’ from domestic properties. Therefore PCC and types of water use in the home (described as
part of this study will look at the potential to reduce The potential for water efficiency measures to provide
‘micro-components’) for 2025-30, and up to 2065.
leakage from customer supply pipes. wider societal benefits, including energy efficiency
The study considers the potential for reducing .
water consumption in homes and from customer Objective 3: Propose
supply pipe leaks over the long term, looking
The options available to make deep reductions to PCC
Objective 5: Demonstrate
ahead to 2065.
over the next fifty years. Again, this will include a detailed
The current leakage from supply pipes.
breakdown of water use, and consider how usage varies
by region, and by property type. The potential to reduce this leakage over a fifty year
period, and the options for supply pipe leakage reduction.
ProducedbybyArtesia
Produced Artesia Consulting
Consulting The long term potential for deep reductions in household water demand 52. Household demand for water: 2.1. Definitions
This report focuses on household water demand and customer supply pipe leakage. This section explains If a household has an external flow meter (at point ’A’ in Figure 2) the water
exactly what we mean by these two terms, and how we will report data relating to these two water flowing through the meter is termed water delivered, and household
demands. Referring to Figure 2: consumption is calculated by subtracting customer supply pipe leakage from
water delivered.
Household water consumption is the water flowing into the property past point ‘B’. This includes water
consumed, water wasted and losses inside the household or from external taps. Household consumption can be reported in two ways:
Customer supply pipe leakage includes any losses from the pipe connecting point ‘A’ and ‘B’. • PHC or per household consumption in litres/property/day
• PCC or per capita consumption in litres/head/day.
Figure 2: Household consumption and losses
PCC is calculated by dividing PHC by the number of occupants in the property.
However as individual property occupancy is seldom known, it is more
common to sum PHC values to a regional level and divide by the regional
population.
PHC varies from house to house and region to region. Variations in consumption
Leaks here are the can be influenced by: household occupancy, property type, age of occupants,
responsibility of
the property socio-demographic factors (social status, levels of affluence, culture, religion,
Customer’s internal owner and are
Property
plumbing lifestyles, and household or individual values towards water use), whether
boundary included in
household households pay via a meter, weather, and the methods used to measure and
B consumption
estimate household consumption (Artesia 2017).
Water company’s Water company’s
communication pipe boundary valve Traditionally, PCC has been used for reporting household consumption, and
Leaks here are
A
Water included in water we use PCC throughout this report to ensure consistency with historic data.
Customer’s underground companies’
company’s supply pipe reported leakage Care should be taken when comparing PCC between different regions as there
water main
may be variations in household consumption due to the other factors
mentioned above in addition to occupancy.
Assets owned by the water Assets owned by the property owner,
company, which is also who is also responsible for repairs Water companies publish their current and past PCC values on the website:
responsible for repairs
www.discoverwater.co.uk
ProducedbybyArtesia
Produced Artesia Consulting
Consulting The long term potential for deep reductions in household water demand 62. Household demand for water: 2.2. Past consumption
Figure 3: Trend in historic household consumption
Within this report we are taking a fifty year look into the There is no detailed breakdown of
future of household water consumption. To put this into household consumption in 1960.
context it is useful to take a glimpse back in time at how However people used less water for
domestic water consumption has changed over the last personal washing (typically a bath
fifty years. once a week), washed clothes by
hand or top-loading washing
Figure 3 illustrates the progression of household
machines, and washed dishes by
consumption, in terms of PCC (litres/head/day), since
hand. We have presented end-use
1960. The data sources are 1960 to 1981 (Herrington 1996),
data for 1976 and 1991 (Herrington
1992 to 1999 (Ofwat 1999), and from 1999 annual return
1996), 2003 (WRc 2005) and 2015
data has been provided by the Environment Agency.
(UKWIR 2016) in Table 1.
Consumption of water in the 1960s was around 85
l/head/day and has seen a gradual increase over time to
just over 155 l/head/day in 2004. Since 2006 there has been
a downward trend in overall PCC. The data from 1976 and 1991 is based on customer survey data and assumptions, whereas the data from 2003 and 2015 is
based on measurements of the flow of water into households. From this, the amounts of water used for different types of use
Table 1: Proportions of household end-use consumption has been identified. The different sources and methods used to classify the end-uses of household consumption make firm
End-use 1976 1991 2003 2015 conclusions on trends difficult.
WC flushing 30% 24% 29% 24% However, there is a consistent increasing trend in the proportion of household water used for personal washing, which is
Clothes washing 11% 15% 13% 12%
backed up from observations of the transition from a weekly bath to daily showering. A survey in 2013 identified that 70% of
the population have a full body wash at least daily, mostly by showering – over 50% never have a bath (Browne et al 2013).
Personal Washing 28% 32% 36% 39%
Showering used to be considered more water efficient than a bath, and indeed if you take a 5 minute shower with a flow rate
Dish washing 8% 8% 9% 10% of 8 l/min to get clean then this will use about half the amount of a typical bath of 80 litres. However shower times vary
External use 2% 5% 7% 4% greatly, and research into adolescent showering practices (Hassle 2016) indicates that average shower times of 20 minutes
are typical in this age group. Taking account of the higher flow rates of power showers, there is clear evidence behind the
Other internal use 22% 16% 5% 11%
increase in water used for personal washing.
ProducedbybyArtesia
Produced Artesia Consulting
Consulting The long term potential for deep reductions in household water demand 72. Household demand for water: 2.2. Past consumption (cont.)
There is also good evidence for reductions in water used flushing volume for the installation of WC cisterns. These there has been a downward trend in PCC since
for flushing WCs over the past 14 or so years, which is due currently limit the maximum volume of water flushed to 6 2006, of about 1.2 l/person/day annually
to the successive reduction in WC cistern sizes. litres; there is no lower limit (WRAS 2005). The current
limit was set in 1999, the prior limit was 7.5 litres, and The group existed until the end of 2008. Some of the key
Figure 4 shows histograms of WC volumes per flush for
before that 9 litres; older cisterns can have flush volumes in outcomes from the WSG were:
data collected around 2002 to 2004 (WRc 2005) and for
excess of 12 litres. The current water regulations also allow
data collected around 2015/16 (UKWIR 2016). There are a • The introduction of annual water efficiency targets by
dual flush mechanisms, with flush volumes down to 3 or 4
wide range of flush volumes and this is due to the mix of Ofwat for companies in 2010 -15 of 1 l/property/day.
litres.
WC cisterns that exist in homes. The distribution of flush • Establishment of Waterwise to promote water
volumes for homes monitored in 2002 to 2004 (shown in The success in water savings due to the reduction in WC efficiency, support companies in delivering savings,
blue) and those monitored in 2015/16 (shown in orange) cistern sizes has been tempered somewhat by the increase and develop the evidence for water efficiency.
are different. The mean flush volume in 2002 to 2004 was water wasted through leaking WCs. Two studies (Artesia • The introduction of the water stressed area
approximately 9.4 litres. This reduces in 2015/16 data to Consulting 2012 and Ricardo 2015) have shown that an classification for the purpose of extending metering.
approximately 7.3 litres. This reduction in volume per flush increasing number of WCs leak (either through the drop • A commitment to improve water efficiency in new
is due to water regulations, which prescribe the maximum valve in the cistern or the inlet valve in the cistern leaking homes through changes to Building Regulations and
and then overflowing). These studies present evidence the Code for sustainable homes.
Figure 4: Histogram of WC flush volumes 2002 to 2016 that whilst WCs are leaking, they have an average
25
2002 - 2004, Mean = 9.4 l consumption of between 200 and 400 litres/day. The Personal bathing (including showering) is a significant
2015/16, Mean = 7.3 l
20 proportion of installed WCs found to be leaking ranged proportion of water use in the home and has
from 4% to 10%. increased over time. This presents a challenge for
15
Frequency (%)
Referring back to Figure 3, there is a downward trend in future water conservation.
10
per capita consumption since 2006, equating to about 1.2 How can WC cistern volumes be further reduced in
5
l/person/day/year. There have been some key initiatives the future?
0 that have resulted in increased water efficiency activity
since 2005. In this year Defra established the Water What UK leadership in water efficiency will be2. Household demand for water: 2.3. Current consumption
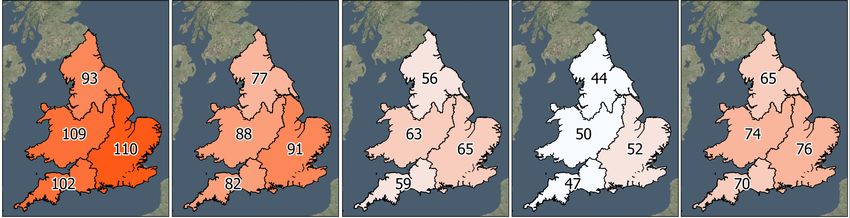
Figure 6: Geographic mean household
consumption as PCC (l/head/day) values for
The current demand for water used in households across Table 2 shows the average per capita (PCC) and per household (PHC) 2015/16
England and Wales is approximately 8400 Ml/d. This is consumptions in England and Wales, and is also broken down by
about 55% of all water put into the supply system. metered and unmetered properties, and by geographic area (South
East, South West, North, and Central).
If all the water produced for household consumption
The data is derived from reported values for 2015/16. The average PCC
every day was put into water bottles and laid end to end
is illustrated for the regions in Figure 6.
they would circle to the earth about 70 times.
The South East region has the highest household consumption figures,
Figure 5 shows the main elements of the water balance; followed by the South West region, with the North and Central regions
non-household consumption about 20%, total leakage being lowest. These variations in consumption can be influenced by
about 22% and 3% other minor components. any of the following: household occupancy, property type, age of
Figure 5: Proportions of the water balance occupants, socio-demographic factors, whether households pay via a
Minor components (3%)
meter, weather, and the methods used to measure and estimate
household consumption.
Total leakage (22%)
Table 2: PCC and PHC for different geographic areas in England and Wales
Non household consumption (20%)
Per capita consumption (l/head/day) Per household consumption (l/property/day)
Geographic area
All Unmetered Metered All Unmetered Metered
households households households households households households
England and Wales 140 142 120 342 379 266
Household consumption (55%) South East 146 160 132 373 460 305
South West 138 159 123 311 426 246
Central 133 142 117 318 364 250
North 134 147 111 316 371 237
ProducedbybyArtesia
Produced Artesia Consulting
Consulting The long term potential for deep reductions in household water demand 92. Household demand for water: 2.3. Current consumption (cont.)
Figure 8: Micro-components of water use for each property
We can break down household consumption into the types
(or ‘micro-components’) of water use in the home. Figure 7
shows the average breakdown of micro-components for a
group of 62 metered properties, spread across England
and Wales, monitored in 2015/16 (UKWIR 2016).
Figure 7: Average micro-components of water use
Some properties have leaks; whilst shower, bath, clothes
washing, dish washing and other water uses vary between The variation in water use between homes is important
The average values in Figure 7 mask a complexity of properties with similar PHCs and occupancies. Academic when we think about how to deliver deep reductions in
different water uses in each property, shown in Figure 8. studies into the behaviours and practices of water use in household consumption.
This figure shows that the range of per capita consumption the home report similar findings.
(PCC) values from about 420 to 40 l/head/day. The range of behaviours, habits and practices of water use,
A study into the patterns of water use (Browne et al 2013), our attitudes and values towards water use, and the type
This starts to illustrate the variety of use in individual highlighted substantial diversity between homes in terms of house, its water fittings, and the garden are all
properties due to the factors discussed earlier in this of the way in which the occupants performed different important factors to consider when trying to reduce water
section. practices (personal hygiene, laundry, kitchen and garden consumption in the future.
watering practices).
ProducedbybyArtesia
Produced Artesia Consulting
Consulting The long term potential for deep reductions in household water demand 102. Household demand for water: 2.4. Effect from metering
Figure 9: Distributions of metered and unmetered
consumption Recently Southern, South East, Thames and Affinity Water
Another important factor influencing water
have implemented compulsory or progressive meter
consumption in the home is whether a household pays for
programmes. A recent publication (Ornaghi and Tonin
water via a metered bill.
2017) on the impact of Southern Water’s programme to
Table 2 (presented earlier) indicates that average meter the majority of homes in their area indicates a 16.5%
household consumption for metered households in reduction in household consumption in metered homes.
England and Wales is 266 l/property/day, compared to 379 If we look back at all the annual reported data from water
l/property/day in an unmetered home. In terms of PCC the companies from 1999 to 2016 and plot the mean
values are 120 and 142 l/person/day respectively. household consumption for all properties against meter
There are various ways that homes become metered: all penetration, rather than time, then there is a significant
homes built since 1990 are metered, unmetered customers downward trend (shown in Figure 10).
can choose to become metered, and water companies can
Figure 10: Household consumption against meter penetration for water
meter existing properties if they are in a region of water This indicates that regardless of all the
companies in England from 1999 to 2016
stress and metering helps balance supply and demand. other influencing factors, increasing the
Households that have chosen to have a meter tend to opt proportion of households on a meter will
in order to save money on their water bill, largely because reduce the mean consumption through a
they have lower than average occupancies and/or range of factors, including:
consumption.
• Customers changing their behaviour
Metered households also have fewer losses and include to use less water or install water
fewer very high consumption properties. This is shown in efficient devices.
Figure 9, which illustrates the distribution of consumption • Consumption is being measured in
in a sample of metered (pink) and unmetered (blue)
the majority of households rather
properties from the same region. There is a lower average
than being estimated.
PCC and a shorter right hand tail on the distribution plot
for the metered households. • Losses being identified and repaired.
ProducedbybyArtesia
Produced Artesia Consulting
Consulting The long term potential for deep reductions in household water demand 112. Household demand for water: 2.5. Metering and tariffs
Table 3: % of homes metered by area in 2045
Figure 11 shows the progression of metering since For areas where meter penetration is high, the use of tariffs provides a potential
1999 for each water company, and the projected Area % of homes metered tool for managing demand in households. Theory suggests that that there is a
metering rates from the current draft water resource price elasticity for demand (metered users will limit their use as price increases).
England & Wales 86%
management plans. This illustrates that for some It is generally assumed that the ‘price elasticity of demand’ is low (generally well
areas a significant proportion of homes will still pay South East 88% below 0.5) for water (UKWIR, 2013; Komives et al, 2005), meaning that demand
for water use from an unmetered bill by the end of South West 88% will fall by less than 0.5% for every 1% increase in price.
2045. Table 3 shows the proportion of properties
Central 91% There are broadly two types of water tariff that are discussed in the literature for
metered in each area by 2045.
demand management, and these are: rising block, and seasonal. The rising block
North 77%
tariff works by charging more when the cumulative volume consumed exceeds a
Figure 11: Progression of metering since 2000
threshold. Seasonal tariffs impose an increase in tariff during specific periods
(e.g. between defined dates, periods when demand is high, or any other period).
The literature suggests that there are four key aspects that any demand
management tariff needs to deliver: the tariff should be fair, it should not be
overly complex to understand or implement, it should take account of household
size i.e. occupancy (so that high occupancy households are not disadvantaged),
and the tariff should provide feedback to customers on their water consumption
in order for them to make an informed change of behaviour.
There is evidence (Clayton, 2010) for much greater variation in elasticity, with
estimates between 2.5 and 4.5 times higher in summer, and up to 4 times greater
amongst highest income groups. This suggests that the potential for variable
South East Central tariffs to influence demand could be very significant among some consumer
South West North groups and during periods of high demand.
England and Wales average
Further research should be carried out to investigate how customers would
respond to more sophisticated tariffs and what mechanisms can be used to
provide tariff feedback to customers
ProducedbybyArtesia
Produced Artesia Consulting
Consulting The long term potential for deep reductions in household water demand 122. Household demand for water: 2.6. Trends and current forecasts
Figure 12 and Figure 13 show the past and future It is interesting to note that the rate of PCC reduction over Figure 12: Past trends in PCC by region (reported values)
trends in household water consumption. Figure 12 has the last 10 years (2005-2015) is similar in the South East ,
been derived from annual return data provided to the North and South West regions, despite the greater focus
Environment Agency by the water companies, and on implementing demand reduction measures to balance
Figure 13 has been derived from the water companies’ supply and demand in the South East regions. This may
published draft water resource management plans. mean that there is a greater upward pressure on PCC in
the South East that is dampening the additional demand
Note that the data in Figure 11 is annual reported data
reduction measures.
and is therefore influenced by weather variations. The
future trends present Dry Year annual average PCC Going forward the predicted rate of PCC reductions over
values (the consumption expected in a dry year, the next 10 years is greater than the following 20 years.
therefore there are no annual weather variations). The South East has the greatest reduction in PCC over the
next 10 years, levelling off in the last 10 years. The North
Table 4 shows the average trends in PCC for the past
region sees the greatest reduction in PCC up to 2045.
10 years, the next 10, 20 and 30 years. These trends Figure 13: Future PCC forecasts by region (DYAA values)
are a result of a number of factors including: increased If the average demand reduction forecast for the
metering, water efficiency practices, purchasing water next 10 years is maintained to 2065, the PCC in 2065
efficient devices and other external influences. would be about 105 litres/head/day.
Table 4: Historic trends and current forecasts by area - annual average trend in PCC (l/head/day)
Region 2005 - 2015 2015 - 2025 2025 - 2035 2035 - 2045
England and Wales: -1.1 -1.2 -0.64 -0.21
South East: -1.13 -1.37 -0.69 -0.14
South West: -1.27 -0.88 -0.40 -0.34
Central: -0.93 -0.82 -0.63 0
South East Central
North: -1.15 -1.13 -0.63 -0.49 South West North
ProducedbybyArtesia
Produced Artesia Consulting
Consulting The long term potential for deep reductions in household water demand 133. Supply pipe leakage: 3.1. Current and future trends
Customer supply pipe leakage (CSPL) is defined in Section During the consultation there was a significant amount of Currently, the average customer supply pipe losses are
2.1. and illustrated in Figure 2. It presents a complex research carried out by both water companies (through about 30 l/prop/day (about 8% of household consumption),
challenge for water companies, in that the asset is the UKWIR 2009, UWKIR 2014), and Government on the and are projected to reduce to 18 l/prop/day in 2045. CSPL
responsibility of the property owner, but any leakage from impacts on customers, the costs and benefits of customer currently accounts for 22% of total leakage, interestingly
the customer’s supply pipe is reported in the water supply pipe leakage. UKWIR has continued to carry out this rises to 26% of total leakage by 2045 (due to forecast
company’s total leakage figures. When it comes to research in this area to look at the economic levels of reductions in distribution leakage).
repairing a leak on a customer supply pipe, it is the customer supply pipe leakage (UKWIR 2015).
Thames Water propose the biggest reduction in CSPL (the
property owner’s responsibility to do the repair.
Figure 14 shows the levels of CSPL derived from the draft purple line in Figure 14 from 53 to 17 l/prop/day), through
water resource management plans. installing smart meters and using these to target smaller
customer supply pipe leaks.
Customers are often unaware that they have Figure 14: Customer supply pipe leakage trends
responsibility for the customer supply pipe, and repairs
or replacement of the asset can be complicated by South East Central
needing to access and work within a customer’s South West North
England and Wales average
property, with potentially expensive reinstatement
costs.
In 2013/14 Defra consulted on the ownership of customer
supply pipes, and whether they should be brought under
the control of water companies in a similar way to private
sewers. The consultation concluded that whilst there were
benefits to be gained from transferring ownership of
private supply pipes to water supply companies; there was
less certain evidence about the range of potential impacts
on water bills for various customers, and therefore there
was no further work carried out to transfer ownership.
ProducedbybyArtesia
Produced Artesia Consulting
Consulting The long term potential for deep reductions in household water demand 143. Supply pipe leakage: 3.2. Challenges and issues
The length of customer supply pipe is not accurately For unmetered customers sounding is the only option, this It is clear from Figure 14, that supply pipe leakage on the
known, however using an estimated length per property of means that small, but significant leaks could be running for most part will only reduce marginally for the majority of
9m (UKWIR 2009), and assuming about 25 million homes months, or even years, without detection. For metered companies.
in the UK, there are approximately 225,000 km of customers the frequency that the meter is read for billing
The lack of understanding around ownership of customer
customer supply pipe in England and Wales. This compares purposes affects the length of time a leak can be running.
supply pipes, with only 44% of households knowing it was
to about 340,000 km of water mains in England and Wales. With new smart meters being installed the length of time
their responsibility to fix a CSPL (UKWIR 2014), makes it a
for a leak to be identified should be reduced significantly.
Neither is the material that they are made from accurately challenge t0 reduce this area of water demand in
known, this is normally assumed from the age of the Most companies offer either a subsidised or free repair/ households. The challenges increase when there is shared
property and the material used at the time of construction replacement to customers with a supply pipe leak (UKWIR ownership of a supply pipe between a number of
(UKWIR 2009). 2014) as part of their overall leakage strategy. Several of customers. A change in ownership of these pipes to water
the stakeholders we talked to stated that the repair of the companies may help remove this as companies would be
Generally there is poor information on the condition of the
supply pipe is not that costly, but it is the reinstatement of more willing to invest in proactive replacement strategies
customer supply pipe assets. Yet they make up almost 40%
the customers land that has a significant cost. This is due as they do for the rest of the network.
of the total network and account for 22% of total leakage. At
to the wide variety and expense of the surfaces that
the present time there is no long term strategy for managing Smart metering and customer engagement technologies
customer supply pipes lie under from brickwork drive ways
and maintaining these assets. that inform the customer and the water company that their
to landscaped gardens. This makes the management and
costs of resolving customer supply pipe leaks much harder supply pipe may be leaking have the potential to reduce
We gathered views from a number of stakeholders on the
than the rest of the network. When these costly CSPL to around 8 l/prop/day in the future.
challenges around customer supply pipe leaks that
companies face today. There was a general concern about reinstatements are not carried out this causes issues with The cost of reinstatement and the confusion over
ownership, identification, reinstatement costs and customer satisfaction, which impacts on SIM metrics. ownership will mean that deep reductions in CSPL are
implications for SIM (Service Incentive Mechanism) Certain companies have had success by not offering a probably prohibitively expensive in the next 15 years.
measures. supply pipe repair for free, but support the customer However with new technologies that reduce awareness
through the process with a designated team. This has times and allow for easier repairs, large reductions are
Customer supply pipe leaks are found either by sounding
helped them improve their SIM score, and also helped to possible in this area by 2065.
on the stop tap to listen for a leak or by investigation of
high anomalous meter reads. reduce customer supply pipe leakage. Annex A has further information on supply pipe losses.
ProducedbybyArtesia
Produced Artesia Consulting
Consulting The long term potential for deep reductions in household water demand 154. Research: 4.1. Future views from stakeholder research Q1
Figure 15: PCC aspirations in 50 years time
We gathered views from a range of key stakeholders who were Some suggested an interim (25-year) target of around 100
likely to have views on long term deep reductions in household l/h/d; then a more radical target of 75-80 l/h/d over the
water demand. These included water efficiency champions in longer term. The aspiration cut across all stakeholders that
water companies, consumer organisations, regulators, this should be possible with legislative and technical
academics, consultancies, and new service providers. We solutions. With significant cross stakeholder agreement,
received 25 responses to the survey and followed up on a such an aspiration should be starting to develop on the
number of these through semi-structured interviews.. We basis of 'common ground'.
asked for feedback on four key questions:
Some respondents mentioned the importance of not going
• What level of consumption could be achieved in 50 years’ too low (towards 50 for instance); where health and quality
time? might then be compromised.
• What would be your overall vision for making deep
“I believe we could achieve around 50 litres per day. I “80-100 litres per person per day and we may not have a
reductions in household consumption in the next 50 years?
currently use around 70 litres a day without doing anything choice in 50 years’ time if current water quality/availability
• What ‘enablers’ (which might be legislative, regulatory, too out of the ordinary and feel this could be reduced.” and energy trends continue.”
policy, technical or behaviour related) would be need to
“85 l/head/day can be easily achieved in houses with “South Africa’s 50 litre challenge in Cape Town suggests
deliver this?
meters and water recycling for toilet flushing.” that it would be difficult to get to that without serious
• What do you think are the barriers to achieving this? implications for quality of life.”
“So I would say that the fifty year challenge is to get most
What level of consumption could be achieved in 50 years’ people to use a little bit less through pretty rudimentary “our family of four use 70 litres PCC and by no means are
time? behaviour change and water efficiency technology, and the we water martyrs despite my best intentions - there are daily
key bit is to get those fewer large users to use a lot less.” showers and kids occasionally leaving taps on!”
Whilst several respondents found this is a difficult question
to answer (given the timescale horizon envisaged), the “Whilst PCC is useful in its place, I am not sure that it “We could aim for 80 l/head/d as long as the technology
majority of respondents who chose to answer indicated that should be the focus of a 50 year ambition. Something around enables us to achieve this without having a negative impact
it would be possible to reduce consumption to below 90 the quantity of water abstracted from the environment may on quality of life. It would probably involve some degree of
litres per head per day within fifty years. Figure 15 shows a be better placed to drive innovation and take-up of new retro-fitting on existing properties and improved water
histogram of the responses. technologies.” recycling/re-use technology.”
ProducedbybyArtesia
Produced Artesia Consulting
Consulting The long term potential for deep reductions in household water demand 164. Research: 4.1. Future views from stakeholder research Q2
What would be your overall vision for making deep Respondents overwhelmingly identified the need for a Technology is mentioned for reducing water consumption
reductions in household consumption in the next 50 sustained long term national campaign to increase directly, replacing mains water with locally recycled water,
years? awareness of water in the environment and the need for or for enabling behaviour change. Smart metering was
water efficiency. One respondent mentioned the need for discussed in this latter context for being able to identify
There is general support for a fundamental change in social
a concerted effort of ‘myth-busting’ at a national scale excessive use or wastage, and relay this information back
attitudes to water and for the positive contribution that
(“always raining", "we get lots of rain", "it should be a free to the utility or the consumer.
changing regulation and legislation can make. One
resource").
respondent (supported by the majority) was adamant that Some mention was made of "water neutrality" (which was
the "number one thing" to instigate is a mandatory This vision of a national campaign is wider than water in vogue 8 to 10 years ago) in order to offset new
labelling system to drive the availability of water efficient companies and other groups were cited to incorporate that consumption in growth areas.
products and their use. awareness to builders, developers, innovators, designers
and architects.
“I would like to see water efficiency valued as an “The step change is really targeting those high users - “Myth busting is required as a national scale (“always
environmental behaviour in the same way as recycling is both in terms of waste, high volume use, especially in the dry raining, we get lots of rain, it should be a free resource, all
now.” year.” responsibility should be with water companies”).”
“We need a ‘plastics’ moment so that the penny drops “it’s also really clear that people are more receptive to “It will be imperative that customers have access to real-
and people understand the value of water .” behaviour change when they can understand why” time consumption information and bespoke advice and tools
to help them manage demand.”
“Focus on wastage – engineer as much unnecessary use “Have someone like David Attenborough support the
out of the system as possible.” cause.” “new innovative technology needs to be drastic and/or
revolutionary.”
“Stop water companies being the main point of contact “We believe we need a joint societal effort and
for customers with regards water efficiency – there is a partnership approach with key stakeholders such as
conflict of interest between revenue and water efficiency.” government, regulators and community partners.”
ProducedbybyArtesia
Produced Artesia Consulting
Consulting The long term potential for deep reductions in household water demand 174. Research: 4.1. Future views from stakeholder research Q3
What ‘enablers’ (which might be legislative, regulatory,
policy, technical or behaviour related) would be need to
deliver this? "New building standards from CLG, mandatory water "...unless customers are engaged and understand why
labelling from DEFRA, behavioural incentives from cabinet they need to reduce their water use, the other enablers are
The respondents gave significant emphasis on the need for
office, white paper on water efficiency and abstraction not likely to help to achieve the objective of reducing PCC.”
increasing legislative and regulatory reform as important
reform."
enablers to back up a sustained national campaign. In “Consideration of the forward price of water, based on
particular three quarters of respondents mentioned the "Increased confidence that demand management future scarcity would help drive change.”
implementation of a mandatory water efficiency labelling measures proposed by water companies including metering
“Metering every property is fundamental. We can find
scheme, and concentrated on the importance of improving and smart metering will be accepted by Ofwat"
more leaks/wastage and undertake greater water efficiency
and delivery water efficient products...there should be no "Replace every single flush toilet by 2030. Replace all on metered households. ”
toilets leaking! single flush in business properties, and sensor controls in all
“if technology can allow clothes washing, dishwashing,
Alongside this there were many who advocated the urinals"
toilet flushing, etc. to be done with less water, then
importance of tighter building and planning control around "Mandatory water labelling. This could be the single-most consumption can be reduced without the difficulty of
new developments and ensuring all homes are water powerful tool to reduce PCC with time. Remove drop-valve changing behaviour.”
efficient - with all retrofits to be to a specified standard; WCs from market to eliminate leaking WCs."
building regulations and water appliances, fittings need to “Variable charging by meter (advocate a quite large first
meet minimum standards. "Metering essential. Meters that can send data about block and then a second block to target profligate use).”
high volume continuous use to companies so that they can
A number of important enablers were mentioned for “Hot water use is the second largest part of domestic
target response."
reducing consumption in existing households; for example energy use and carbon emissions, but the UK’s energy
water companies increasing meter penetration - a "Whilst the introduction of dual-flush WCs into Fittings efficiency programmes do not actively include/require water
progressive metering approach will win customer support Regs has delivered a significant net water saving, the efficiency delivery. This is a massive lost opportunity to save
rather than overwhelming compulsory metering. Smart increasing volumes of mechanical drop-valve cisterns is water and further reduce energy use/carbon emissions.”
metering is a must for the future and the water industry creating a new and growing water loss problem."
could learn lessons from the energy smart meter at roll-out.
ProducedbybyArtesia
Produced Artesia Consulting
Consulting The long term potential for deep reductions in household water demand 184. Research: 4.1. Future views from stakeholder research Q4
What do you think are the barriers to achieving this?
The respondents identified two main barriers - people's Two aspects of water company regulation were presented Some respondents argue that the price review framework
lack of interest in water (unless there is a drought) and as potential barriers - first is a mind-set brought about by which incentivises water companies to compete against
Government reluctance to legislate or regulate in the area regulation in that a call for water use restraint is perceived each other on PCC is not conducive to joint working and
of building regulations and water labelling. There is as a water supply 'failure' and fear penalisation from Ofwat sharing of evidence or campaigns.
scepticism that voluntary schemes would have any - this hampers honesty and candid transparent
Other barriers identified include: lack of a national holistic
significant impact; which is in contrast to energy efficiency communication with customers.
long term thinking, fragmented responsibilities, short
labelling. Secondly, levels of leakage (mentioned by 4 respondents) termism, and the lack of widespread collaborative
provide a barrier of attitude to water companies – “why solutions beyond the water companies.
should we save water when the companies waste so
much?”
“Willingness and fully engaged “People do not seem to connect the dots between the “Keeping water label as voluntary would mean little/no
Government/regulatory/community partners is vital for deep environment, climate change, population growth and their impact – barrier would be Government not wishing to
reduction in household consumption.” water use.” regulate. Similar for Water Fittings Regulations – no change
will mean drop valve toilets continue to be installed ensuring
“Market reform - not being able to liaise with business users “In recent years water efficiency messaging has tended to
the problem exists long into the future.”
around reduction in water use and retailers currently not happen at times of drought/pressure rather than having
doing very much with water efficiency.” been a continuous activity. As a result, people forget and “The way that companies perceive that appealing to
quickly go back to their ‘old’ ways. Water is relatively cheap customers for restraint in dry periods is akin to admitting
“Demand management activities often have ‘uncertain’
compared to other utilities.” failure.”
outcomes, making them far less appealing to water
companies. Much simpler to look for a ‘new’ supply.” “Cost is always a barrier to any measures but the WRMPs “It is difficult in the UK to walk into a home improvement
mostly rely on demand management over the early years of store and get any information about which shower head is
“Customers’ valid question is ‘why should we save water
their plans to meet deficits, because it is cheaper.” more efficient. How can we expect people to save water if
when the companies waste so much?’ Companies need to
they don't have this information?”
show they are tackling it”
ProducedbybyArtesia
Produced Artesia Consulting
Consulting The long term potential for deep reductions in household water demand 194. Research: 4.2. Future measures for reducing household water demand
We researched a number of sources for information on Examples of the measures included in the 7 response
future measures for deep reductions in household water categories are shown in Table 5.
demand, these included:
Table 5: Examples of water demand reduction measures by response category
• water company draft Water Resources Management
Plans, Response category Examples 0f measures
• academic papers,
Smart metering, tariffs, pay-per-use appliances, linking
• a consideration of relevant behavioural economics Affect consumer choice in water using practices
energy and water efficiency
approaches,
• on-line searches for new technologies, approaches Ultra low flush toilets, recycling showers, waterless washing
Deliver greater efficiency
and systems, Patent databases, and machines
• a review of approaches to efficiency in other sectors,
Incentives, home water reports, smart bills, social norms and
particularly energy. Change public perceptions about water
feedback
From this survey we identified approximately 80 different
measures. These are detailed in Annex B. The measures Affect consumer choice in purchasing decisions Compulsory water labelling, rebates, scrappage schemes
were grouped into 7 response categories based on
Affect the governance, funding or regulation of water Water neutrality, supply pipe ownership, natural capital
whether they:
service providers accounting, utility bundling
• Affect consumer choice in water using practices
Community rainwater harvesting, Reduce amount of water
• Deliver greater efficiency Affect resource provision
available for public water supply
• Change public perceptions about water
• Affect consumer choice in purchasing decisions Fix leaky loos, ban sale of drop valve toilets, leak detectors,
Reduce water wastage
• Affect the governance, funding or regulation of water smart taps, smart showers
service providers
• Affect resource provision The measures were then scored based on an estimate of how many years until they could deliver widespread benefits (even
• Reduce water wastage if they exist as a measure now), and the level of potential water saving (which is derived from evidence bases and published
data. The results are plotted in Figure 16 (on the next page), highlighting some example measures.
ProducedbybyArtesia
Produced Artesia Consulting
Consulting The long term potential for deep reductions in household water demand 204. Research: 4.2. Future measures for reducing household water demand (cont.)
Figure 16: Chart showing the measures for reductions in household water demand and potential impact in terms of water The demand reduction measures were scored based
saving and time to widespread delivery on an estimate of how many years until they could
deliver widespread benefits (even if they exist as a
Community effluent re-use measure now), and the level of potential water
saving (which is derived from evidence bases and
Community rainwater harvesting
published data).
The results are plotted in Figure 16. This figure plots
Waterless WCs all of the measures (colour coded by response
category) and then highlights some example
measures.
Recycling showers
A majority of the measures in the bottom left hand
Water neutrality
corner of the plot will contain measures that are in
the current draft water resources management plans
Ultra low flush WCs as options for reducing demand. Measures delivering
deep demand reductions are towards the top of the
figure.
Measures to the right hand side of the graph would
require clear leadership, partnering with a wide
range of stakeholders, and support for the ongoing
Compulsory product labelling business cases for water efficiency
Examples of measures that the potential to deliver
deep reductions in household water demand that
exist now, are shown on the next page. Some of
these exist as trial products or sites, and some are
fully functioning commercial products or solutions.
Further details on these measures area in Annex B.
ProducedbybyArtesia
Produced Artesia Consulting
Consulting The long term potential for deep reductions in household water demand 214. Research: 4.3. Examples of measures for reducing domestic water demand
Introduction Propelair© ultra low flush toilet Albion Water - Rissington Thames Water: Smarter home North West Cambridge
visits (SHVs) Development
This page presents 14 examples of This toilet uses displaced air and Albion Water is providing full water
potential deep demand reduction water to provide a high- and wastewater services to this ex- The visits include tailored retrofits A community-wide rainwater
measures identified from our performance flush using only 1.5 RAF base, including 370 existing and advice to households, based on harvesting (RWH) system to
research. Each example is either in litres of water per flush. It is homes and 368 new properties. analysis of water use using a provide non-potable supply for
progress at the moment, or could currently aimed at commercial use Recycled water (green water) from bespoke app. SHVs are also toilets and washing machines for
be rolled-out more widely in the UK but reduced noise and cost would wastewater is part of the scheme provided alongside the company’s around 3,000 new properties. RWH
in the next 10-15 years. make it viable for domestic use. for new homes, for toilet use and ongoing smart meter rollout. is included in the development to
garden watering. meet planning conditions.
Miele ‘bundles’ subscription EnergieSprong refurbishments Smart showers Mandatory water labels Green Redeem customer rewards
The manufacturer Miele offers a Energiesprong is a Dutch company Showers are available which can be The Australian Water Efficiency Water companies are working with
service plan for washing machines which delivers a ‘wrap-around’ programmed to personal use Labelling Scheme (WELS) requires Green Redeem to provide
and dishwashers in the Netherlands retrofit of houses with the aim of patterns, e.g. to save water whilst point of sale labelling for a wide customers with additional
which include flat monthly fee or delivering net-zero energy ‘soaping-up’, and which have range water using products. It is incentives to save water. Points
pay-per-use option with a lower refurbishments in the UK. The proximity sensors and timers – e.g. estimated a total of 70 billion litres earnt can be spent by customers or
monthly fee and a cost per use, focus is on thermal insulation but Aqualisa. The Amphiro device per annum in water savings have put to community projects.
with online functionality (i.e. smart hot water efficiency could be connects to existing showers to been achieved from 2006, when
devices). readily incorporated. provide water and energy use data. the scheme began, to 2013.
Southern Water: Target 100 Watersmart Anglian Water: The Smarter Drop Recycling showers The waterless toilet
The aim of the Target 100 strategy Watersmart makes use of customer A focused water efficiency Systems are on the market which Currently the highest profile
is to reduce average consumption meter and other data to provide programme including advertising, collect and purify water that would example, developed at Cranfield
to 100 litres per person per day by personalised bills and behavioural education and other ‘outreach’ otherwise run to waste from University for use in less developed
2040. The four pillars of the nudges (e.g. comparing use to local work, plus installation of smart domestic showers. The Orbital countries, uses nano-membranes
strategy are: smart meters, home average). Leak alarms can be meters, aiming to achieve average Systems shower claims to recycle to extract water from solid waste
visits, personalised customer provided alongside customised consumption of 80 l/person/day in up to 90% of the water used. Prices and then gasifies solid waste. No
contact and incentives such as advice for reducing water use. Newmarket. are currently very high but would power or water is required.
Green Redeem. decrease with market uptake.
ProducedbybyArtesia
Produced Artesia Consulting
Consulting The long term potential for deep reductions in household water demand 22You can also read


