The Master Plan January 2010 - Wellington Airport
←
→
Page content transcription
If your browser does not render page correctly, please read the page content below

The Master Plan January 2010
Contents

1    Introducing our Plan                        2
2    Forecasts: the basis of our Plan            8
3    Our contribution to the region’s economy   16
4    Our plan for the airfield                  18
5    Our plan for the terminal precinct         24
6    Ensuring access to our airport             28
7    Enabling commercial development            30
8    Ensuring effective land use                32
9    Protecting our environment                 38
10   Implementing our Master Plan               42
11   Glossary and abbreviations                 51

                                                     Page 2
From the Chief Executive
Our airport is the Wellington region’s link to the world, sharing the
common goals of economic opportunity and a vision for growth.
Welcome to our future! This growth will require further investment of more than We’re committed to working with councils and other
I am delighted to present Wellington Airport’s Master $450 million in aviation and community infrastructure organisations in our region to improve public and other
Plan – our vision for development between now and the in the next 20 years. Through that investment, we’ll transport links to and from the airport. We will provide a
year 2030. increase our contribution to the regional economy to public transport hub which visitors and airport workers
$1.6 billion a year, with flow-on impacts of $3.1 billion. will be encouraged to use to get to and from the airport.
Wellington Airport has a vital role to play in Wellington’s
success as a modern economy. It’s a gateway to our Travellers will benefit immensely from this investment, The airport’s owners, Infratil Limited and Wellington City
region for millions of residents, visitors and businesses with a passenger terminal and other facilities that Council, support Wellington Airport’s development.
every year, connecting our capital city to all parts of will continue to offer them an efficient, friendly and
The airport is a generator of economic growth,
New Zealand and to Australia, the Pacific and the rest of innovative airport experience.
providing business and employment opportunities
the world.
In developing this plan, we’ve been fully aware of on site as well as in the city and the wider Wellington
The airport is also a generator of economic growth, its potential impacts on our environment. We are region. It’s a role we’re proud to play – and we’re
providing business and employment opportunities committed to reducing the impact of greenhouse gas passionate about continuing, and growing, our
on site as well as in the city and the wider Wellington emissions from the airport. contribution for many years to come.
region. It’s a role we’re proud to play – and we’re
We’ve also focused on managing our impact on our
passionate about continuing, and growing, our
neighbourhood, with a thoughtful approach to using
contribution for many years to come.
our own site that means we won’t need to undertake
Wellington Airport has a great future. By 2030 we extensive land purchases. And we will work with our
expect to see more than 10 million passengers every partners, Wellington City Council and the airlines, to
year – that’s double the current number of five million. introduce measures to better protect our neighbours
We’ll also generate about 11,500 new jobs in the region, against air noise. Steven Fitzgerald
sustaining 21,000 full-time-equivalent positions. Chief Executive
January 2010
Page 1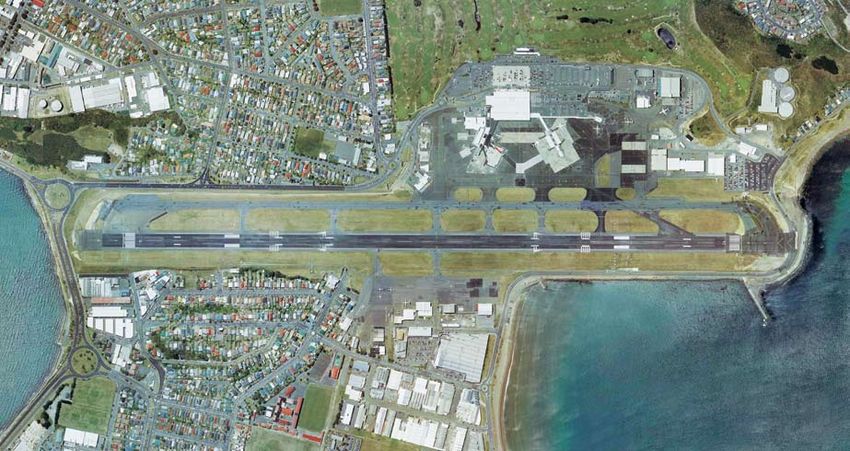
1 Introducing our Plan

Our commitment
• By 2030 we predict the number of passengers using        • We will generate around 11,500 new jobs in the          • New-generation aircraft will be able to fly further
  our airport each year will more than double, from          region, with the airport sustaining a total of 21,000     from our runway, opening new horizons for
  five million to over 10 million, at an average growth      full-time-equivalent jobs                                 Wellington travellers and businesses
  rate of 3.4% per year                                    • We will invest more than $450 million in                • We are committed to improving public transport
• Our airport will make a direct contribution of $1.6        infrastructure including runway improvements,             access and transport links to and from the airport
  billion per year to our regional economy, with a flow-     aircraft parking stands and additional terminal space
                                                                                                                     • We will continue to prioritise our customers’
  on impact of $3.1 billion per year                         and car parks, and we will also continue to invest in
                                                                                                                       experience when designing and operating an
                                                             commercial projects
                                                                                                                       efficient, friendly and innovative airport.

                                                                                                                                                                             Page 2
Page 3

1.1   Welcome                                              • provides information for regulatory authorities                  • indications of where, and approximately when,
      This Master Plan for Wellington Airport looks          and local and regional planners, especially                         we may need to acquire additional land on the
      ahead to the next 20 years and beyond. It provides     those responsible for delivering land transport                     airport’s periphery
      a framework for our future, building on the            infrastructure in our region
                                                                                                                              • an integrated land-use plan to guide us, our
      dramatic improvements we’ve already achieved         • supports our strategy for potential long-                           aviation industry partners and the wider
      since the early 1990s and since our previous           distance (‘long-haul’) air services, enabled by                     community.
      Master Plan, which was completed in 1994.              the development of new, larger, quieter, longer-
      The Plan provides us, our investors and other          range and more fuel-efficient aircraft                     1.2   Our place in Wellington
      stakeholders with a view of potential development    • positions the airport as a strategic regional                    As one of New Zealand’s three major international
      and investment opportunities, and is a basis           asset by ensuring ongoing business, travel and                   airports and the hub of New Zealand’s domestic
      for dialogue and consultation with the wider           trade opportunities for the Wellington region.                   aviation network, Wellington Airport has a vital
      community and our business partners and                                                                                 economic role as the gateway to the capital city
      associates. It:                                      As a vital part of our strategic and business                      and the surrounding region. We help to enable
                                                           planning, The Plan provides:                                       freight, business and government activities and
      • enables us to accommodate more aircraft as
                                                           • forecasts of demand for airport services                         are a dynamic hub in our own right, employing
        well as forecast growth in passenger numbers
                                                                                                                              about 1,500 people and, through our activities,
        and freight volumes
                                                           • a strategy for efficiently using and upgrading                   sustaining nearly 9,900 full-time-equivalent jobs in
      • enables us to allocate land for new business           the existing runway and taxiway infrastructure,                the region.
        and growth opportunities                               to provide for larger aircraft and increased
                                                                                                                              As a key enabler of tourism activity, we’re building
                                                               runway capacity
      • enables (and timetables) significant                                                                                  on the knowledge that, for some tourists, their
        infrastructural developments                       • a flexible, staged approach to developing the                    airport experience is their first impression of
                                                               airport, covering aircraft parking aprons1, the                Wellington. Our ‘Wild at Heart’ attitude is designed
      • is flexible to allow actual development to be
                                                               terminal building and car parking areas                        to enhance the travel experience – and as we
        matched to actual growth in demand – it will
                                                                                                                              develop the infrastructure initiatives in this Master
        remain a ‘living’ document that is regularly       • proposed locations for commercial
                                                                                                                              Plan, we’ll capture Wellington’s individuality,
        updated                                                development that will be compatible with
                                                                                                                              creativity and innovation to deliver a truly
                                                               aeronautical requirements
      • provides information that stakeholders, such as                                                                       memorable visitor experience.
        airlines and local authorities, can use to make
                                                                                                                              We’re proud to make a significant contribution
        informed investment decisions
                                                           1   An ‘apron’ is a defined area on an aerodrome intended          to the Wellington region’s economy, contributing
                                                               to accommodate aircraft for the purposes of loading or
                                                               unloading passengers or cargo, refuelling, parking or
                                                                                                                              around $1.45 billion per year. Our GDP
                                                               maintenance.

                                                                                                                                                                                      Page 4
contribution of almost $670 million in 2008 was                      Maximising our site                                     Providing parking for aircraft
      3.2% of the Wellington region’s 2007 total – a                       Wellington Airport occupies a site that is              It’s vitally important that we have enough parking
      substantial share for a single enterprise.                           extremely small, by international standards, for an     stands for the aircraft that use our airport at peak
                                                                           airport with more than five million passengers.         times. Our small site requires a smart, efficient
      Through this Master Plan, we expect to meet
                                                                                                                                   and flexible approach that meets forecast demand
      forecast growth and create more business                             However, Rongotai is the only practical long-
                                                                                                                                   for the increasing number, and size, of aircraft.
      and industry opportunities – ensuring we                             term location for the airport, so we must use our
      remain an efficient, flexible, cost-effective and                    space efficiently and to its full potential while
      environmentally considerate business while                                                                                   Providing easy access for travellers and
                                                                           retaining the flexibility to adapt to changing needs.
      continuing to deliver a unique ‘Wellington’                                                                                  other users
                                                                           We also need to consider whether our and our
      experience.                                                          community’s long-term interests would be better         We need to provide for the estimated 15 million
                                                                           served by acquiring and developing more land.           travellers and friends who’ll visit the airport each
1.3   Addressing important issues                                                                                                  year by 2030.
      The Plan addresses a number of issues for the                        Meeting district and regional planning                  The issue of regional transport has already
      airport and its owners, users and neighbours.                        requirements                                            been considered as part of the ‘Ngauranga to
      These include:                                                       The Wellington City Council District Plan has a key     Wellington Airport Corridor Study’3, undertaken
                                                                           influence on Wellington Airport and its use and         by the Greater Wellington Regional Council, the
      Managing growth in passengers, aircraft                              development as a strategic asset for the city and       New Zealand Transport Agency and Wellington
      and freight                                                          wider region.                                           City Council. We support the study and its
      Passenger numbers are forecast to double                                                                                     resulting plan: good airports need good access.
                                                                           A set of rules enables us to respond to worldwide
      between now and 2030, from five million to more
                                                                           trends and requirements in airport development
      than 10 million per year. In addition, annual aircraft                                                                       Enabling public transport and car parking
                                                                           and offer a range of complementary activities,
      movements2 are likely to increase from 114,000                                                                               Our small site poses a challenge in providing
                                                                           such as retailing in the terminal, vehicle hire and
      today to 126,000 in 2030, and freight processing                                                                             enough space for efficient vehicle access and
                                                                           other commercial services. These rules also seek
      will increase to more than 28,000 tonnes. We need                                                                            parking.
                                                                           to protect the amenity values of surrounding areas
      to plan for and accommodate this growth, while
                                                                           through controls on building setbacks, aircraft
      also considering its impacts on our environment
                                                                           noise, screening and lighting.
      and the wider community.

      2   An ‘aircraft movement’ is either a take-off or a landing by
          an aircraft. For airport traffic purposes, one arrival and one
          departure of an aircraft count as two movements.                                                                         3   For more on the study, visit www.gw.govt.nz.

                                                                                                                                                                                      Page 5
We support initiatives that promote public               Enabling long-haul services                          1.4   Consultation and review
transport and we welcome the increasing                  The imminent introduction of new long-range                We’re committed to consulting our community
patronage of the ‘Airport Flyer’ bus service.            aircraft types (such as the proposed Boeing 787            and other stakeholders as we develop our plans
We’re also committed to accommodating cyclists,          and Airbus 350) will offer fresh opportunities for         for the future.
pedestrians and taxis, and providing car drivers         Wellington to join the global air travel network
with services such as premium short-stay, valet                                                                     We’ve already talked to a number of people and
                                                         with direct connections to new markets. These
and long-term parking.                                                                                              organisations while developing this plan, including
                                                         aircraft bring more than extended range; they
                                                                                                                    airlines, government and non-government
                                                         also offer improved fuel efficiency. Their arrival
The Plan provides access for the existing mix of                                                                    agencies, general aviation (GA) businesses, freight
                                                         in Wellington for long-haul and trans-Tasman
vehicles, but has the flexibility to change if the mix                                                              companies, transport providers, neighbours and
                                                         routes will have a major influence on our future
of travel modes to and from the airport changes.                                                                    the community.
                                                         development.
This includes accommodating light rail, although
it’s unlikely to be introduced during this plan’s                                                                   Now that The Plan has been finalised we will look
timeframe.                                               Managing the costs of development                          to working with these organisations and people as
                                                         In the next 20 years we plan to invest more than           we implement it.
Managing airport noise and our environment               $450 million in infrastructure, including runway
                                                                                                                    If you would like to be involved in our future,
                                                         improvements, aircraft parking stands, additional
The airport’s closeness to residential areas and                                                                    please contact the Airport Planner via post to:
                                                         terminal space and car parks.
the local terrain creates unique challenges in
                                                                                                                    Airport Planner
managing aircraft noise.                                 Table 1‑1 Wellington Airport Investment in                 Wellington International Airport Ltd
These challenges need to be balanced with one            Infrastructure to 2030                                     Main Terminal
of the keys to the airport’s success: its position                                                                  PO Box 14175
                                                         Terminal                             $195,000,000
as a genuine ‘city airport’ that’s quickly and easily                                                               Wellington 6241
accessible.                                              Car Parking                          $140,000,000
                                                                                                                    Or e-mail to:
Providing an environmentally sustainable                 Apron, Airside and Runway            $115,000,000          masterplan@wellingtonairport.co.nz.
airport is a fundamental aim for the airport.
We are committed to reducing the impact of                                                  $450,000,000
greenhouse gas emissions from the airport as
well as making improvements to the efficiency
of the airport asset.

                                                                                                                                                                          Page 6
1.5   Explaining the terminology
      The Plan uses a number of terms specific to
      airports and the airport industry. You’ll find
      explanations of these terms in the Glossary on
      page 51.

1.6   Reviewing our Plan
      This master plan, together with the forecasts
      and assumptions on which it’s based, will
      be reviewed about every five years. We’ll
      publish the updated plans on our website at
      www.wellingtonairport.co.nz.

1.7   Acknowledgement
      We’d like to acknowledge and thank consultants
      Beca and Airbiz for their invaluable contribution to
      the development of this plan.

                                                             Page 7
2 Forecasts: the basis of our Plan

2.1   Independent forecasting expertise                                     Together, these methods generated passenger                              The scenarios covered all our key business areas:
      This plan is based on a number of forecasts                           forecasts, which were then combined with
                                                                                                                                                     • domestic
      developed by Booz and Company (Booz) – an                             expected trends in aircraft size and load factors6,
      independent management consulting firm                                to produce the aircraft movement forecasts.                              • Tasman
      with a specialist aviation practice and offices
                                                                                                                                                     • Pacific islands
      around the world.                                                     Long-term econometric model
                                                                            The long-term econometric model was based on                             • long-haul international.
      Booz developed forecasts for annual
                                                                            the relationships between demand for air travel
      passenger movements4, aircraft movements
                                                                            and the drivers of demand, such as real income,                    2.3   Freight tonnage forecasts
      and freight tonnage5 between 2009 and 2030
                                                                            real exchange rates (for international travel) and                       Booz forecast our annual freight levels using
      for three possible business activity levels:
                                                                            real air fares.                                                          information on aircraft movement growth and
      High, Central and Low. For this master plan,
                                                                                                                                                     changes in aircraft fleet make-up, while also
      and considering the current and potential                             Given the impracticalities of forecasting exchange
                                                                                                                                                     considering:
      future economic environment, we’ve adopted                            rates in the medium and long term, Booz excluded
      the ‘Central’ case forecasts.                                         this aspect from its international forecast models.                      • the amount of freight carried on passenger
                                                                            However, it did make some allowance for the                                aircraft versus freighters
2.2   Annual passenger and aircraft movement                                New Zealand dollar exchange rate in the short
                                                                                                                                                     • the international freight markets that Wellington
      forecasts                                                             term.
                                                                                                                                                       could serve and the freight volumes to these
      Booz prepared its forecasts for annual passenger
                                                                                                                                                       markets
      and aircraft movements using a two-phase model                        Short-term, supply-led scenarios
      that involved:                                                        Booz developed the short-term, supply-led                                • future trends in freight load factors
                                                                            scenarios by considering market intelligence
      • long-term econometric (mechanistic) modelling                                                                                                • airline information on the relative levels of
                                                                            and other factors not necessarily captured in
                                                                                                                                                        domestic and international freight.
      • short-term, supply-led scenarios.                                   the econometric approach, such as changes in
                                                                            aviation policy and the regulatory environment,
                                                                                                                                               2.4   Historic passenger, aircraft and freight
                                                                            airport competition, airline route development
                                                                                                                                                     movements
                                                                            plans and fuel prices.
                                                                                                                                                     Table 2-1 shows the annual passenger and air
                                                                                                                                                     traffic movements for Wellington Airport between
      4   A ‘passenger movement’ is a departure, arrival or transit event                                                                            1997 and 2008.
          by a passenger. For airport traffic purposes, one arrival and
          one departure of a passenger counts as two movements.
                                                                            6   ‘Load factor’ is the proportion of passenger seats occupied,
      5   Freight tonnage is the aggregate of departing (export) and            expressed as a percentage of the total seat capacity of an
          arriving (import) freight.                                            aircraft.

                                                                                                                                                                                                           Page 8
Page 9
Table 2‑1 Wellington Airport Traffic                                                                                                       2.5       Passenger, aircraft and freight forecasts
                                            Passengers  1
                                                                                                   Aircraft Movements 2
                                                                                                                                                     Figures 2-1 to 2-3 summarise the annual forecasts
                                                                                                                                                     for passengers, air traffic movements and freight
 Year                    International           Domestic              Total       International           Domestic                Total             tonnage.
 1997                       344,314            2,961,528          3,305,842               3,900            131,800           135,700                 They show:
 1998                       372,886            3,123,204          3,496,090               5,100            127,500           132,600                 • a forecast doubling of annual passenger
                                                                                                                                                       numbers, from five million to about 10.5 million
 1999                       436,246            3,119,843          3,556,089               5,700            127,300           133,000
                                                                                                                                                       in 2030, at an average growth rate of 3.4% per
 2000                       444,553            3,168,398          3,612,951               5,900            124,400           130,300                   year

 2001                       470,194            3,205,459          3,675,653               6,000            112,200           118,200                 • a forecast 10% increase in air movements, from
                                                                                                                                                       114,400 today to 126,100 in 2030. This largely
 2002                       468,750            3,234,772          3,703,522               5,600            109,600           115,200                   reflects the arrival of larger, new-generation
 2003                       445,642            3,454,387          3,900,029               5,500            115,000           120,500                   aircraft carrying more passengers and freight,
                                                                                                                                                       and is below the movement numbers in the
 2004                       456,279            3,867,358          4,323,637               6,100            110,200           116,300                   mid to late 1990s
 2005                       586,613            4,016,101          4,602,714               6,400            107,900           114,300                 • an increase in annual freight volumes from
 2006                       564,990            4,006,576          4,571,566               6,100            111,000           117,100
                                                                                                                                                       5,000 tonnes to more than 28,000 tonnes.

 2007                       575,398            4,060,313          4,635,711               5,800            112,700           118,500                 Figure 2-1
                                                                                                                                                     Figure 2-1
                                                                                                                                                     Annual    Passenger Movements Forecast
                                                                                                                                                     Annual Passenger Movements Forecast
 2008                       603,344            4,418,381          5,021,725               5,300            109,100           114,400         12
                                                                                                                                                     Passenger Movements (Million)
 Average Annual Growth Rates – 1997-2008                                                                                                     10

 97-08                          5.2%                 3.7%             3.9%                2.8%               -1.7%                -1.5%          8

                                                                                                                                                 6
Notes: 1. Based on financial years. 2. Based on calendar years.
Sources: Passenger movements: WIAL Operational Statistics to December 2008                                                                       4

Aircraft movements (1997–2007): Airways New Zealand data. Minor adjustments to remove non-airport Wellington vicinity movements                  2
Aircraft movements (2008): Booz forecast. Minor adjustments to remove non-airport Wellington vicinity movements
                                                                                                                                                 0
                                                                                                                                                     1997 2000 ‘03     ‘06     ‘09   ‘12    ‘15   ‘18   ‘21   ‘24   ‘27   ‘30
                                                                                                                                                       Total   International     Domestic

                                                                                                                                                     Source: Booz forecasts
                                                                                                                                                                                                                                Page 10
Figure 2-2 Fewer aircraft, more seats 2.6 ‘Busy-day’ and ‘busy-hour’ demand
Annual
Figure 2-2Aircraft Movements Forecast
The forecast of aircraft movements reflects a forecasts
Annual Aircraft Movements Forecast
140 worldwide trend among airlines to ‘up-gauge’ their Airports and airlines around the world accept that
120
Aircraft Movements (000’s) respective fleets (ie, use aircraft with more seating it’s simply impractical and uneconomic to plan
capacity) in response to: and design terminals and other airport facilities for
100
the potential peak in demand.
80 • limited additional airport capacity to
60 accommodate growth in traffic Instead, they use measures of historical ‘busy-
day’ and ‘busy-hour’ demand to estimate future
40 • the larger carrying capacity of new-generation
demand and design the optimum terminal
20 aircraft.
facilities.
0
Changes to aircraft mix rely on announced fleet
2010 ‘12 ‘14 ‘16 ‘18 ‘20 ‘22 ‘24 ‘26 ‘28 ‘30 This plan uses the International Air Transport
plans in the short term, the replacement of
Total International Domestic Association’s (IATA’s) method for assessing a
older-series aircraft with newer ones, and the
typical busy-day and busy-hour:
introduction of progressively larger aircraft types.
Figure 2-3
Annual
Figure 2-3Freight Tonnage Forecast • The historical ‘busy-day’ is defined as the
In forecasting changes to the fleet mix for
Annual Freight Tonnage Forecast second-busiest day in an average week
Wellington, Booz considered:
30 (excluding special events such as religious
Annual Freight Tonnage (000’s)
25 • airlines’ current plans for fleet upgrades festivals, trade fairs and conventions, and sport
events) during the peak month of the year.
20 • the assumption that Air New Zealand, Qantas,
Pacific Blue, Jetstar and new entrants will • The historical ‘busy-hour’ is defined as the
15
continue to up-gauge their fleets in the next busiest hour (on a rolling 60-minute basis) for
10 the particular segment of interest that occurred
20 years to cater for growing demand
5 on the busy-day for each year.
• the constrained runway capacity at Wellington
0 Airport.
2008 ‘11 ‘14 ‘17 ‘20 ‘23 ‘26 ‘29
Total International Domestic
Note: Freight tonnage is the aggregate of departing (export) and
arriving (import) freight.
Source: Booz forecasts
Page 11Current busy-hour demand Figure 2‑5 Figure 2‑6
In establishing current busy-hour demand, the Current Departing Passenger Demand Combined Busy-Hour Passenger Forecasts –
Figure 2-5 Figure 2-6
IATA process revealed that our busy day for the (2008 Busy-Week)
Current Departing Passenger Demand (2008 Busy Week)
Arrivals Busy Hour Passenger Forecasts – Arrivals
Combined
2008 financial year was Friday 7 March 2008, while 1,400 2,500
Number of Passengers Number of Passengers
the domestic busy-hour and international busy- 1,200
2,000
hour were at different times of the day. However, 1,000
the combined busy-hour usually corresponded to 1,500
800
the domestic busy-hour.
600 1,000
Figures 2-4 and 2-5 illustrate these results, 400
showing the current busy-hour demand levels for 500
200
passengers arriving at and departing the airport
0 0
during the busy week. Mon Tue Wed Thu Fri Sat Sun 2010 ‘12 ‘14 ‘16 ‘18 ‘20 ‘22 ‘24 ‘26 ‘28 ‘30
Domestic International Combined
Figure 2‑4
Current Arriving Passenger Demand
Figure 2-4
(2008 Busy-Week) Forecast busy-hour demand Figure 2‑7
Current Arriving Passenger Demand (2008 Busy Week) Combined Busy-Hour Passenger Forecasts –
Figures 2-6 and 2-7 presents our busy-hour Figure 2-7
1,400 Departures
Combined Busy Hour Passenger Forecasts – Departures
Number of Passengers
1,200 passenger forecasts.
2,500
1,000 The busy-hour determines the size of the terminal Number of Passengers
2,000
800 and associated facilities (such as the apron and
600 car park), so the almost doubling in arrival and 1,500
400
departure numbers will have significant effects on
our airport planning and design in the Master Plan 1,000
200
timeframe.
0 500
Mon Tue Wed Thu Fri Sat Sun
Domestic International Combined 0
2010 ‘12 ‘14 ‘16 ‘18 ‘20 ‘22 ‘24 ‘26 ‘28 ‘30
Page 12Page 13
2.7   Aircraft stand forecasts                                       Figure 2-8                                           2.8   Airport vehicle demand forecast
      The airport’s Eastern Apron areas, which serve                 Forecast
                                                                     Figure 2-8 Aircraft Stand Requirements
                                                                                                                                Forecasts for airport-associated road traffic in the
                                                                     Forecast Aircraft Stand Requirements
      the passenger terminal area, currently provide 28         30                                                              next 20 years are based on:
      marked parking stands for a range of aircraft sizes.           Number of Stands
                                                                25                                                              • the busy-hour projections for passenger arrivals
      We’re committed to ensuring stand availability for                                                                          and departures (see Figures 2-6 and 2-7)
                                                                20
      all aircraft arriving at the airport. With a forecast
                                                                                                                                • growth on the State Highway network of
      requirement of 12 additional stands by 2030, we           15
                                                                                                                                  2% per year to 20308.
      aim to:                                                   10
                                                                                                                                They estimate:
      • increase the total number of current stands at          5
        the same rate as annual passenger numbers                                                                               • a 60% increase in total traffic between 2008
                                                                0
        are expected to grow                                          2008 Existing         2015            2020   2030           and 2030
                                                                       International    Domestic   Remote
      • adjust the figures to take into account the                                                                             • an increase (from 31% to 38%) in the
        expected increase in aircraft size (with the                                                                              proportion of Wellington Airport traffic
        move to more and larger domestic jets and                                                                                 on Cobham Drive and Calabar Road as a
        fewer turboprops)                                                                                                         percentage of total traffic.
      • adjust the international stand requirement to                                                                           Table 2-2 illustrates these increases, along with
        reflect the fact that peak times are different                                                                          forecasts of peak-hour demand, which are based
        for long-haul and Tasman services, and for                                                                              on existing vehicle traffic information combined
        international and domestic services. This                                                                               with busy-hour passenger forecasts.
        means we can, for example, maximise our
        efficiency by using swing gates7 to meet this
        fluctuating demand.

                                                                                                                                8   Source: New Zealand Transport Agency’s Economic
      7    ‘Swing gates’ are gates that can be shared between                                                                       Evaluation Manual Volume 1 – Forecast for the Urban Arterial
          international and domestic use.                                                                                           Routes in the Wellington Region, 30 Sept 2008.

                                                                                                                                                                                                   Page 14
Table 2‑2 Wellington Airport Vehicle Forecasts1 2.9 Car parking forecasts
In calculating the airport’s future car parking
Current Forecast
requirements, we’ve taken into account the many
2008 2015 2020 2030 different services that should be available, such
as premium short-stay, valet, coach and long-term
Average Daily Vehicles 36,900 42,000 46,000 59,000
parking options.
Airport Traffic as a % of Total Traffic 31% 32% 32% 38%
We’ve also used the existing proportions of cars,
Peak-Hour Northbound Vehicles 2,000 1,800-2,300 2,000-2,500 2,600-3,300 taxis and public transport. However, we’re aware
that the situation could well change in the future,
Peak-Hour Southbound Vehicles 2,100 2,000-2,500 2,200-2,700 2,800-3,500
so we’ve ensured that the airport and this master
Notes: plan retains the flexibility to adapt. For example,
1 Vehicle traffic based on Cobham Drive flows.
we can accommodate continued increases in the
use of bus services such as the Airport Flyer.
2 Low end of range assumptions are based on an increase in vehicle occupancy to 1.5 passengers each per vehicle, a redefined modal split
(an increase of 5% for public transport users, not including taxis) and a lower passenger number forecast (by 10%).
Table 2-3 shows the forecast car parks required.
3 High end of range assumptions are based on a minimum vehicle occupancy of one passenger each per vehicle, the existing modal split,
higher passenger numbers (by 10%) and more-than-anticipated service vehicles. Table 2‑3 Total Required Car Parks
Current Forecast
2008 2015 2020 2030
Total Car Parks 2,960 3,570 4,030 5,270
Page 153 Our contribution to the region’s economy
3.1 Independent analysis Our investments in infrastructure Table 3-1 Wellington Airport Regional
In 2008 we commissioned BERL Economics While our day-to-day operation regularly requires Economic Contribution, 2008
(BERL) to provide an independent analysis of: capital expenditure on smaller-scale, routine Direct Total
Impact Impact
capital projects, we occasionally undertake far
• our economic impacts on the Wellington
larger projects that generate more significant Tourism Spend (Domestic)
region, both now and by 2030
impacts in a shorter timeframe, such as building a Output ($m) 147 280
• the economic impacts of a daily long-haul air new terminal or a car park complex.
Regional GDP ($m) 67 132
service from Wellington to Europe via Asia.
We also undertake some large-scale ongoing Employment (FTEs1) 1,247 1,941
capital expenditure projects, such as the current
3.2 Our economic impacts on the region Tourism Spend (International)
international terminal upgrade and the runway
As a result of its investigation, BERL reported that overlay. These have cost more than $200 million in Output ($m) 365 707
our economic impacts derive mainly from: recent years. Regional GDP ($m) 169 331
Employment (FTEs) 3,420 5,150
Tourism spend Our current economic impacts
Airport Complex Operations
We don’t just service the tourism industry, we BERL’s findings on our economic impacts in 2008,
propel it. Much of the activity generated by the Output ($m) 219 420
taking into account flow-on effects, are outlined in
expenditure of overseas and domestic tourists Table 3-1. Regional GDP ($m) 91 192
results from their travel through the airport.
Employment (FTEs) 1,361 2,575
Airport Complex Capital Expenditure
Our day-to-day operations
Our operating expenditure is dedicated to running Output ($m) 20 39.6
the airport – servicing passengers and to a Regional GDP ($m) 5.8 13.9
smaller extent freight movement. Many types of
Employment (FTEs) 98 200
business are needed to supply these services,
Total Airport Regional Economic Contribution 2008
including the airport, airlines, hospitality and rental
car businesses, duty-free stores; and customs, Output ($m) 751 1,446
security, biosecurity, freight forwarding, cargo, Regional GDP ($m) 333 669
taxi, postal and aircraft maintenance services.
Employment (FTEs) 6,126 9,866
Note: 1. FTE = full-time equivalent
Source: BERL
Page 16To provide some perspective, our GDP a single facility like ours. This employment in 2030 BERL estimated that:
contribution is greater than that of the entire is equal to employment in the region in 2008 in all
• initially, there would be enough demand
Wellington agriculture and food and beverage retail activities, or in government administration.
for 100,000 passenger movements per year
processing and manufacturing industries It’s more than the 2008 employment in
(significantly more than the 65,000 to 85,000
combined, and slightly smaller than that of the manufacturing and processing, or in health and
necessary to start such a service)
education industry in the region (which includes community services.
all schools, universities, polytechnics and private • within two or three years of service start-up,
training establishments). Table 3-2 Wellington Airport Regional a move to a daily service would increase
Economic Contribution, 2030
the flows to between 140,000 and 150,000
The scale of our importance is best understood by
2008 2030 passengers per year.
the additional employment we create – not only
in the people we employ but also in the numbers Economic Direct Total Direct Total The economic impacts of a daily long-haul service
Impact Impact Impact Impact Impact
generated by the flow-on effects of tourism and are significant for a single air service, with direct
our activities through suppliers. Output ($m) 751 1,446 1,608 3,098 spending by the 35,000 projected overseas
visitors estimated at $28.8 million a year. The total
The BERL report estimates that we currently Regional GDP
333 669 719 1,436 effect of this expenditure would be $52.7 million
support the equivalent of 9,870 full-time- ($m)
generated in the regional economy, $24.2 million
equivalent employees (FTEs) or 4.5% of the
Employment in GDP and the creation of 383 FTEs.
220,280 FTEs employed in the region. That’s 6,126 9,866 13,436 21,375
(FTEs)
more than the FTEs employed in the general Table 3-3 Impact of Long-haul1 on the
construction, finance and insurance industries Source: BERL Wellington Region
combined, or in personal and household goods
retailing across the region. The economic impacts of a long-haul Direct
Effect
Total
Effect
air service
Our forecast economic impacts Together with Wellington businesses and tourism Output ($m) 28.8 52.7
BERL’s assessment shows that by 2030 the organisations, we’re working to encourage airlines Regional GDP ($m) 12.4 24.2
airport’s direct impact on regional output will to provide long-haul services, initially between
be $1.6 billion per year, with a total impact of Wellington and Europe via Asia. This would provide Employment (FTEs) 254 383
$3.1 billion on the regional economy. obvious benefits of increased connectivity as well as
Note: 1. B
ased on a daily long-haul service from Wellington to
significant economic gains for the region. Asia and Europe within three years.
A forecast total regional GDP impact of $1.4 billion
Source: BERL
a year by 2030, and the maintenance of around
21,400 FTEs, will be a substantial contribution for
Page 174 Our plan for the airfield
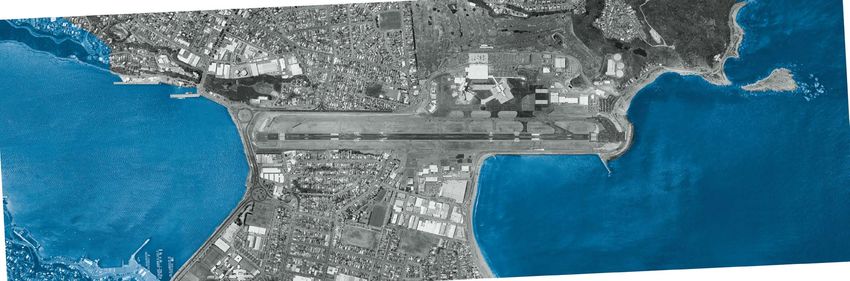
4.1 The current situation Table 4‑1 Wellington Airport Current Declared The airfield also features 11 stub taxiway links
Figure 4-1 illustrates the Wellington Airport airfield. Distances (metres) on the eastern side of the runway (between the
Its single north-south-oriented runway (Runways runway and parallel taxiway) and two taxiway links
Runway TORA ASDA TODA LDA
16 and 34) has a 45-metre-wide central paved directly from the runway to the Western Apron.
section and 7.5-metre-wide paved shoulders each 16 1,945 1,945 2,081 1,814 These provide all aircraft types with numerous
side, providing a total paved width of 60 metres. options for vacating the runway and help in
34 1,921 1,921 2,081 1,814
Its length and ability to accommodate large achieving relatively low runway occupancy times.
aircraft mean the airport has a ‘4E’ Aerodrome Notes: TORA = Take-off run available.
ASDA = Accelerate-stop distance available.
Reference Code in the International Civil Aviation TODA = Take-off distance available.
Organization (ICAO) Regional Air Navigation Plan9. LDA = Landing distance available.
In response to recent changes to New Zealand
Civil Aviation Rules, the runway ends have
been modified to provide 90-metre runway end
safety areas (RESAs) at each end. The current
operational lengths are:
9 ICAO Annex 14, Vol 1, Aerodrome Design and Operations.
ICAO Air Navigation Plan, Asia and Pacific Regions, Doc 9673.
Page 18Figure 4-1: Wellington Airport Airfield
Broadway
Terminal
Eastern Apron
Calabar Road
Taxiway
Runway
Cob
ham
Western Apron
Driv
e
Retail
Park
Page 194.2 Safeguarding airport operations Our planning for the next 20 years includes • harnessing new technology in the form of
Our plans for the future rely on safeguarding the preventing any further OLS obstructions that satellite navigation systems to enable more
airport’s ‘obstacle limitation surface’ (OLS) – that could impinge on the airport’s 300-metre-wide aircraft movements in poor weather conditions.
is, the land and airspace around the airport that runway strip and the OLS – thus ensuring effective We’re likely to do this towards the end of the
facilitate safe aircraft departures and arrivals. The and efficient airport operations. Master Plan period
Civil Aviation Rules specify the dimensions and
• continuing to work with our partners, the
requirements to maintain the OLS, and they are 4.3 Improving runway capacity
airlines and Airways New Zealand, on
safeguarded through the Resource Management Aircraft movements are forecast to increase by improving operational procedures.
Act 1991 (RMA) and Wellington’s District Plans. 10% by 2030. With just one runway (and no room
for another), we must ensure that it operates
The airport is already surrounded by terrain that 4.4 Planning for large aircraft operations
efficiently and that we maximise its practical
compromises our OLS, including: We have New Zealand Civil Aviation Authority
capacity, especially during peak times.
(NZCAA) approval to continue operating large
• the terrain at Wexford Hill, Tirangi Road, Bridge
Runway capacity currently ranges from 25 to 40 aircraft (such as the A330 and the proposed
Street and Palmer Head
aircraft movements per hour, depending on the B787) using our existing infrastructure, subject to
• minor terrain infringements within the runway runway in use and prevailing weather conditions. approved operating procedures. This is important,
strip10 While we won’t be able to increase this capacity as Wellington is an integral part of New Zealand’s
significantly owing to surrounding terrain, there air traffic system and can provide an alternative
• buildings on Tirangi Road (including the control
are a number of opportunities to increase it location when, for example, these aircraft need to
tower)
incrementally. These include: divert from other destinations, as well as facilities
• large aircraft at stands 23 and 26 and on the for occasional unscheduled visits (for example, by
• reducing runway occupancy time by enabling
apron and taxiways visiting foreign dignitaries).
some aircraft to vacate the runway more
• some vessels docking at Miramar Wharf quickly. This is achievable through widening However, the next generation of larger aircraft
two existing taxiways and adding two new types offers us exciting opportunities for growth.
• the radio transmitter on Mount Victoria.
ones to the Western Apron, a move that will With capabilities for an improved range and
also reduce the number of aircraft having to payload performance from shorter runways such
cross the runway (refer to Figure 4-2) as Wellington’s, they’ll provide better performance
on Tasman routes and be able to make direct
flights to Asian destinations and beyond.
10 A ‘runway strip’ is a defined rectangular area surrounding
a runway intended to reduce the risk of damage to aircraft
running off a runway and to protect aircraft flying over it
during take-off or landing operations.
Page 20Figure 4-2: New Taxiways
New Taxiways
Parking
Existing Tunnel 5 6 7
Upgraded
16/34 Runway
W2
Code C Taxiway
Page 21Enabling regular scheduled large aircraft The Master Plan proposes expanding the apron 4.7 Enhancing tunnel access
operations would require more infrastructure. In from 28 to 42 gates, with a flexible, stageable Wellington Airport owns a tunnel under the
particular, we’ll need to: design that accommodates different aircraft types runway and taxiway that enables members of the
and airline operations. public to walk or cycle between Coutts Street on
• increase the separation between the main
taxiway and runway centrelines the western side of the airport to Miro Street on
Most of the expansion will take place east of the
the east.
terminal (on the existing car park) and south on
• widen the taxiway on the eastern side of
the existing freight and maintenance areas. We propose maximising the tunnel’s use by
the runway, which will require (among other
changes) realigning Calabar Road dividing it in two, providing both continued
4.6 Expanding the Western Apron public access and secure access for small (up to
• relocate the Airport Fire Service (AFS) to a new The expanded Eastern Apron will place more a maximum of golf-cart size) airport vehicles. This
aviation support area to the south of the airport. demand on, and require an expansion of, the will improve our operational efficiency by enabling
Western Apron (the GA area). us to access both sides of the apron quickly and
• Install jet-blast deflectors to protect the
enable greater use of the Western Apron.
northern and southern ends of the runway. In addition to adding the two new taxiways (see
This would probably involve buying a limited 4.3), this Plan proposes:
4.8 Enabling a runway extension
number of properties to the east of Calabar Road. • expanding the apron to accommodate more Regulatory or operational imperatives may require
Where necessary, our fair valuation and purchase and larger aircraft us to consider extending the runway in future.
agreement for acquiring properties on the western
boundary will be extended to residents in these • providing space for a GA maintenance hangar Practical options for achieving this (considering
locations. and a terminal. the physical environment, engineering
and aeronautical requirements, and RMA
Many of the Western Apron’s existing facilities
4.5 Expanding the Eastern Apron considerations) include:
and infrastructure will be able to stay where they
The forecast increase in passenger numbers and are. Any that need relocating are likely to move • a 100-metre extension at the northern
freight volumes will demand an expanded and elsewhere on the Apron. runway end
more efficient Eastern Apron (the main terminal
These works are likely to involve buying a limited • a 500-metre extension at the southern
area).
number of properties on Coutts Street. The fair runway end.
valuation and purchase agreement for acquiring
While these extensions are not expected to
properties on the western boundary will be also
be needed in the next 20 years, given current
extended to these properties.
regulation, forecasts and aircraft performance
expectations, it is prudent to allow for them by
establishing areas for potential future extension.
Page 22Page 23
5 Our plan for the terminal precinct

5.1    The current situation                                                Figure 5‑1
       Figure 5-1 illustrates the current Wellington Airport                Existing Apron Layout
       Eastern Apron, which accommodates all our
       international and domestic passenger operations
       in the terminal precinct and provides 28 aircraft
       parking stands.
       The terminal precinct consists of:
       • a central terminal housing check-in facilities,                                             Existing   Existing Multi-          Existing Car park
                                                                                                     Car park   Level Car park
         retail concessions, lounges, baggage handling
         services and arrivals                                                                                                                                South Pier

                                                                                                            Central Terminal      Existing Car park
       • a north-west pier housing mainly international
         operations, with some domestic gates using
         a swing gate corridor. It has eight ‘contact
         stands’11 and can accommodate two large                                   North West Pier
                                                                                                                                                 South West Pier
         aircraft
       • a south-west pier for domestic and regional
         operations, which has stands for four domestic
         jet and four turboprop aircraft
       • a ground-level south pier for regional
         operations, which provides access to six
         turboprop stands.
      16

                                                                                                                                                                           34
       There are also three turboprop stands between
       the north-west and south-west piers, and three
       remote positions at the southern side of the
       Eastern Apron.

       11 A ‘contact stand’ is an aircraft stand next to the passenger
          terminal that passengers can access by an airbridge or walkway.

                                                                                                                                                                                Page 24
Figure 5-2 5.2 Planning for aircraft parking
2030 Apron Layout Figure 5-2 indicates the potential apron layout in
2030, showing 42 aircraft stands.
The layout of the north-west (international) pier
Car park expanded New multi-level JUHI vehicle and and the northern side of the south-west pier would
(new levels added) car park & future admin compound/
Bus Gates terminal reserve Airport access gate remain largely unchanged, as we expect parking
future reserve for
storage & pumps for international aircraft to grow progressively
southwards.
Airport access gate
The southern side of the terminal has room for
JUHI Main airport
Storage & access gate more intensive use, with the key change proposed
Pump Station Existing Terminal being an extended south-west pier. Contact
positions on both sides of the extension will be
able to handle smaller jets and turboprop aircraft,
while a new ground-level walkway will provide
Aviation
support access to turboprop stands further east of the
AFS current walkway.
Parking Remote To be completed in stages, this project would
car parking
involve:
• by 2015, reconfiguring the parking in current
airside12 areas (see Figure 10-2 on page 45)
• by 2020, expanding the apron eastward to the
current public parking area (see Figure 10-4 on
34
page 47)
• by 2030, extending the apron to the freight
precinct, which will involve moving aviation
support areas further south (see Figure 10-6
on page 49).
12 ‘Airside’ is the movement area of an aerodrome
and its adjacent terrain and buildings or portions,
to which access is controlled.
Page 25We anticipate keeping small commuter airline Our busy-hour forecasts have been used to Figure 5-3
operations close to the main passenger terminal. establish the terminal floor area required. Terminal Area Requirements – Gross Floor Area
Figure 5-3
However, if this doesn’t prove possible, there will Between now and 2030, we plan to increase the (square metres)
Terminal Area Requirements – Gross Floor Area (square metres)
be room for them on the Western Apron. current 42,000 square metres to 75,000 square 80,000
Area (m2)
metres (see Figure 5-3), which will enable us to 70,000
The plans also include:
undertake customer processing, meet increasing 60,000
• providing dual taxiways in an east-west security, customs, immigration and quarantine 50,000
direction (at all stages), which will provide a requirements, and provide food and beverage and 40,000
passing loop to minimise delays for aircraft retail facilities. 30,000
entering and exiting the aprons to the east of
Our plans ensure we have the space and flexibility 20,000
the south-west pier extension
to accommodate a dynamic terminal environment. 10,000
• creating a taxi lane13 and push-back14 zone, For example, it’s possible that security standards 0
2008 ‘10 ‘12 ‘14 ‘16 ‘18 ‘20 ‘22 ‘24 ‘26 ‘30
separate from the current taxiway (Zulu) on the and requirements will increase in the future, Existing
western side of the south-west pier extension. while the space required for processing trans-
This will reduce congestion on Zulu. Tasman passengers may reduce if New Zealand
and Australia implement joint programmes to
5.3 Planning terminal facilities streamline and harmonise these processes.
Our plans for the terminal are all designed to cope Any changes will happen progressively to meet
with forecast increases in passenger numbers, demand while ensuring business as usual –
and therefore baggage and other services. We aim providing a professional, efficient and comfortable
to achieve IATA’s ‘C’ service level during our busy experience for the people who visit and use the
hour, which is “a good level of service, conditions airport. You can read more about this staged
of stable flow, acceptable delays and good levels approach in Section 10.
of comfort”.
13 A ‘taxi lane’ is a portion of an apron designated as a taxiway
and intended to provide access to aircraft stands only.
14 ‘Push-back’ is the process in which an aircraft, usually a larger
jet type, is pushed back by a tug or tractor off a stand prior to
starting engines and taxiing away from the apron.
Page 26Page 27
6 Ensuring access to our airport

6.1   The current situation                                   Agency and Wellington City Council,                            We will encourage airport employers to use Traffic
      Wellington Airport is located at the end of a busy      on which we made a number of submissions.                      Demand Management measures to enable their staff
      urban road network with heavy traffic during peak                                                                      to use the most efficient method of getting to and
                                                              The study led to the adoption of the Ngauranga
      times.                                                                                                                 from the airport.
                                                              to Airport Corridor Plan in October 2008. The Plan
      Any increases in the demand for transport to and        identifies a number of short- and long-term priorities
                                                                                                                       6.3   Access to landside services
      from the airport will have significant impacts on       and initiatives for the corridor, which include:
                                                                                                                             In planning for traffic flow and parking at the airport,
      (and be affected by) existing and future constraints    • improving the route from Ngauranga to the                    we’ve used ‘a hierarchy of proximities’, locating
      in the Wellington region’s transport network.             airport                                                      services key to our business close to the airport and
      They’re also likely to affect the airport and its
                                                              • undertaking a light-rail feasibility study                   other, less essential activities further away.
      ability to operate as an efficient commercial
      enterprise.                                             • improving public transport services.                         This approach enables us to provide off-site
                                                                                                                             facilities for services such as long-term parking,
      This Master Plan aims to integrate with                 This Master Plan is most concerned with the effect             rental and valet storage and non-premium staff
      Wellington’s regional transport strategy,               of these initiatives on travel-time reliability to and         parking that, while essential to our commercial
      incorporating public transport development and          from Wellington Airport, particularly in terms of:             operations, consume large amounts of space.
      a staged growth in facilities while ensuring we
      provide an efficient, clear and flexible traffic flow   • the availability and range of parking facilities             Figure 10-5 shows an alternative location for these
      around the airport, adequate car parking and              in response to changes in travel modes (see                  services on the western side of Wellington Airport
      effective pick-up and drop-off services.                  Section 6.3)                                                 (adjacent to Bridge Street). We propose developing
                                                              • the public transport options, acceptable                     this area over the next two decades, providing up
6.2   Addressing access to the airport                          capacity and travel times.                                   to 25,000 square metres of car parking by 2030.
      Most of the region’s roading network that provides
                                                              The number of passengers using public transport                The most suitable land available for car parking
      access to the airport has enough capacity to meet
                                                              (buses) to access the airport is increasing, a trend           closer to the airport remains the area to the east of
      forecast demand until 2030, including growth
                                                              that’s expected to continue in response to public              the existing terminal building (which is currently
      at the airport. However, there are some areas of
                                                              transport initiatives in the Ngauranga to Airport              used for car parking and other vehicle-related
      localised congestion that, if not addressed, would
                                                              Corridor Plan. While we believe a light-rail system            activities). The Master Plan proposes building a
      severely compromise the performance of the
                                                              is unlikely within the Master Plan timeframe, we               multi-level car parking facility close to
      whole network.
                                                              could accommodate its introduction.                            the terminal; this will increase the number of car
      We believe it’s vitally important to retain the                                                                        parks in the building from 13% of the total of all
                                                              Our planning for 2030 is largely based on the                  parks to 75% by 2030.
      integrity of the Ngauranga to Airport Corridor – the
                                                              current mix of vehicles using the airport, with
      subject of a recent study by the Greater Wellington
                                                              ample room for change and movement to meet                     The car parking building would include a public
      Regional Council, the New Zealand Transport
                                                              different travel modes.                                        transport interchange and facilities for all ground-
                                                                                                                             transport modes.

                                                                                                                                                                                        Page 28
Page 29
7 Enabling commercial development

7.1   Enabling enterprise                                   7.3   The Airport Gateway                                     7.4   Using the terminal reserve
      We’ll continue to invest in commercial projects             We propose developing a substantial commercial                We’ve also identified another site to the south of
      using airport land not earmarked for aeronautical           precinct (the Airport Gateway) on land not                    the current car park building as a long-term future
      use. In determining future development, we’ll               required for aeronautical use to the north of the             ‘terminal reserve’ for potential expansion beyond
      apply the principle of ‘highest and best use’. This         terminal precinct, to support airport activities.             2030. Until then, this substantial site would be
      investment in commercial projects is in addition to         This may include hotels, conference facilities, car           available for uses such as premium car parking,
      the $450m required for infrastructure.                      parks, vehicle service centres and ancillary office           passenger terminal and ramp functions, car rental
                                                                  buildings for aviation service providers. While               support facilities and commercial development.
7.2   Airport Retail Park                                         remote from the terminal, it will still be accessible
      The popular Airport Retail Park on the Western              by foot.                                                7.5   Acquiring land
      Apron remains in the 2030 Master Plan. We also                                                                            We may need to buy a small amount of land
      expect to progressively develop commercial                                                                                during the Master Plan period to enable airport
      activities on airport-owned sites on the western                                                                          operations, such as widening our main taxiway by
      side of Tirangi Road and on the small site to the                                                                         realigning Calabar Road. We will extend, our fair
      south of the New Zealand Defence Force (NZDF)                                                                             valuation and purchase agreement for acquiring
      terminal. These may include bulk or trade retail                                                                          land on the western boundary to property owners
      businesses, light industrial enterprises, long-term                                                                       in these locations.
      car parking and other services.

                                                                                                                                                                                      Page 30
Page 31
8 Ensuring effective land use

8.1   The current situation                                8.3   Working with the Regional Coastal Plan                Wellington’s air cargo throughput forecast for
      As well as the aeronautical businesses, Wellington         We need approval under the Greater Wellington         2030 is 28,200 tonnes per annum, which means
      Airport is home to a diverse property portfolio of         Regional Council’s Regional Coastal Plan for any      our air cargo terminal facilities should have a total
      commercial, industrial, specialty retail and bulk          land reclamation we undertake, such as for a          floor area of 2,800 square metres, together with an
      retail enterprises and residential properties.             runway extension. Other plans that could affect us    allowance for:
                                                                 include the Regional Plan for Discharges to Land,     • landside loading docks, manoeuvring and
      We need to ensure that we continue to provide for
                                                                 Regional Freshwater Plan and the Regional Air           parking
      these entities, while growing our own business
                                                                 Quality Management Plan. Permits for Restricted
      and meeting the needs of travellers, visitors and                                                                • airside staging (for parking container dollies
                                                                 Coastal Activities are allocated by the Minister of
      other stakeholders.                                                                                                waiting to be loaded onto aircraft).
                                                                 Conservation, rather than the Regional Council.
      Our plans for the future – particularly those that                                                               This means we need to make sure we have
      relate to developments on the airport site – will    8.4   Assessing contaminated sites                          around 6,000 to 7,000 square metres for cargo
      also need to meet the requirements and plans of            We’ve identified the places in our airport where      space by 2030.
      the Wellington City Council and Greater Wellington         contamination from the past may have occurred –
      Regional Council.                                          see Figure 8‑1.                                       We expect to cope with cargo volumes until well
                                                                                                                       after 2020, but by 2030 we may have to move or
                                                                 If we want to develop these areas, we need to         reconfigure the current cargo-related leases to
8.2   Working with the District Plan
                                                                 gain resource consent to confirm the presence         cope with anticipated growth in cargo volumes
      The Wellington City District Plan has a major
                                                                 of contamination and, if so, establish acceptable     and apron area.
      influence on our plans for the ongoing use and
                                                                 ways of mitigating its effects.
      development of airport land.
      A set of rules enables us to respond to worldwide    8.5   Air cargo
      trends and requirements in airport development             Airport master planning worldwide typically
      and incorporate complementary uses such as                 calculates the area required for cargo facilities
      retailing in the terminal, vehicle hire and other          using a throughput of 10 tonnes a year for each
      commercial services typically associated with              square metre of cargo terminal floor area.
      airports. At the same time, the rules seek to
      protect the amenity values of surrounding areas
      through controls on construction, aircraft noise,
      screening and lighting.

                                                                                                                                                                               Page 32
You can also read