Torres Strait Tropical Rock Lobster Fishery - Five Year Business Plan
←
→
Page content transcription
If your browser does not render page correctly, please read the page content below
Torres Strait Tropical Rock Lobster
 Fishery – Five Year Business Plan

                                             A report prepared
      for the Department of Agriculture, Fisheries and Forestry

                                             December 2010

                               http://www.marsdenjacob.com.au
Marsden Jacob Associates
Financial & Economic Consultants
ABN 66 663 324 657
ACN 072 233 204
Internet: http://www.marsdenjacob.com.au
E-mail: economists@marsdenjacob.com.au
Melbourne office:
Postal address: Level 3, 683 Burke Road, Camberwell
Victoria 3124 AUSTRALIA
Telephone: +61 3 9882 1600
Facsimile: +61 3 9882 1300
Brisbane office:
Level 5, 100 Eagle St, Brisbane
Queensland, 4000 AUSTRALIA
Telephone: +61 7 3229 7701
Facsimile: +61 7 3229 7944261
Canberra office:
Unit 10, 11 McKay Gardens
Turner ACT 2612 AUSTRALIA
Tel: +61 2 6239 4382
Perth office:
Level 6, 731 Hay Street, Perth
Western Australia, 6000 AUSTRALIA
Telephone: +61 8 9324 1785
Facsimile: +61 8 9324 1751
Authors: Dr Tony Hand, Siobhan Davies
This report may be cited as: Torres Strait Tropical Rock Lobster Fishery - Five Year Business Plan, Marsden
Jacob Associates 2010
This report has been prepared in accordance with the scope of services described in the contract or
agreement between Marsden Jacob Associates Pty Ltd ACN 072 233 204 (MJA) and the Client. Any
findings, conclusions or recommendations only apply to the aforementioned circumstances and no greater
reliance should be assumed or drawn by the Client. Furthermore, the report has been prepared solely for
use by the Client and Marsden Jacob Associates accepts no responsibility for its use by other parties.
Copyright © Marsden Jacob Associates Pty Ltd 2010TABLE OF CONTENTS
Page
Background .................................................................................................................1
Objectives ....................................................................................................................1
Conduct of the study ...................................................................................................1
Report structure ...........................................................................................................2
Introduction ..................................................................................................................3
Location 3
TRL catch ....................................................................................................................5
2.3.1. Catch by product form ................................................................................................. 7
2.3.2. Total allowable catch (TAC)......................................................................................... 8
2.3.3. Sector shares of the fishery ......................................................................................... 9
Fishing effort ................................................................................................................9
Distribution of TIB catch and fishing effort ................................................................10
2.5.1. Incentives issues created by the CDEP ..................................................................... 11
Economic performance .............................................................................................12
Processing and marketing sector ..............................................................................15
Management objectives & settings............................................................................15
2.8.1. Proposed reforms ...................................................................................................... 16
Introduction ................................................................................................................17
TIB Sector ..................................................................................................................17
Questionnaire responses from the TIB sector ...........................................................18
TVH sector.................................................................................................................23
Marketing sector ........................................................................................................24
Comments .................................................................................................................25
Introduction ................................................................................................................26
Infrastructure & services ............................................................................................26
Training 28
4.3.1. Direct industry programs to train new TRL divers / operators .................................... 29
4.3.2. Mothership for use as a training platform .................................................................. 29
4.3.3. Employment subsidies for existing operators training new divers.............................. 29
4.3.4. Free divers................................................................................................................. 30
CDEP reforms ...........................................................................................................30
Additional assessments and toolkits .........................................................................30
Key steps in the design of capacity building initiatives..............................................32
Introduction ................................................................................................................35
General principles to apply in designing a potential buyout package .......................35
5.2.1. Previous PZJA policy position ................................................................................... 36
Staged buyout of TVH quota by Government (Option 1a) ........................................36
5.3.1. Capacity building before acquisition of Tranche 1 (Option 1b) .................................. 37
Government buyout for Tranche 1, cost sharing model for Tranches 2 & 3 (Option 2)37
Introduction ................................................................................................................39
Establishing targets ...................................................................................................39
Management reform timeliness .................................................................................42
Key risks ...................................................................................................................44
Other issues to examine ............................................................................................44
Establishing a Torres Strait Fisheries Reform Taskforce ..........................................45Department of Agriculture, Fisheries and Forestry
Torres Strait Tropical Rock Lobster Fishery - Five Year Business Plan
Executive Summary
BACKGROUND
Marsden Jacob Associates (MJA) has been commissioned by the Department of Agriculture
Fisheries and Forestry (DAFF) to prepare the “Torres Strait Tropical Rock Lobster (TRL)
Fishery – Five Year Business Plan”, which is to help guide the reform process for the fishery
over the July 2010 to June 2015 period.
OBJECTIVES
The Five Year Business Plan is a strategic plan that explores the aspirations of each sector in
the TRL fishery, including ways to maximize the economic and social utility of the fishery.
It is a vehicle by which each sector can express their desires (or “aspirations”) for the fishery
and document their views on:
infrastructure, capacity development, training and skills transfer requirements; and
future economic, marketing and business opportunities, including business models and
structures, transition schemes and partnerships.
CONDUCT OF THE STUDY
The study included an extensive stakeholder consultation process based around seven
workshops with representatives from TVH and TIB fishers (defined below), marketers, and
from each of the TRL regions. Another workshop was held in Brisbane to review the
overarching feedback from industry participants, and was attended by officers from the
Australian Fisheries Management Authority (AFMA), DAFF, the Department of
Employment, Economic Development and Innovation (DEEDI), and the Torres Strait
Regional Authority (TSRA).
BRIEF OVERVIEW OF THE TROPICAL ROCK LOBSTER FISHERY
There are four sectors in the Torres Strait (TS) TRL fishery:
Traditional Inhabitant Boats (TIB) – commercial Indigenous TS Islander sector,
allocated 53% of the Australian share of the total allowable catch (TAC)1.
Transferrable Vessel Holder (TVH) licences – commercial non-Indigenous sector,
allocated 47% of the Australian share of the TAC.
Traditional users – non-commercial Indigenous TS Islanders sector, allowed to fish for
personal or community use only. This sector is not included in the TAC, but is subject to
a daily catch limit.
PNG commercial fishers – PNG operators have limited access to the Australian
fisheries jurisdiction. The Australian TS Protected Zone (TSPZ) holds around 85% of
the total TSPZ TRL stock. PNG fishers are allocated up to 25% of TRL stocks in the
Australian TSPZ, but in many years the allocation will be lower as it is adjusted
downwards in accordance with the volume of catch taken in PNG waters.
1
Currently, this TAC is only a notional TAC as the fishery is managed through input controls. Once the
proposed quota system has been introduced, the TAC will be enforced.
ES.iDepartment of Agriculture, Fisheries and Forestry
Torres Strait Tropical Rock Lobster Fishery - Five Year Business Plan
The annual TRL catch is highly variable, with total fishery catch varying from a low of 122
tonnes in 2001 to a peak of 893 tonnes in 2005. This natural variability is accentuated by the
large fluctuations in prices for live crays and tails caused by market fundamentals (demand
and supply at the major international markets) or by exchange rate fluctuations.
The TS Rock Lobster Resource Assessment Group (TRLRAG) considers the fishery to be in
good condition biologically, but notes that the fishery was moderately overfished in four of
the last ten years – in 1999, 2001, 2002 and 2006 – which were also years of low abundance
and low Australian catch.
Fishing effort
At the end of 2007, there were 26 licensed primary vessels in the TVH sector, with 58
attached tenders. A buyout in 2007-08 saw 13 boats bought out with a total of 29 attached
tenders. 13 licensed TVH primary vessels, with a total of 34 attached tenders, remain in the
fishery today.
There are significant differences between TIB and TVH operations:
TVH operators run mother-ship operations with up to 7 tenders (or dories) attached.
All TVH divers use hookah equipment. TVH operators generally prefer to fish the
deeper water to the east of the fishery, but will fish in other zones depending on the
local abundance of lobsters, and weather conditions.
In 2009, 10 TVH operators recorded catch in the fishery, with total fishing effort
an estimated 1,281 days (an average of 72 days number of days per operation).
The economic returns for TVH operators have been estimated at $2,905 per
tonne per annum for 2007, and are significantly higher than returns to TIB
operators.
TIB operators use a 5-6 metre tender:
In 2009, total fishing effort for the TIB sector was just over 11 days per fisher.
An estimated 87% of TIB operators fished fewer than 20 days. Only 5% of
operators fished more than 50 days.
A feature of the TIB sector is the wide range in fishing effort:
Tier 1 „Serious commercial TIB fishers‟ – The top 5% of TIB
fishers (14 fishers) take 30% of the TIB catch;
Tier 2 „Semi professional TIB fishers‟ – Around 23% of TIB
fishers (65 fishers) take 50% of the TIB catch;
Tier 3 „Casual TIB fishers‟ – The bottom 72% of TIB fishers (200
fishers) take 20% of the TIB catch. In addition, they fished an
average of just four fishing days in 2009.
In 2007, annual profit (or income) for TIB operators (after deducting the crew‟s
share) ranged from $819 to $53,057 depending on region fished and whether the
TIB fisher was in tier 1, 2 or 3.
Another factor in the TIB fishery is the role played by the Community Development
Employment Projects Program (CDEP). CDEP provides a wage, currently $257.50 per week,
or $13,390 per annum, for indigenous TS Islanders employed through the Program.
Eligibility for CDEP payments is lost if income from other sources exceeds about $27,000
ES.iiDepartment of Agriculture, Fisheries and Forestry
Torres Strait Tropical Rock Lobster Fishery - Five Year Business Plan
per annum. Participants in the TRL fishery can thus earn up to $39,390 per annum through
the combined income from the CDEP and fishing.
While the income threshold creates an impediment to fishers becoming serious full-time
commercial fishers, CDEP also places a limit on TIB fishing effort. Many individuals will
only go fishing to „top up‟ on their base CDEP income.
The interaction between the CDEP and the TIB fishery poses a risk of an effort explosion in
the fishery in the future. Reforms to CDEP that reduced payments – or an increase in cray
prices that draw participants into the TIB fishery – mean there is significant potential for an
increase in fishing effort in the TIB fishery without the need to acquire any additional
licences. The planned reform of CDEP in 2010-11 thus means that the impact on TIB effort
will need to be monitored.
Processing and marketing sector
There are currently three marketing agents active in the fishery. Freezers are currently
operating on Thursday Island, Badu, Iama, and Poruma. There are also freezers on Mer
Island and Erub, but these are mainly used for finfish, as TRL are not generally caught
around these islands.
Tanks or cages can be used to keep live crays before they are collected by marketing agents
for air freighting to Horn Island, and then to Cairns, before being exported to Hong Kong.
Tails are transported by freight vessel to Cairns, before being air freighted to the main export
markets, which include Hawaii and North America.
Management objectives and settings
In 2005–06, the Tropical Rock Lobster Working Group recommended new management
objectives which were adopted by the Protected Zone Joint Authority (PZJA). These
objectives are:
to maintain the spawning stock at levels that meet or exceed that required to produce the
maximum sustainable yield;
in accordance with the TS Treaty, to protect the traditional way of life and livelihood of
Traditional Inhabitants, particularly in relation to their traditional fishing for TRL;
to provide for the optimal utilisation, co-operative management with Queensland and
PNG and for catch sharing with PNG;
to monitor interactions between the prawn and lobster fisheries;
to maintain appropriate controls on fishing gear allowed in the fishery so as to minimise
impacts on the environment;
to promote economic development in the TS area with an emphasis on providing the
framework for commercial opportunities for Traditional Inhabitants and to ensure that
the opportunities available to all stakeholders are socially and culturally appropriate for
the TS and the wider Queensland and Australian community; and
to optimise the value of the fishery.
Expansion in the fishery is limited to Traditional Inhabitants so as to maximise their
opportunities.
The PZJA has imposed licensing provisions to prevent the growth of the non-Islander sector,
both in terms of fishing capacity (boat replacement policy) and the containment of licence
ES.iiiDepartment of Agriculture, Fisheries and Forestry
Torres Strait Tropical Rock Lobster Fishery - Five Year Business Plan
numbers. There is also a ban on trawlers taking lobster to prevent pressure on the lobster
resource from the prawn trawling fleet.
Proposed reforms
A new Management Plan for the TS TRL fishery will be introduced in 2010-11, with a new
quota management system to replace a number of existing input controls.
The principal role of the Management Plan will be to:
streamline input controls;
introduce a mandatory TAC system;
set out the process for allocating quota; and
define the rules for mandatory logbook data reporting for fishers with quota.
THE FIVE YEAR BUSINESS PLAN
Aspirations
In order to guide the reform process to 2015, extensive stakeholder consultation was
undertaken. Key aspirations identified through this consultation showed that:
In the TIB sector, there was a desire to:
achieve 70% ownership of the TRL resource, transitioning to 100% ownership over
time;
ban hookah use in home reefs (and surrounding islands) of the Central North
Cluster and Mabuiag, to protect the catch rates of TIB free divers.
improve infrastructure and services;
improve training programs, particularly business skills, engine maintenance, and
use of safety gear and hookah.
maintain control over freezers;
invest in larger boats. TIB operators (as a group) do not want to move into larger
boats, but prefer to continue their current style of operation (i.e., 5-6 metre
tenders). Some would be potentially interested in moving into large scale
operations (i.e., larger boats of 8-9 metres in length, but not the TVH mother-ship
style of fishing enterprise).
In the TVH sector the principle areas for reform are seen as being:
relaxation / removal of inefficient input controls;
improved information about the nature and timing of the Government‟s policy for
buyout of TVH;
the proposed quota system.
In the marketing sector key concerns are to improve fishery outcomes and ensure that
catch volumes are maintained.
Strategies for TIB capacity building
There are some key areas where the capacity of the TIB sector needs to be increased if they
are to increase their share of the fishery and/or improve catch rates and profitability. Some
ES.ivDepartment of Agriculture, Fisheries and Forestry
Torres Strait Tropical Rock Lobster Fishery - Five Year Business Plan
steps that agencies such as the TSRA will need to take over the 5 year period of the Business
Plan include investing in:
infrastructure and services such as freezers and landing facilities;
training, especially in:
business skills, cash flow budgeting and completion of tax returns;
catching techniques – particularly in terms of handling techniques to promote
increased supply to the live cray market;
the use of safety equipment and safety protocols; and
the use and maintenance of hookah equipment.
RECOMMENDATIONS
Capacity building
To progress the above capacity building initiatives (see section 1.5.2), 4 Scoping Papers are
proposed, to set the foundation for a robust capacity building process.
Scoping Paper 1 will develop the financial, economic and social criteria for assessing
new infrastructure investments, and articulate the pros and cons of different models for
financing new infrastructure (covering issues such as alternative models for capital
contributions, user charges and public private partnerships).
Scoping Paper 2 will apply the framework developed in Scoping Paper 1 using a two
stage process. The first stage will be an audit of the infrastructure and services needs for
the TRL industry (and broader TS fishing industry) to identify a number of potential
projects. The second stage will apply the investment prioritisation process to set out the
specific investment priorities for the funds allocated by TSRA (and other agencies) to
the TRL and broader fishing industry in the TS.
Scoping Paper 3 would further develop the schedule of training modules
Scoping Paper 4 will identify key reforms to improve the efficiency of the freezer
operations.
Staged buyout of TVH quota
The purchase of quota will be dependent on an external source of funding, as TIB operators
do not generate sufficient operating surpluses to be able to afford to pay for TVH quota.
Two models for staged purchase of TVH quota are presented:
Option 1: sequential purchase of three tranches of quota (each 15% of total Australian
quota) from the TVH through a staged process fully funded by Government:
the acquisition of Tranche 1 by Government would achieve 70% TIB ownership.
any further government funding for the purchase of additional parcels of TVH
quota (i.e., Tranches 1 & 2), would be conditional on the TIB sector meeting key
capacity development milestones.
Option 2: is a cost sharing model, whereby the Government fully funds acquisition of
the first tranche, but then individual TIB operators and Government jointly fund the cost
of purchasing additional parcels of quota from the TVH sector.
ES.vDepartment of Agriculture, Fisheries and Forestry
Torres Strait Tropical Rock Lobster Fishery - Five Year Business Plan
At this stage the Government has made no commitment to funding a buyout, or partial
buyout, but core principles in designing any future buyout process would include:
phased increase in the TIB share of the TRL resource, so that TIB capacity to catch
TRL keeps pace with its capacity share;
a planned transition process;
investment in capacity building for the TIB sector to occur concurrently with any
process of acquiring TVH quota;
factors affecting incentives for TS islanders to participate in the TRL fishery to be
addressed concurrently with any process of acquiring TVH quota; and
mitigation of the risk of reductions in catch volumes by monitoring performance of the
TIB sector (i.e., in terms of total annual catch, participation rates, incomes and
profitability).
Total economic value of the fishery will decline if there is a shift in resource ownership from
the TVH sector to the TIB. Hence one of the outcomes of an adjustment process would be to
sacrifice economic profits from the TVH sector in return for increased employment of TIB
fishers and reduced reliance on the welfare system. Longer-term benefits would include skill
development for fishers, and the spill-over effects to other members of the community being
engaged in full-time employment (i.e., outside the CDEP system).
ESTABLISHING TARGETS
A key element in evaluating aspirations for capacity building and resource ownership is to
establish clear targets for the TIB sector and monitor performance against these targets.
A significant increase in the number of full-time fishers (Tier 1 fishers) and serious part-time
fishers (Tier 2 fishers) is required to lift the TIB effort by a sufficient amount to enable full
utilisation of Tranche 1. A realistic target would be to increase participation to the extent
required to use all of Tranche 1 over the five year life of this Business Plan.
KEY RISKS
Latent fishing effort presents a risk for the TIB – if there were to be a rapid increase in use of
TIB licences (or number of TIB fishing days), then the annual catch per fisher (or per tender
day) will clearly decline.
Options for mitigating this risk include:
splitting the quota between serious commercial and other TIB fishers. The former
would have a separate pool of quota, and this would be allocated amongst fishers
using an ITQ; and
moving TIB fishers with low levels of fishing effort back into the traditional fishing
class.
Other key risks for the fishery include:
management decisions not being made using a Public Benefit Test framework;
continued delays in introducing management reforms; and
a buyout of TVH effort without the use of a phased approach coupled with appropriate
TIB capacity building to ensure maintenance of catch volumes.
ES.viDepartment of Agriculture, Fisheries and Forestry
Torres Strait Tropical Rock Lobster Fishery - Five Year Business Plan
OTHER ISSUES TO EXAMINE
Additional initiatives that management could consider for the fishery include:
Bio-economic modelling – a bio-economic model could be used to estimate economic
profits and employment under a range of management settings, effort levels, and fleet
configurations. This is a decision support tool to assess the overall medium to long term
targets for the fishery, and to consider the benefits and costs of the TIB moving into
larger boats and hookah (i.e., to examine the tradeoffs between economic profits and
employment / access).
Review of a flexible harvest strategy – the TAC varies markedly each year, and it can
be difficult to ascertain at the start of each season what the TAC should be. It is also
difficult to predict the total effort from PNG in the fishery. The TAC could be reviewed
at the beginning of the season and adjusted upwards during the season if actual stock
abundance turns out to be higher than expected at the start of the season. This would
avoid utilisation of an overly conservative TAC for that season and could increase
economic returns for the fishery by enabling higher TACs to be adopted in some years.
A review of the nature of marketing businesses. The economics of the different
„styles‟ of buyers – i.e., the island based buyers (Iama and Badu), TI buyers (Pearl
Island and Tanala) and the Cairns based exporters (MG Kailis) – could be examined to
better understand what level of catch would need to be maintained to keep these
operations going, and what operations the fishery needs to remain viable with greater
TIB ownership.
Review of TIB sector motives for fishing. This study would consider the driving social
and cultural factors behind TIB fishers‟ decisions regarding the intensity of fishing (days
fished) and style of fishing operation. This research could improve knowledge of why
the levels of fishing effort in the TIB sector have been decreasing (finfish and lobster)
since the buyouts. This information is important if fishery managers are to make good
decisions about how to improve participation (and profitability) of the TIB sector.
ESTABLISHING A TORRES STRAIT FISHERIES REFORM TASKFORCE
To provide the strategic direction and implement specific reform initiatives, formation of a
Torres Strait Fisheries Reform Taskforce for a five year period is recommended.
The Task Force would not have a role in specific management issues per se, and hence
would not enter into discussions on matters that are best addressed through the PZJA. The
Task Force would help ensure that the community obtains maximum value from the TS
TRL.
ES.viiDepartment of Agriculture, Fisheries and Forestry
Torres Strait Tropical Rock Lobster Fishery - Five Year Business Plan
1. Introduction
Background
Marsden Jacob Associates (MJA) has been commissioned by the Department of Agriculture
Fisheries and Forestry (DAFF) to prepare the “Torres Strait Tropical Rock Lobster (TRL)
Fishery – Five Year Business Plan”, which is to help guide the reform process for the fishery
over the July 2010 to June 2015 period.
Objectives
In accordance with DAFF‟s Terms of Reference, the 5 Year Business Plan is intended to be a
medium term strategic plan to explore the aspirations of each sector, including ways to
maximize the economic and social utility of the fishery.
The 5 Year Business Plan is, in essence, an instrument for each sector to express their desires
(or „aspirations‟) for the TRL fishery and to document their current views on:
infrastructure, capacity development, training and skills transfer requirements; and
future economic, marketing and business opportunities, including business models and
structures, transition schemes and partnerships.
Moreover, DAFF‟s Terms of Reference specify that:
“The business plan could provide a range of business models that could
increase the participation of the Traditional Inhabitant Boat (TIB) sector in the
fishery and contribute to providing certainty to the future operating
environment for the Transferable Vessel Holder (TVH) sector.”
Conduct of the study
The study included an extensive stakeholder consultation process, based around a series of
seven stakeholder workshops, comprising:
Workshop 1 Representatives from the TVH / marketing agent sectors at a workshop
held in Cairns (October 2009).
Workshop 2 TIB fishers based on Thursday Island (December 2009).
Workshop 3 TVH sector fishers based on Thursday Island (December 2009.
Workshops 4-6 TIB sector operators – for the Central North Cluster (held at Poruma
Island), Western Cluster (Badu Island), and Central South Cluster
(Thursday Island).
In addition, a project workshop (Workshop 7) was held in Brisbane on 17 February 2009 to
review the overarching feedback from industry participants. The workshop was attended by
officers from the Australian Fisheries Management Authority (AFMA), DAFF, the
Department of Employment, Economic Development and Innovation (DEEDI), and the
Torres Strait Regional Authority (TSRA).
1Department of Agriculture, Fisheries and Forestry
Torres Strait Tropical Rock Lobster Fishery - Five Year Business Plan
Report structure
The report structure is as follows:
Section 2 Brief overview of the Tropical Rock Lobster fishery.
Section 3 Aspirations of the key stakeholder groups in the TRL fishery.
Section 4 Strategies for TIB sector capacity building.
Section 5 Models for the staged buyout of the TVH sector.
Section 6 Next Steps.
2Department of Agriculture, Fisheries and Forestry
Torres Strait Tropical Rock Lobster Fishery - Five Year Business Plan
2. Brief overview of the Tropical Rock Lobster
fishery
Introduction
This Section provides an overview of the current catch and level of fishing effort for both the
TIB and TVH sectors. A summary of the current management arrangements and proposed
management reforms is also provided in this Section.
Location
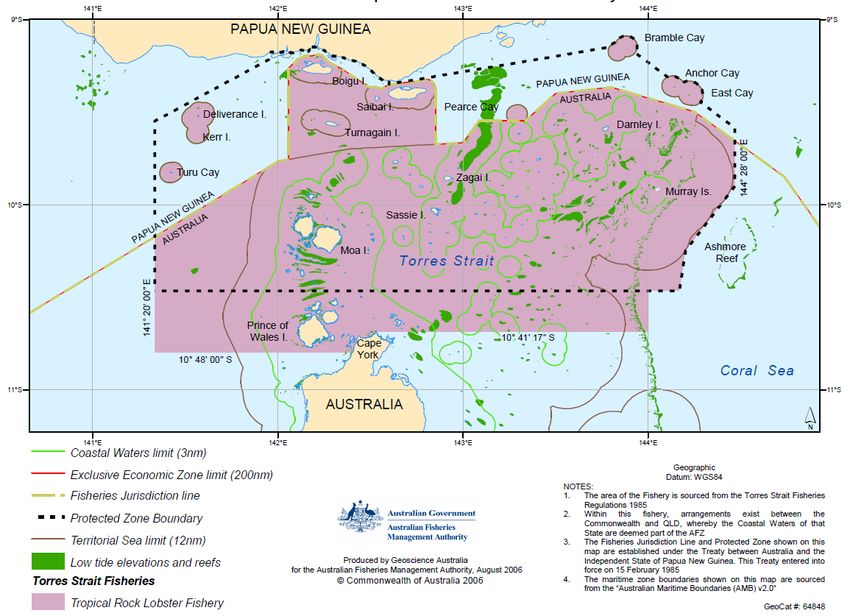
Map 2.1 shows the boundaries of the Torres Strait (TS) TRL fishery.
There are four sectors that participate in the fishery.
Traditional Inhabitant Boats (TIB) – this is the commercial Indigenous TS Islander
sector. The TIB sector has been allocated 53% of the Australian share of the total
allowable catch (TAC).2
Transferrable Vessel Holder (TVH) licences – this is the commercial non-Indigenous
sector. The TVH sector has been allocated 47% of the Australian share of the TAC.
Traditional users – this is the non-commercial Indigenous TS Islanders sector.
Traditional users are allowed to take catch for personal or community use only. This
sector is not directly included in the TAC, but is subject to a daily catch limit.
PNG commercial fishers – PNG operators are provided with limited access to the
Australian fisheries jurisdiction and this arrangement reflects, in part, the fact that the
Australian TS Protected Zone (TSPZ) holds around 85% of the total TSPZ TRL stock.
PNG fishers receive an allocation of up to 25% of TRL stocks in the Australian TSPZ,3
but in many years the allocation will be lower as it is adjusted downwards in accordance
with the volume of catch taken in PNG waters.4
A key feature of the fishery is the marked difference between the nature of the TIB and TVH
operations. TIB operators use a 5-6 metre tender (also referred to as dories or dinghies),
whereas TVH sector operators use a 10-20 metre primary vessel (or mother ship) which will
have between one and seven tenders attached to it. As outlined in Section 2.6, TVH
operators have a much higher level of profitability than TIB operators.
2
Currently, this TAC is only a notional TAC as the fishery is managed through input controls. Once, the
proposed quota system has been introduced, the TAC will be enforced.
3
Torres Strait Protected Zone Joint Authority, Torres Strait Fisheries Management Advisory Committee,
Meeting No. 11, 11-12 November, 2009.
4
During the 2009 TRL fishing season, PNG cross-endorsed vessels pursued the option to enter Australian
waters, fishing a total of 406 tender days in the Australian Jurisdiction to date. For the 2010 season
Australia proposes to issue cross-border endorsements to access the Australian fishing jurisdiction of the
TSPZ for a combined total of 1,036 tender fishing days (compared with 1,518 in 2009).
3Department of Agriculture, Fisheries and Forestry
Torres Strait Tropical Rock Lobster Fishery - Five Year Business Plan
Map 2.1: Torres Strait Tropical Rock Lobster fishery
4Department of Agriculture, Fisheries and Forestry
Torres Strait Tropical Rock Lobster Fishery - Five Year Business Plan
TRL catch
There has been high variability in annual TRL catch (Table 2.1) over the 2001 to 2009
period, with total fishery catch varying from a low of 122 tonnes in 2001 to a peak of
893 tonnes in 2005.
This high variance needs to be taken into account by operators in making investment
decisions and in managing their annual business cash flows.
Further accentuating the inter-annual variation in profitability are the large fluctuations in
prices for live crays and tails that can be caused by market fundamentals (demand and supply
at the major international markets) or by exchange rate fluctuations.
This high variability in profitability is relatively difficult to manage for larger operations
with relatively high fixed operating costs (e.g., maintenance expenditures) and/or high debt
repayment obligations.
Table 2.1: Catch by sector from 2001-09
1 1
Year TVH catch TIB catch Total
(tonnes) (tonnes) (tonnes)
2
2001 68.2 53.8 122.0
2
2002 139.8 69.2 209.0
2
2003 350.1 117.9 468.0
2004 454.1 267.6 721.7
2005 509.3 383.7 893
2006 125.9 200.1 326
2007 257.2 238.4 495.6
2008 97.4 176.9 274.3
2009 89.8 128.9 218.7
Source: AFMA 2010.
Notes: (1) All weights are calculated as whole weight equivalents using a conversion factor of 2.56 from
2001-2008 and 2.67 for 2009 to convert tails to caught weight. (2) TIB records prior to 2004 are less
reliable due to the nature of reporting prior to docket books.
Focusing on the 2006-09 period (as AFMA reports that data are more accurate for this period
than for the pre-2006 years), the TIB sector has exceeded its share of the notional TAC in
2006, but fell short or the TAC in the subsequent periods.
5Department of Agriculture, Fisheries and Forestry
Torres Strait Tropical Rock Lobster Fishery - Five Year Business Plan
Table 2.2: TIB catch and nominal TAC
Year Total Sector TAC % TAC
(tonnes) (tonnes)
2006 200.1 186 108
2007 238.4 301 79
2008 176.9 270 66
2009 125.9 174 72
Source: AFMA 2010.
Notes: (1) Tail weight calculated as whole weight equivalent using a conversion factor of 2.56 as TAC has
been determined with this conversion factor.
The TVH catch came close to reaching the nominal TAC (Table 2.3) in 2007, but fell well
short of the TAC in 2006, 2008 and 2009. In 2008 and 2009, the TVH catch was particularly
low relative to the TAC.
In 2006 there were twice as many TVH boats fishing than there are today, as this was prior
to the buyout which took place during the 2007-08 financial year. Nonetheless, catch was
low (relative to TAC) in 2006 due to low catch rates (caused by seasonal fluctuation in
resource abundance) which promoted some of the larger TVH operators to focus on the East
Coast Fishery instead
Only two boats were bought out in 2007 (i.e., in August 2007) with a further 11 bought out
in January 2008. Hence the buyout had a relatively low impact on fishing effort in 2007
which is consistent with the high catch (98% of TAC) in 2007.
Conversely, the low catch in 2008 and 2009 (compared with 2007, and as a proportion of the
TAC) is largely attributable to the impact of the buyout. The interim management measures
(see below) would also have contributed to catch being well below the TAC in 2008 and
2009.
Table 2.3: TVH catch and nominal TAC
Year Total Sector TAC % TAC
(tonnes) (tonnes)
2006 125.9 161.7 78
2007 257.2 262.2 98
2008 97.5 235.2 41
2009 87.8 152.0 58
Source: AFMA 2010.
Notes: (1) Tail weight calculated as whole weight equivalent using a conversion factor of 2.56 as TAC has
been determined with this conversion factor.
In aggregate terms, the Australian catch has not exceeded the TAC over the 2006-09 period
(Chart 2.1). The data show that the resource was significantly underutilised in 2008 and
2009 – the Australian catch was just 54% of the TAC in 2008 and 65% of the TAC in 2009.
6Department of Agriculture, Fisheries and Forestry
Torres Strait Tropical Rock Lobster Fishery - Five Year Business Plan
Chart 2.1: Total Australian Catch compared with the TAC
600
500
Catch (tonnes)
400
300
200
100
0
2006 2007 2008 2009
Australian catch 326 496 274 214
Australian TAC 348 564 506 327
Source: AFMA 2010.
2.3.1. Catch by product form
The industry is seeking to increase the ratio of live crays to tails, as the price paid per tonne
(as a whole weight equivalent) is much higher for live crays.
Despite a decline in the aggregate annual catch (Table 2.4), the volume of live crays taken by
the TIB increased over the 2007-09 period, but there remains scope to further increase the
ratio of whole crays to tails.
Table 2.4: TIB Catch by product form
Year Tails Whole Unknown Catch % Whole
(tonnes) (tonnes) (tonnes) (tonnes)
2007 211.5 34.9 0.69 247.1 14
2008 136.2 46.1 0.16 182.5 25
2009 74.2 54.7 0 128.9 42
Source: AFMA 2010.
Notes: (1) Tail weight calculated as whole weight equivalent using a conversion factor of 2.67.
The TVH sector‟s catch of whole crays varied significantly from 2007 to 2009 (Table 2.5) as
a percentage of total catch, while the total volume fluctuated from 36.6 tonnes to
61.6 tonnes.
7Department of Agriculture, Fisheries and Forestry
Torres Strait Tropical Rock Lobster Fishery - Five Year Business Plan
Table 2.5: TVH Catch by product form
1
Year Tails Whole Unknown Catch % Whole
(tonnes) (tonnes) (tonnes) (tonnes)
2007 204.6 61.1 0 265.64 23
2008 63.2 36.9 0 100.05 37
2009 50.1 39.7 0.010 89.82 44
Source: AFMA 2010.
Notes: (1) Tail weight calculated as whole weight equivalent using a conversion factor of 2.67.
Beach prices paid by MG Kailis are shown below (Chart 2.2), and the average price in 2009
for live crays ($46.1 per kilogram) was some $32.4 per kilogram higher than the price for
tails ($13.7 per kilogram). Tails are exported to the US market and live crays are exported to
the Chinese market. Hence, the strong Australian dollar relative to the US dollar in 2009
would have accentuated the price difference.
Nonetheless, the large price difference illustrates the economic benefits associated with
taking measures to increase the ratio of crays supplied to the live cray market.
Chart 2.2: Beach prices for live cray and tails
50 46.1
43.8
45
39.9
38.0
Beach price for TRL ($ per kg)
40
35
30.1
28.7
30
25 20.4
18.7
20 17.3
15.2 15.3
13.7
15
10
5
0
2004 2005 2006 2007 2008 2009
Live crays Tails (Whole weight)
Source: MG Kailis 2010.
2.3.2. Total allowable catch (TAC)
Annual fishery-independent surveys of the stock have been carried out in Australian waters
of the TS annually since 1989. A second survey, closer to the start of each fishing season
(pre-season), provides the information to formulate an annual TAC for the fishery.
The TS Rock Lobster Resource Assessment Group (TRLRAG) considers the fishery to be in
good condition biologically, but notes that the fishery was moderately overfished in four of
the last ten years – in 1999, 2001, 2002 and 2006 – which were also years of low abundance
and low Australian catch.
8Department of Agriculture, Fisheries and Forestry
Torres Strait Tropical Rock Lobster Fishery - Five Year Business Plan
2.3.3. Sector shares of the fishery
The resource share acquired by the Government through the 2007-2008 buyout of TVH
operators (see Section 2.4) was used to make provision for the PNG share of the TAC, and to
lift the TIB sector share of the Australian TAC to 53% (although this fell short of the TIB‟s
aspirational target of 70% TIB ownership), leaving the TVH sector with 47% of the TAC.
Fishing effort
In 2009, total fishing effort for the TIB sector was an estimated 3,146 dory days (Table 2.6),
but, with 279 active fishers, the average time spent fishing was low, at just over 11 days per
fisher.
Table 2.6: TIB Sector fishing effort, 2009
Effort parameter Value
Total number of fishers recording catch 279 fishers
1
Total number of TIB licences with cray (CR) endorsements 333 endorsements
2
Total no. of dory days 3,146 dory days
Maximum no. of days fished by any fisher 113 days
Average no. of days fished 11.28 days
Source: AFMA 2010.
Notes: (1) as at 30 January 2009. (2) Assumes recorded catch in a docket book record is for one day’s
fishing in one dory (calculated as one dory day). In some cases, more than one fisherman may have
fished for a recorded catch. In other cases, two fishers fishing from the same dory may sell their catch
separately, and this is calculated to be two dory days of effort.
Most of the fishers in the Central North Cluster and from Mabuiag (Western Cluster) prefer
to free dive, and are opposed to the use of hookah equipment around their home reefs (see
Section 3). However, a large number of Thursday Island and Badu based divers use hookah
equipment. Most TIB operators embark on relatively short trips, camping on islands near the
fishing grounds for one or two nights if necessary.
At the end of 2007, there were 26 licensed primary vessels in the TVH sector, with a total of
58 attached tenders. A tender process to buy non-traditional inhabitant vessels was
conducted at the end of 2007 and early 2008 and resulted in the removal of 13 licensed
primary vessels with a total of 29 attached tenders. Hence, 13 licensed TVH primary vessels,
with a total of 34 attached tenders, remain in the fishery.
In 2009, just 10 TVH operators recorded catch in the fishery (and hence three licensed
operators elected not to fish in the TS TRL fishery) and their total fishing effort was an
estimated 1,281 days (Table 2.7). The average number of days fished per operation was 72.
TVH operators run mothership operations with anywhere from 1-7 tenders (or dories)
attached. All of the divers working on the TVH operations use hookah equipment. TVH
operators generally prefer to fish the deeper water to the east of the fishery, but will fish in
other zones depending on the local abundance of lobsters, and weather conditions.
9Department of Agriculture, Fisheries and Forestry
Torres Strait Tropical Rock Lobster Fishery - Five Year Business Plan
Table 2.7: TVH Sector fishing effort, 2009
Effort parameter Value
Total number of operators recording catch 10 operators
Total number of TVH licences with cray (CR) 13 endorsements
endorsements
Total no. of operation days 719 operation days
Total no. of dory days 1,281 dory days
Maximum no. of days fished by any fisher 136 days
Average no. of days fished 72 days
Source: AFMA 2010.
Distribution of TIB catch and fishing effort
A key feature of the TIB sector is the high variance in the level of participation in the
fishery.
The following three tiers have been defined to demonstrate the high variance in fishing effort
by active TIB fishers:
Tier 1 „Serious commercial TIB fishers‟ – TIB fishers with the highest annual catch
per fisher are included in Tier 1. The top 5% of TIB fishers (14 fishers), who
are included in Tier 1, take 30% of the TIB catch (see Table 2.8).
Tier 2 „Semi professional TIB fishers‟ – TIB fishers with the mid range levels of
annual catch per fisher (i.e., lower than Tier 1, but higher than Tier 3) are
included in Tier 2. Around 23% of TIB fishers (65 fishers) are included in
Tier 2 and they take 50% of the TIB catch.
Tier 3 „Casual TIB fishers‟ – TIB fishers with the lowest levels of annual catch are
included in Tier 3. The bottom 72% of TIB fishers (200 fishers) are included
in Tier 3 and they account for only 20% of the TIB catch. In addition, they
fished an average of just four fishing days in 2009.
Table 2.8: Catch taken and fishing days for Tier 1-3 TIB fishers, 2009
Group (ranked % of the Annual Number of % by number of Average Catch per
by catch per total catch catch (kg) fishers fishers days fished fisher
fisher) taken per year
Tier 1 30 38,066 14 5.0 66 2,719
Tier 2 50 64,028 65 23.3 22 985
Tier 3 20 26,837 200 71.7 4 134
Source: AFMA 2010.
Moreover, Table 2.9 provides a summary of the frequency distribution of TIB fishing days
for 2009. An estimated 87% of TIB operators fished fewer than 20 days. Just 5% of
operators fished more than 50 days.
10Department of Agriculture, Fisheries and Forestry
Torres Strait Tropical Rock Lobster Fishery - Five Year Business Plan
Table 2.9: Frequency distribution of TIB fishing days, 2009
Days fished Volume of % of TIB
catch operators
taken catchDepartment of Agriculture, Fisheries and Forestry
Torres Strait Tropical Rock Lobster Fishery - Five Year Business Plan
Economic performance
In 2007, MJA surveyed a number of divers from Thursday Island, Badu, and Warraber as
part of the study MJA conducted for the Torres Strait Regional Authority (TSRA) on the
“Economic assessment of the Torres Strait Islander commercial fishing sector’s ability to
increase their share of the Kaiar and Finfish Fishery”.6
A summary of survey results is provided in Table 2.10. Annual profit (or income) for
operators (after deducting the crew‟s share of income) varied from:
$31,820 to $53,057 for Thursday Island operators;
$6,878 to $26,816 for Badu operators; and
$819 to $9,120 for Warraber operators.
The actual variation among TIB divers will be very high, and will depend on:
annual fishing days;
whether hookah equipment is used (as opposed to freediving);
fishing location;
skill / expertise; and
proportion of catch sold as live versus tails.
A key finding from this analysis of annual fishing returns, is that for the average TIB
fisher, there is very little, if any, economic surplus (over-and-above personal income)
that could be used to finance the acquisition of quota from the TVH. Thus at an
individual level it is unlikely that any TIB fishers will be able to buy quota. Moreover,
the current business model may not allow them to use quota in any case.
6
MJA, 2008, Economic assessment of the Torres Strait Islander commercial fishing sector‟s ability to
increase their share of the Kaiar and Finfish Fisheries, report prepared for the TSRA, May.
12Department of Agriculture, Fisheries and Forestry
Torres Strait Tropical Rock Lobster Fishery - Five Year Business Plan
Table 2.10: Annual fishing income, Thursday Island TRL operators
Thursday Island Badu Island Warraber Island
Operator 1 Operator 2 Operator 3 Operator 4 Operator 1 Operator 2 Operator 1 Operator 2 Operator 3
($) ($) ($) ($) ($) ($) ($) ($) ($)
Total revenue 140,250 115,000 91,625 68,250 25,200 69,300 15,000 15,000 3,125
Total costs 45,997 38,977 32,767 26,557 13,736 24,607 5,880 5,910 2,306
Profit (Before crew share) 94,253 76,023 58,858 41,693 11,464 44,693 9,120 9,090 819
Crew’s share of operating profit 41,196 33,904 27,038 20,172 4,585 17,877 - - -
Net profit / earnings 53,057 42,119 31,820 21,521 6,878 26,816 9,120 9,090 819
Source: MJA TS TRL Fisher Surveys, 2007.
13Department of Agriculture, Fisheries and Forestry
Torres Strait Tropical Rock Lobster Fishery - Five Year Business Plan
The economic returns for TVH operators were estimated by ABARE (Table 2.11) using
survey data it collected for a study it conducted on TS fisheries in 2007.7
Table 2.11: TVH operators, 2004-05
TRL
($)
Annual returns 457,518
Variable fishing costs 272,692
Owner and family labour 83,204
Gross operating profit 101,622
Fixed costs 43,503
Net profits 58,119
Total catch 20 tonnes
Profit per tonne ($/tonne/annum) $2,905
Capitalised value ($/tonne) $29,005
Source: MJA Torres Strait TS TRL Fisher Surveys 2007.
The principal reasons for the higher returns for TVH fishers, compared with TIB operators,
include the following.
Use of the mother ship / multiple tender style of operation – this enables the boats to
stay out longer, and to travel in rougher seas. There is far less time spent travelling to
and from port.
Use of hookah rather than freediving, which not only increases productivity but also
results in a higher percentage of crays being kept in a condition suitable for supply to the
live cray market.
More commercially oriented – the TVH operations are substantial fishing enterprises,
which drive skippers and crew to achieve high levels of operating efficiency and
productivity.
TVH operators fish full-time while most TIB operators are part-time fishers.
Moreover, TVH divers typically spend more hours diving each fishing day, increasing
catch rates which are measured on a catch per day basis.
Greater capital efficiency as TVH operators fish a much greater number of days each
year and this spreads the capital costs over a greater number of fishing days.
Greater returns from investing in skills development as they have higher retention
rates (i.e., for non-Indigenous crew).
Some of the TVH boats have dual endorsement for the TS and East Coast fisheries.
This enables higher catch rates to be maintained in the long term, as boats can be shifted
to the East Coast Fishery when there are relatively low catch rates in the TS fishery.
7
Fairhead, L. And Hohnen, L., 2007, Indigenous fishers in the Torres Strait – Improving their Economic
Benefits, ABARE Research Report 07.AA, prepared for the Fisheries Resources Research Fund, Canberra,
September.
14Department of Agriculture, Fisheries and Forestry
Torres Strait Tropical Rock Lobster Fishery - Five Year Business Plan
Processing and marketing sector
There are currently three marketing agents active in the fishery – MG Kailis, Pearl Island
seafoods and Tanala Seafoods.
Freezers are currently operating on Thursday Island, Badu, Iama, and Poruma. There are also
freezers on Mer Island and Erub, but these are mainly used for finfish, as TRL are not
generally caught around these islands.
Tanks or cages can be used to keep live crays before they are collected by marketing agents
for air freighting to Horn Island, and then to Cairns, before being exported to Hong Kong.
Tails are transported by freight vessel to Cairns, before being air freighted to the main export
markets, which include Hawaii and North America.
Management objectives & settings
During 2005–06, the Tropical Rock Lobster Working Group recommended new
management objectives which were adopted by the Protected Zone Joint Authority (PZJA).
These objectives are as follows:
to maintain the spawning stock at levels that meet or exceed the level required to
produce the maximum sustainable yield;
in accordance with the TS Treaty, to protect the traditional way of life and livelihood of
Traditional Inhabitants, particularly in relation to their traditional fishing for TRL;
to provide for the optimal utilisation, co-operative management with Queensland and
PNG and for catch sharing to occur with PNG;
to monitor interactions between the prawn and lobster fisheries;
to maintain appropriate controls on fishing gear allowed in the fishery so as to minimise
impacts on the environment;
to promote economic development in the TS area with an emphasis on providing the
framework for commercial opportunities for Traditional Inhabitants and to ensure that
the opportunities available to all stakeholders are socially and culturally appropriate for
the TS and the wider Queensland and Australian community; and
to optimise the value of the fishery.
In the TS TRL Fishery, expansion in participation is limited to Traditional Inhabitants so as
to maximise their opportunities.
The PZJA has imposed licensing provisions to prevent the growth of the non-Islander sector,
both in terms of fishing capacity (boat replacement policy8) and the containment of licence
numbers. There is also a ban on trawlers taking lobster to prevent pressure on the lobster
resource from the prawn trawling fleet.
8
Under the boat replacement policy, if primary vessels operated by the TVH sector (there are a total of 13
licensed primary vessels) are to be replaced, they must remain within their existing size classes which are
generally defined in around 2-4 metre increments.
15Department of Agriculture, Fisheries and Forestry
Torres Strait Tropical Rock Lobster Fishery - Five Year Business Plan
In addition, interim measures to control effort were introduced in 2003 and 2005 and
include:
a 30% reduction in the number of months that tenders from non-traditional inhabitants
were allowed to operate for licence holders that have two or more tenders associated
with a primary vessel (i.e., the „30% tender reduction‟); and
a prohibition on the use of hookah three days before, on the day of, and three days after
either the full or new moon each month from February to September (i.e., „moon tide‟
closures).
Other regulations currently implemented in the TS TRL Fishery include:
limiting the method of taking of lobster to either hand or with the use of a hand-held
implement, such as a spear or scoop net;
an October to November (inclusive) ban on commercial fishing;
a further ban on the use of hookah gear during December and January (inclusive);
a minimum tail size of 115 mm or minimum carapace length of 90 mm for all
commercially caught lobsters;
a bag limit of three lobsters per person or six lobsters per dinghy applies to traditional
fishing (Islander or visiting PNG Traditional Inhabitants) (the same limit applies to
recreational fishing under Queensland State law); and
the prohibition of the processing or carrying of TRL meat that has been removed from
any part of a TRL on any boat.
2.8.1. Proposed reforms
The principal reform measures include the introduction of a new Management Plan for the
TS TRL fishery in 2010-11 and the introduction of a new quota management system which
would replace some existing input controls that are deemed to be economically inefficient
(or simply unnecessary once the quota system has been introduced).
The principal role of the Management Plan would be to:
streamline input controls – removing any controls which are unnecessary in achieving
resource management objectives (hence it will be necessary to determine whether the
interim management controls – see above – are to become part of the future
management system, or whether they are deemed to be no longer necessary);
introduce a mandatory TAC system that would apply to fishers either as part of the
quota system, or through application of an Olympic system or „race for the catch‟ (i.e.,
in the event that some, or all, of the TIB sector of the fishery are not initially part of the
individual transferable quota (ITQ) system);
set out the process for allocating quota, and monitoring and enforcement of quota
systems (in July 2005 the TS PZJA made the decision to implement quota management
in the TRL fishery); and
define the rules for mandatory logbook data reporting for fishers with quota.
16Department of Agriculture, Fisheries and Forestry
Torres Strait Tropical Rock Lobster Fishery - Five Year Business Plan
3. Aspirations of the key stakeholder groups in
the TRL fishery
Introduction
In this section, we present an overview of the aspirations of each of the key stakeholder
groups which were attained through the series of workshops (see Section 3) conducted with
TIB operators, TVH operators, and marketing agents.
TIB Sector
At the workshops with the TIB sector, there were a number of consistent aspirations, which
were as follows.
1. A desire to achieve 70% ownership of the TRL resource as a starting point,
transitioning to 100% ownership over time (although at the Central North Cluster
Workshop participants called for 100% ownership as a starting point).
The underlying issues that sit behind the ownership aspiration include the desire of TIB
operators to:
maintain high catch rates in low TAC years;
provide enough resource share for the next generation of TIB fishers;
reduce local depletion effects caused by TVH;
offset the effect of an increase in catch by PNG operators; and
provide additional resource share to accommodate fishing activity by new TIB fishers
(i.e., in the event that there is a large increase in participation due to east coast fishers
coming back to the TS, winding back of the CDEP, or successful training programs).
2. A ban on hookah use by both TIB and TVH fishers in home reefs and surrounding
islands of the Central North Cluster and Mabuiag (in the Western Cluster).
The rationale for this aspiration is to protect the catch rates of TIB free divers. Hookah divers
are able to spend a lot more time diving each day and can dive in deeper water, catching
crays before they move on to the shallower reefs where free divers operate. Consequently,
intense fishing effort by hookah divers in a particular sub-region could create local depletion
effects (creating a negative impact on free divers‟ catch rates).
Some fishers also called for an increase in the length of the seasonal hookah ban.
There remains some uncertainty about the extent to which the interaction between hookah
and free diving affects catch rates for free divers. (i.e., it is difficult to accurately estimate the
significance of any competition on local fishing grounds between hookah and free divers).
However, AFMA Officers have noted that Tim Skewes from CSIRO has conducted some
research which indicates that lobster do not move from deep water to reef tops during the
season, but move to the top of the reef during summer and stay there until the migrate to
spawn.
17You can also read