Universities 2020 audits - FINANCIAL AUDIT 18 JUNE 2021 - Universities 2020 audits
←
→
Page content transcription
If your browser does not render page correctly, please read the page content below

FINANCIAL AUDIT                            18 JUNE 2021

Universities 2020
audits
NEW SOUTH WALES AUDITOR-GENERAL’S REPORT
THE ROLE OF THE AUDITOR-GENERAL

The roles and responsibilities of the Auditor-General,
and hence the Audit Office, are set out in the
Public Finance and Audit Act 1983 and the Local
Government Act 1993.

We conduct financial or ‘attest’ audits of State                                                               GPO Box 12
public sector and local government entities’ financial                                                         Sydney NSW 2001
statements. We also audit the Total State Sector
Accounts, a consolidation of all agencies’ accounts.

Financial audits are designed to add credibility to
financial statements, enhancing their value to end-
users. Also, the existence of such audits provides a                       The Legislative Assembly            The Legislative Council
constant stimulus to entities to ensure sound financial                    Parliament House                    Parliament House
management.                                                                Sydney NSW 2000                     Sydney NSW 2000

Following a financial audit the Audit Office issues a
variety of reports to entities and reports periodically
to parliament. In combination these reports give                           In accordance with section 52B of the Public Finance and Audit
opinions on the truth and fairness of financial                            Act 1983, I present a report titled ‘Universities 2020 audits’.
statements, and comment on entity compliance
with certain laws, regulations and government
directives. They may comment on financial prudence,
probity and waste, and recommend operational
improvements.

We also conduct performance audits. These examine
whether an entity is carrying out its activities
effectively and doing so economically and efficiently
and in compliance with relevant laws. Audits may                           Margaret Crawford
cover all or parts of an entity’s operations, or consider
                                                                           Auditor-General
particular issues across a number of entities.
                                                                           18 June 2021
As well as financial and performance audits, the
Auditor-General carries out special reviews and
compliance engagements.

Performance audits are reported separately, with all
other audits included in one of the regular volumes
of the Auditor-General’s Reports to Parliament –
Financial Audits.

© C opyright reserved by the Audit Office of New South Wales. All
  rights reserved. No part of this publication may be reproduced
  without prior consent of the Audit Office of New South Wales. The
  Audit Office does not accept responsibility for loss or damage
  suffered by any person acting on or refraining from action as a result
  of any of this material.

                                                                                                               audit.nsw.gov.au
contents
Universities 2020 audits
Section one – Universities 2020 audits
Executive summary 1
Introduction 5
Financial reporting 6
Internal controls 30
Teaching and research 40
Section two – Appendices
Appendix one – Status of 2019 recommendations 47
Appendix two – Universities' controlled entities 48Section one Universities 2020 audits This report analyses the results of our audits of the New South Wales university sector for the year ended 31 December 2020.
Executive summary
               This report analyses the results of our audits of the financial statements of the ten universities in
               NSW for the year ended 31 December 2020. The table below summarises our key observations.

                 1.        Financial reporting
                 Financial reporting                                                   The 2020 financial statements of all ten universities received
                                                                                       unmodified audit opinions.
                                                                                       Two universities reported retrospective corrections of prior
                                                                                       period errors. The University of Sydney reported errors
                                                                                       relating to the underpayment of staff entitlements and the fair
                                                                                       value of buildings. Charles Sturt University reported an error
                                                                                       relating to how it had calculated right-of-use assets and lease
                                                                                       liabilities on initial application of the new leasing standard in
                                                                                       the previous year.
                 Impacts of COVID-19                                                   Student enrolments decreased in 2020 compared to 2019 by
                                                                                       10,032 (3.3 per cent). Of this decrease, 8,310 students were
                                                                                       from overseas.
                                                                                       The ongoing impact of COVID-19 in the short-term, on
                                                                                       semester one enrolments for 2021 compared to semester
                                                                                       one of 2020, has been mixed:
                                                                                       •    all universities in NSW experienced a growth in their
                                                                                            domestic student enrolments
                                                                                       •    eight universities experienced decreases in overseas
                                                                                            student enrolments.

                                                                                       During 2020, universities provided welfare support to
                                                                                       students, created student hardship funds, provided
                                                                                       accommodation, and flexibility on payment of course fees.
                                                                                       State and Commonwealth governments provided additional
                                                                                       support to the sector:
                                                                                       •    those university controlled entities eligible to receive
                                                                                            JobKeeper payments received a combined amount
                                                                                            under the Commonwealth scheme totalling $47.6 million
                                                                                            in 2020
                                                                                       •    the NSW Government launched a University Loan
                                                                                            Guarantee scheme.

                                                                                                                                                           1
NSW Auditor-General's Report to Parliament | Universities 2020 audits | Executive summary
Financial results Six universities recorded negative net operating results in
2020 (two in 2019). While most universities experienced
decreased revenue in 2020, only four had reduced their
expenses to a level that was less than revenue.
Revenue from operations Universities' revenue streams were impacted in 2020 by the
COVID-19 pandemic, with fees and charges decreasing by
$361 million (5.8 per cent).
Government grants as a proportion of total revenue
increased for the first time in five years to 34 per cent in
2020.
Nearly 40 per cent of universities' total revenue from course
fees in 2020 (40.9 per cent in 2019) came from overseas
students from three countries: China, India and Nepal (same
in 2019). Students from these countries of origin contributed
$2.2 billion ($2.4 billion in 2019) in fees. Some universities
continue to be dependent on revenues from students from
these destinations and their results are more sensitive to
fluctuations in demand as a result.
Other revenues Overall philanthropic contributions to universities increased
by 32.2 per cent in 2020 to $222 million ($167.9 million in
2019). The University of Sydney and the University of
New South Wales attracted 75.2 per cent of the total
philanthropic contributions in 2020 (69.5 per cent in 2019).
Total research income for universities was $1.4 billion in
2019 1, with the University of Sydney and the University of
New South Wales attracting 66.5 per cent of the total
research income of all universities in NSW (65.2 per cent in
2018).
Expenditure Universities initiated cost saving measures in response to the
COVID-19 pandemic. The cost of redundancy programs
increased employee related expenses in 2020 by
4.4 per cent to $6.5 billion ($6.2 billion in 2019). The cost of
redundancies offered in 2020 across the universities totalled
$293.9 million. Combined other expenses decreased to
$2.8 billion in 2020, a reduction of $436 million
(13.4 per cent).
1 2020 data, which is compiled by the Australian Department of Education and Training, is not yet available.
2
NSW Auditor-General's Report to Parliament | Universities 2020 audits | Executive summary2. Internal controls and governance
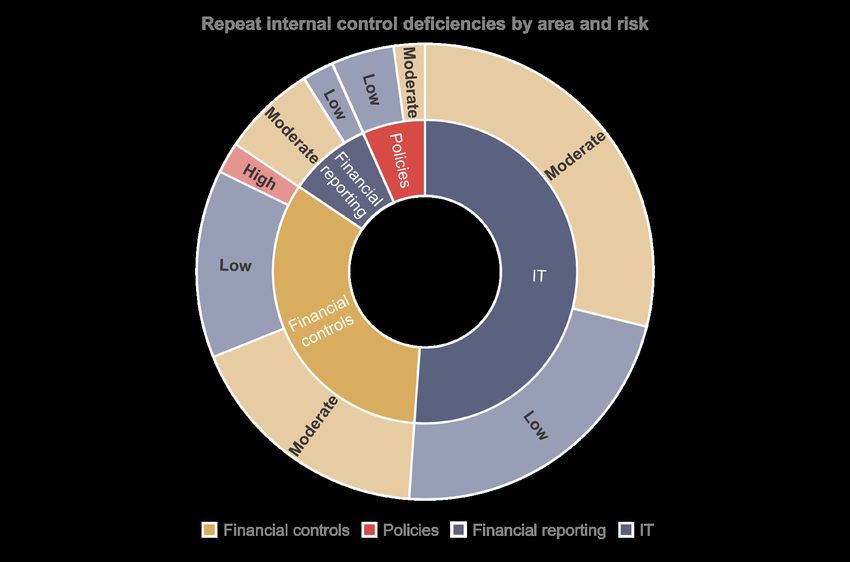
Internal control findings One hundred and ten internal control deficiencies were
identified in 2020 (108 in 2019). Forty-five findings were
repeated from 2019, of which 23 related to information
technology.
Recommendation: Universities should prioritise actions to
address repeat findings on internal control deficiencies in a
timely manner. Risks associated with unmitigated control
deficiencies may increase over time.
Three high risk internal control deficiencies were identified,
namely:
• The University of New South Wales should continue
work to assess its liability for the underpayment of casual
staff entitlements. This issue was also reported last year.
• Two high risk deficiencies were identified at Charles
Sturt University. One related to misunderstanding the
requirements of the new accounting standard in relation
to recognising grant funding revenue for construction
work. The second related to resolving issues identified
by an ongoing internal review of its employment
contracts to enable a reliable quantification as to the
university's liability to its employees.
Gaps in information technology (IT) controls comprised the
majority of the remaining deficiencies. Deficiencies included a
lack of sufficient privileged user access reviews and
monitoring, payment files being held in editable formats and
accessible by unauthorised persons, and password settings
not aligning with the requirements of information security
policies.
Business continuity and disaster All universities have a business continuity policy supported
recovery planning with a business impact analysis.
Except for Macquarie University, all other universities had
disaster recovery plans prepared for all of the IT systems that
support critical business functions. Macquarie University’s
disaster recovery plans were still in progress at
31 December 2020.
Only half of the universities' policies require regular testing of
their business continuity plans and six universities' plans do
not specify staff must capture, asses and report disruptive
incidents.
3. Teaching and research
Graduate employment outcomes Eight out of ten universities were reported as having full-time
employment rates of their undergraduates in 2020 that were
greater than the national average.
Six universities were reported as having full-time employment
rates of their postgraduates in 2020 that were greater than
the national average.
Student enrolments by field of Enrolments at universities in NSW decreased the most in
education Management and Commerce courses and Engineering and
Related Technologies courses. The largest increase in
enrolments was in Society and Culture courses.
3
NSW Auditor-General's Report to Parliament | Universities 2020 audits | Executive summaryAchieving diversity outcomes Five universities in 2019 were reported as meeting the target
enrolment rate for students from low socio-economic status
(SES) backgrounds.
Seven universities were reported to have increased their
enrolments of students from Aboriginal and Torres Strait
Islander backgrounds in 2019. The target growth rate for
increases in enrolments of Aboriginal and Torres Strait
Islander students (to exceed the growth rate of enrolments of
non-indigenous students by at least 50 per cent) was
achieved in 2019.
4
NSW Auditor-General's Report to Parliament | Universities 2020 audits | Executive summary1. Introduction
This report provides Parliament with the results of our financial audits of universities in NSW and
their controlled entities in 2020, including our analysis, observations and recommendations in the
following areas:
• financial reporting
• internal controls and governance
• teaching and research.
1.1 Snapshot of universities in NSW
10 Universities 59 Unqualified audit opinions
51 Local controlled entities 2 Audits in progress
23 Overseas controlled entities 23* Not audited
289,667** Student enrolments 17,729*** Academic staff (FTE)
(EFTSL) 7.6 per cent from
3.3 per cent from 2019 2019
63.1% Domestic 23,212*** General staff (FTE)
7.9 per cent from
36.9% Overseas 2019
* Of the 23 entities not audited, 22 were relieved from reporting requirements and one entity did not comply with requirements to provide financial
statements to the Audit Office of NSW. Further details are in Section 2.1 of this report.
** Equivalent Full-Time Student Load (EFTSL) represents the equivalent full-time study load for one year.
*** Full-Time Equivalent.
Source: Student and staff numbers are provided by universities (unaudited).
5
NSW Auditor-General's Report to Parliament | Universities 2020 audits | Introduction2. Financial reporting
Financial reporting is an important element of governance. Confidence and transparency in
university sector decision making are enhanced when financial reporting is accurate and timely.
This chapter outlines our audit observations on the financial reporting of universities in NSW for
2020.
2.1 Quality of financial reporting
Audit results
Unmodified audit opinions were issued for all universities
The 2020 financial statements of all ten universities received unmodified audit opinions for the
purposes of satisfying the requirements of the Public Finance and Audit Act 1983 (PF&A Act).
The University of Sydney reported retrospective correction of prior period errors
The University of Sydney reported the retrospective correction of two prior period errors. One
related to the underpayment of staff entitlements and the other related to fair value of buildings.
During 2020, the University of Sydney identified that certain employees covered by the university's
Enterprise Agreement 2018–2021 were paid less than their correct entitlements in certain
instances. While the review is continuing, the University of Sydney recognised an accrual for the
remediation of the underpaid staff entitlements of $31.1 million at 31 December 2020. This accrual,
covering the period from 2014 to 2020, comprises $25.6 million relating to salary payment shortfalls
(including superannuation, payroll tax, and associated leave benefits) and $5.5 million in interest
and other remediation costs.
As part of the revaluation process conducted in 2020, the University of Sydney identified that the
valuation for commercial buildings included embedded equipment attached to or built within those
commercial buildings. This equipment is recognised at cost less accumulated depreciation
separately to the commercial buildings, resulting in an overstatement of the asset value of
$14.9 million. This error was corrected by restating each of the affected financial statement line
items in the Statement of Financial Position as at 31 December 2019, and opening retained
earnings as at 1 January 2019.
Charles Sturt University reported retrospective correction of a prior period error
Charles Sturt University reported the retrospective correction of a prior period error relating to the
restatement of right-of-use assets and lease liabilities. Right-of-use assets are leased assets that
are recorded by a lessee.
On initial adoption of AASB 16 'Leases' as at 1 January 2019 and at the 31 December 2019
remeasurement date, Charles Sturt University incorrectly recognised right-of-use assets and lease
liabilities for rooms in a student accommodation building that were not yet available for use. The
financial effect as at 1 January 2019 was a reduction of $15.2 million in right-of-use assets and
lease liabilities. This error resulted in a restatement of the 2019 comparative figures, being a
reduction in right-of-use assets by $14.1 million, lease liabilities of $15.3 million and $1.2 million to
the net result for depreciation and interest.
6
NSW Auditor-General's Report to Parliament | Universities 2020 audits | Financial reportingAll university controlled entities' financial statements submitted for audit, where completed,
received unmodified audit opinions
Of the 74 university controlled entities:
• 49 received unmodified audit opinions
• 22 university controlled entities were relieved from PF&A Act reporting requirements
• one did not comply with the PF&A Act as it did not submit financial statements to the
Audit Office (Suzhou Xi Su Business Consulting Co)
• the audits of two entities are still in progress (refer to 'Timeliness of financial reporting'
section).
Suzhou Xi Su Business Consulting Co, an overseas controlled entity of the University of Sydney,
did not submit separate financial statements for audit as required by the PF&A Act. The company
prepares financial statements for local jurisdictional purposes only. The technical non-compliance
was reported in the Statutory Audit Report for the University of Sydney.
Twenty-two university controlled entities were relieved from preparing financial statements
in 2020
The NSW Government introduced special provisions in 2020 as a result of the COVID-19
pandemic which amended the PF&A Act and the Public Finance and Audit Regulation 2015. The
special provisions relieved certain entities from having to prepare financial statements for 2019–20
if all of the following criteria were met:
• The assets, liabilities, income, expenses, commitments and contingent liabilities of the entity
are each less than $5.0 million.
• The total cash or cash equivalents held by the entity is less than $2.5 million.
• At least 95 per cent of the entity’s income is derived from money paid out of the
Consolidated Fund or from money provided by other relevant agencies.
• The entity does not administer legislation for a minister by or under which members of the
public are regulated.
As a result of the special provisions, 22 university controlled entities were relieved from PF&A
reporting requirements in 2020, compared with ten in 2019. The entities relieved in 2019 were
primarily dormant entities. Entities that are exempted from financial reporting obligations are not
audited by the Auditor-General.
Timeliness of financial reporting
Three universities finalised their 2020 audited financial statements earlier than they did last
year
All ten universities and 51 of the 52 university controlled entities that were required to prepare
financial statements for 2020 met the statutory timetable for submitting their financial statements for
audit. As noted above, one controlled entity did not comply with the reporting requirements of the
PF&A Act.
Nine universities and 46 university controlled entities met the statutory timetable for completion of
the 2020 audit. The finalisation of the audit of Charles Sturt University was delayed as the
university withdrew its signed financial statements and reissued them. Of the five controlled entities
that did not meet the statutory timetable:
• one entity controlled by the University of Sydney was completed later than the statutory date
• two entities controlled by Western Sydney University were completed later than the statutory
date
• two entities controlled by the University of Technology Sydney are still in progress.
7
NSW Auditor-General's Report to Parliament | Universities 2020 audits | Financial reportingOur audit opinions on universities' financial statements for 2020 were issued between
26 March 2021 and 16 June 2021. Audit completion dates are presented in the following diagram.
Audit completion dates
Charles Sturt University
Macquarie University
Southern Cross University
University of New England
University of NSW
University of Newcastle
University of Sydney
University of Technology Sydney
University of Wollongong
Western Sydney University
15-Mar
25-Mar
14-May
24-May
13-Jun
23-Jun
4-May
3-Jun
14-Apr
24-Apr
4-Apr
2021 2020
Note: The audits of three universities were completed on the same date in both years. The 2020 audit of Charles Sturt University was delayed because
signed financial statements were withdrawn and reissued by the university.
Source: Independent Auditor's Reports issued by the Audit Office.
A company jointly owned by two universities has not completed its 2019 financial audit
Sydney Education Broadcasting Pty Ltd is a company jointly owned by the University of
Technology Sydney and Macquarie University. It is a prescribed entity and prepares financial
statements for audit by the Auditor-General under sections 44 and 45 of the PF&A Act.
The 2019 financial statements were submitted for audit on 22 July 2020 and the financial audit for
31 December 2019 has not been completed. As a result, the financial statements for 2020 have not
been submitted and the financial audit for 2020 is delayed.
Implementation of new accounting standards
AASB 15 ‘Revenue from Contracts with Customers’ and AASB 1058 'Income of Not-for-Profit
Entities' changed how universities report income
AASB 15 and AASB 1058 became effective for all universities from 1 January 2019. AASB 2019-6
'Amendments to Australian Accounting Standards - Research Grants and Not-for-Profit Entities'
allowed universities to defer the application of these standards in respect of research grant revenue
until 1 January 2020. Three universities - Macquarie University, the University of New England and
the University of New South Wales elected to defer the application of the new standards until 2020.
Because universities implemented AASB 15 in different years in relation to research grant income,
the 2019 financial data for all universities is not directly comparable.
The introduction of AASB 15 and AASB 1058 required universities to reassess the way they
accounted for revenue, depending on whether it arose from contracts for sales of goods and
services, grants and other contributions. With the exception of capital grants, revenue from
contracts for services is now recognised only when performance obligations have been satisfied.
This has tended to delay the point at which universities and their subsidiaries recognise revenue in
their financial statements, particularly in relation to research grant funding tied to specific
deliverables.
8
NSW Auditor-General's Report to Parliament | Universities 2020 audits | Financial reportingUniversities adopted the modified retrospective approach to transition to AASB 15 and AASB 1058.
This method does not require the restatement of prior period financial statement figures. Instead,
the cumulative effect of applying the standards on prior periods is presented as an adjustment to
opening retained earnings at the transition date.
On 1 January 2020, Macquarie University, the University of New England and the University of
New South Wales reclassified $243.7 million from opening retained earnings to contract assets and
contract financial liabilities (deferred revenue) on transition to AASB 15 and AASB 1058.
AASB 1059 ‘Service Concession Arrangements: Grantors' changed the recognition and
measurement of service concession assets
AASB 1059 ‘Service Concession Arrangements: Grantors’ became effective from 1 January 2020
for all universities. AASB 1059 provides guidance for public sector entities (grantors) that enter into
service concession arrangements with private sector operators for the delivery of public services.
An arrangement within the scope of AASB 1059 typically involves a private sector operator
designing, constructing or upgrading assets used to provide public services, and operating and
maintaining those assets for a specified period of time. In return, the private sector operator is
compensated by the public-sector entity.
The University of New South Wales, University of Wollongong and Macquarie University identified
service concession arrangements within the scope of AASB 1059. These service concession
arrangements relate to the design, construction and operation of student accommodation facilities.
On initial application of AASB 1059 these universities recognised service concession assets of
$406.1 million and service concession liabilities of $328.0 million. As a result of the derecognition of
land and finance lease receivables recognised under previous accounting treatments, the net
impact on opening retained earnings was $13.1 million.
2.2 Impacts of COVID-19
The outbreak of the COVID-19 pandemic presented challenges for the university sector in 2020.
International border restrictions reduced enrolments of overseas students. Social distancing and
other infection control measures disrupted the traditional means of teaching students and impacted
other aspects of service delivery such as student accommodation. These challenges and
disruptions also had a consequential impact on the financial results of universities for 2020 with
reduced revenue from overseas students and greater employee related expenses in the form of
staff redundancies.
9
NSW Auditor-General's Report to Parliament | Universities 2020 audits | Financial reportingThe timeline of the COVID-19 outbreak and the impact on the university sector is presented below.
• 31 December – first cases of
December COVID-19 reported by Wuhan
2019 officials
• 31 December – year-end
reporting date for NSW
Universities
• 25 January – first cases of
COVID-19 reported in Australia
(in both Victoria and NSW)
• 30 January – World Health
January 2020
Organisation (WHO) declares the
coronavirus to be a ‘public health
emergency of international
concern’
• 1 February – Australian borders
February 2020 close to foreign arrivals from
• Early March – beginning of mainland China
semester one at NSW
universities
• 1 March – first Australian death
from COVID-19 reported in
Western Australia
• 3 March – first death from
COVID-19 reported in NSW
• 11 March – WHO officially March 2020
declares COVID-19 as a
pandemic
• 20 March – Australian borders
close to all non-residents
• 23 March – NSW Premier
announces new restrictions in
which non-essential activities
and businesses would be
temporarily shutdown
10
NSW Auditor-General's Report to Parliament | Universities 2020 audits | Financial reportingUniversities are responding to the challenges presented by COVID-19
All universities established committees or taskforces of senior executives to oversee and address
all aspects of the impact of COVID-19. These committees are tasked with assessing the evolving
situation and determining their university’s response to it.
Key actions taken by universities in response to the outbreak of COVID-19 include:
• establishing dedicated phone and email channels for staff and student enquiries
• developing alternative course delivery options including on-line delivery of teaching
• updating cleaning protocols with increased frequency and providing information on hygiene
measures
• moving some administration activities to remote delivery and closing some buildings and
facilities
• reconfiguring student accommodation to enable students to quarantine or socially distance,
where necessary
• implementing programs and financial support for support students who are adversely
impacted
• cancelling large non-essential gatherings including graduation ceremonies.
Universities are closely monitoring the financial impact of COVID-19 and the pressure put on
liquidity. Universities have implemented cost saving measures including reducing the casual and
contractor workforce, delaying the hire of new staff, limiting travel, and pausing other discretionary
expenditure. They are also closely monitoring liquidity requirements and have deferred planned
capital expenditures and renegotiated lines of credit.
The impact of COVID-19 is being felt differently at each university
The impact of COVID-19 has exposed the university sector to new financial risks in 2020. However,
the impact is being felt differently at each university.
The travel restrictions on the arrival of international students in 2020 impacted those universities
with a higher dependence on revenue streams from international students. Revenue from overseas
students decreased by $286.6 million (7.9 per cent) across the universities in 2020 compared to
the previous year. The impact on individual universities ranged from a decrease of 26.5 per cent to
an increase of 4.1 per cent. Two universities (University of Sydney and University of New England)
experienced a growth in revenue from overseas students.
The exposure was reduced for some universities that were able to change the delivery of their
offerings to online study and other remote learning programs or were able to attract more domestic
students. Revenue from domestic students (full fee paying) decreased overall by $42.2 million
(14.8 per cent) but increased at four universities.
Student enrolments in 2020 decreased by 3.3 per cent
The total number of students attending universities in NSW in 2020 was 289,667, a decrease of
10,032 students (3.3 per cent) compared to 2019. The graph below shows the movement in the
numbers of equivalent full-time students at each university in 2020.
11
NSW Auditor-General's Report to Parliament | Universities 2020 audits | Financial reportingMovement in EFTSL by university in 2020
Charles Sturt University (3.4%)
Macquarie University (6.4%)
Southern Cross University (3.6%)
University of New England (3.2%)
University of NSW (5.4%)
University of Newcastle 2.8%
University of Sydney (5.0%)
University of Technology Sydney (0.3%)
University of Wollongong (7.7%)
Western Sydney University 0.5%
(4,000) (3,000) (2,000) (1,000) 0 1,000 2,000
EFTSL
Note: Equivalent Full-Time Student Load (EFTSL) represents the equivalent full-time study load for one year. Student numbers do not include
Non-Award, Higher Degree Research or Foundation enrolments.
Source: Student numbers are provided by universities (unaudited).
As noted above, this generally correlated with the decrease in overseas student enrolments and
consequently revenue from overseas students. There were 106,984 overseas students enrolled at
universities in NSW in 2020 compared to 115,294 in 2019, a decline of 8,310 students
(7.2 per cent).
Overseas student enrolments continue to be lower in semester one 2021 at eight
universities, compared to semester one 2020
We collected information about universities' student enrolments for the first semester of 2021 (at
31 March 2021) as an indicator of the likely ongoing impact of COVID-19 on the university sector in
the short-term. The universities' expectation was that travel restrictions would continue to affect
student enrolments.
The disruption is not being felt equally across the sector. Overseas student enrolments in semester
one of 2021 decreased at eight universities, compared to those in semester one of 2020 when the
impacts of the pandemic were first being felt. Overseas enrolments increased at the University of
Sydney and University of New South Wales by 32.5 per cent and 39.2 per cent respectively. The
increases at these two universities contributed to an overall increase in enrolments of overseas
students by 1,536 or 4.3 per cent in semester one of 2021.
12
NSW Auditor-General's Report to Parliament | Universities 2020 audits | Financial reportingThe graph below shows the movement in overseas student enrolments in semester one 2021 by
university.
Change in overseas student enrolments in semester one of 2021
compared to semester one of 2020 by university
Charles Sturt University (42.7%)
Macquarie University (10.9%)
Southern Cross University (15.6%)
University of New England (45.7%)
University of NSW 39.2%
University of Newcastle (10.4%)
University of Sydney 32.5%
University of Technology Sydney (24.8%)
University of Wollongong (12.0%)
Western Sydney University (5.1%)
(2,000) (1,000) 0 1,000 2,000 3,000 4,000
EFTSL
Source: Student enrolments are provided by universities (unaudited).
In 2020, the University of New South Wales and University of Sydney established fast network
access capabilities to support overseas students in China study online and remotely, which has
allowed students to continue enrolments.
Over time, our audits will note whether the shift to remote learning for foreign students is sustained.
Domestic student enrolments increased in semester one 2021 compared to semester one
2020
Domestic student enrolments in semester one 2021 increased at all universities, compared to
semester one 2020 enrolments. The increases ranged from 0.9 per cent to 13.7 per cent. In 2021,
the Australian Government introduced the Job-Ready Graduates Package which provided
additional funding for higher education short courses in national priority areas.
13
NSW Auditor-General's Report to Parliament | Universities 2020 audits | Financial reportingThe graph below shows the movement in domestic student enrolments in semester one 2021 by
university.
Change in domestic student enrolments in semester one 2021 by
university
Charles Sturt University 5.1%
Macquarie University 13.7%
Southern Cross University 8.9%
University of New England 1.9%
University of NSW 10.0%
University of Newcastle 5.5%
University of Sydney 8.2%
University of Technology Sydney 0.9%
University of Wollongong 10.0%
Western Sydney University 4.3%
0 500 1,000 1,500 2,000
EFTSL
Source: Student enrolments are provided by universities (unaudited).
Only the University of Sydney and the University of New South Wales increased their student
enrolments for both domestic and overseas students in semester one of 2021. For other
universities, the increase in domestic students has, at least to some extent, offset the reduction in
overseas student numbers.
Universities have provided welfare support to students affected due to COVID-19
Many international students were in New South Wales when travel restrictions were introduced
in March 2020. Universities identified this group as particularly vulnerable following the outbreak of
COVID-19 as they were young, culturally and linguistically diverse, and without secure family
support. As temporary visa holders, they were ineligible for various welfare support packages
offered by the Australian Government. The economic shutdown caused by COVID-19 also
impacted the circumstances of many domestic students.
The universities collectively introduced student welfare support instruments for students, which
included:
• developing dedicated COVID-19 communication portals for mental health and wellbeing
• creating student hardship funds to provide hardship relief and emergency financial support to
assist with basic living expenses, costs associated with unexpectedly studying online and
other expenses
• providing accommodation and other domestic support for students including those needing
safe accommodation for self-isolating
• providing flexibility on the payment of course fees and waiving fees for courses failed in 2020
• providing academic flexibility including allowing students to retake courses without academic
penalty and allowing students to enrol in courses without pre-requisites to enable
progression.
14
NSW Auditor-General's Report to Parliament | Universities 2020 audits | Financial reportingSome universities' controlled entities were eligible to receive JobKeeper payments
The Australian Government introduced the JobKeeper Payment scheme as a subsidy for
businesses significantly affected by COVID-19. All universities failed the turnover tests to be
eligible for JobKeeper payments. However, some university controlled entities were eligible for
payments under the scheme. The combined amount paid to controlled entities of universities under
the JobKeeper Payment scheme totalled over $47.6 million in 2020.
The table below shows the amount of JobKeeper payments received by university controlled
entities, grouped by the parent university.
JobKeeper payments received by university group in 2020
Charles Sturt University
Macquarie University
Southern Cross University
University of New England
University of NSW
University of Newcastle
University of Sydney
University of Technology Sydney
University of Wollongong
Western Sydney University
0 5 10 15
$m
Source: University controlled entities' financial statements (audited).
The Australian Government announced a Higher Education Relief Package
On 12 April 2020, the Australian Government announced a Higher Education Relief Package
intended to help Australian universities and other tertiary education providers respond to the
challenges presented by COVID-19.
Under the package, the Australian Government committed to maintain the Commonwealth Grant
Scheme (CGS) and the Higher Education Loan Program (HELP) funding streams for higher
education providers at agreed amounts for the rest of 2020, even if domestic student numbers fell.
Ordinarily, the amount of funding provided would be revised throughout the year based on
variations to enrolments. Also, the performance-based funding amounts introduced in 2020 were
guaranteed for the current year.
The package also aimed to subsidise the cost of short on-line courses to help Australians retrain.
The courses, targeting priority areas including nursing, teaching, health, IT and science, started at
the beginning of May 2020 with successful completion by December 2020.
For domestic students, the Australian Government announced a six-month exemption from the
loan fees associated with FEE-HELP and Vocational Fee and Training (VET) student loans in the
sector to encourage full-fee paying students to continue their studies.
These measures are expected to contribute $100 million to the Australian university sector.
15
NSW Auditor-General's Report to Parliament | Universities 2020 audits | Financial reportingThe NSW Government launched a University Loan Guarantee Scheme
On 6 June 2020, the NSW Government announced that it would guarantee up to $750 million in
commercial loans to help universities recover from the impact of COVID-19. The loans are
conditional on universities demonstrating how they are making their operations more sustainable.
Three universities have reported engaging with the Loan Guarantee Scheme in 2020. Two
universities withdrew from the process as agreement could not be achieved on terms and
conditions or preferred financiers. One university has applied for the Loan Guarantee Scheme and
is currently in negotiations with NSW Treasury on the loan amount and other terms and conditions.
New research funding for universities is expected from January 2021
As part of the 2020–21 Budget handed down on 6 October 2020, the Australian Government
announced an additional $1.0 billion in research funding to alleviate the financial pressure on
Australian universities caused by the COVID-19 pandemic. The funding will be delivered through
the Research Support Program (RSP) from January 2021, taking total RSP funding for 2021 to
$3.0 billion.
The RSP provides block grants, on a calendar year basis, to higher education providers to support
the systemic costs of research not supported directly through competitive and other grants, such as
libraries, laboratories, consumables, computing centres and the salaries of support and technical
staff.
2.3 Financial performance
Financial results
The graph below shows the net results of individual universities for 2020.
Net results by university for 2020
Charles Sturt University 19.5
Macquarie University (51.4)
Southern Cross University (2.6)
University of New England (16.3)
University of NSW (7.5)
University of Newcastle 7.5
University of Sydney 109
University of Technology Sydney (50.6)
University of Wollongong (48.8)
Western Sydney University 22.0
(70) (40) (10) 20 50 80 110
$m
Note 1: The figures used relate to the continuing operations in the consolidated financial statements of each university, which includes their controlled
entities.
Source: University financial statements (audited).
Six universities recorded negative net operating results in 2020 (two in 2019).
16
NSW Auditor-General's Report to Parliament | Universities 2020 audits | Financial reportingThe graph below presents the revenue and expenditure for each university in 2020.
Revenue and expenditure by university in 2020
Charles Sturt University
Macquarie University
Southern Cross University
University of New England
University of NSW
University of Newcastle
University of Sydney
University of Technology Sydney
University of Wollongong
Western Sydney University
0 500 1,000 1,500 2,000 2,500 3,000
$m
Revenue Expenditure
Note 1: The figures used relate to the consolidated financial statements of each university, which includes their controlled entities.
Source: University financial statements (audited).
The movement in revenue and expenditure for both individual universities and for the sector is
analysed later in this report.
Revenue from operations
A snapshot of the universities' revenue for the year ended 31 December 2020 is shown below.
Combined revenue of universities in NSW in 2020
Investment income
$1.1 billion
Other revenue
$0.3 billion
Fees and charges
Total combined
$5.8 billion
revenue
$10.9 billion
Government grants
$3.7 billion
Note 1: The figures used relate to the consolidated financial statements of each university, which includes their controlled entities.
Note 2: Government grants do not include Higher Education Loan Programs, such as the Higher Education Contribution Scheme (HECS), which are
included in revenue from domestic students.
Source: University financial statements (audited).
17
NSW Auditor-General's Report to Parliament | Universities 2020 audits | Financial reportingCombined revenue of universities in 2020 compared to recent years
13
12 4%
2% 3% Investment
11 income
32%
11%
10 3% 12% 10%
11%
9
10%
8 31%
Other revenue
33% 34%
7 34%
$bn 37%
6
5 Government
4 grants
3 54% 54% 53%
52%
50%
2
Fees and
1 charges
0
2016 2017 2018 2019 2020
Note 1: Figures relate to the consolidated financial statements of each university, which include their controlled entities.
Note 2: Government grants do not include Higher Education Loan Programs, such as HECS, which are included in fees and charges.
Source: University financial statements (audited).
Combined revenue for universities totalled $10.9 billion in 2020. This is a decrease of
$538.5 million (4.7 per cent) from 2019.
Universities' revenue streams were impacted in 2020 by the COVID-19 pandemic
The graph below presents the aggregated revenue streams for all universities in NSW from 2016 to
2020.
Universities' combined revenue streams
7
6
5
4
$bn
3
2
1
0
2016 2017 2018 2019 2020
Fees and charges Government grants Other revenue Investment income
Note 1: The figures used relate to the consolidated financial statements of each university, which includes their controlled entities.
Note 2: Government grants do not include Higher Education Loan Programs, such as the Higher Education Contribution Scheme (HECS), which are
included in fees and charges.
Source: University financial statements (audited).
18
NSW Auditor-General's Report to Parliament | Universities 2020 audits | Financial reportingThe revenue stream recording the overall strongest growth for all universities between 2016 and
2019 was fees and charges. Fees and charges revenue increased by $1.5 billion in the four years
between 2016 and 2019. This revenue stream recorded the biggest decline in 2020, decreasing by
$361.0 million (5.8 per cent).
The other revenue and investment income streams also recorded declines in 2020, decreasing by
$125.0 million (10.2 per cent) and $201.8 million (42.4 per cent) respectively.
The only revenue stream to record an increase in 2020 was government grants revenue, which
increased by $149.5 million (4.2 per cent).
Government grants as a proportion of total revenue increased for the first time in five years
In previous years, various higher education reforms have been proposed by the Australian
Government to manage the cost of tertiary education and to reduce the reliance of universities on
government grants. Prior to the onset of the COVID-19 pandemic, combined government grants as
a proportion of the total revenue of universities in NSW had been steadily reducing, from
37.1 per cent in 2016 to 31.1 per cent in 2019. This was despite an increase in combined
government grants revenue by $61.0 million over the same period.
Combined government grants revenue increased by $149.5 million in 2020 to total $3.7 billion
($3.6 billion in 2019). Combined fees and charges revenue received by universities reduced in
2020 by $360.8 million to $5.8 billion ($6.2 billion in 2019). As a consequence, the proportion of
government grants to total revenue of universities increased for the first time in five years to
34.0 per cent in 2020 (31.1 per cent in 2019).
The following graph shows major revenue streams by universities for 2020.
Components of total revenue by universities in 2020
Charles Sturt University 44% 50% 3% 4%
Macquarie University 26% 51% 21% 1%
Southern Cross University 36% 55% 8% 1%
University of New England 46% 42% 10% 2%
University of NSW 39% 52% 7% 2%
University of Newcastle 44% 42% 10% 4%
University of Sydney 27% 57% 12% 4%
University of Technology Sydney 27% 65% 7% 1%
University of Wollongong 34% 57% 7% 2%
Western Sydney University 40% 50% 8% 2%
0% 20% 40% 60% 80% 100%
Government grants Fees and charges
Other revenue Investment income
Note 1: The figures used relate to the consolidated financial statements of each university, which includes their controlled entities.
Note 2: Government grants do not include Higher Education Loan Programs, such as HECS, which are included in fees and charges.
Source: University financial statements (audited).
In 2020, three universities (two in 2019) received more than 40 per cent of their total revenue from
government grants.
19
NSW Auditor-General's Report to Parliament | Universities 2020 audits | Financial reportingIn the current year, the change in revenue from government grants at individual universities varied
from a decrease of 7.4 per cent to an increase of 19.4 per cent. The graph below shows
government grants received at individual universities in 2020 with the percentage change from
2019.
Government grants by university in 2020 (change from 2019)
Charles Sturt University +19.4%
Macquarie University +3.9%
Southern Cross University -7.4%
University of New England +0.8%
University of NSW +6.1%
University of Newcastle +1.7%
University of Sydney -0.5%
University of Technology Sydney +9.6%
University of Wollongong +3.9%
Western Sydney University +4.4%
0 200,000 400,000 600,000 800,000 1,000,000
Government grants Change since 2019
Source: University financial statements (audited).
Lower overseas student enrolments drove the overall decrease in revenue from fees and
charges
Universities' overseas and domestic student course fees and charges revenue for 2016 to 2020 is
presented in the following graph.
Universities' overseas and domestic student course fees and charges
revenue
4.0
3.5
3.0
$bn 2.5
2.0
1.5
1.0
2016 2017 2018 2019 2020
At 31 December
Domestic students Overseas students
Note 1: The figures used relate to the consolidated financial statements of each university, which includes their controlled entities.
Note 2: Revenue from domestic students includes amounts from Higher Education Loan Programs, such as HECS and excludes non-course fees and
charges.
Source: University financial statements (audited).
20
NSW Auditor-General's Report to Parliament | Universities 2020 audits | Financial reportingFees and charges revenue from overseas students increased by $1.3 billion in the four years
between 2016 and 2019. Fees and charges revenue from domestic students only increased by
$156.1 million over this same period.
In 2020, fees and charges revenue from overseas students declined by $286.6 million
(7.9 per cent) compared to 2019. As noted earlier in Section 2.2 of this report, this decrease was
driven by a fall in overseas students studying at universities in NSW, from 115,294 students in
2019 to 106,984 students in 2020.
Fees and charges revenue from domestic students increased by $45.1 million in 2020 to total
$2.2 billion despite a decrease in the number of domestic students by 0.9 per cent. There were
182,683 domestic students enrolled at universities in NSW in 2020 compared to 184,405 in 2019, a
fall of 1,722 students. The increase was due to higher course fee rates.
The graph below shows individual universities' revenue in 2020 from overseas and domestic
students. Income from overseas students exceeds that from domestic students at two universities
(three in 2019). These were the University of New South Wales and the University of Sydney.
Revenue from overseas and domestic students including government
grants for each university in 2020
Charles Sturt University
Macquarie University
Southern Cross University
University of New England
University of NSW
University of Newcastle
University of Sydney
University of Technology Sydney
University of Wollongong
Western Sydney University
0 200 400 600 800 1,000 1,200
$m
Domestic – student revenue Domestic – government grants
Overseas
Note 1: The figures used relate to the consolidated financial statements of each university, which includes their controlled entities.
Note 2: Revenue from domestic students includes amounts from Higher Education Loan Programs, such as HECS. Government grants for domestic
students represents the CGS funding for Commonwealth Supported Places.
Source: University financial statements (audited).
Nearly 40 per cent of universities' total revenue from course fees in 2020 came from
overseas students from three countries
In 2020, overseas students contributed $3.1 billion in course fees to universities in NSW. Students
from the top three countries of origin contributed $2.2 billion in fees ($2.4 billion in 2019), which
closely approximates the universities' total revenue from domestic students for 2020. These
countries were China, India and Nepal (same in 2019). Revenue from students from these
countries comprised 39.8 per cent (40.9 per cent in 2019) of total student revenues for all
universities and 71.8 per cent of total overseas student revenues in 2020.
As we have reported previously, the universities that are most dependent on revenue from students
from these three countries are at risk from unexpected shifts in demand. Demand for education can
change rapidly due to changes in the geo-political or geo-economic landscape, or from restrictions
over visas or travel. The consequence of the reliance on students from particular countries was
realised as travel restrictions were implemented following the outbreak of COVID-19 in early 2020.
21
NSW Auditor-General's Report to Parliament | Universities 2020 audits | Financial reportingThe graph below shows universities' revenue in 2020 from overseas and domestic student fees.
Universities' revenue from student course fees in 2020
Overseas students
(other)
16%
$0.9 billion Domestic students
44%
$2.5 billion
Overseas students
(top 3 countries)
40%
$2.2 billion
Note 1: The figures used for revenue relate to students enrolled in bachelor or higher degrees at the parent university.
Note 2: Revenue from domestic students includes amounts from Higher Education Loan Programs, such as HECS but excludes non-course fees and
charges.
Source: Total revenue from domestic and overseas students was sourced from university financial statements (audited). Revenue from students by
country of origin was provided by universities (unaudited).
The countries of origin of overseas students enrolled at universities in NSW are set out below. All
universities continue to market their educational products in international markets, focusing on
countries in Asia. While the countries of origin of overseas students have diversified, a
concentration risk remains. Over 42 per cent of all overseas students attending universities in NSW
come from one country (China), but not all universities are dependent on students from China.
Enrolments of students from India and Nepal had increased in the four years up to 2019, although
2020 saw a decrease.
22
NSW Auditor-General's Report to Parliament | Universities 2020 audits | Financial reportingUniversities' overseas student enrolments by country of origin
180
160 Others
140 27.6%
28.6%
Enrolments ('000s)
120 29.6%
Nepal
32.9% 14.7%
100 14.6%
13.4%
36.2%
80 11.6% 15.5%
13.9%
14.3%
India
60 9.2% 12.5%
11.7%
40
42.6% 42.2% 42.8%
43.0%
20 42.9% China
0
2016 2017 2018 2019 2020
Year ended 31 December
Source: Australian Department of Education and Training, international student data (provided by the Australian Trade and Investment Commission).
The highest proportion of overseas student revenue sourced from a single country at individual
universities ranged from 23 to 77 per cent (2019: 24 per cent to 75 per cent). The graph below
illustrates the relative reliance of each university on a single country for their overseas student
revenue.
Highest proportion of overseas student revenue from a single country of
origin at each university in 2020 (with change since 2019)
Charles Sturt University India -3%
Macquarie University China -7%
Southern Cross University India -14%
University of New England Nepal -1%
University of NSW China -3%
University of Newcastle China 0%
University of Sydney China +3%
University of Technology Sydney China +2%
University of Wollongong India -1%
Western Sydney University India -1%
0% 20% 40% 60% 80% 100%
Top country 2020 Change since 2019
Note: The figures used for revenue relate to students enrolled in bachelor or higher degrees at the parent university. The percentage has been
calculated based on the university parent total overseas student revenue.
Source: Provided by universities (unaudited).
23
NSW Auditor-General's Report to Parliament | Universities 2020 audits | Financial reportingOther revenues
Overall philanthropic contributions to universities increased in 2020
Universities and many of their controlled entities are charities and are registered as deductible gift
recipients for taxation purposes. They can attract significant donations and bequests from public,
private and corporate philanthropists. Some bequests received are tied to specific research
activities and under the terms of the bequest, cannot be used for other purposes.
Despite the COVID-19 pandemic, philanthropic contributions to universities increased by
32.2 per cent from $167.9 million in 2019 to $222.0 million in 2020. Philanthropic contributions
increased at eight universities in 2020. Two universities, being Charles Sturt University and
Macquarie University, did not attract the level of donations that they received in 2019.
The University of Sydney and the University of New South Wales attracted 75.2 per cent of the
total philanthropic contributions to the universities in 2020 (69.5 per cent in 2019). The newer,
smaller and non-metropolitan universities have been least able to attract donations.
The graph below presents the donations revenue received by each of the universities in 2020.
Philanthropic revenue for each university in 2020
(with change since 2019)
Charles Sturt University -53.7%
Macquarie University -29.1%
Southern Cross University +15.8%
University of New England +232.4%
University of NSW +16.3%
University of Newcastle +74.2%
University of Sydney +46.4%
University of Technology Sydney +59.4%
University of Wollongong +15.5%
Western Sydney University +63.5%
0 20 40 60 80 100 120
$m
2020 Change since 2019
Note: The figures used relate to the consolidated financial statements of each university, which includes their controlled entities.
Source: University financial statements (audited).
Total research income for universities was $1.4 billion in 2019
Universities' total research income increased by $323 million (30.8 per cent) in the five years
between 2014 and 2019 from $1.0 billion to $1.4 billion, almost half attributed to increased industry
and other funding (non-government) of $155.6 million. Research income statistics for 2020 will be
available from the Australian Department of Education and Training after July 2021.
24
NSW Auditor-General's Report to Parliament | Universities 2020 audits | Financial reportingTwo universities attracted 66.5 per cent of the total research income of all universities
(65.2 per cent in 2018) as shown in the graph below.
Research income for each university in 2019 (with change since 2018)
Charles Sturt University -25%
Macquarie University +22%
Southern Cross University +7%
University of New England +12%
University of NSW +15%
University of Newcastle +4%
University of Sydney +15%
University of Technology Sydney +13%
University of Wollongong +0%
Western Sydney University +14%
0 100 200 300 400 500
$m
2019 Change since 2018
Note: Due to three universities (Macquarie University, University of New England, and University of New South Wales) deferring the application of new
Accounting Standards to research grants, the data may not be comparable across all universities.
Source: Australian Department of Education and Training statistics on Higher Education Research Income (audited).
Expenditure
A snapshot of combined expenditure at universities in NSW for the year ended 31 December 2020
is shown below.
Combined expenditure at universities in 2020
Other
$2.8 billion
Scholarships and Total combined
grants expenditure
$0.6 billion Employee related
$11.0 billion expenses
$6.5 billion
Depreciation and
amortisation
$1.0 billion
Note 1: The figures used relate to the consolidated financial statements of each university, which includes their controlled entities.
Source: University financial statements (audited).
25
NSW Auditor-General's Report to Parliament | Universities 2020 audits | Financial reportingYou can also read